Page, Arizona Submit your own pictures of this city and show them to the world
OSM Map
General Map
Google Map
MSN Map
OSM Map
General Map
Google Map
MSN Map
OSM Map
General Map
Google Map
MSN Map
OSM Map
General Map
Google Map
MSN Map
Please wait while loading the map...
Population in 2022: 7,357 (91% urban, 9% rural). Population change since 2000: +8.0%Males: 3,832 Females: 3,525
March 2022 cost of living index in Page: 95.5 (near average, U.S. average is 100) Percentage of residents living in poverty in 2022: 12.3%for White Non-Hispanic residents , 50.9% for Hispanic or Latino residents , 7.4% for American Indian residents , 1.5% for other race residents , 67.4% for two or more races residents )
Profiles of local businesses
Business Search - 14 Million verified businesses
Data:
Median household income ($)
Median household income (% change since 2000)
Household income diversity
Ratio of average income to average house value (%)
Ratio of average income to average rent
Median household income ($) - White
Median household income ($) - Black or African American
Median household income ($) - Asian
Median household income ($) - Hispanic or Latino
Median household income ($) - American Indian and Alaska Native
Median household income ($) - Multirace
Median household income ($) - Other Race
Median household income for houses/condos with a mortgage ($)
Median household income for apartments without a mortgage ($)
Races - White alone (%)
Races - White alone (% change since 2000)
Races - Black alone (%)
Races - Black alone (% change since 2000)
Races - American Indian alone (%)
Races - American Indian alone (% change since 2000)
Races - Asian alone (%)
Races - Asian alone (% change since 2000)
Races - Hispanic (%)
Races - Hispanic (% change since 2000)
Races - Native Hawaiian and Other Pacific Islander alone (%)
Races - Native Hawaiian and Other Pacific Islander alone (% change since 2000)
Races - Two or more races (%)
Races - Two or more races (% change since 2000)
Races - Other race alone (%)
Races - Other race alone (% change since 2000)
Racial diversity
Unemployment (%)
Unemployment (% change since 2000)
Unemployment (%) - White
Unemployment (%) - Black or African American
Unemployment (%) - Asian
Unemployment (%) - Hispanic or Latino
Unemployment (%) - American Indian and Alaska Native
Unemployment (%) - Multirace
Unemployment (%) - Other Race
Population density (people per square mile)
Population - Males (%)
Population - Females (%)
Population - Males (%) - White
Population - Males (%) - Black or African American
Population - Males (%) - Asian
Population - Males (%) - Hispanic or Latino
Population - Males (%) - American Indian and Alaska Native
Population - Males (%) - Multirace
Population - Males (%) - Other Race
Population - Females (%) - White
Population - Females (%) - Black or African American
Population - Females (%) - Asian
Population - Females (%) - Hispanic or Latino
Population - Females (%) - American Indian and Alaska Native
Population - Females (%) - Multirace
Population - Females (%) - Other Race
Coronavirus confirmed cases (Apr 28, 2024)
Deaths caused by coronavirus (Apr 28, 2024)
Coronavirus confirmed cases (per 100k population) (Apr 28, 2024)
Deaths caused by coronavirus (per 100k population) (Apr 28, 2024)
Daily increase in number of cases (Apr 28, 2024)
Weekly increase in number of cases (Apr 28, 2024)
Cases doubled (in days) (Apr 28, 2024)
Hospitalized patients (Apr 18, 2022)
Negative test results (Apr 18, 2022)
Total test results (Apr 18, 2022)
COVID Vaccine doses distributed (per 100k population) (Sep 19, 2023)
COVID Vaccine doses administered (per 100k population) (Sep 19, 2023)
COVID Vaccine doses distributed (Sep 19, 2023)
COVID Vaccine doses administered (Sep 19, 2023)
Likely homosexual households (%)
Likely homosexual households (% change since 2000)
Likely homosexual households - Lesbian couples (%)
Likely homosexual households - Lesbian couples (% change since 2000)
Likely homosexual households - Gay men (%)
Likely homosexual households - Gay men (% change since 2000)
Cost of living index
Median gross rent ($)
Median contract rent ($)
Median monthly housing costs ($)
Median house or condo value ($)
Median house or condo value ($ change since 2000)
Mean house or condo value by units in structure - 1, detached ($)
Mean house or condo value by units in structure - 1, attached ($)
Mean house or condo value by units in structure - 2 ($)
Mean house or condo value by units in structure by units in structure - 3 or 4 ($)
Mean house or condo value by units in structure - 5 or more ($)
Mean house or condo value by units in structure - Boat, RV, van, etc. ($)
Mean house or condo value by units in structure - Mobile home ($)
Median house or condo value ($) - White
Median house or condo value ($) - Black or African American
Median house or condo value ($) - Asian
Median house or condo value ($) - Hispanic or Latino
Median house or condo value ($) - American Indian and Alaska Native
Median house or condo value ($) - Multirace
Median house or condo value ($) - Other Race
Median resident age
Resident age diversity
Median resident age - Males
Median resident age - Females
Median resident age - White
Median resident age - Black or African American
Median resident age - Asian
Median resident age - Hispanic or Latino
Median resident age - American Indian and Alaska Native
Median resident age - Multirace
Median resident age - Other Race
Median resident age - Males - White
Median resident age - Males - Black or African American
Median resident age - Males - Asian
Median resident age - Males - Hispanic or Latino
Median resident age - Males - American Indian and Alaska Native
Median resident age - Males - Multirace
Median resident age - Males - Other Race
Median resident age - Females - White
Median resident age - Females - Black or African American
Median resident age - Females - Asian
Median resident age - Females - Hispanic or Latino
Median resident age - Females - American Indian and Alaska Native
Median resident age - Females - Multirace
Median resident age - Females - Other Race
Commute - mean travel time to work (minutes)
Travel time to work - Less than 5 minutes (%)
Travel time to work - Less than 5 minutes (% change since 2000)
Travel time to work - 5 to 9 minutes (%)
Travel time to work - 5 to 9 minutes (% change since 2000)
Travel time to work - 10 to 19 minutes (%)
Travel time to work - 10 to 19 minutes (% change since 2000)
Travel time to work - 20 to 29 minutes (%)
Travel time to work - 20 to 29 minutes (% change since 2000)
Travel time to work - 30 to 39 minutes (%)
Travel time to work - 30 to 39 minutes (% change since 2000)
Travel time to work - 40 to 59 minutes (%)
Travel time to work - 40 to 59 minutes (% change since 2000)
Travel time to work - 60 to 89 minutes (%)
Travel time to work - 60 to 89 minutes (% change since 2000)
Travel time to work - 90 or more minutes (%)
Travel time to work - 90 or more minutes (% change since 2000)
Marital status - Never married (%)
Marital status - Now married (%)
Marital status - Separated (%)
Marital status - Widowed (%)
Marital status - Divorced (%)
Median family income ($)
Median family income (% change since 2000)
Median non-family income ($)
Median non-family income (% change since 2000)
Median per capita income ($)
Median per capita income (% change since 2000)
Median family income ($) - White
Median family income ($) - Black or African American
Median family income ($) - Asian
Median family income ($) - Hispanic or Latino
Median family income ($) - American Indian and Alaska Native
Median family income ($) - Multirace
Median family income ($) - Other Race
Median year house/condo built
Median year apartment built
Year house built - Built 2005 or later (%)
Year house built - Built 2000 to 2004 (%)
Year house built - Built 1990 to 1999 (%)
Year house built - Built 1980 to 1989 (%)
Year house built - Built 1970 to 1979 (%)
Year house built - Built 1960 to 1969 (%)
Year house built - Built 1950 to 1959 (%)
Year house built - Built 1940 to 1949 (%)
Year house built - Built 1939 or earlier (%)
Average household size
Household density (households per square mile)
Average household size - White
Average household size - Black or African American
Average household size - Asian
Average household size - Hispanic or Latino
Average household size - American Indian and Alaska Native
Average household size - Multirace
Average household size - Other Race
Occupied housing units (%)
Vacant housing units (%)
Owner occupied housing units (%)
Renter occupied housing units (%)
Vacancy status - For rent (%)
Vacancy status - For sale only (%)
Vacancy status - Rented or sold, not occupied (%)
Vacancy status - For seasonal, recreational, or occasional use (%)
Vacancy status - For migrant workers (%)
Vacancy status - Other vacant (%)
Residents with income below the poverty level (%)
Residents with income below 50% of the poverty level (%)
Children below poverty level (%)
Poor families by family type - Married-couple family (%)
Poor families by family type - Male, no wife present (%)
Poor families by family type - Female, no husband present (%)
Poverty status for native-born residents (%)
Poverty status for foreign-born residents (%)
Poverty among high school graduates not in families (%)
Poverty among people who did not graduate high school not in families (%)
Residents with income below the poverty level (%) - White
Residents with income below the poverty level (%) - Black or African American
Residents with income below the poverty level (%) - Asian
Residents with income below the poverty level (%) - Hispanic or Latino
Residents with income below the poverty level (%) - American Indian and Alaska Native
Residents with income below the poverty level (%) - Multirace
Residents with income below the poverty level (%) - Other Race
Air pollution - Air Quality Index (AQI)
Air pollution - CO
Air pollution - NO2
Air pollution - SO2
Air pollution - Ozone
Air pollution - PM10
Air pollution - PM25
Air pollution - Pb
Crime - Murders per 100,000 population
Crime - Rapes per 100,000 population
Crime - Robberies per 100,000 population
Crime - Assaults per 100,000 population
Crime - Burglaries per 100,000 population
Crime - Thefts per 100,000 population
Crime - Auto thefts per 100,000 population
Crime - Arson per 100,000 population
Crime - City-data.com crime index
Crime - Violent crime index
Crime - Property crime index
Crime - Murders per 100,000 population (5 year average)
Crime - Rapes per 100,000 population (5 year average)
Crime - Robberies per 100,000 population (5 year average)
Crime - Assaults per 100,000 population (5 year average)
Crime - Burglaries per 100,000 population (5 year average)
Crime - Thefts per 100,000 population (5 year average)
Crime - Auto thefts per 100,000 population (5 year average)
Crime - Arson per 100,000 population (5 year average)
Crime - City-data.com crime index (5 year average)
Crime - Violent crime index (5 year average)
Crime - Property crime index (5 year average)
1996 Presidential Elections Results (%) - Democratic Party (Clinton)
1996 Presidential Elections Results (%) - Republican Party (Dole)
1996 Presidential Elections Results (%) - Other
2000 Presidential Elections Results (%) - Democratic Party (Gore)
2000 Presidential Elections Results (%) - Republican Party (Bush)
2000 Presidential Elections Results (%) - Other
2004 Presidential Elections Results (%) - Democratic Party (Kerry)
2004 Presidential Elections Results (%) - Republican Party (Bush)
2004 Presidential Elections Results (%) - Other
2008 Presidential Elections Results (%) - Democratic Party (Obama)
2008 Presidential Elections Results (%) - Republican Party (McCain)
2008 Presidential Elections Results (%) - Other
2012 Presidential Elections Results (%) - Democratic Party (Obama)
2012 Presidential Elections Results (%) - Republican Party (Romney)
2012 Presidential Elections Results (%) - Other
2016 Presidential Elections Results (%) - Democratic Party (Clinton)
2016 Presidential Elections Results (%) - Republican Party (Trump)
2016 Presidential Elections Results (%) - Other
2020 Presidential Elections Results (%) - Democratic Party (Biden)
2020 Presidential Elections Results (%) - Republican Party (Trump)
2020 Presidential Elections Results (%) - Other
Ancestries Reported - Arab (%)
Ancestries Reported - Czech (%)
Ancestries Reported - Danish (%)
Ancestries Reported - Dutch (%)
Ancestries Reported - English (%)
Ancestries Reported - French (%)
Ancestries Reported - French Canadian (%)
Ancestries Reported - German (%)
Ancestries Reported - Greek (%)
Ancestries Reported - Hungarian (%)
Ancestries Reported - Irish (%)
Ancestries Reported - Italian (%)
Ancestries Reported - Lithuanian (%)
Ancestries Reported - Norwegian (%)
Ancestries Reported - Polish (%)
Ancestries Reported - Portuguese (%)
Ancestries Reported - Russian (%)
Ancestries Reported - Scotch-Irish (%)
Ancestries Reported - Scottish (%)
Ancestries Reported - Slovak (%)
Ancestries Reported - Subsaharan African (%)
Ancestries Reported - Swedish (%)
Ancestries Reported - Swiss (%)
Ancestries Reported - Ukrainian (%)
Ancestries Reported - United States (%)
Ancestries Reported - Welsh (%)
Ancestries Reported - West Indian (%)
Ancestries Reported - Other (%)
Educational Attainment - No schooling completed (%)
Educational Attainment - Less than high school (%)
Educational Attainment - High school or equivalent (%)
Educational Attainment - Less than 1 year of college (%)
Educational Attainment - 1 or more years of college (%)
Educational Attainment - Associate degree (%)
Educational Attainment - Bachelor's degree (%)
Educational Attainment - Master's degree (%)
Educational Attainment - Professional school degree (%)
Educational Attainment - Doctorate degree (%)
School Enrollment - Nursery, preschool (%)
School Enrollment - Kindergarten (%)
School Enrollment - Grade 1 to 4 (%)
School Enrollment - Grade 5 to 8 (%)
School Enrollment - Grade 9 to 12 (%)
School Enrollment - College undergrad (%)
School Enrollment - Graduate or professional (%)
School Enrollment - Not enrolled in school (%)
School enrollment - Public schools (%)
School enrollment - Private schools (%)
School enrollment - Not enrolled (%)
Median number of rooms in houses and condos
Median number of rooms in apartments
Housing units lacking complete plumbing facilities (%)
Housing units lacking complete kitchen facilities (%)
Density of houses
Urban houses (%)
Rural houses (%)
Households with people 60 years and over (%)
Households with people 65 years and over (%)
Households with people 75 years and over (%)
Households with one or more nonrelatives (%)
Households with no nonrelatives (%)
Population in households (%)
Family households (%)
Nonfamily households (%)
Population in families (%)
Family households with own children (%)
Median number of bedrooms in owner occupied houses
Mean number of bedrooms in owner occupied houses
Median number of bedrooms in renter occupied houses
Mean number of bedrooms in renter occupied houses
Median number of vehichles in owner occupied houses
Mean number of vehichles in owner occupied houses
Median number of vehichles in renter occupied houses
Mean number of vehichles in renter occupied houses
Mortgage status - with mortgage (%)
Mortgage status - with second mortgage (%)
Mortgage status - with home equity loan (%)
Mortgage status - with both second mortgage and home equity loan (%)
Mortgage status - without a mortgage (%)
Average family size
Average family size - White
Average family size - Black or African American
Average family size - Asian
Average family size - Hispanic or Latino
Average family size - American Indian and Alaska Native
Average family size - Multirace
Average family size - Other Race
Geographical mobility - Same house 1 year ago (%)
Geographical mobility - Moved within same county (%)
Geographical mobility - Moved from different county within same state (%)
Geographical mobility - Moved from different state (%)
Geographical mobility - Moved from abroad (%)
Place of birth - Born in state of residence (%)
Place of birth - Born in other state (%)
Place of birth - Native, outside of US (%)
Place of birth - Foreign born (%)
Housing units in structures - 1, detached (%)
Housing units in structures - 1, attached (%)
Housing units in structures - 2 (%)
Housing units in structures - 3 or 4 (%)
Housing units in structures - 5 to 9 (%)
Housing units in structures - 10 to 19 (%)
Housing units in structures - 20 to 49 (%)
Housing units in structures - 50 or more (%)
Housing units in structures - Mobile home (%)
Housing units in structures - Boat, RV, van, etc. (%)
House/condo owner moved in on average (years ago)
Renter moved in on average (years ago)
Year householder moved into unit - Moved in 1999 to March 2000 (%)
Year householder moved into unit - Moved in 1995 to 1998 (%)
Year householder moved into unit - Moved in 1990 to 1994 (%)
Year householder moved into unit - Moved in 1980 to 1989 (%)
Year householder moved into unit - Moved in 1970 to 1979 (%)
Year householder moved into unit - Moved in 1969 or earlier (%)
Means of transportation to work - Drove car alone (%)
Means of transportation to work - Carpooled (%)
Means of transportation to work - Public transportation (%)
Means of transportation to work - Bus or trolley bus (%)
Means of transportation to work - Streetcar or trolley car (%)
Means of transportation to work - Subway or elevated (%)
Means of transportation to work - Railroad (%)
Means of transportation to work - Ferryboat (%)
Means of transportation to work - Taxicab (%)
Means of transportation to work - Motorcycle (%)
Means of transportation to work - Bicycle (%)
Means of transportation to work - Walked (%)
Means of transportation to work - Other means (%)
Working at home (%)
Industry diversity
Most Common Industries - Agriculture, forestry, fishing and hunting, and mining (%)
Most Common Industries - Agriculture, forestry, fishing and hunting (%)
Most Common Industries - Mining, quarrying, and oil and gas extraction (%)
Most Common Industries - Construction (%)
Most Common Industries - Manufacturing (%)
Most Common Industries - Wholesale trade (%)
Most Common Industries - Retail trade (%)
Most Common Industries - Transportation and warehousing, and utilities (%)
Most Common Industries - Transportation and warehousing (%)
Most Common Industries - Utilities (%)
Most Common Industries - Information (%)
Most Common Industries - Finance and insurance, and real estate and rental and leasing (%)
Most Common Industries - Finance and insurance (%)
Most Common Industries - Real estate and rental and leasing (%)
Most Common Industries - Professional, scientific, and management, and administrative and waste management services (%)
Most Common Industries - Professional, scientific, and technical services (%)
Most Common Industries - Management of companies and enterprises (%)
Most Common Industries - Administrative and support and waste management services (%)
Most Common Industries - Educational services, and health care and social assistance (%)
Most Common Industries - Educational services (%)
Most Common Industries - Health care and social assistance (%)
Most Common Industries - Arts, entertainment, and recreation, and accommodation and food services (%)
Most Common Industries - Arts, entertainment, and recreation (%)
Most Common Industries - Accommodation and food services (%)
Most Common Industries - Other services, except public administration (%)
Most Common Industries - Public administration (%)
Occupation diversity
Most Common Occupations - Management, business, science, and arts occupations (%)
Most Common Occupations - Management, business, and financial occupations (%)
Most Common Occupations - Management occupations (%)
Most Common Occupations - Business and financial operations occupations (%)
Most Common Occupations - Computer, engineering, and science occupations (%)
Most Common Occupations - Computer and mathematical occupations (%)
Most Common Occupations - Architecture and engineering occupations (%)
Most Common Occupations - Life, physical, and social science occupations (%)
Most Common Occupations - Education, legal, community service, arts, and media occupations (%)
Most Common Occupations - Community and social service occupations (%)
Most Common Occupations - Legal occupations (%)
Most Common Occupations - Education, training, and library occupations (%)
Most Common Occupations - Arts, design, entertainment, sports, and media occupations (%)
Most Common Occupations - Healthcare practitioners and technical occupations (%)
Most Common Occupations - Health diagnosing and treating practitioners and other technical occupations (%)
Most Common Occupations - Health technologists and technicians (%)
Most Common Occupations - Service occupations (%)
Most Common Occupations - Healthcare support occupations (%)
Most Common Occupations - Protective service occupations (%)
Most Common Occupations - Fire fighting and prevention, and other protective service workers including supervisors (%)
Most Common Occupations - Law enforcement workers including supervisors (%)
Most Common Occupations - Food preparation and serving related occupations (%)
Most Common Occupations - Building and grounds cleaning and maintenance occupations (%)
Most Common Occupations - Personal care and service occupations (%)
Most Common Occupations - Sales and office occupations (%)
Most Common Occupations - Sales and related occupations (%)
Most Common Occupations - Office and administrative support occupations (%)
Most Common Occupations - Natural resources, construction, and maintenance occupations (%)
Most Common Occupations - Farming, fishing, and forestry occupations (%)
Most Common Occupations - Construction and extraction occupations (%)
Most Common Occupations - Installation, maintenance, and repair occupations (%)
Most Common Occupations - Production, transportation, and material moving occupations (%)
Most Common Occupations - Production occupations (%)
Most Common Occupations - Transportation occupations (%)
Most Common Occupations - Material moving occupations (%)
People in Group quarters - Institutionalized population (%)
People in Group quarters - Correctional institutions (%)
People in Group quarters - Federal prisons and detention centers (%)
People in Group quarters - Halfway houses (%)
People in Group quarters - Local jails and other confinement facilities (including police lockups) (%)
People in Group quarters - Military disciplinary barracks (%)
People in Group quarters - State prisons (%)
People in Group quarters - Other types of correctional institutions (%)
People in Group quarters - Nursing homes (%)
People in Group quarters - Hospitals/wards, hospices, and schools for the handicapped (%)
People in Group quarters - Hospitals/wards and hospices for chronically ill (%)
People in Group quarters - Hospices or homes for chronically ill (%)
People in Group quarters - Military hospitals or wards for chronically ill (%)
People in Group quarters - Other hospitals or wards for chronically ill (%)
People in Group quarters - Hospitals or wards for drug/alcohol abuse (%)
People in Group quarters - Mental (Psychiatric) hospitals or wards (%)
People in Group quarters - Schools, hospitals, or wards for the mentally retarded (%)
People in Group quarters - Schools, hospitals, or wards for the physically handicapped (%)
People in Group quarters - Institutions for the deaf (%)
People in Group quarters - Institutions for the blind (%)
People in Group quarters - Orthopedic wards and institutions for the physically handicapped (%)
People in Group quarters - Wards in general hospitals for patients who have no usual home elsewhere (%)
People in Group quarters - Wards in military hospitals for patients who have no usual home elsewhere (%)
People in Group quarters - Juvenile institutions (%)
People in Group quarters - Long-term care (%)
People in Group quarters - Homes for abused, dependent, and neglected children (%)
People in Group quarters - Residential treatment centers for emotionally disturbed children (%)
People in Group quarters - Training schools for juvenile delinquents (%)
People in Group quarters - Short-term care, detention or diagnostic centers for delinquent children (%)
People in Group quarters - Type of juvenile institution unknown (%)
People in Group quarters - Noninstitutionalized population (%)
People in Group quarters - College dormitories (includes college quarters off campus) (%)
People in Group quarters - Military quarters (%)
People in Group quarters - On base (%)
People in Group quarters - Barracks, unaccompanied personnel housing (UPH), (Enlisted/Officer), ;and similar group living quarters for military personnel (%)
People in Group quarters - Transient quarters for temporary residents (%)
People in Group quarters - Military ships (%)
People in Group quarters - Group homes (%)
People in Group quarters - Homes or halfway houses for drug/alcohol abuse (%)
People in Group quarters - Homes for the mentally ill (%)
People in Group quarters - Homes for the mentally retarded (%)
People in Group quarters - Homes for the physically handicapped (%)
People in Group quarters - Other group homes (%)
People in Group quarters - Religious group quarters (%)
People in Group quarters - Dormitories (%)
People in Group quarters - Agriculture workers' dormitories on farms (%)
People in Group quarters - Job Corps and vocational training facilities (%)
People in Group quarters - Other workers' dormitories (%)
People in Group quarters - Crews of maritime vessels (%)
People in Group quarters - Other nonhousehold living situations (%)
People in Group quarters - Other noninstitutional group quarters (%)
Residents speaking English at home (%)
Residents speaking English at home - Born in the United States (%)
Residents speaking English at home - Native, born elsewhere (%)
Residents speaking English at home - Foreign born (%)
Residents speaking Spanish at home (%)
Residents speaking Spanish at home - Born in the United States (%)
Residents speaking Spanish at home - Native, born elsewhere (%)
Residents speaking Spanish at home - Foreign born (%)
Residents speaking other language at home (%)
Residents speaking other language at home - Born in the United States (%)
Residents speaking other language at home - Native, born elsewhere (%)
Residents speaking other language at home - Foreign born (%)
Class of Workers - Employee of private company (%)
Class of Workers - Self-employed in own incorporated business (%)
Class of Workers - Private not-for-profit wage and salary workers (%)
Class of Workers - Local government workers (%)
Class of Workers - State government workers (%)
Class of Workers - Federal government workers (%)
Class of Workers - Self-employed workers in own not incorporated business and Unpaid family workers (%)
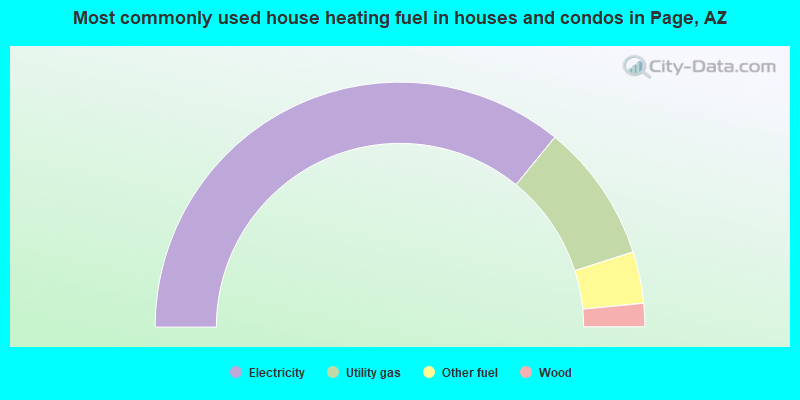
House heating fuel used in houses and condos - Utility gas (%)
House heating fuel used in houses and condos - Bottled, tank, or LP gas (%)
House heating fuel used in houses and condos - Electricity (%)
House heating fuel used in houses and condos - Fuel oil, kerosene, etc. (%)
House heating fuel used in houses and condos - Coal or coke (%)
House heating fuel used in houses and condos - Wood (%)
House heating fuel used in houses and condos - Solar energy (%)
House heating fuel used in houses and condos - Other fuel (%)
House heating fuel used in houses and condos - No fuel used (%)
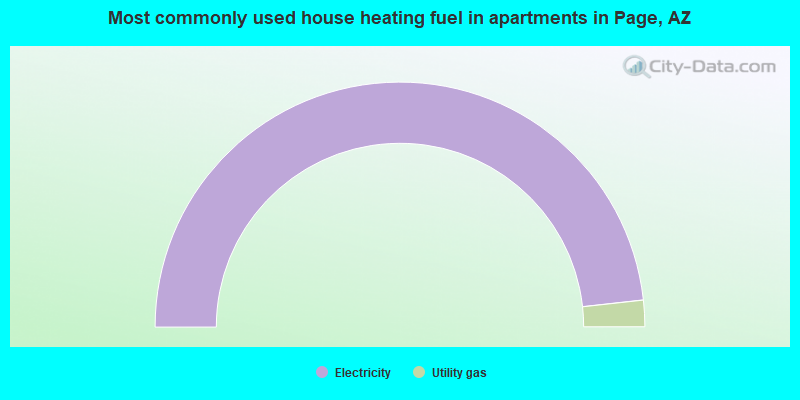
House heating fuel used in apartments - Utility gas (%)
House heating fuel used in apartments - Bottled, tank, or LP gas (%)
House heating fuel used in apartments - Electricity (%)
House heating fuel used in apartments - Fuel oil, kerosene, etc. (%)
House heating fuel used in apartments - Coal or coke (%)
House heating fuel used in apartments - Wood (%)
House heating fuel used in apartments - Solar energy (%)
House heating fuel used in apartments - Other fuel (%)
House heating fuel used in apartments - No fuel used (%)
Armed forces status - In Armed Forces (%)
Armed forces status - Civilian (%)
Armed forces status - Civilian - Veteran (%)
Armed forces status - Civilian - Nonveteran (%)
Fatal accidents locations in years 2005-2021
Fatal accidents locations in 2005
Fatal accidents locations in 2006
Fatal accidents locations in 2007
Fatal accidents locations in 2008
Fatal accidents locations in 2009
Fatal accidents locations in 2010
Fatal accidents locations in 2011
Fatal accidents locations in 2012
Fatal accidents locations in 2013
Fatal accidents locations in 2014
Fatal accidents locations in 2015
Fatal accidents locations in 2016
Fatal accidents locations in 2017
Fatal accidents locations in 2018
Fatal accidents locations in 2019
Fatal accidents locations in 2020
Fatal accidents locations in 2021
Alcohol use - People drinking some alcohol every month (%)
Alcohol use - People not drinking at all (%)
Alcohol use - Average days/month drinking alcohol
Alcohol use - Average drinks/week
Alcohol use - Average days/year people drink much
Audiometry - Average condition of hearing (%)
Audiometry - People that can hear a whisper from across a quiet room (%)
Audiometry - People that can hear normal voice from across a quiet room (%)
Audiometry - Ears ringing, roaring, buzzing (%)
Audiometry - Had a job exposure to loud noise (%)
Audiometry - Had off-work exposure to loud noise (%)
Blood Pressure & Cholesterol - Has high blood pressure (%)
Blood Pressure & Cholesterol - Checking blood pressure at home (%)
Blood Pressure & Cholesterol - Frequently checking blood cholesterol (%)
Blood Pressure & Cholesterol - Has high cholesterol level (%)
Consumer Behavior - Money monthly spent on food at supermarket/grocery store
Consumer Behavior - Money monthly spent on food at other stores
Consumer Behavior - Money monthly spent on eating out
Consumer Behavior - Money monthly spent on carryout/delivered foods
Consumer Behavior - Income spent on food at supermarket/grocery store (%)
Consumer Behavior - Income spent on food at other stores (%)
Consumer Behavior - Income spent on eating out (%)
Consumer Behavior - Income spent on carryout/delivered foods (%)
Current Health Status - General health condition (%)
Current Health Status - Blood donors (%)
Current Health Status - Has blood ever tested for HIV virus (%)
Current Health Status - Left-handed people (%)
Dermatology - People using sunscreen (%)
Diabetes - Diabetics (%)
Diabetes - Had a blood test for high blood sugar (%)
Diabetes - People taking insulin (%)
Diet Behavior & Nutrition - Diet health (%)
Diet Behavior & Nutrition - Milk product consumption (# of products/month)
Diet Behavior & Nutrition - Meals not home prepared (#/week)
Diet Behavior & Nutrition - Meals from fast food or pizza place (#/week)
Diet Behavior & Nutrition - Ready-to-eat foods (#/month)
Diet Behavior & Nutrition - Frozen meals/pizza (#/month)
Drug Use - People that ever used marijuana or hashish (%)
Drug Use - Ever used hard drugs (%)
Drug Use - Ever used any form of cocaine (%)
Drug Use - Ever used heroin (%)
Drug Use - Ever used methamphetamine (%)
Health Insurance - People covered by health insurance (%)
Kidney Conditions-Urology - Avg. # of times urinating at night
Medical Conditions - People with asthma (%)
Medical Conditions - People with anemia (%)
Medical Conditions - People with psoriasis (%)
Medical Conditions - People with overweight (%)
Medical Conditions - Elderly people having difficulties in thinking or remembering (%)
Medical Conditions - People who ever received blood transfusion (%)
Medical Conditions - People having trouble seeing even with glass/contacts (%)
Medical Conditions - People with arthritis (%)
Medical Conditions - People with gout (%)
Medical Conditions - People with congestive heart failure (%)
Medical Conditions - People with coronary heart disease (%)
Medical Conditions - People with angina pectoris (%)
Medical Conditions - People who ever had heart attack (%)
Medical Conditions - People who ever had stroke (%)
Medical Conditions - People with emphysema (%)
Medical Conditions - People with thyroid problem (%)
Medical Conditions - People with chronic bronchitis (%)
Medical Conditions - People with any liver condition (%)
Medical Conditions - People who ever had cancer or malignancy (%)
Mental Health - People who have little interest in doing things (%)
Mental Health - People feeling down, depressed, or hopeless (%)
Mental Health - People who have trouble sleeping or sleeping too much (%)
Mental Health - People feeling tired or having little energy (%)
Mental Health - People with poor appetite or overeating (%)
Mental Health - People feeling bad about themself (%)
Mental Health - People who have trouble concentrating on things (%)
Mental Health - People moving or speaking slowly or too fast (%)
Mental Health - People having thoughts they would be better off dead (%)
Oral Health - Average years since last visit a dentist
Oral Health - People embarrassed because of mouth (%)
Oral Health - People with gum disease (%)
Oral Health - General health of teeth and gums (%)
Oral Health - Average days a week using dental floss/device
Oral Health - Average days a week using mouthwash for dental problem
Oral Health - Average number of teeth
Pesticide Use - Households using pesticides to control insects (%)
Pesticide Use - Households using pesticides to kill weeds (%)
Physical Activity - People doing vigorous-intensity work activities (%)
Physical Activity - People doing moderate-intensity work activities (%)
Physical Activity - People walking or bicycling (%)
Physical Activity - People doing vigorous-intensity recreational activities (%)
Physical Activity - People doing moderate-intensity recreational activities (%)
Physical Activity - Average hours a day doing sedentary activities
Physical Activity - Average hours a day watching TV or videos
Physical Activity - Average hours a day using computer
Physical Functioning - People having limitations keeping them from working (%)
Physical Functioning - People limited in amount of work they can do (%)
Physical Functioning - People that need special equipment to walk (%)
Physical Functioning - People experiencing confusion/memory problems (%)
Physical Functioning - People requiring special healthcare equipment (%)
Prescription Medications - Average number of prescription medicines taking
Preventive Aspirin Use - Adults 40+ taking low-dose aspirin (%)
Reproductive Health - Vaginal deliveries (%)
Reproductive Health - Cesarean deliveries (%)
Reproductive Health - Deliveries resulted in a live birth (%)
Reproductive Health - Pregnancies resulted in a delivery (%)
Reproductive Health - Women breastfeeding newborns (%)
Reproductive Health - Women that had a hysterectomy (%)
Reproductive Health - Women that had both ovaries removed (%)
Reproductive Health - Women that have ever taken birth control pills (%)
Reproductive Health - Women taking birth control pills (%)
Reproductive Health - Women that have ever used Depo-Provera or injectables (%)
Reproductive Health - Women that have ever used female hormones (%)
Sexual Behavior - People 18+ that ever had sex (vaginal, anal, or oral) (%)
Sexual Behavior - Males 18+ that ever had vaginal sex with a woman (%)
Sexual Behavior - Males 18+ that ever performed oral sex on a woman (%)
Sexual Behavior - Males 18+ that ever had anal sex with a woman (%)
Sexual Behavior - Males 18+ that ever had any sex with a man (%)
Sexual Behavior - Females 18+ that ever had vaginal sex with a man (%)
Sexual Behavior - Females 18+ that ever performed oral sex on a man (%)
Sexual Behavior - Females 18+ that ever had anal sex with a man (%)
Sexual Behavior - Females 18+ that ever had any kind of sex with a woman (%)
Sexual Behavior - Average age people first had sex
Sexual Behavior - Average number of female sex partners in lifetime (males 18+)
Sexual Behavior - Average number of female vaginal sex partners in lifetime (males 18+)
Sexual Behavior - Average age people first performed oral sex on a woman (18+)
Sexual Behavior - Average number of woman performed oral sex on in lifetime (18+)
Sexual Behavior - Average number of male sex partners in lifetime (males 18+)
Sexual Behavior - Average number of male anal sex partners in lifetime (males 18+)
Sexual Behavior - Average age people first performed oral sex on a man (18+)
Sexual Behavior - Average number of male oral sex partners in lifetime (18+)
Sexual Behavior - People using protection when performing oral sex (%)
Sexual Behavior - Average number of times people have vaginal or anal sex a year
Sexual Behavior - People having sex without condom (%)
Sexual Behavior - Average number of male sex partners in lifetime (females 18+)
Sexual Behavior - Average number of male vaginal sex partners in lifetime (females 18+)
Sexual Behavior - Average number of female sex partners in lifetime (females 18+)
Sexual Behavior - Circumcised males 18+ (%)
Sleep Disorders - Average hours sleeping at night
Sleep Disorders - People that has trouble sleeping (%)
Smoking-Cigarette Use - People smoking cigarettes (%)
Taste & Smell - People 40+ having problems with smell (%)
Taste & Smell - People 40+ having problems with taste (%)
Taste & Smell - People 40+ that ever had wisdom teeth removed (%)
Taste & Smell - People 40+ that ever had tonsils teeth removed (%)
Taste & Smell - People 40+ that ever had a loss of consciousness because of a head injury (%)
Taste & Smell - People 40+ that ever had a broken nose or other serious injury to face or skull (%)
Taste & Smell - People 40+ that ever had two or more sinus infections (%)
Weight - Average height (inches)
Weight - Average weight (pounds)
Weight - Average BMI
Weight - People that are obese (%)
Weight - People that ever were obese (%)
Weight - People trying to lose weight (%)
3,911 52.8% American Indian alone 2,674 36.1% White alone 471 6.4% Hispanic 96 1.3% Two or more races 57 0.8% Black alone 16 0.2% Asian alone
Officers per 1,000 residents here:
2.12Arizona average:
1.75
Latest news from Page, AZ collected exclusively by city-data.com from local newspapers, TV, and radio stations
Ancestries: Scandinavian (4.5%), English (3.0%), German (2.8%), Swedish (1.4%), Irish (1.1%).
Current Local Time:
Land area: 16.6 square miles.
Population density: 444 people per square mile (low).
199 residents are foreign born (1.7% Latin America , 0.7% Oceania ).
This city:
2.7%Arizona:
13.0%
Median real estate property taxes paid for housing units with mortgages in 2022: $1,555 (0.4%)Median real estate property taxes paid for housing units with no mortgage in 2022: $578 (0.5%)
Nearest city with pop. 50,000+: Flagstaff, AZ
Nearest city with pop. 200,000+: Las Vegas, NV
Nearest city with pop. 1,000,000+: Phoenix, AZ
Nearest cities:
Henrieville, UT (7.3 miles)
Latitude: 36.91 N, Longitude: 111.46 W
Daytime population change due to commuting: +1,764 (+23.8%)Workers who live and work in this city: 2,465 (74.6%)
Page tourist attractions:
Single-family new house construction building permits:
2022: 7 buildings , average cost: $198,0002021: 13 buildings , average cost: $255,7002020: 11 buildings , average cost: $263,7002019: 11 buildings , average cost: $196,8002018: 11 buildings , average cost: $196,8002017: 11 buildings , average cost: $231,4002016: 2 buildings , average cost: $242,1002015: 2 buildings , average cost: $242,1002014: 2 buildings , average cost: $242,1002013: 2 buildings , average cost: $242,1002012: 2 buildings , average cost: $242,1002011: 3 buildings , average cost: $237,7002010: 33 buildings , average cost: $79,8002009: 13 buildings , average cost: $192,8002008: 16 buildings , average cost: $194,0002007: 12 buildings , average cost: $192,1002006: 28 buildings , average cost: $148,3002005: 36 buildings , average cost: $148,3002004: 6 buildings , average cost: $188,7002003: 14 buildings , average cost: $187,0002002: 7 buildings , average cost: $188,3002001: 3 buildings , average cost: $176,5002000: 8 buildings , average cost: $152,8001999: 19 buildings , average cost: $129,5001998: 13 buildings , average cost: $138,2001997: 37 buildings , average cost: $96,000Unemployment in December 2023: Population change in the 1990s: +176 (+2.7%).
Most common occupations in Page, AZ (%)
Both Males Females
Other sales and related occupations, including supervisors (7.2%)
Electrical equipment mechanics and other installation, maintenance, and repair workers, including supervisors (6.9%)
Other management occupations, except farmers and farm managers (5.6%)
Preschool, kindergarten, elementary, and middle school teachers (4.8%)
Building and grounds cleaning and maintenance occupations (3.8%)
Cooks and food preparation workers (3.5%)
Cashiers (3.4%)
Electrical equipment mechanics and other installation, maintenance, and repair workers, including supervisors (12.1%)
Other sales and related occupations, including supervisors (7.4%)
Other management occupations, except farmers and farm managers (5.5%)
Vehicle and mobile equipment mechanics, installers, and repairers (5.5%)
Cooks and food preparation workers (4.7%)
Metal workers and plastic workers (4.2%)
Building and grounds cleaning and maintenance occupations (3.7%)
Preschool, kindergarten, elementary, and middle school teachers (8.9%)
Other sales and related occupations, including supervisors (7.0%)
Cashiers (6.9%)
Other management occupations, except farmers and farm managers (5.7%)
Other teachers, instructors, education, training, and library occupations (5.5%)
Information and record clerks, except customer service representatives (4.8%)
Building and grounds cleaning and maintenance occupations (3.9%)
Earthquake activity:
Page-area historical earthquake activity is significantly above Arizona state average. It is 2691% greater than the overall U.S. average. On 6/28/1992 at 11:57:34, a magnitude 7.6 (6.2 MB, 7.6 MS, 7.3 MW, Depth: 0.7 mi, Class: Major, Intensity: VIII - XII) earthquake occurred 342.2 miles away from Page center, causing 3 deaths ( 1 shaking deaths, 2 other deaths) and 400 injuries, causing $100,000,000 total damage and $40,000,000 insured lossesOn 10/16/1999 at 09:46:44, a magnitude 7.4 (6.3 MB, 7.4 MS, 7.2 MW, 7.3 ML) earthquake occurred 324.9 miles away from Page center On 10/3/1915 at 06:52:48, a magnitude 7.6 (7.6 UK) earthquake occurred 409.5 miles away from Page center On 7/21/1952 at 11:52:14, a magnitude 7.7 (7.7 UK) earthquake occurred 442.3 miles away from Page center, causing $50,000,000 total damage On 5/19/1940 at 04:36:40, a magnitude 7.2 (7.2 UK) earthquake occurred 350.3 miles away from Page center, causing $33,000,000 total damage On 12/21/1932 at 06:10:09, a magnitude 7.2 (7.2 UK) earthquake occurred 378.8 miles away from the city center Magnitude types: body-wave magnitude (MB), local magnitude (ML), surface-wave magnitude (MS), moment magnitude (MW) Natural disasters: The number of natural disasters in Coconino County (17) is near the US average (15).Major Disasters (Presidential) Declared: 8Emergencies Declared: 3Fires: 6, Floods: 6, Storms: 5, Winter Storms: 2, Drought: 1, Flash Flood: 1, Heavy Rain: 1, Hurricane: 1, Tornado: 1, Other: 1 (Note: some incidents may be assigned to more than one category). Hospitals and medical centers in Page: PAGE HOSPITAL (Government - Hospital District or Authority, 501 NORTH NAVAJO DRIVE) HORIZON HOME HEALTH (32 NORTH 10TH AVENUE, SUITE 6)
Colleges/universities with over 2000 students nearest to Page:
Southern Utah University (about 104 miles; Cedar City, UT ; Full-time enrollment: 6,522)
Dixie State University (about 118 miles; Saint George, UT ; FT enrollment: 6,485)
Northern Arizona University (about 121 miles; Flagstaff, AZ ; FT enrollment: 22,494)
Coconino Community College (about 122 miles; Flagstaff, AZ ; FT enrollment: 2,090)
Northcentral University (about 167 miles; Prescott Valley, AZ ; FT enrollment: 5,927)
Snow College (about 170 miles; Ephraim, UT ; FT enrollment: 3,224)
Yavapai College (about 173 miles; Prescott, AZ ; FT enrollment: 4,258)
Private elementary/middle school in Page:
See full list of schools located in Page Library in Page: PAGE PUBLIC LIBRARY Operating income: $521,321; Location: 479 S. LAKE POWELL BLVD.; 59,808 books ; 3,147 audio materials ; 3,976 video materials ; 4 local licensed databases ; 39 state licensed databases ; 52 print serial subscriptions ; 9 electronic serial subscriptions )
User-submitted facts and corrections:
Lake Powell Medical Center And Canyonlands urgent care are The local Medical Centers In Page
Notable locations in Page: (A) , Page Public Library (B) , Page Fire Department (C) , Page Police Department (D) . Display/hide their locations on the map
Churches in Page include: (A) , First Assembly of God (B) , Faith Bible Chapel (C) , The Church of Jesus Christ of Latter Day Saints (D) , Page Community United Methodist Church (E) , Lake Powell Church of the Nazarene (F) , Kingdom Hall of Jehovahs Witnesses (G) , The Church of Jesus Christ of Latter Day Saints (H) , Saint David's Episcopal Church (I) . Display/hide their locations on the map
Parks in Page include: (1) , Jack Doland Field (2) . Display/hide their locations on the map
Tourist attractions:
Hotels:
Court:
Birthplace of: Matt Haryasz - College basketball player (Stanford Cardinal).
Coconino County has a predicted average indoor radon screening level between 2 and 4 pCi/L (pico curies per liter) - Moderate Potential Drinking water stations with addresses in Page and their reported violations in the past:
PAGE CITY OF (Population served: 7,705, Surface water):
Past health violations:
MCL, Monthly (TCR) - In NOV-2013, Contaminant: Coliform. Follow-up actions: St Violation/Reminder Notice (JAN-08-2014), St Compliance achieved (JAN-10-2014)
MCL, Monthly (TCR) - In SEP-2013, Contaminant: Coliform. Follow-up actions: St Violation/Reminder Notice (NOV-14-2013), St Compliance achieved (JAN-10-2014)
MCL, Monthly (TCR) - In JUL-2012, Contaminant: Coliform. Follow-up actions: St Violation/Reminder Notice (AUG-30-2012), St Compliance achieved (NOV-14-2012)
Past monitoring violations:
Monitoring and Reporting (DBP) - Between OCT-2010 and DEC-2010, Contaminant: TTHM. Follow-up actions: St Compliance achieved (JUN-12-2012)
Monitoring and Reporting (DBP) - Between OCT-2010 and DEC-2010, Contaminant: Total Haloacetic Acids (HAA5). Follow-up actions: St Compliance achieved (JUN-12-2012)
Monitoring and Reporting (DBP) - Between JUL-2010 and SEP-2010, Contaminant: TTHM. Follow-up actions: St Compliance achieved (JUN-12-2012)
Monitoring and Reporting (DBP) - Between JUL-2010 and SEP-2010, Contaminant: Total Haloacetic Acids (HAA5). Follow-up actions: St Compliance achieved (JUN-12-2012)
Monitoring and Reporting (DBP) - Between APR-2010 and JUN-2010, Contaminant: Total Haloacetic Acids (HAA5). Follow-up actions: St Compliance achieved (JUN-12-2012)
One routine major monitoring violation
One minor monitoring violation
5 other older monitoring violations
Population served: 3,821, Groundwater):
Past monitoring violations:
Monitoring, Repeat Major (TCR) - In FEB-2014, Contaminant: Coliform (TCR). Follow-up actions: St Violation/Reminder Notice (MAR-27-2014), St Compliance achieved (APR-25-2014)
Monitoring and Reporting (DBP) - Between OCT-2013 and DEC-2013, Contaminant: Chlorine
Monitoring and Reporting (DBP) - Between JUL-2013 and SEP-2013, Contaminant: Chlorine
Monitoring and Reporting (DBP) - Between APR-2013 and JUN-2013, Contaminant: Chlorine
Monitoring and Reporting (DBP) - Between JAN-2012 and DEC-2012, Contaminant: TTHM. Follow-up actions: St Violation/Reminder Notice (APR-23-2013), St Compliance achieved (MAY-01-2013)
One routine major monitoring violation
One minor monitoring violation
45 regular monitoring violations
29 other older monitoring violations
Serves UT, Population served: 480, Groundwater):
Past health violations:
MCL, Monthly (TCR) - In JUL-2011, Contaminant: Coliform. Follow-up actions: St Formal NOV issued (2 times from SEP-10-2011 to SEP-10-2011), St Public Notif requested (2 times from SEP-10-2011 to SEP-10-2011), St Public Notif received (OCT-01-2011)
MCL, Monthly (TCR) - In JAN-2011, Contaminant: Coliform. Follow-up actions: St Formal NOV issued (MAR-13-2011), St Public Notif requested (MAR-13-2011)
Past monitoring violations:
Monitoring and Reporting (DBP) - Between JAN-2014 and MAR-2014, Contaminant: Chlorine. Follow-up actions: St Formal NOV issued (JUN-22-2014), St Public Notif requested (JUN-22-2014)
Follow-up Or Routine LCR Tap M/R - In JAN-01-2004, Contaminant: Lead and Copper Rule. Follow-up actions: St Compliance achieved (SEP-30-2009)
Initial Tap Sampling for Pb and Cu - In JAN-01-1998, Contaminant: Lead and Copper Rule. Follow-up actions: St Hook-up/Extension Ban (2 times from JUN-17-1996 to JUN-05-1998), St Compliance achieved (2 times from JUN-30-1998 to MAY-02-2011)
Initial Tap Sampling for Pb and Cu - In JAN-01-1997, Contaminant: Lead and Copper Rule. Follow-up actions: St Hook-up/Extension Ban (2 times from JUN-17-1996 to JUN-05-1998), St Compliance achieved (2 times from JUN-30-1998 to MAY-02-2011)
5 routine major monitoring violations
One minor monitoring violation
7 regular monitoring violations
Average household size: This city:
2.9 peopleArizona:
2.6 people
Percentage of family households: This city:
72.4%Whole state:
66.2%
Percentage of households with unmarried partners: This city:
10.3%Whole state:
7.8%
Likely homosexual households (counted as self-reported same-sex unmarried-partner households)
Lesbian couples: 0.7% of all households Gay men: 0.8% of all households
19 people in group homes intended for adults in 2010people in hospitals or wards for drug/alcohol abuse in 2000
Banks with branches in Page (2011 data):
Bank of the West: Page Branch at 480 North Navajo Drive, branch established on 1978/01/30. Info updated 2009/11/16: Bank assets: $62,408.3 mil, Deposits: $43,995.2 mil, headquarters in San Francisco, CA, positive income , 647 total offices , Holding Company: Bnp Paribas
National Bank of Arizona: Page Branch at 58 South Lake Powell Boulevard, branch established on 1957/08/23. Info updated 2008/09/11: Bank assets: $4,485.6 mil, Deposits: $3,731.3 mil, headquarters in Tucson, AZ, positive income , Commercial Lending Specialization, 73 total offices , Holding Company: Zions Bancorporation
For population 15 years and over in Page:
Never married: 39.6%Now married: 46.8%Separated: 1.0%Widowed: 4.3%Divorced: 8.2% For population 25 years and over in Page:
High school or higher: 94.4%Bachelor's degree or higher: 18.5%Graduate or professional degree: 4.3%Unemployed: 6.1%Mean travel time to work (commute): 10.3 minutes
Education Gini index (Inequality in education) Here:
8.0Arizona average:
12.2
Religion statistics for Page, AZ (based on Coconino County data)
Religion Adherents Congregations Other 18,297 54 Evangelical Protestant 10,785 98 Catholic 6,750 9 Mainline Protestant 3,756 18 Black Protestant 171 2 Orthodox 150 1 None 94,512 -
Source: Clifford Grammich, Kirk Hadaway, Richard Houseal, Dale E.Jones, Alexei Krindatch, Richie Stanley and Richard H.Taylor. 2012. 2010 U.S.Religion Census: Religious Congregations & Membership Study. Association of Statisticians of American Religious Bodies. Jones, Dale E., et al. 2002. Congregations and Membership in the United States 2000. Nashville, TN: Glenmary Research Center. Graphs represent county-level data
Food Environment Statistics: Number of grocery stores : 20Coconino County :
1.57 / 10,000 pop.Arizona :
1.36 / 10,000 pop.
Number of supercenters and club stores : 1Here :
0.08 / 10,000 pop.State :
0.14 / 10,000 pop.
Number of convenience stores (no gas) : 6Here :
0.47 / 10,000 pop.Arizona :
0.55 / 10,000 pop.
Number of convenience stores (with gas) : 72Coconino County :
5.65 / 10,000 pop.State :
2.47 / 10,000 pop.
Number of full-service restaurants : 162This county :
12.72 / 10,000 pop.Arizona :
6.21 / 10,000 pop.
Adult diabetes rate : Coconino County :
6.8%Arizona :
8.0%
Low-income preschool obesity rate : Coconino County :
8.3%Arizona :
14.2%
Health and Nutrition:
Average overall health of teeth and gums : This city:
49.0%Arizona:
47.3%
People feeling badly about themselves : People not drinking alcohol at all : Average hours sleeping at night : General health condition : Average condition of hearing : More about Health and Nutrition of Page, AZ Residents
Local government employment and payroll (March 2022)
Function
Full-time employees
Monthly full-time payroll
Average yearly full-time wage
Part-time employees
Monthly part-time payroll
Parks and Recreation
21 $77,774 $44,442 6 $13,296 Police Protection - Officers
20 $117,415 $70,449 0 $0 Firefighters
19 $105,506 $66,635 2 $126 Financial Administration
14 $72,144 $61,838 2 $4,070 Police - Other
12 $56,592 $56,592 2 $3,851 Other and Unallocable
9 $64,224 $85,632 0 $0 Electric Power
9 $64,396 $85,861 0 $0 Other Government Administration
9 $57,839 $77,119 7 $4,599 Judicial and Legal
8 $47,662 $71,493 3 $2,069 Sewerage
7 $30,465 $52,226 1 $1,620 Streets and Highways
6 $28,185 $56,370 0 $0 Local Libraries
6 $22,093 $44,186 1 $1,964 Water Supply
4 $16,875 $50,625 1 $2,062 Welfare
3 $9,548 $38,192 2 $2,983 Airports
2 $5,654 $33,924 0 $0 Fire - Other
1 $3,289 $39,468 0 $0
Totals for Government
150 $779,662 $62,373 27 $36,640
Page government finances - Expenditure in 2021 (per resident):
Construction - General - Other: $3,269,000 ($444.34)
Current Operations - Housing and Community Development: $4,249,000 ($577.55)
Police Protection: $2,790,000 ($379.23)Local Fire Protection: $1,965,000 ($267.09)Central Staff Services: $1,820,000 ($247.38)General Public Buildings: $1,815,000 ($246.70)Financial Administration: $987,000 ($134.16)Regular Highways: $976,000 ($132.66)Judicial and Legal Services: $662,000 ($89.98)Parks and Recreation: $499,000 ($67.83)Air Transportation: $486,000 ($66.06)Libraries: $358,000 ($48.66)
Page government finances - Revenue in 2021 (per resident):
Charges - Other: $818,000 ($111.19)
Air Transportation: $68,000 ($9.24)Parks and Recreation: $5,000 ($0.68)Miscellaneous - Interest Earnings: $558,000 ($75.85)
Sale of Property: $541,000 ($73.54)Rents: $433,000 ($58.86)Fines and Forfeits: $199,000 ($27.05)General Revenue - Other: $113,000 ($15.36)Donations From Private Sources: $13,000 ($1.77)State Intergovernmental - General Local Government Support: $4,826,000 ($655.97)
Other: $2,542,000 ($345.52)Highways: $922,000 ($125.32)Tax - General Sales and Gross Receipts: $12,081,000 ($1642.11)
Property: $421,000 ($57.22)Corporation Net Income: $228,000 ($30.99)Occupation and Business License - Other: $99,000 ($13.46)Other License: $80,000 ($10.87)
Page government finances - Debt in 2021 (per resident):
Long Term Debt - Beginning Outstanding - Public Debt for Private Purpose: $8,485,000 ($1153.32)
Outstanding Nonguaranteed - Industrial Revenue: $7,706,000 ($1047.44)Beginning Outstanding - Unspecified Public Purpose: $6,876,000 ($934.62)Outstanding Unspecified Public Purpose: $6,005,000 ($816.23)Retired Unspecified Public Purpose: $1,295,000 ($176.02)Retired Nonguaranteed - Public Debt for Private Purpose: $779,000 ($105.89)Issue, Unspecified Public Purpose: $424,000 ($57.63)
Page government finances - Cash and Securities in 2021 (per resident):
Other Funds - Cash and Securities: $45,811,000 ($6226.86)
Sinking Funds - Cash and Securities: $14,593,000 ($1983.55)
Businesses in Page, AZ
Name Count Name Count
Best Western 2 Motel 6 1 Big O Tires 1 Quality 1 Burger King 1 Rodeway Inn 1 Circle K 1 SONIC Drive-In 1 Days Inn 1 Safeway 1 Dennys 1 Sears 1 FedEx 1 Starbucks 1 Ford 1 Super 8 1 H&R Block 1 Travelodge 1 Holiday Inn 1 True Value 1 Jack In The Box 1 U-Haul 2 KFC 1 UPS 1 Lane Furniture 1 Vons 1 Marriott 1 Walmart 1 MasterBrand Cabinets 1
Strongest AM radio stations in Page:
KPGE (1340 AM; 1 kW; PAGE, AZ; Owner: LAKE POWELL COMMUNICATIONS, INC.)
KTNN (660 AM; 50 kW; WINDOW ROCK, AZ; Owner: THE NAVAJO NATION)
KHAC (880 AM; 43 kW; TSE BONITO, NM; Owner: WESTERN INDIAN MINISTRIES, INC.)
KMIA (710 AM; 50 kW; BLACK CANYON CITY, AZ; Owner: ENTRAVISION HOLDINGS, LLC)
KDWN (720 AM; 50 kW; LAS VEGAS, NV; Owner: RADIO NEVADA CORP.)
KXNT (840 AM; 50 kW; NORTH LAS VEGAS, NV; Owner: INFINITY RADIO OPERATIONS INC.)
KNZZ (1100 AM; 50 kW; GRAND JUNCTION, CO; Owner: M B C GRAND BROADCASTING, INC.)
KFNX (1100 AM; 50 kW; CAVE CREEK, AZ; Owner: NORTH AMERICAN BROADCASTING CO., INC.)
KNNZ (940 AM; 10 kW; CEDAR CITY, UT; Owner: MB MEDIA GROUP, INC.)
KALL (700 AM; 50 kW; NORTH SALT LAKE CITY, UT; Owner: CITICASTERS LICENSES, L.P.)
KDXU (890 AM; 10 kW; ST. GEORGE, UT; Owner: WESTERN BROADCASTING, LS, LLC)
KIQN (1010 AM; 50 kW; TOOELE, UT)
KSUB (590 AM; 5 kW; CEDAR CITY, UT; Owner: MB MEDIA GROUP, INC.)
Strongest FM radio stations in Page:
KXAZ (93.3 FM; PAGE, AZ; Owner: LAKE POWELL COMMUNICATIONS, INC.)
KNAD (91.7 FM; PAGE, AZ; Owner: AZ BOARD OF REGENTS FOR N. AZ UNIV.)
KPLD (101.1 FM; KANAB, UT; Owner: MARATHON MEDIA GROUP, L.L.C.)
K282AC (104.3 FM; RURAL GARFIELD COUNT, UT; Owner: GARFIELD COUNTY)
K261BX (100.1 FM; PAGE, AZ; Owner: JEFFERY M. JENNINGS)
TV broadcast stations around Page:
K07PH (Channel 7; LE CHEE, ETC., AZ; Owner: UNIVERSITY OF UTAH)
K09OJ (Channel 9; LE CHEE, ETC., AZ; Owner: LAKE POWELL ANTENNAVISION, INC.)
K11PA (Channel 11; LE CHEE, ETC., AZ; Owner: LAKE POWELL ANTENNAVISION, INC.)
K13QB (Channel 13; LE CHEE, ETC., AZ; Owner: LAKE POWELL ANTENNAVISION, INC.)
National Bridge Inventory (NBI) Statistics 4 Number of bridges148ft / 45.0m Total length $6,000 Total costs17,299 Total average daily traffic2,592 Total average daily truck traffic19,738 Total future (year 2038) average daily traffic
Home Mortgage Disclosure Act Aggregated Statistics For Year 2009(Based on 1 partial tract) A) FHA, FSA/RHS & VA B) Conventional C) Refinancings D) Home Improvement Loans F) Non-occupant Loans on G) Loans On Manufactured Number Average Value Number Average Value Number Average Value Number Average Value Number Average Value Number Average Value
LOANS ORIGINATED 21 $166,071 13 $170,206 92 $185,453 7 $151,397 8 $188,744 19 $110,393 APPLICATIONS APPROVED, NOT ACCEPTED 0 $0 0 $0 21 $210,604 1 $192,260 1 $103,160 1 $137,330 APPLICATIONS DENIED 1 $183,550 2 $93,115 33 $199,975 5 $76,368 3 $139,563 9 $115,892 APPLICATIONS WITHDRAWN 1 $60,290 1 $156,760 25 $178,300 3 $19,873 2 $109,195 5 $99,816 FILES CLOSED FOR INCOMPLETENESS 1 $98,480 0 $0 3 $215,707 1 $66,990 0 $0 0 $0
Aggregated Statistics For Year 2008(Based on 1 partial tract) A) FHA, FSA/RHS & VA B) Conventional C) Refinancings D) Home Improvement Loans F) Non-occupant Loans on G) Loans On Manufactured Number Average Value Number Average Value Number Average Value Number Average Value Number Average Value Number Average Value
LOANS ORIGINATED 22 $207,121 28 $195,252 46 $161,708 6 $72,462 6 $169,038 15 $120,403 APPLICATIONS APPROVED, NOT ACCEPTED 1 $62,300 7 $138,191 6 $166,023 3 $75,030 2 $131,635 5 $93,250 APPLICATIONS DENIED 5 $165,868 13 $116,975 25 $169,002 6 $83,627 3 $184,893 11 $86,905 APPLICATIONS WITHDRAWN 1 $170,150 1 $294,090 14 $163,025 3 $201,193 1 $81,730 3 $102,047 FILES CLOSED FOR INCOMPLETENESS 1 $60,290 0 $0 2 $193,265 1 $36,840 0 $0 1 $80,390
Aggregated Statistics For Year 2007(Based on 1 partial tract) A) FHA, FSA/RHS & VA B) Conventional C) Refinancings D) Home Improvement Loans F) Non-occupant Loans on G) Loans On Manufactured Number Average Value Number Average Value Number Average Value Number Average Value Number Average Value Number Average Value
LOANS ORIGINATED 9 $148,494 49 $156,306 62 $151,614 9 $63,194 11 $126,124 18 $103,202 APPLICATIONS APPROVED, NOT ACCEPTED 2 $170,155 9 $141,126 13 $109,709 1 $23,450 3 $165,467 8 $122,842 APPLICATIONS DENIED 1 $75,700 19 $122,944 32 $145,975 14 $63,928 3 $214,143 21 $63,290 APPLICATIONS WITHDRAWN 4 $133,812 5 $138,134 24 $116,311 1 $23,450 2 $107,520 10 $105,174 FILES CLOSED FOR INCOMPLETENESS 1 $85,750 2 $193,600 5 $120,180 0 $0 1 $79,050 1 $85,750
Aggregated Statistics For Year 2006(Based on 1 partial tract) A) FHA, FSA/RHS & VA B) Conventional C) Refinancings D) Home Improvement Loans E) Loans on Dwellings For 5+ Families F) Non-occupant Loans on G) Loans On Manufactured Number Average Value Number Average Value Number Average Value Number Average Value Number Average Value Number Average Value Number Average Value
LOANS ORIGINATED 11 $163,943 86 $119,554 62 $115,482 7 $75,890 0 $0 20 $122,190 28 $88,810 APPLICATIONS APPROVED, NOT ACCEPTED 1 $109,860 11 $127,403 15 $120,091 3 $102,717 0 $0 5 $86,820 4 $70,172 APPLICATIONS DENIED 2 $163,455 22 $95,522 63 $124,304 9 $48,902 1 $5,360 3 $154,077 20 $76,636 APPLICATIONS WITHDRAWN 2 $85,410 10 $111,471 33 $129,209 1 $89,100 0 $0 1 $142,020 5 $93,518 FILES CLOSED FOR INCOMPLETENESS 0 $0 2 $114,220 9 $148,569 0 $0 0 $0 1 $150,730 0 $0
Aggregated Statistics For Year 2005(Based on 1 partial tract) A) FHA, FSA/RHS & VA B) Conventional C) Refinancings D) Home Improvement Loans F) Non-occupant Loans on G) Loans On Manufactured Number Average Value Number Average Value Number Average Value Number Average Value Number Average Value Number Average Value
LOANS ORIGINATED 8 $144,448 81 $119,300 58 $111,642 5 $55,468 17 $112,149 22 $73,780 APPLICATIONS APPROVED, NOT ACCEPTED 3 $90,437 11 $99,450 17 $129,369 1 $23,450 3 $108,970 10 $73,622 APPLICATIONS DENIED 1 $113,880 27 $78,279 62 $128,210 12 $71,847 6 $94,233 33 $68,878 APPLICATIONS WITHDRAWN 1 $113,210 11 $142,263 31 $151,203 7 $52,253 3 $184,670 0 $0 FILES CLOSED FOR INCOMPLETENESS 0 $0 5 $73,822 23 $145,427 0 $0 2 $69,670 3 $98,700
Aggregated Statistics For Year 2004(Based on 1 partial tract) A) FHA, FSA/RHS & VA B) Conventional C) Refinancings D) Home Improvement Loans E) Loans on Dwellings For 5+ Families F) Non-occupant Loans on G) Loans On Manufactured Number Average Value Number Average Value Number Average Value Number Average Value Number Average Value Number Average Value Number Average Value
LOANS ORIGINATED 9 $134,650 46 $107,985 64 $111,507 4 $37,682 1 $914,410 9 $107,928 15 $70,741 APPLICATIONS APPROVED, NOT ACCEPTED 0 $0 9 $90,809 7 $107,471 2 $21,435 0 $0 1 $65,650 3 $54,263 APPLICATIONS DENIED 1 $71,680 17 $77,314 67 $105,034 10 $29,543 0 $0 4 $108,858 30 $62,278 APPLICATIONS WITHDRAWN 1 $176,180 7 $138,574 40 $111,505 3 $64,087 0 $0 1 $129,960 5 $94,858 FILES CLOSED FOR INCOMPLETENESS 0 $0 1 $82,400 21 $109,640 1 $106,510 0 $0 1 $121,920 3 $99,817
Aggregated Statistics For Year 2003(Based on 1 partial tract) A) FHA, FSA/RHS & VA B) Conventional C) Refinancings D) Home Improvement Loans F) Non-occupant Loans on Number Average Value Number Average Value Number Average Value Number Average Value Number Average Value
LOANS ORIGINATED 6 $97,917 62 $107,735 179 $109,224 5 $73,688 11 $103,104 APPLICATIONS APPROVED, NOT ACCEPTED 0 $0 7 $92,159 29 $114,322 0 $0 1 $219,060 APPLICATIONS DENIED 0 $0 12 $67,046 76 $104,513 3 $48,233 1 $115,890 APPLICATIONS WITHDRAWN 0 $0 2 $197,620 32 $122,654 1 $1,340 3 $114,777 FILES CLOSED FOR INCOMPLETENESS 1 $155,420 2 $134,650 5 $89,096 0 $0 0 $0
Aggregated Statistics For Year 2002(Based on 1 partial tract) A) FHA, FSA/RHS & VA B) Conventional C) Refinancings D) Home Improvement Loans E) Loans on Dwellings For 5+ Families F) Non-occupant Loans on Number Average Value Number Average Value Number Average Value Number Average Value Number Average Value Number Average Value
LOANS ORIGINATED 3 $126,833 52 $111,873 111 $101,535 6 $30,703 0 $0 12 $86,863 APPLICATIONS APPROVED, NOT ACCEPTED 1 $78,380 10 $77,909 17 $86,496 1 $4,690 0 $0 0 $0 APPLICATIONS DENIED 1 $66,990 23 $80,446 36 $100,727 7 $13,303 0 $0 2 $80,725 APPLICATIONS WITHDRAWN 1 $73,020 8 $118,489 19 $112,755 1 $20,100 1 $71,680 1 $33,490 FILES CLOSED FOR INCOMPLETENESS 0 $0 2 $119,240 3 $140,903 0 $0 0 $0 0 $0
Aggregated Statistics For Year 2001(Based on 1 partial tract) A) FHA, FSA/RHS & VA B) Conventional C) Refinancings D) Home Improvement Loans F) Non-occupant Loans on Number Average Value Number Average Value Number Average Value Number Average Value Number Average Value
LOANS ORIGINATED 3 $106,737 47 $102,124 94 $104,369 2 $11,725 9 $102,941 APPLICATIONS APPROVED, NOT ACCEPTED 1 $135,990 9 $65,352 8 $100,066 2 $24,115 1 $64,310 APPLICATIONS DENIED 1 $63,640 31 $52,231 21 $82,749 5 $3,752 1 $21,440 APPLICATIONS WITHDRAWN 0 $0 5 $75,966 19 $83,949 1 $670 1 $133,980 FILES CLOSED FOR INCOMPLETENESS 0 $0 0 $0 5 $79,986 0 $0 0 $0
Aggregated Statistics For Year 2000(Based on 1 partial tract) A) FHA, FSA/RHS & VA B) Conventional C) Refinancings D) Home Improvement Loans E) Loans on Dwellings For 5+ Families F) Non-occupant Loans on Number Average Value Number Average Value Number Average Value Number Average Value Number Average Value Number Average Value
LOANS ORIGINATED 7 $104,217 46 $64,034 21 $78,155 1 $13,400 1 $147,380 5 $60,558 APPLICATIONS APPROVED, NOT ACCEPTED 4 $43,040 17 $38,539 9 $79,420 1 $67,660 0 $0 1 $24,120 APPLICATIONS DENIED 3 $25,903 85 $45,845 15 $85,479 6 $17,975 0 $0 1 $63,640 APPLICATIONS WITHDRAWN 1 $47,560 8 $57,611 7 $61,823 1 $22,110 0 $0 1 $72,350 FILES CLOSED FOR INCOMPLETENESS 0 $0 0 $0 1 $225,090 0 $0 0 $0 0 $0
Aggregated Statistics For Year 1999(Based on 1 partial tract) A) FHA, FSA/RHS & VA B) Conventional C) Refinancings D) Home Improvement Loans F) Non-occupant Loans on Number Average Value Number Average Value Number Average Value Number Average Value Number Average Value
LOANS ORIGINATED 3 $99,083 34 $78,682 32 $87,929 5 $32,280 4 $98,018 APPLICATIONS APPROVED, NOT ACCEPTED 0 $0 17 $55,580 7 $86,176 4 $12,610 2 $95,830 APPLICATIONS DENIED 2 $92,805 73 $44,311 17 $53,958 7 $12,009 1 $32,950 APPLICATIONS WITHDRAWN 1 $88,770 5 $77,472 14 $97,464 3 $75,543 0 $0 FILES CLOSED FOR INCOMPLETENESS 0 $0 3 $134,050 5 $52,454 0 $0 0 $0
Detailed HMDA statistics for the following Tracts:
0021.00
Private Mortgage Insurance Companies Aggregated Statistics For Year 2009(Based on 1 partial tract) A) Conventional B) Refinancings D) Loans On Manufactured Number Average Value Number Average Value Number Average Value
LOANS ORIGINATED 2 $213,365 3 $227,097 1 $105,170 APPLICATIONS APPROVED, NOT ACCEPTED 1 $197,620 0 $0 0 $0 APPLICATIONS DENIED 0 $0 0 $0 0 $0 APPLICATIONS WITHDRAWN 0 $0 0 $0 0 $0 FILES CLOSED FOR INCOMPLETENESS 0 $0 0 $0 0 $0
Aggregated Statistics For Year 2008(Based on 1 partial tract) A) Conventional B) Refinancings D) Loans On Manufactured Number Average Value Number Average Value Number Average Value
LOANS ORIGINATED 5 $216,512 2 $167,810 1 $83,070 APPLICATIONS APPROVED, NOT ACCEPTED 0 $0 1 $225,760 0 $0 APPLICATIONS DENIED 0 $0 1 $226,430 1 $51,580 APPLICATIONS WITHDRAWN 1 $198,960 0 $0 0 $0 FILES CLOSED FOR INCOMPLETENESS 0 $0 1 $68,330 0 $0
Aggregated Statistics For Year 2007(Based on 1 partial tract) A) Conventional B) Refinancings C) Non-occupant Loans on D) Loans On Manufactured Number Average Value Number Average Value Number Average Value Number Average Value
LOANS ORIGINATED 17 $158,924 4 $216,042 3 $119,690 3 $109,193 APPLICATIONS APPROVED, NOT ACCEPTED 4 $167,475 1 $114,550 1 $66,990 1 $72,350 APPLICATIONS DENIED 1 $269,300 1 $87,090 0 $0 1 $87,090 APPLICATIONS WITHDRAWN 0 $0 0 $0 0 $0 0 $0 FILES CLOSED FOR INCOMPLETENESS 0 $0 0 $0 0 $0 0 $0
Aggregated Statistics For Year 2006(Based on 1 partial tract) A) Conventional B) Refinancings C) Non-occupant Loans on D) Loans On Manufactured Number Average Value Number Average Value Number Average Value Number Average Value
LOANS ORIGINATED 9 $149,462 3 $169,037 2 $66,320 1 $148,050 APPLICATIONS APPROVED, NOT ACCEPTED 2 $155,080 2 $154,410 0 $0 0 $0 APPLICATIONS DENIED 0 $0 0 $0 0 $0 0 $0 APPLICATIONS WITHDRAWN 0 $0 1 $120,580 0 $0 0 $0 FILES CLOSED FOR INCOMPLETENESS 0 $0 0 $0 0 $0 0 $0
Aggregated Statistics For Year 2005(Based on 1 partial tract) A) Conventional B) Refinancings C) Non-occupant Loans on D) Loans On Manufactured Number Average Value Number Average Value Number Average Value Number Average Value
LOANS ORIGINATED 14 $148,191 6 $128,620 2 $133,310 2 $88,760 APPLICATIONS APPROVED, NOT ACCEPTED 1 $125,270 0 $0 0 $0 0 $0 APPLICATIONS DENIED 0 $0 0 $0 0 $0 0 $0 APPLICATIONS WITHDRAWN 0 $0 1 $205,660 0 $0 0 $0 FILES CLOSED FOR INCOMPLETENESS 0 $0 0 $0 0 $0 0 $0
Aggregated Statistics For Year 2004(Based on 1 partial tract) A) Conventional B) Refinancings C) Non-occupant Loans on D) Loans On Manufactured Number Average Value Number Average Value Number Average Value Number Average Value
LOANS ORIGINATED 7 $150,631 5 $151,264 1 $185,560 1 $76,370 APPLICATIONS APPROVED, NOT ACCEPTED 1 $76,370 2 $180,205 0 $0 0 $0 APPLICATIONS DENIED 0 $0 0 $0 0 $0 0 $0 APPLICATIONS WITHDRAWN 0 $0 1 $100,480 0 $0 0 $0 FILES CLOSED FOR INCOMPLETENESS 0 $0 0 $0 0 $0 0 $0
Aggregated Statistics For Year 2003(Based on 1 partial tract) A) Conventional B) Refinancings C) Non-occupant Loans on Number Average Value Number Average Value Number Average Value
LOANS ORIGINATED 23 $120,291 23 $135,582 3 $102,717 APPLICATIONS APPROVED, NOT ACCEPTED 1 $286,050 3 $103,387 0 $0 APPLICATIONS DENIED 0 $0 1 $68,330 0 $0 APPLICATIONS WITHDRAWN 1 $76,370 2 $103,165 0 $0 FILES CLOSED FOR INCOMPLETENESS 0 $0 0 $0 0 $0
Aggregated Statistics For Year 2002(Based on 1 partial tract) A) Conventional B) Refinancings C) Non-occupant Loans on Number Average Value Number Average Value Number Average Value
LOANS ORIGINATED 21 $121,826 15 $116,205 2 $147,380 APPLICATIONS APPROVED, NOT ACCEPTED 3 $149,163 4 $166,805 0 $0 APPLICATIONS DENIED 1 $213,030 1 $368,440 0 $0 APPLICATIONS WITHDRAWN 1 $144,030 1 $329,590 0 $0 FILES CLOSED FOR INCOMPLETENESS 0 $0 0 $0 0 $0
Aggregated Statistics For Year 2001(Based on 1 partial tract) A) Conventional B) Refinancings C) Non-occupant Loans on Number Average Value Number Average Value Number Average Value
LOANS ORIGINATED 20 $109,763 8 $136,325 2 $91,775 APPLICATIONS APPROVED, NOT ACCEPTED 3 $147,823 1 $150,730 0 $0 APPLICATIONS DENIED 0 $0 0 $0 0 $0 APPLICATIONS WITHDRAWN 1 $77,040 0 $0 0 $0 FILES CLOSED FOR INCOMPLETENESS 0 $0 0 $0 0 $0
Aggregated Statistics For Year 2000(Based on 1 partial tract) A) Conventional B) Refinancings C) Non-occupant Loans on Number Average Value Number Average Value Number Average Value
LOANS ORIGINATED 11 $110,960 3 $107,630 3 $75,253 APPLICATIONS APPROVED, NOT ACCEPTED 1 $172,830 1 $200,300 0 $0 APPLICATIONS DENIED 1 $24,790 0 $0 0 $0 APPLICATIONS WITHDRAWN 1 $79,720 0 $0 0 $0 FILES CLOSED FOR INCOMPLETENESS 1 $105,170 0 $0 0 $0
Aggregated Statistics For Year 1999(Based on 1 partial tract) A) Conventional B) Refinancings C) Non-occupant Loans on Number Average Value Number Average Value Number Average Value
LOANS ORIGINATED 14 $111,299 11 $129,487 1 $145,930 APPLICATIONS APPROVED, NOT ACCEPTED 1 $66,580 1 $162,750 0 $0 APPLICATIONS DENIED 1 $70,610 0 $0 0 $0 APPLICATIONS WITHDRAWN 2 $109,955 0 $0 0 $0 FILES CLOSED FOR INCOMPLETENESS 0 $0 0 $0 0 $0
Detailed PMIC statistics for the following Tracts:
0021.00
Fire-safe hotels and motels in Page, Arizona:
Inn At Lake Powell Inc, 716 Rim VW Dr, Page, Arizona 86040 Phone: (928) 645-2466
Best Western At Lake Powell, 208 N Lk Powell Blvd, Page, Arizona 86040 Phone: (928) 645-5988, Fax: (928) 645-2578
Courtyard By Marriott, PO Box 4150, Page, Arizona 86040 Phone: (928) 645-5000, Fax: (928) 645-5004
Clarion Inn, 751 S Navajo Dr, Page, Arizona 86040 Phone: (928) 645-9000, Fax: (928) 645-1605
Comfort Inn & Suites, 890 Haul Rd, Page, Arizona 86040 Phone: (928) 645-6931, Fax: (928) 645-6928
Holiday Inn Express Page-Lake Powell, 643 South Lk Powell Blvd, Page, Arizona 86040 Phone: (928) 645-9900, Fax: (928) 645-1688
LaQuinta, 70 Kaibab Rd, Page, Arizona 86040 Phone: (928) 645-9898, Fax: (928) 645-0068
La Quinta Inn and Suites, 70 Kaibab Rd, Page, Arizona 86040 Phone: (928) 645-9898, Fax: (928) 645-0068
5 other hotels and motels
All 13 fire-safe hotels and motels in Page, Arizona Page compared to Arizona state average:
Unemployed percentage below state average. Black race population percentage significantly below state average. Hispanic race population percentage significantly below state average. Foreign-born population percentage significantly below state average. Length of stay since moving in significantly above state average. Number of rooms per house below state average.
#30 on the list of "Top 100 cities with shortest commuting times (pop. 5,000+)"
#50 on the list of "Top 101 cities with largest percentage of males in occupations: installation, maintenance, and repair occupations (population 5,000+)"
#54 on the list of "Top 101 cities with largest percentage of males in industries: accommodation and food services (population 5,000+)"
#54 on the list of "Top 101 cities with largest percentage of males in industries: utilities (population 5,000+)"
#81 on the list of "Top 101 cities with the highest number of murders per 100,000 residents, excludes tourist destinations and others with a lot of outsiders visiting based on city industries data (population 5,000+)"
#87 on the list of "Top 101 cities with the largest percentage of mobile homes (2,000+ housing units)"
#94 on the list of "Top 101 cities with the most people taking a motorcycle to work (population 5,000+)"
#4 on the list of "Top 101 counties with the highest Ozone (1-hour) air pollution readings in 2012 (ppm)"
#33 on the list of "Top 101 counties with the lowest Particulate Matter (PM2.5 ) Annual air pollution readings in 2012 (µg/m3 )"
#43 on the list of "Top 101 counties with the largest decrease in the number of births per 1000 residents 2000-2006 to 2007-2013 (pop 50,000+)"
#44 on the list of "Top 101 counties with the lowest number of deaths per 1000 residents 2007-2013 (pop. 50,000+)"
#57 on the list of "Top 101 counties with the highest Particulate Matter (PM10 ) Annual air pollution readings in 2012 (µg/m3 )"
Top Patent Applicants
Terry Spangler (1)
Harold Schafer (1)
Derik Losinger (1)
Jarrett Edwards (1)
James Jeffery Hunter (1)
Total of 5 patent applications in 2008-2024.
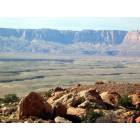
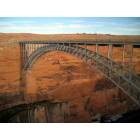
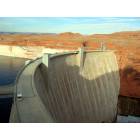
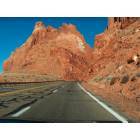
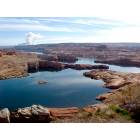


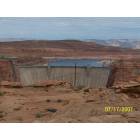
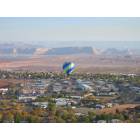
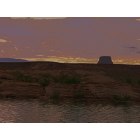
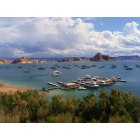
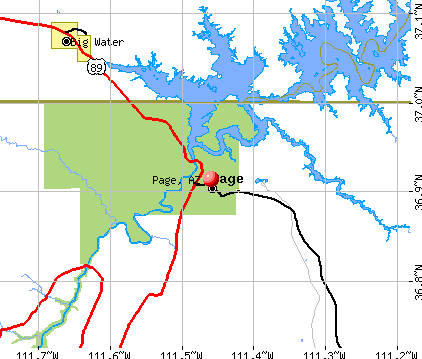


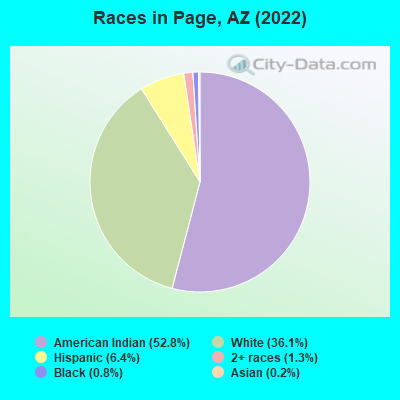
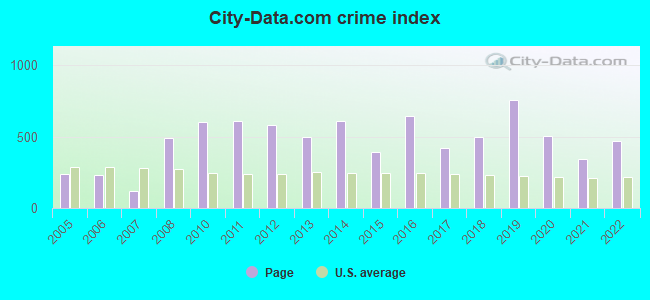
 Recent articles from our blog. Our writers, many of them Ph.D. graduates or candidates, create easy-to-read articles on a wide variety of topics.

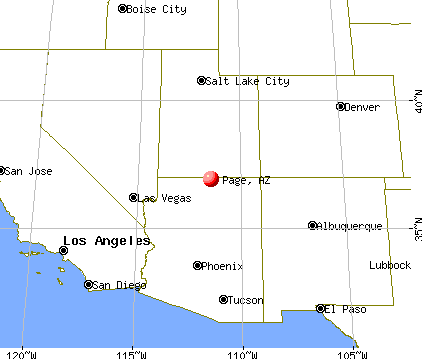
 (119.0 miles
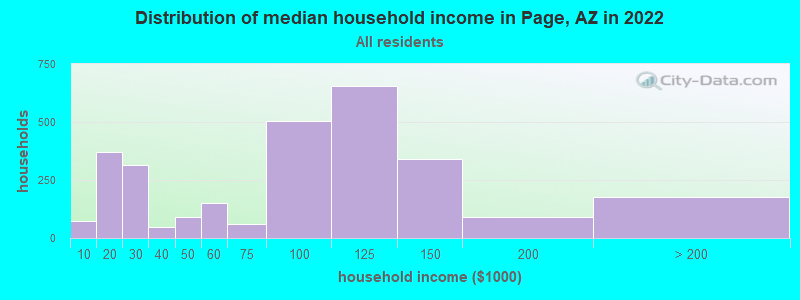
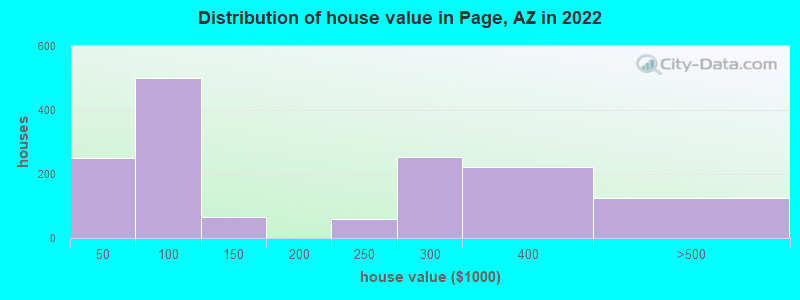
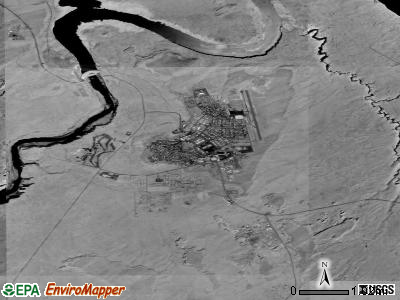
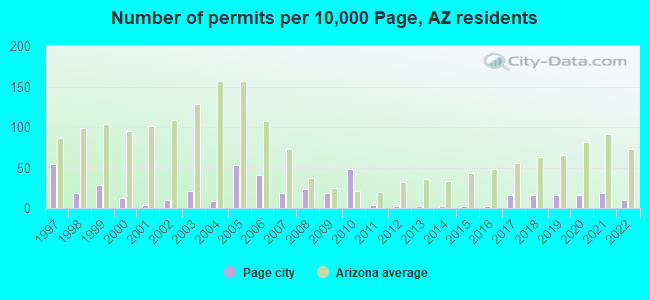
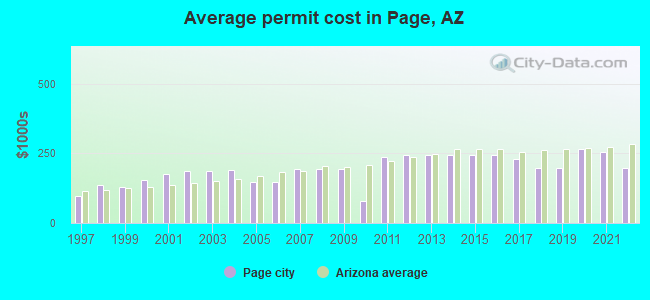
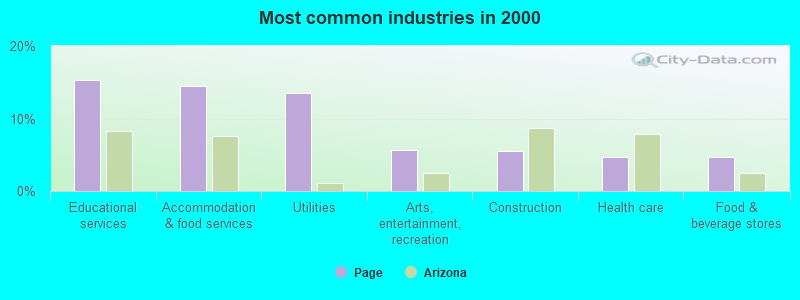
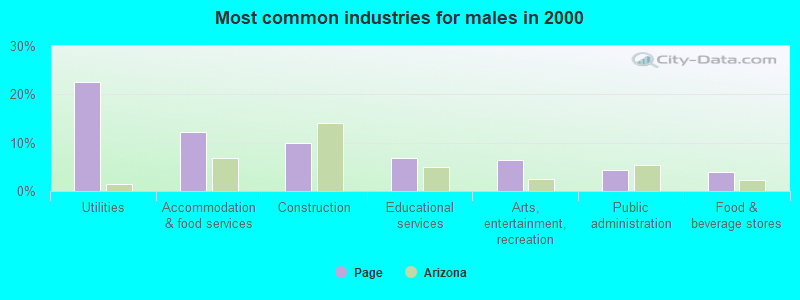
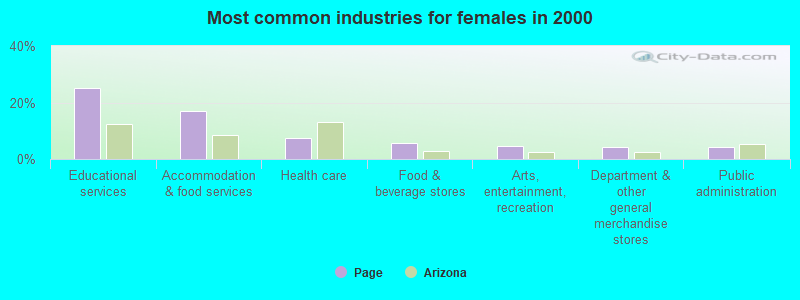
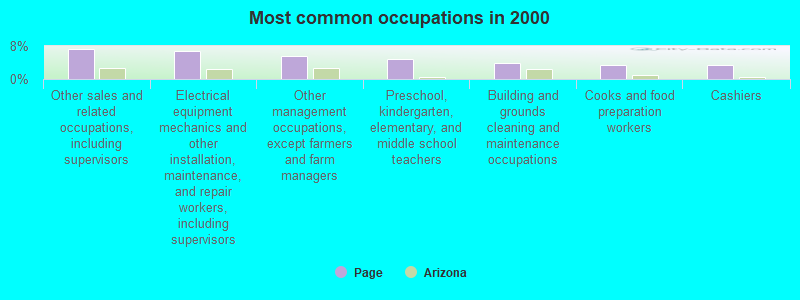
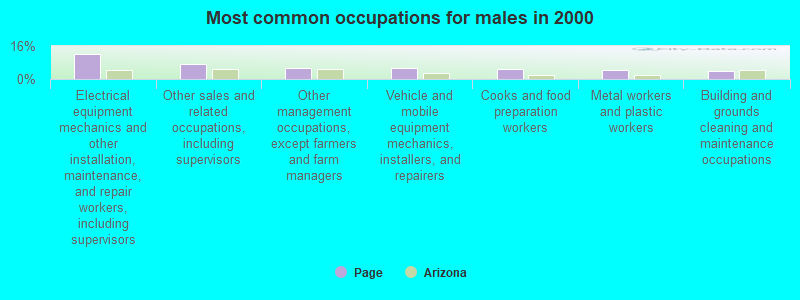
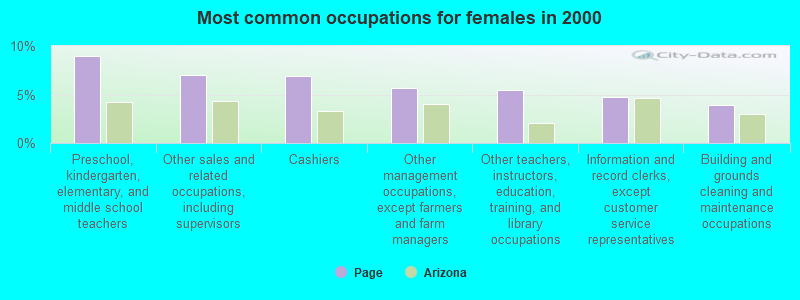
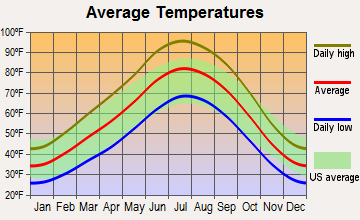
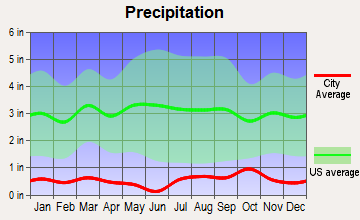
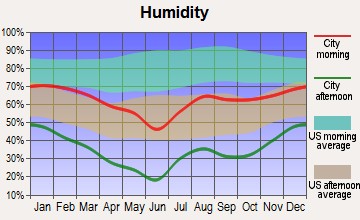
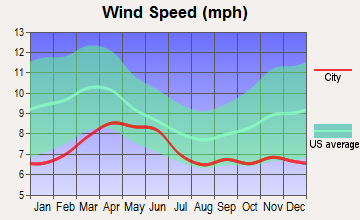
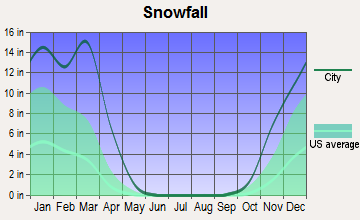
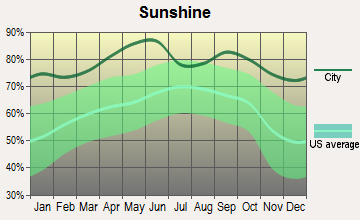
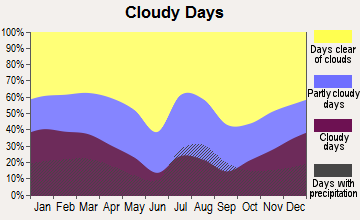
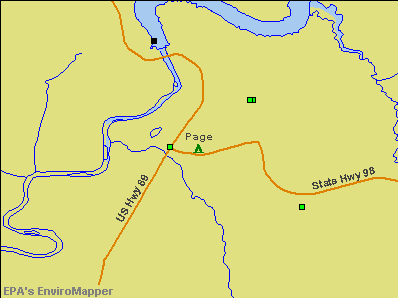

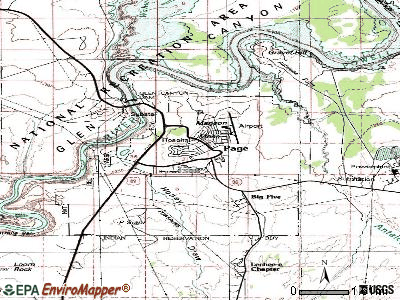
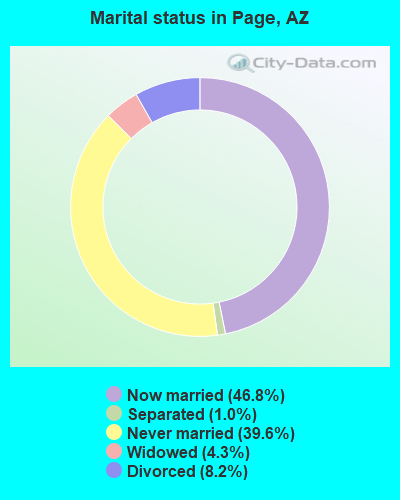
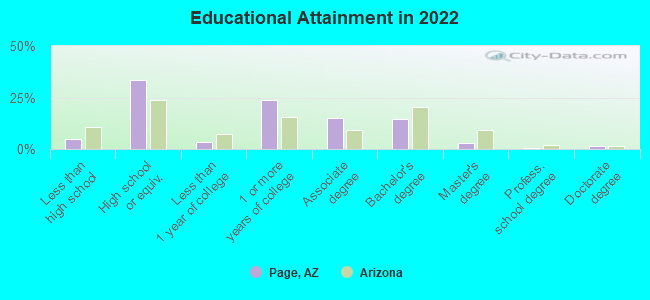
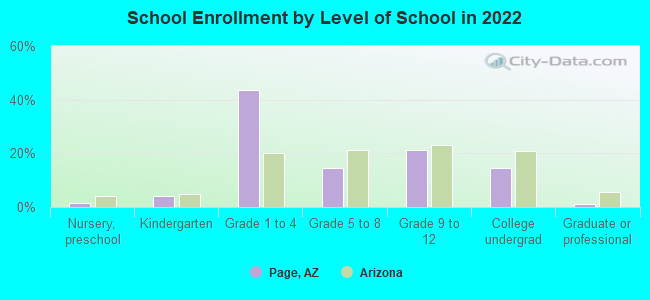
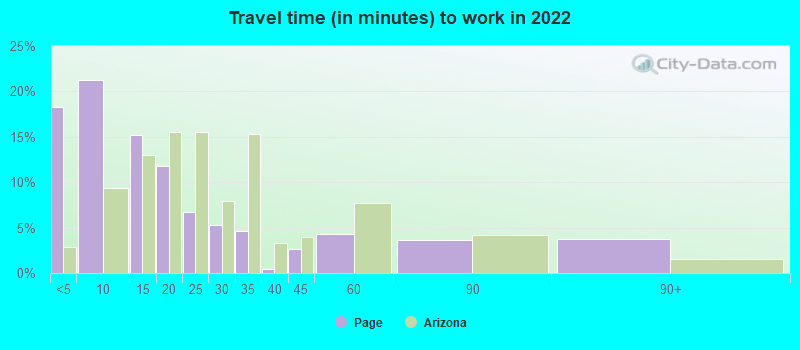
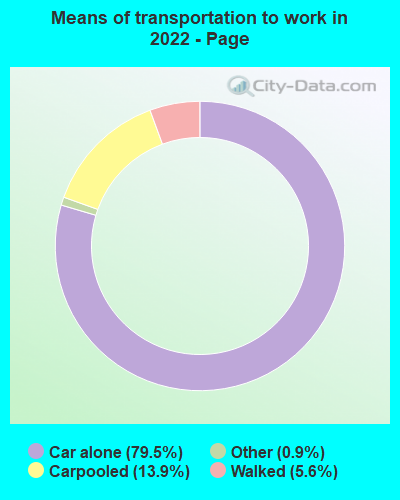
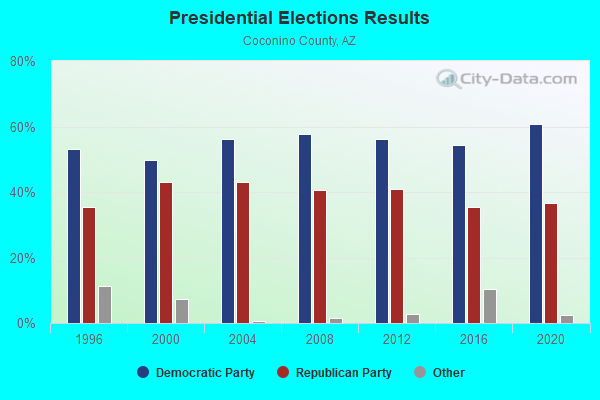
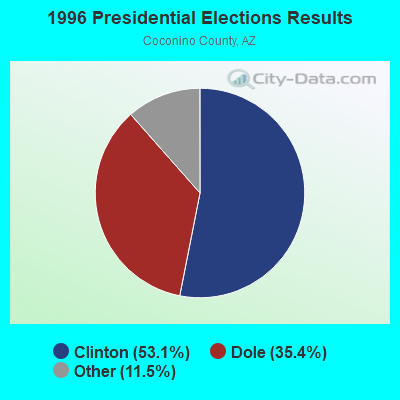
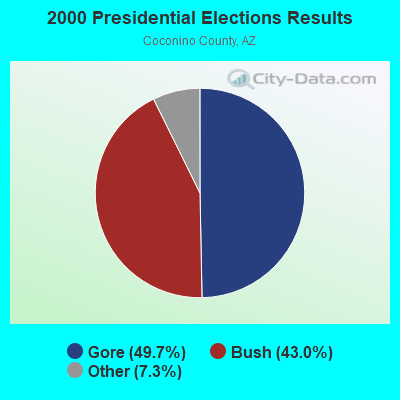
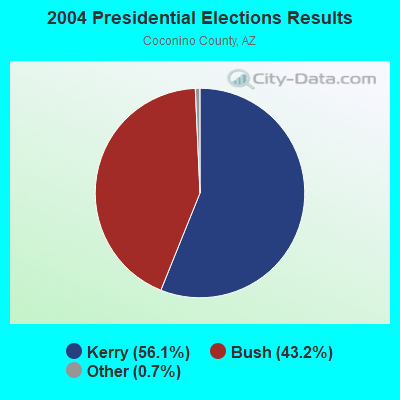
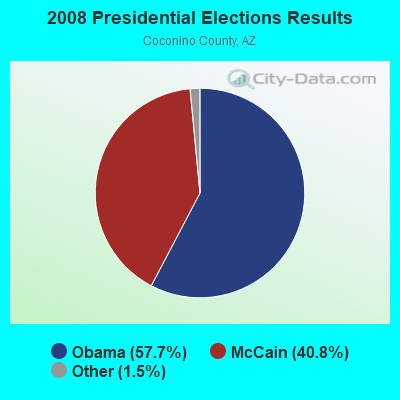
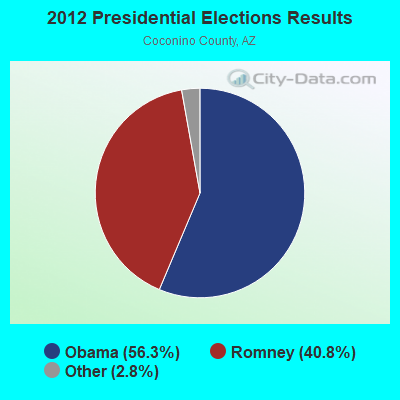
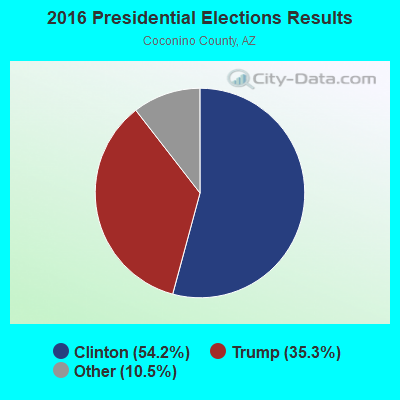
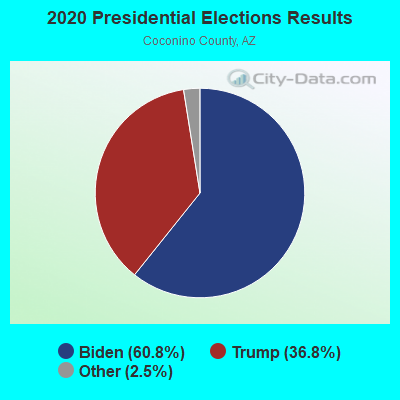
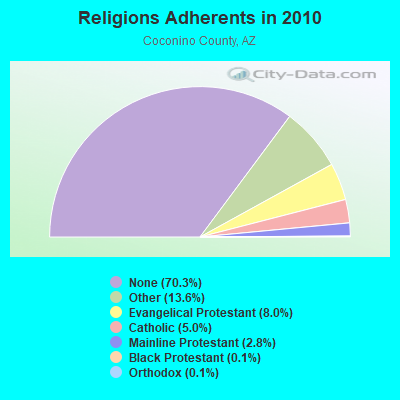
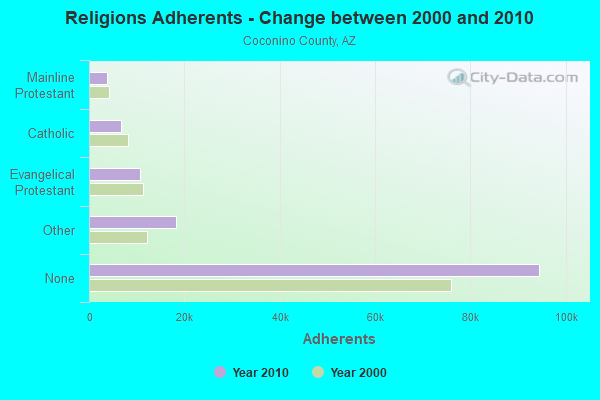
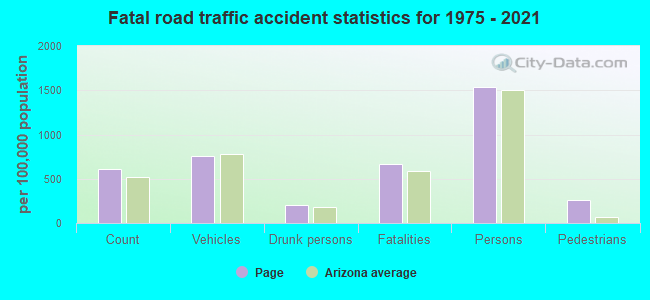
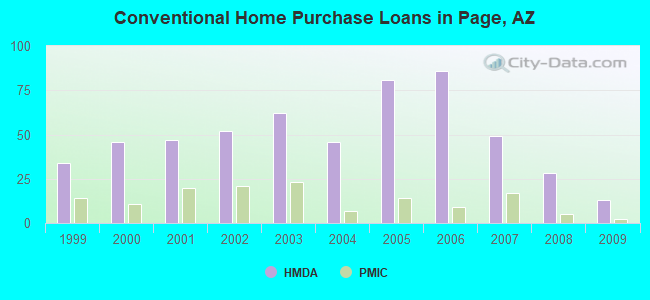
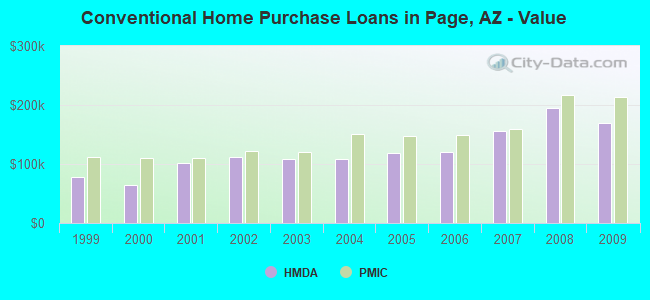
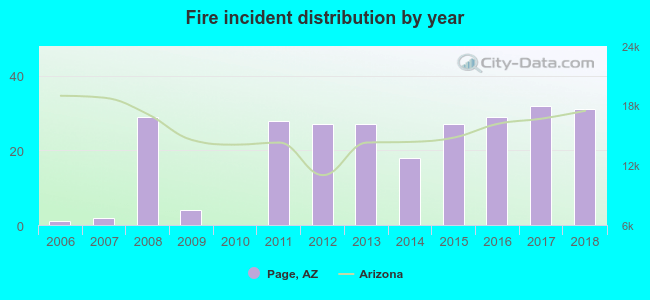 Based on the data from the years 2006 - 2018 the average number of fire incidents per year is 20. The highest number of fire incidents - 32 took place in 2017, and the least - 0 in 2010. The data has a rising trend.
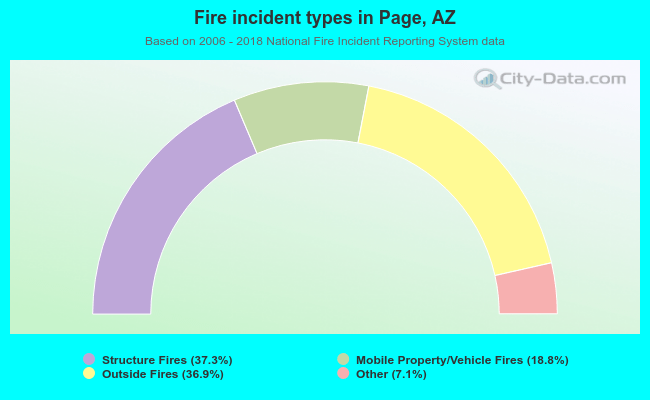 When looking into fire subcategories, the most reports belonged to: Structure Fires (37.3%), and Outside Fires (36.9%).