Pearl City, Hawaii Submit your own pictures of this place and show them to the world
OSM Map
General Map
Google Map
MSN Map
OSM Map
General Map
Google Map
MSN Map
OSM Map
General Map
Google Map
MSN Map
OSM Map
General Map
Google Map
MSN Map
Please wait while loading the map...
Population in 2010: 47,698. Population change since 2000: +54.0%Males: 23,705 Females: 23,993
March 2022 cost of living index in Pearl City: 136.7 (high, U.S. average is 100) Percentage of residents living in poverty in 2022: 4.2%for White Non-Hispanic residents , 6.4% for Black residents , 3.7% for Hispanic or Latino residents , 2.1% for Native Hawaiian and other Pacific Islander residents , 8.7% for other race residents , 4.4% for two or more races residents )
Profiles of local businesses
Business Search - 14 Million verified businesses
Data:
Median household income ($)
Median household income (% change since 2000)
Household income diversity
Ratio of average income to average house value (%)
Ratio of average income to average rent
Median household income ($) - White
Median household income ($) - Black or African American
Median household income ($) - Asian
Median household income ($) - Hispanic or Latino
Median household income ($) - American Indian and Alaska Native
Median household income ($) - Multirace
Median household income ($) - Other Race
Median household income for houses/condos with a mortgage ($)
Median household income for apartments without a mortgage ($)
Races - White alone (%)
Races - White alone (% change since 2000)
Races - Black alone (%)
Races - Black alone (% change since 2000)
Races - American Indian alone (%)
Races - American Indian alone (% change since 2000)
Races - Asian alone (%)
Races - Asian alone (% change since 2000)
Races - Hispanic (%)
Races - Hispanic (% change since 2000)
Races - Native Hawaiian and Other Pacific Islander alone (%)
Races - Native Hawaiian and Other Pacific Islander alone (% change since 2000)
Races - Two or more races (%)
Races - Two or more races (% change since 2000)
Races - Other race alone (%)
Races - Other race alone (% change since 2000)
Racial diversity
Unemployment (%)
Unemployment (% change since 2000)
Unemployment (%) - White
Unemployment (%) - Black or African American
Unemployment (%) - Asian
Unemployment (%) - Hispanic or Latino
Unemployment (%) - American Indian and Alaska Native
Unemployment (%) - Multirace
Unemployment (%) - Other Race
Population density (people per square mile)
Population - Males (%)
Population - Females (%)
Population - Males (%) - White
Population - Males (%) - Black or African American
Population - Males (%) - Asian
Population - Males (%) - Hispanic or Latino
Population - Males (%) - American Indian and Alaska Native
Population - Males (%) - Multirace
Population - Males (%) - Other Race
Population - Females (%) - White
Population - Females (%) - Black or African American
Population - Females (%) - Asian
Population - Females (%) - Hispanic or Latino
Population - Females (%) - American Indian and Alaska Native
Population - Females (%) - Multirace
Population - Females (%) - Other Race
Coronavirus confirmed cases (Apr 27, 2024)
Deaths caused by coronavirus (Apr 27, 2024)
Coronavirus confirmed cases (per 100k population) (Apr 27, 2024)
Deaths caused by coronavirus (per 100k population) (Apr 27, 2024)
Daily increase in number of cases (Apr 27, 2024)
Weekly increase in number of cases (Apr 27, 2024)
Cases doubled (in days) (Apr 27, 2024)
Hospitalized patients (Apr 18, 2022)
Negative test results (Apr 18, 2022)
Total test results (Apr 18, 2022)
COVID Vaccine doses distributed (per 100k population) (Sep 19, 2023)
COVID Vaccine doses administered (per 100k population) (Sep 19, 2023)
COVID Vaccine doses distributed (Sep 19, 2023)
COVID Vaccine doses administered (Sep 19, 2023)
Likely homosexual households (%)
Likely homosexual households (% change since 2000)
Likely homosexual households - Lesbian couples (%)
Likely homosexual households - Lesbian couples (% change since 2000)
Likely homosexual households - Gay men (%)
Likely homosexual households - Gay men (% change since 2000)
Cost of living index
Median gross rent ($)
Median contract rent ($)
Median monthly housing costs ($)
Median house or condo value ($)
Median house or condo value ($ change since 2000)
Mean house or condo value by units in structure - 1, detached ($)
Mean house or condo value by units in structure - 1, attached ($)
Mean house or condo value by units in structure - 2 ($)
Mean house or condo value by units in structure by units in structure - 3 or 4 ($)
Mean house or condo value by units in structure - 5 or more ($)
Mean house or condo value by units in structure - Boat, RV, van, etc. ($)
Mean house or condo value by units in structure - Mobile home ($)
Median house or condo value ($) - White
Median house or condo value ($) - Black or African American
Median house or condo value ($) - Asian
Median house or condo value ($) - Hispanic or Latino
Median house or condo value ($) - American Indian and Alaska Native
Median house or condo value ($) - Multirace
Median house or condo value ($) - Other Race
Median resident age
Resident age diversity
Median resident age - Males
Median resident age - Females
Median resident age - White
Median resident age - Black or African American
Median resident age - Asian
Median resident age - Hispanic or Latino
Median resident age - American Indian and Alaska Native
Median resident age - Multirace
Median resident age - Other Race
Median resident age - Males - White
Median resident age - Males - Black or African American
Median resident age - Males - Asian
Median resident age - Males - Hispanic or Latino
Median resident age - Males - American Indian and Alaska Native
Median resident age - Males - Multirace
Median resident age - Males - Other Race
Median resident age - Females - White
Median resident age - Females - Black or African American
Median resident age - Females - Asian
Median resident age - Females - Hispanic or Latino
Median resident age - Females - American Indian and Alaska Native
Median resident age - Females - Multirace
Median resident age - Females - Other Race
Commute - mean travel time to work (minutes)
Travel time to work - Less than 5 minutes (%)
Travel time to work - Less than 5 minutes (% change since 2000)
Travel time to work - 5 to 9 minutes (%)
Travel time to work - 5 to 9 minutes (% change since 2000)
Travel time to work - 10 to 19 minutes (%)
Travel time to work - 10 to 19 minutes (% change since 2000)
Travel time to work - 20 to 29 minutes (%)
Travel time to work - 20 to 29 minutes (% change since 2000)
Travel time to work - 30 to 39 minutes (%)
Travel time to work - 30 to 39 minutes (% change since 2000)
Travel time to work - 40 to 59 minutes (%)
Travel time to work - 40 to 59 minutes (% change since 2000)
Travel time to work - 60 to 89 minutes (%)
Travel time to work - 60 to 89 minutes (% change since 2000)
Travel time to work - 90 or more minutes (%)
Travel time to work - 90 or more minutes (% change since 2000)
Marital status - Never married (%)
Marital status - Now married (%)
Marital status - Separated (%)
Marital status - Widowed (%)
Marital status - Divorced (%)
Median family income ($)
Median family income (% change since 2000)
Median non-family income ($)
Median non-family income (% change since 2000)
Median per capita income ($)
Median per capita income (% change since 2000)
Median family income ($) - White
Median family income ($) - Black or African American
Median family income ($) - Asian
Median family income ($) - Hispanic or Latino
Median family income ($) - American Indian and Alaska Native
Median family income ($) - Multirace
Median family income ($) - Other Race
Median year house/condo built
Median year apartment built
Year house built - Built 2005 or later (%)
Year house built - Built 2000 to 2004 (%)
Year house built - Built 1990 to 1999 (%)
Year house built - Built 1980 to 1989 (%)
Year house built - Built 1970 to 1979 (%)
Year house built - Built 1960 to 1969 (%)
Year house built - Built 1950 to 1959 (%)
Year house built - Built 1940 to 1949 (%)
Year house built - Built 1939 or earlier (%)
Average household size
Household density (households per square mile)
Average household size - White
Average household size - Black or African American
Average household size - Asian
Average household size - Hispanic or Latino
Average household size - American Indian and Alaska Native
Average household size - Multirace
Average household size - Other Race
Occupied housing units (%)
Vacant housing units (%)
Owner occupied housing units (%)
Renter occupied housing units (%)
Vacancy status - For rent (%)
Vacancy status - For sale only (%)
Vacancy status - Rented or sold, not occupied (%)
Vacancy status - For seasonal, recreational, or occasional use (%)
Vacancy status - For migrant workers (%)
Vacancy status - Other vacant (%)
Residents with income below the poverty level (%)
Residents with income below 50% of the poverty level (%)
Children below poverty level (%)
Poor families by family type - Married-couple family (%)
Poor families by family type - Male, no wife present (%)
Poor families by family type - Female, no husband present (%)
Poverty status for native-born residents (%)
Poverty status for foreign-born residents (%)
Poverty among high school graduates not in families (%)
Poverty among people who did not graduate high school not in families (%)
Residents with income below the poverty level (%) - White
Residents with income below the poverty level (%) - Black or African American
Residents with income below the poverty level (%) - Asian
Residents with income below the poverty level (%) - Hispanic or Latino
Residents with income below the poverty level (%) - American Indian and Alaska Native
Residents with income below the poverty level (%) - Multirace
Residents with income below the poverty level (%) - Other Race
Air pollution - Air Quality Index (AQI)
Air pollution - CO
Air pollution - NO2
Air pollution - SO2
Air pollution - Ozone
Air pollution - PM10
Air pollution - PM25
Air pollution - Pb
Crime - Murders per 100,000 population
Crime - Rapes per 100,000 population
Crime - Robberies per 100,000 population
Crime - Assaults per 100,000 population
Crime - Burglaries per 100,000 population
Crime - Thefts per 100,000 population
Crime - Auto thefts per 100,000 population
Crime - Arson per 100,000 population
Crime - City-data.com crime index
Crime - Violent crime index
Crime - Property crime index
Crime - Murders per 100,000 population (5 year average)
Crime - Rapes per 100,000 population (5 year average)
Crime - Robberies per 100,000 population (5 year average)
Crime - Assaults per 100,000 population (5 year average)
Crime - Burglaries per 100,000 population (5 year average)
Crime - Thefts per 100,000 population (5 year average)
Crime - Auto thefts per 100,000 population (5 year average)
Crime - Arson per 100,000 population (5 year average)
Crime - City-data.com crime index (5 year average)
Crime - Violent crime index (5 year average)
Crime - Property crime index (5 year average)
1996 Presidential Elections Results (%) - Democratic Party (Clinton)
1996 Presidential Elections Results (%) - Republican Party (Dole)
1996 Presidential Elections Results (%) - Other
2000 Presidential Elections Results (%) - Democratic Party (Gore)
2000 Presidential Elections Results (%) - Republican Party (Bush)
2000 Presidential Elections Results (%) - Other
2004 Presidential Elections Results (%) - Democratic Party (Kerry)
2004 Presidential Elections Results (%) - Republican Party (Bush)
2004 Presidential Elections Results (%) - Other
2008 Presidential Elections Results (%) - Democratic Party (Obama)
2008 Presidential Elections Results (%) - Republican Party (McCain)
2008 Presidential Elections Results (%) - Other
2012 Presidential Elections Results (%) - Democratic Party (Obama)
2012 Presidential Elections Results (%) - Republican Party (Romney)
2012 Presidential Elections Results (%) - Other
2016 Presidential Elections Results (%) - Democratic Party (Clinton)
2016 Presidential Elections Results (%) - Republican Party (Trump)
2016 Presidential Elections Results (%) - Other
2020 Presidential Elections Results (%) - Democratic Party (Biden)
2020 Presidential Elections Results (%) - Republican Party (Trump)
2020 Presidential Elections Results (%) - Other
Ancestries Reported - Arab (%)
Ancestries Reported - Czech (%)
Ancestries Reported - Danish (%)
Ancestries Reported - Dutch (%)
Ancestries Reported - English (%)
Ancestries Reported - French (%)
Ancestries Reported - French Canadian (%)
Ancestries Reported - German (%)
Ancestries Reported - Greek (%)
Ancestries Reported - Hungarian (%)
Ancestries Reported - Irish (%)
Ancestries Reported - Italian (%)
Ancestries Reported - Lithuanian (%)
Ancestries Reported - Norwegian (%)
Ancestries Reported - Polish (%)
Ancestries Reported - Portuguese (%)
Ancestries Reported - Russian (%)
Ancestries Reported - Scotch-Irish (%)
Ancestries Reported - Scottish (%)
Ancestries Reported - Slovak (%)
Ancestries Reported - Subsaharan African (%)
Ancestries Reported - Swedish (%)
Ancestries Reported - Swiss (%)
Ancestries Reported - Ukrainian (%)
Ancestries Reported - United States (%)
Ancestries Reported - Welsh (%)
Ancestries Reported - West Indian (%)
Ancestries Reported - Other (%)
Educational Attainment - No schooling completed (%)
Educational Attainment - Less than high school (%)
Educational Attainment - High school or equivalent (%)
Educational Attainment - Less than 1 year of college (%)
Educational Attainment - 1 or more years of college (%)
Educational Attainment - Associate degree (%)
Educational Attainment - Bachelor's degree (%)
Educational Attainment - Master's degree (%)
Educational Attainment - Professional school degree (%)
Educational Attainment - Doctorate degree (%)
School Enrollment - Nursery, preschool (%)
School Enrollment - Kindergarten (%)
School Enrollment - Grade 1 to 4 (%)
School Enrollment - Grade 5 to 8 (%)
School Enrollment - Grade 9 to 12 (%)
School Enrollment - College undergrad (%)
School Enrollment - Graduate or professional (%)
School Enrollment - Not enrolled in school (%)
School enrollment - Public schools (%)
School enrollment - Private schools (%)
School enrollment - Not enrolled (%)
Median number of rooms in houses and condos
Median number of rooms in apartments
Housing units lacking complete plumbing facilities (%)
Housing units lacking complete kitchen facilities (%)
Density of houses
Urban houses (%)
Rural houses (%)
Households with people 60 years and over (%)
Households with people 65 years and over (%)
Households with people 75 years and over (%)
Households with one or more nonrelatives (%)
Households with no nonrelatives (%)
Population in households (%)
Family households (%)
Nonfamily households (%)
Population in families (%)
Family households with own children (%)
Median number of bedrooms in owner occupied houses
Mean number of bedrooms in owner occupied houses
Median number of bedrooms in renter occupied houses
Mean number of bedrooms in renter occupied houses
Median number of vehichles in owner occupied houses
Mean number of vehichles in owner occupied houses
Median number of vehichles in renter occupied houses
Mean number of vehichles in renter occupied houses
Mortgage status - with mortgage (%)
Mortgage status - with second mortgage (%)
Mortgage status - with home equity loan (%)
Mortgage status - with both second mortgage and home equity loan (%)
Mortgage status - without a mortgage (%)
Average family size
Average family size - White
Average family size - Black or African American
Average family size - Asian
Average family size - Hispanic or Latino
Average family size - American Indian and Alaska Native
Average family size - Multirace
Average family size - Other Race
Geographical mobility - Same house 1 year ago (%)
Geographical mobility - Moved within same county (%)
Geographical mobility - Moved from different county within same state (%)
Geographical mobility - Moved from different state (%)
Geographical mobility - Moved from abroad (%)
Place of birth - Born in state of residence (%)
Place of birth - Born in other state (%)
Place of birth - Native, outside of US (%)
Place of birth - Foreign born (%)
Housing units in structures - 1, detached (%)
Housing units in structures - 1, attached (%)
Housing units in structures - 2 (%)
Housing units in structures - 3 or 4 (%)
Housing units in structures - 5 to 9 (%)
Housing units in structures - 10 to 19 (%)
Housing units in structures - 20 to 49 (%)
Housing units in structures - 50 or more (%)
Housing units in structures - Mobile home (%)
Housing units in structures - Boat, RV, van, etc. (%)
House/condo owner moved in on average (years ago)
Renter moved in on average (years ago)
Year householder moved into unit - Moved in 1999 to March 2000 (%)
Year householder moved into unit - Moved in 1995 to 1998 (%)
Year householder moved into unit - Moved in 1990 to 1994 (%)
Year householder moved into unit - Moved in 1980 to 1989 (%)
Year householder moved into unit - Moved in 1970 to 1979 (%)
Year householder moved into unit - Moved in 1969 or earlier (%)
Means of transportation to work - Drove car alone (%)
Means of transportation to work - Carpooled (%)
Means of transportation to work - Public transportation (%)
Means of transportation to work - Bus or trolley bus (%)
Means of transportation to work - Streetcar or trolley car (%)
Means of transportation to work - Subway or elevated (%)
Means of transportation to work - Railroad (%)
Means of transportation to work - Ferryboat (%)
Means of transportation to work - Taxicab (%)
Means of transportation to work - Motorcycle (%)
Means of transportation to work - Bicycle (%)
Means of transportation to work - Walked (%)
Means of transportation to work - Other means (%)
Working at home (%)
Industry diversity
Most Common Industries - Agriculture, forestry, fishing and hunting, and mining (%)
Most Common Industries - Agriculture, forestry, fishing and hunting (%)
Most Common Industries - Mining, quarrying, and oil and gas extraction (%)
Most Common Industries - Construction (%)
Most Common Industries - Manufacturing (%)
Most Common Industries - Wholesale trade (%)
Most Common Industries - Retail trade (%)
Most Common Industries - Transportation and warehousing, and utilities (%)
Most Common Industries - Transportation and warehousing (%)
Most Common Industries - Utilities (%)
Most Common Industries - Information (%)
Most Common Industries - Finance and insurance, and real estate and rental and leasing (%)
Most Common Industries - Finance and insurance (%)
Most Common Industries - Real estate and rental and leasing (%)
Most Common Industries - Professional, scientific, and management, and administrative and waste management services (%)
Most Common Industries - Professional, scientific, and technical services (%)
Most Common Industries - Management of companies and enterprises (%)
Most Common Industries - Administrative and support and waste management services (%)
Most Common Industries - Educational services, and health care and social assistance (%)
Most Common Industries - Educational services (%)
Most Common Industries - Health care and social assistance (%)
Most Common Industries - Arts, entertainment, and recreation, and accommodation and food services (%)
Most Common Industries - Arts, entertainment, and recreation (%)
Most Common Industries - Accommodation and food services (%)
Most Common Industries - Other services, except public administration (%)
Most Common Industries - Public administration (%)
Occupation diversity
Most Common Occupations - Management, business, science, and arts occupations (%)
Most Common Occupations - Management, business, and financial occupations (%)
Most Common Occupations - Management occupations (%)
Most Common Occupations - Business and financial operations occupations (%)
Most Common Occupations - Computer, engineering, and science occupations (%)
Most Common Occupations - Computer and mathematical occupations (%)
Most Common Occupations - Architecture and engineering occupations (%)
Most Common Occupations - Life, physical, and social science occupations (%)
Most Common Occupations - Education, legal, community service, arts, and media occupations (%)
Most Common Occupations - Community and social service occupations (%)
Most Common Occupations - Legal occupations (%)
Most Common Occupations - Education, training, and library occupations (%)
Most Common Occupations - Arts, design, entertainment, sports, and media occupations (%)
Most Common Occupations - Healthcare practitioners and technical occupations (%)
Most Common Occupations - Health diagnosing and treating practitioners and other technical occupations (%)
Most Common Occupations - Health technologists and technicians (%)
Most Common Occupations - Service occupations (%)
Most Common Occupations - Healthcare support occupations (%)
Most Common Occupations - Protective service occupations (%)
Most Common Occupations - Fire fighting and prevention, and other protective service workers including supervisors (%)
Most Common Occupations - Law enforcement workers including supervisors (%)
Most Common Occupations - Food preparation and serving related occupations (%)
Most Common Occupations - Building and grounds cleaning and maintenance occupations (%)
Most Common Occupations - Personal care and service occupations (%)
Most Common Occupations - Sales and office occupations (%)
Most Common Occupations - Sales and related occupations (%)
Most Common Occupations - Office and administrative support occupations (%)
Most Common Occupations - Natural resources, construction, and maintenance occupations (%)
Most Common Occupations - Farming, fishing, and forestry occupations (%)
Most Common Occupations - Construction and extraction occupations (%)
Most Common Occupations - Installation, maintenance, and repair occupations (%)
Most Common Occupations - Production, transportation, and material moving occupations (%)
Most Common Occupations - Production occupations (%)
Most Common Occupations - Transportation occupations (%)
Most Common Occupations - Material moving occupations (%)
People in Group quarters - Institutionalized population (%)
People in Group quarters - Correctional institutions (%)
People in Group quarters - Federal prisons and detention centers (%)
People in Group quarters - Halfway houses (%)
People in Group quarters - Local jails and other confinement facilities (including police lockups) (%)
People in Group quarters - Military disciplinary barracks (%)
People in Group quarters - State prisons (%)
People in Group quarters - Other types of correctional institutions (%)
People in Group quarters - Nursing homes (%)
People in Group quarters - Hospitals/wards, hospices, and schools for the handicapped (%)
People in Group quarters - Hospitals/wards and hospices for chronically ill (%)
People in Group quarters - Hospices or homes for chronically ill (%)
People in Group quarters - Military hospitals or wards for chronically ill (%)
People in Group quarters - Other hospitals or wards for chronically ill (%)
People in Group quarters - Hospitals or wards for drug/alcohol abuse (%)
People in Group quarters - Mental (Psychiatric) hospitals or wards (%)
People in Group quarters - Schools, hospitals, or wards for the mentally retarded (%)
People in Group quarters - Schools, hospitals, or wards for the physically handicapped (%)
People in Group quarters - Institutions for the deaf (%)
People in Group quarters - Institutions for the blind (%)
People in Group quarters - Orthopedic wards and institutions for the physically handicapped (%)
People in Group quarters - Wards in general hospitals for patients who have no usual home elsewhere (%)
People in Group quarters - Wards in military hospitals for patients who have no usual home elsewhere (%)
People in Group quarters - Juvenile institutions (%)
People in Group quarters - Long-term care (%)
People in Group quarters - Homes for abused, dependent, and neglected children (%)
People in Group quarters - Residential treatment centers for emotionally disturbed children (%)
People in Group quarters - Training schools for juvenile delinquents (%)
People in Group quarters - Short-term care, detention or diagnostic centers for delinquent children (%)
People in Group quarters - Type of juvenile institution unknown (%)
People in Group quarters - Noninstitutionalized population (%)
People in Group quarters - College dormitories (includes college quarters off campus) (%)
People in Group quarters - Military quarters (%)
People in Group quarters - On base (%)
People in Group quarters - Barracks, unaccompanied personnel housing (UPH), (Enlisted/Officer), ;and similar group living quarters for military personnel (%)
People in Group quarters - Transient quarters for temporary residents (%)
People in Group quarters - Military ships (%)
People in Group quarters - Group homes (%)
People in Group quarters - Homes or halfway houses for drug/alcohol abuse (%)
People in Group quarters - Homes for the mentally ill (%)
People in Group quarters - Homes for the mentally retarded (%)
People in Group quarters - Homes for the physically handicapped (%)
People in Group quarters - Other group homes (%)
People in Group quarters - Religious group quarters (%)
People in Group quarters - Dormitories (%)
People in Group quarters - Agriculture workers' dormitories on farms (%)
People in Group quarters - Job Corps and vocational training facilities (%)
People in Group quarters - Other workers' dormitories (%)
People in Group quarters - Crews of maritime vessels (%)
People in Group quarters - Other nonhousehold living situations (%)
People in Group quarters - Other noninstitutional group quarters (%)
Residents speaking English at home (%)
Residents speaking English at home - Born in the United States (%)
Residents speaking English at home - Native, born elsewhere (%)
Residents speaking English at home - Foreign born (%)
Residents speaking Spanish at home (%)
Residents speaking Spanish at home - Born in the United States (%)
Residents speaking Spanish at home - Native, born elsewhere (%)
Residents speaking Spanish at home - Foreign born (%)
Residents speaking other language at home (%)
Residents speaking other language at home - Born in the United States (%)
Residents speaking other language at home - Native, born elsewhere (%)
Residents speaking other language at home - Foreign born (%)
Class of Workers - Employee of private company (%)
Class of Workers - Self-employed in own incorporated business (%)
Class of Workers - Private not-for-profit wage and salary workers (%)
Class of Workers - Local government workers (%)
Class of Workers - State government workers (%)
Class of Workers - Federal government workers (%)
Class of Workers - Self-employed workers in own not incorporated business and Unpaid family workers (%)
House heating fuel used in houses and condos - Utility gas (%)
House heating fuel used in houses and condos - Bottled, tank, or LP gas (%)
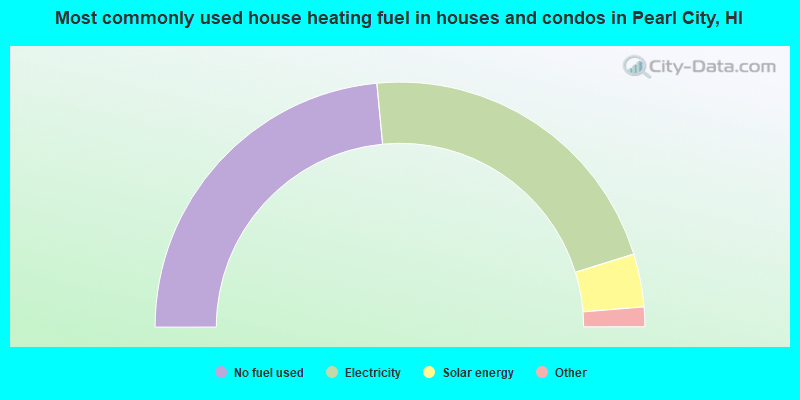
House heating fuel used in houses and condos - Electricity (%)
House heating fuel used in houses and condos - Fuel oil, kerosene, etc. (%)
House heating fuel used in houses and condos - Coal or coke (%)
House heating fuel used in houses and condos - Wood (%)
House heating fuel used in houses and condos - Solar energy (%)
House heating fuel used in houses and condos - Other fuel (%)
House heating fuel used in houses and condos - No fuel used (%)
House heating fuel used in apartments - Utility gas (%)
House heating fuel used in apartments - Bottled, tank, or LP gas (%)
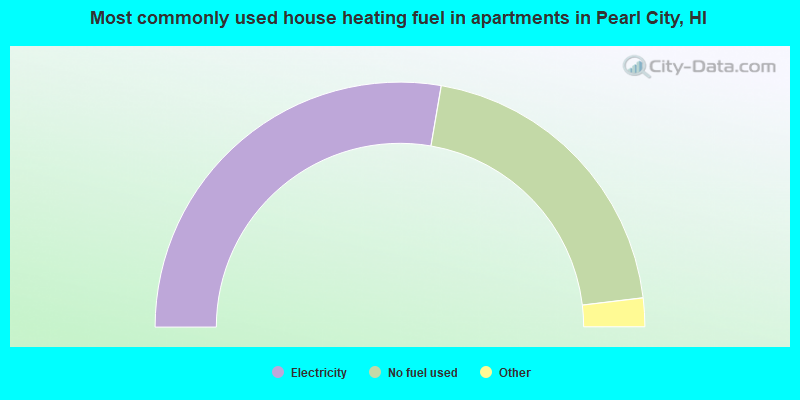
House heating fuel used in apartments - Electricity (%)
House heating fuel used in apartments - Fuel oil, kerosene, etc. (%)
House heating fuel used in apartments - Coal or coke (%)
House heating fuel used in apartments - Wood (%)
House heating fuel used in apartments - Solar energy (%)
House heating fuel used in apartments - Other fuel (%)
House heating fuel used in apartments - No fuel used (%)
Armed forces status - In Armed Forces (%)
Armed forces status - Civilian (%)
Armed forces status - Civilian - Veteran (%)
Armed forces status - Civilian - Nonveteran (%)
Fatal accidents locations in years 2005-2021
Fatal accidents locations in 2005
Fatal accidents locations in 2006
Fatal accidents locations in 2007
Fatal accidents locations in 2008
Fatal accidents locations in 2009
Fatal accidents locations in 2010
Fatal accidents locations in 2011
Fatal accidents locations in 2012
Fatal accidents locations in 2013
Fatal accidents locations in 2014
Fatal accidents locations in 2015
Fatal accidents locations in 2016
Fatal accidents locations in 2017
Fatal accidents locations in 2018
Fatal accidents locations in 2019
Fatal accidents locations in 2020
Fatal accidents locations in 2021
Alcohol use - People drinking some alcohol every month (%)
Alcohol use - People not drinking at all (%)
Alcohol use - Average days/month drinking alcohol
Alcohol use - Average drinks/week
Alcohol use - Average days/year people drink much
Audiometry - Average condition of hearing (%)
Audiometry - People that can hear a whisper from across a quiet room (%)
Audiometry - People that can hear normal voice from across a quiet room (%)
Audiometry - Ears ringing, roaring, buzzing (%)
Audiometry - Had a job exposure to loud noise (%)
Audiometry - Had off-work exposure to loud noise (%)
Blood Pressure & Cholesterol - Has high blood pressure (%)
Blood Pressure & Cholesterol - Checking blood pressure at home (%)
Blood Pressure & Cholesterol - Frequently checking blood cholesterol (%)
Blood Pressure & Cholesterol - Has high cholesterol level (%)
Consumer Behavior - Money monthly spent on food at supermarket/grocery store
Consumer Behavior - Money monthly spent on food at other stores
Consumer Behavior - Money monthly spent on eating out
Consumer Behavior - Money monthly spent on carryout/delivered foods
Consumer Behavior - Income spent on food at supermarket/grocery store (%)
Consumer Behavior - Income spent on food at other stores (%)
Consumer Behavior - Income spent on eating out (%)
Consumer Behavior - Income spent on carryout/delivered foods (%)
Current Health Status - General health condition (%)
Current Health Status - Blood donors (%)
Current Health Status - Has blood ever tested for HIV virus (%)
Current Health Status - Left-handed people (%)
Dermatology - People using sunscreen (%)
Diabetes - Diabetics (%)
Diabetes - Had a blood test for high blood sugar (%)
Diabetes - People taking insulin (%)
Diet Behavior & Nutrition - Diet health (%)
Diet Behavior & Nutrition - Milk product consumption (# of products/month)
Diet Behavior & Nutrition - Meals not home prepared (#/week)
Diet Behavior & Nutrition - Meals from fast food or pizza place (#/week)
Diet Behavior & Nutrition - Ready-to-eat foods (#/month)
Diet Behavior & Nutrition - Frozen meals/pizza (#/month)
Drug Use - People that ever used marijuana or hashish (%)
Drug Use - Ever used hard drugs (%)
Drug Use - Ever used any form of cocaine (%)
Drug Use - Ever used heroin (%)
Drug Use - Ever used methamphetamine (%)
Health Insurance - People covered by health insurance (%)
Kidney Conditions-Urology - Avg. # of times urinating at night
Medical Conditions - People with asthma (%)
Medical Conditions - People with anemia (%)
Medical Conditions - People with psoriasis (%)
Medical Conditions - People with overweight (%)
Medical Conditions - Elderly people having difficulties in thinking or remembering (%)
Medical Conditions - People who ever received blood transfusion (%)
Medical Conditions - People having trouble seeing even with glass/contacts (%)
Medical Conditions - People with arthritis (%)
Medical Conditions - People with gout (%)
Medical Conditions - People with congestive heart failure (%)
Medical Conditions - People with coronary heart disease (%)
Medical Conditions - People with angina pectoris (%)
Medical Conditions - People who ever had heart attack (%)
Medical Conditions - People who ever had stroke (%)
Medical Conditions - People with emphysema (%)
Medical Conditions - People with thyroid problem (%)
Medical Conditions - People with chronic bronchitis (%)
Medical Conditions - People with any liver condition (%)
Medical Conditions - People who ever had cancer or malignancy (%)
Mental Health - People who have little interest in doing things (%)
Mental Health - People feeling down, depressed, or hopeless (%)
Mental Health - People who have trouble sleeping or sleeping too much (%)
Mental Health - People feeling tired or having little energy (%)
Mental Health - People with poor appetite or overeating (%)
Mental Health - People feeling bad about themself (%)
Mental Health - People who have trouble concentrating on things (%)
Mental Health - People moving or speaking slowly or too fast (%)
Mental Health - People having thoughts they would be better off dead (%)
Oral Health - Average years since last visit a dentist
Oral Health - People embarrassed because of mouth (%)
Oral Health - People with gum disease (%)
Oral Health - General health of teeth and gums (%)
Oral Health - Average days a week using dental floss/device
Oral Health - Average days a week using mouthwash for dental problem
Oral Health - Average number of teeth
Pesticide Use - Households using pesticides to control insects (%)
Pesticide Use - Households using pesticides to kill weeds (%)
Physical Activity - People doing vigorous-intensity work activities (%)
Physical Activity - People doing moderate-intensity work activities (%)
Physical Activity - People walking or bicycling (%)
Physical Activity - People doing vigorous-intensity recreational activities (%)
Physical Activity - People doing moderate-intensity recreational activities (%)
Physical Activity - Average hours a day doing sedentary activities
Physical Activity - Average hours a day watching TV or videos
Physical Activity - Average hours a day using computer
Physical Functioning - People having limitations keeping them from working (%)
Physical Functioning - People limited in amount of work they can do (%)
Physical Functioning - People that need special equipment to walk (%)
Physical Functioning - People experiencing confusion/memory problems (%)
Physical Functioning - People requiring special healthcare equipment (%)
Prescription Medications - Average number of prescription medicines taking
Preventive Aspirin Use - Adults 40+ taking low-dose aspirin (%)
Reproductive Health - Vaginal deliveries (%)
Reproductive Health - Cesarean deliveries (%)
Reproductive Health - Deliveries resulted in a live birth (%)
Reproductive Health - Pregnancies resulted in a delivery (%)
Reproductive Health - Women breastfeeding newborns (%)
Reproductive Health - Women that had a hysterectomy (%)
Reproductive Health - Women that had both ovaries removed (%)
Reproductive Health - Women that have ever taken birth control pills (%)
Reproductive Health - Women taking birth control pills (%)
Reproductive Health - Women that have ever used Depo-Provera or injectables (%)
Reproductive Health - Women that have ever used female hormones (%)
Sexual Behavior - People 18+ that ever had sex (vaginal, anal, or oral) (%)
Sexual Behavior - Males 18+ that ever had vaginal sex with a woman (%)
Sexual Behavior - Males 18+ that ever performed oral sex on a woman (%)
Sexual Behavior - Males 18+ that ever had anal sex with a woman (%)
Sexual Behavior - Males 18+ that ever had any sex with a man (%)
Sexual Behavior - Females 18+ that ever had vaginal sex with a man (%)
Sexual Behavior - Females 18+ that ever performed oral sex on a man (%)
Sexual Behavior - Females 18+ that ever had anal sex with a man (%)
Sexual Behavior - Females 18+ that ever had any kind of sex with a woman (%)
Sexual Behavior - Average age people first had sex
Sexual Behavior - Average number of female sex partners in lifetime (males 18+)
Sexual Behavior - Average number of female vaginal sex partners in lifetime (males 18+)
Sexual Behavior - Average age people first performed oral sex on a woman (18+)
Sexual Behavior - Average number of woman performed oral sex on in lifetime (18+)
Sexual Behavior - Average number of male sex partners in lifetime (males 18+)
Sexual Behavior - Average number of male anal sex partners in lifetime (males 18+)
Sexual Behavior - Average age people first performed oral sex on a man (18+)
Sexual Behavior - Average number of male oral sex partners in lifetime (18+)
Sexual Behavior - People using protection when performing oral sex (%)
Sexual Behavior - Average number of times people have vaginal or anal sex a year
Sexual Behavior - People having sex without condom (%)
Sexual Behavior - Average number of male sex partners in lifetime (females 18+)
Sexual Behavior - Average number of male vaginal sex partners in lifetime (females 18+)
Sexual Behavior - Average number of female sex partners in lifetime (females 18+)
Sexual Behavior - Circumcised males 18+ (%)
Sleep Disorders - Average hours sleeping at night
Sleep Disorders - People that has trouble sleeping (%)
Smoking-Cigarette Use - People smoking cigarettes (%)
Taste & Smell - People 40+ having problems with smell (%)
Taste & Smell - People 40+ having problems with taste (%)
Taste & Smell - People 40+ that ever had wisdom teeth removed (%)
Taste & Smell - People 40+ that ever had tonsils teeth removed (%)
Taste & Smell - People 40+ that ever had a loss of consciousness because of a head injury (%)
Taste & Smell - People 40+ that ever had a broken nose or other serious injury to face or skull (%)
Taste & Smell - People 40+ that ever had two or more sinus infections (%)
Weight - Average height (inches)
Weight - Average weight (pounds)
Weight - Average BMI
Weight - People that are obese (%)
Weight - People that ever were obese (%)
Weight - People trying to lose weight (%)
According to our research of Hawaii and other state lists, there were 69 registered sex offenders living in Pearl City, Hawaii as of April 27, 2024 . The ratio of all residents to sex offenders in Pearl City is 689 to 1.The ratio of registered sex offenders to all residents in this city is lower than the state average.
Latest news from Pearl City, HI collected exclusively by city-data.com from local newspapers, TV, and radio stations
Current Local Time:
Land area: 4.98 square miles.
Population density: 9,571 people per square mile (high).
7,374 residents are foreign born (12.7% Asia , 2.1% Oceania ).
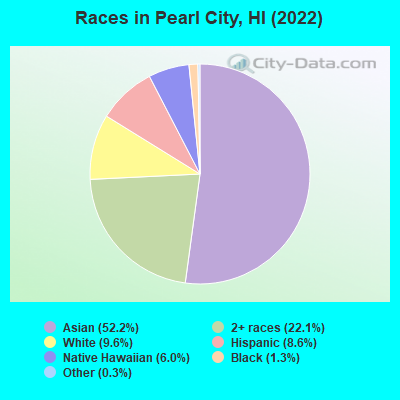
This place:
16.0%Hawaii:
18.0%
Median real estate property taxes paid for housing units with mortgages in 2022: $2,266 (0.3%)Median real estate property taxes paid for housing units with no mortgage in 2022: $2,356 (0.3%)
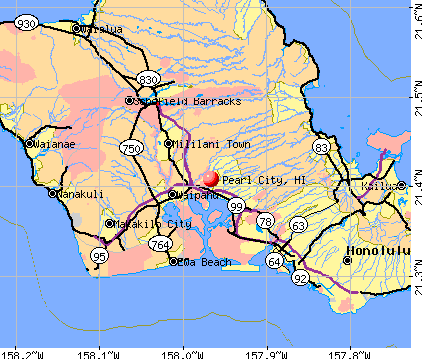
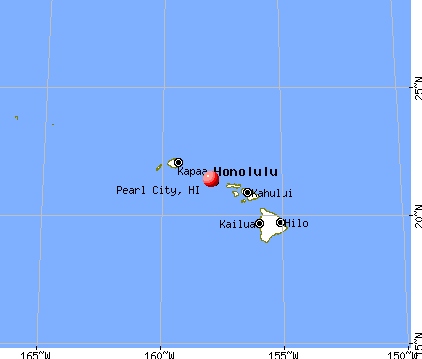
Nearest city with pop. 50,000+: Ewa, HI
Nearest city with pop. 1,000,000+: Los Angeles, CA
Nearest cities:
Latitude: 21.41 N, Longitude: 157.97 W
Daytime population change due to commuting: -10,523 (-22.8%)Workers who live and work in this place: 4,233 (18.4%)
Property values in Pearl City, HI
Unemployment in December 2023:
Most common occupations in Pearl City, HI (%)
Both Males Females
Other office and administrative support workers, including supervisors (6.4%)
Retail sales workers, except cashiers (4.6%)
Building and grounds cleaning and maintenance occupations (4.1%)
Information and record clerks, except customer service representatives (3.8%)
Electrical equipment mechanics and other installation, maintenance, and repair workers, including supervisors (3.8%)
Secretaries and administrative assistants (3.6%)
Material recording, scheduling, dispatching, and distributing workers (3.4%)
Electrical equipment mechanics and other installation, maintenance, and repair workers, including supervisors (7.2%)
Building and grounds cleaning and maintenance occupations (4.3%)
Material recording, scheduling, dispatching, and distributing workers (3.9%)
Other management occupations, except farmers and farm managers (3.7%)
Other office and administrative support workers, including supervisors (3.6%)
Sales representatives, services, wholesale and manufacturing (3.3%)
Laborers and material movers, hand (3.3%)
Other office and administrative support workers, including supervisors (9.4%)
Secretaries and administrative assistants (6.9%)
Information and record clerks, except customer service representatives (6.7%)
Retail sales workers, except cashiers (6.0%)
Preschool, kindergarten, elementary, and middle school teachers (5.4%)
Cashiers (4.9%)
Bookkeeping, accounting, and auditing clerks (4.0%)
Earthquake activity:
Pearl City-area historical earthquake activity is significantly above Hawaii state average. It is 1093% greater than the overall U.S. average. On 11/29/1975 at 14:47:40, a magnitude 7.2 (6.0 MB, 7.1 MS, 7.2 UK, 7.2 MS, Class: Major, Intensity: VIII - XII) earthquake occurred 233.3 miles away from the city center, causing 2 deaths ( 2 shaking deaths) On 8/21/1951 at 10:57:00, a magnitude 6.9 (6.9 UK, Class: Strong, Intensity: VII - IX) earthquake occurred 171.4 miles away from the city center On 10/15/2006 at 17:07:49, a magnitude 6.7 (6.2 MB, 6.6 MS, 6.7 MW) earthquake occurred 166.9 miles away from Pearl City center On 10/15/2006 at 17:07:49, a magnitude 6.7 (6.7 MD, Depth: 23.7 mi) earthquake occurred 168.9 miles away from Pearl City center On 5/4/2018 at 22:32:54, a magnitude 6.9 (6.9 MW, Depth: 3.6 mi) earthquake occurred 240.7 miles away from Pearl City center On 11/16/1983 at 16:13:00, a magnitude 6.7 (6.4 MB, 6.7 MS, 6.7 MW) earthquake occurred 216.3 miles away from Pearl City center, causing $6,000,000 total damage Magnitude types: body-wave magnitude (MB), duration magnitude (MD), surface-wave magnitude (MS), moment magnitude (MW) Natural disasters: The number of natural disasters in Honolulu County (16) is near the US average (15).Major Disasters (Presidential) Declared: 10Emergencies Declared: 1Floods: 7, Storms: 7, Fires: 3, Mudslides: 3, Landslides: 2, Earthquake: 1, Flash Flood: 1, Heavy Rain: 1, Hurricane: 1, Tsunami Wave: 1, Typhoon: 1, Other: 1 (Note: some incidents may be assigned to more than one category). Hospitals and medical centers in Pearl City: PEARL CITY NURSING HOME (919 LEHUA AVENUE)
WAIMANO TRAINING SCHOOL AND HOSPITAL (2201 WAIMANO HOME ROAD)
Other hospitals and medical centers near Pearl City: KAISER FOUNDATION HOSPITAL (about 5 miles away; HONOLULU, HI)
KFH - MALAMA 'OHANA NURSING AND REHAB CENTER (Nursing Home, about 5 miles away; HONOLULU, HI)
MALAMA OHANA SCF (Nursing Home, about 5 miles away; HONOLULU, HI)
KAHI MOHALA (Hospital, about 5 miles away; EWA BEACH, HI)
PRIME CARE SERVICES HAWAII INC (Home Health Center, about 6 miles away; HONOLULU, HI)
KAISER HOME HEALTH AGENCY - OAHU (Home Health Center, about 7 miles away; HONOLULU, HI)
AVALON CARE CENTER - HONOLULU, LLC (Nursing Home, about 8 miles away; HONOLULU, HI)
College/University in Pearl City: Leeward Community College Full-time enrollment: 4,589; Location: 96-045 Ala Ike; Public; Website: www.leeward.hawaii.edu)
Other colleges/universities with over 2000 students near Pearl City:
Honolulu Community College (about 9 miles; Honolulu, HI ; Full-time enrollment: 2,538)
Hawaii Pacific University (about 10 miles; Honolulu, HI ; FT enrollment: 5,506)
University of Hawaii at Manoa (about 13 miles; Honolulu, HI ; FT enrollment: 16,461)
Chaminade University of Honolulu (about 14 miles; Honolulu, HI ; FT enrollment: 2,610)
Kapiolani Community College (about 15 miles; Honolulu, HI ; FT enrollment: 5,069)
Brigham Young University-Hawaii (about 17 miles; Laie, HI ; FT enrollment: 3,527)
University of Hawaii Maui College (about 103 miles; Kahului, HI ; FT enrollment: 2,492)
Public high school in Pearl City:
Public elementary/middle schools in Pearl City: HIGHLANDS INTERMEDIATE SCHOOL Students: 928, Location: 1460 HOOLAULEA ST, Grades: 7-8)WAIAU ELEMENTARY SCHOOL Students: 566, Location: 98-450 HOOKANIKE ST, Grades: PK-6)PEARL CITY ELEMENTARY SCHOOL Students: 564, Location: 1090 WAIMANO HOME RD, Grades: PK-6)MOMILANI ELEMENTARY SCHOOL Students: 415, Location: 2130 HOOKIEKIE ST, Grades: PK-6)LEHUA ELEMENTARY SCHOOL Students: 411, Location: 791 LEHUA AVE, Grades: PK-6)MANANA ELEMENTARY SCHOOL Students: 397, Location: 1147 KUMANO ST, Grades: PK-6)PEARL CITY HIGHLANDS SCHOOL Students: 389, Location: 1419 WAIMANALO HOME RD, Grades: PK-6)PALISADES ELEMENTARY SCHOOL Students: 368, Location: 2306 AUHUHU ST, Grades: PK-6)Private elementary/middle schools in Pearl City: THE CHILDREN'S HOUSE Students: 294, Location: 1840 KOMO MAI DR, Grades: PK-6)
OUR LADY OF GOOD COUNSEL SCHOOL Students: 248, Location: 1530 HOOLANA ST, Grades: PK-8)
See full list of schools located in Pearl City
Notable locations in Pearl City: (A) , Pearl City Public Library (B) , Honolulu Fire Department Station 20 Pearl City (C) . Display/hide their locations on the map
Shopping Center: (1) . Display/hide its location on the map
Churches in Pearl City include: (A) , Palisades Baptist Church (B) , Our Lady of Good Counsel Church (C) , Pearl City Hongwanji Mission (D) , Pearl City Community Church (E) , Leeward Community Church (F) , Rissho Kosei-Kai Hawaii Kyokai (G) . Display/hide their locations on the map
Streams, rivers, and creeks: (A) , Waimano Stream (B) . Display/hide their locations on the map
Parks in Pearl City include: (1) , Pearl City Recreation Center (2) , Pearl City Kai Playground (3) , Pacheco Playground (4) , Manana Playground (5) . Display/hide their locations on the map
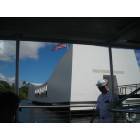
Tourist attraction:
Court:
Birthplace of: James Aiona - Politician, Paul Ogata - Stand-up comedian, Verena Mei - Racing driver.
Honolulu County has a predicted average indoor radon screening level less than 2 pCi/L (pico curies per liter) - Low Potential Drinking water stations with addresses in Pearl City and their reported violations in the past:
WAIAWA CORRECTIONAL FACILITY (Population served: 334, Surface water):
Past health violations:
Treatment Technique (SWTR and GWR) - In MAR-2006. Follow-up actions: St Compliance achieved (MAR-31-2006), St Public Notif requested (APR-27-2006), St Violation/Reminder Notice (APR-27-2006), St Public Notif received (MAY-04-2006)
Past monitoring violations:
Monitoring, Turbidity (Enhanced SWTR) - In MAR-2009, Contaminant: IESWTR. Follow-up actions: St Compliance achieved (APR-30-2009), St Violation/Reminder Notice (MAY-08-2009), St Public Notif received (JUN-09-2009)
Monitoring, Turbidity (Enhanced SWTR) - In JUL-2007, Contaminant: IESWTR. Follow-up actions: St Compliance achieved (JUL-31-2007), St Public Notif requested (NOV-07-2007), St Violation/Reminder Notice (NOV-07-2007), St Public Notif received (NOV-27-2007)
Monitoring, Turbidity (Enhanced SWTR) - In JUN-2007, Contaminant: IESWTR. Follow-up actions: St Violation/Reminder Notice (JUL-13-2007), St Public Notif requested (JUL-13-2007), St Public Notif received (JUL-18-2007), St Compliance achieved (JUL-31-2007)
Monitoring, Turbidity (Enhanced SWTR) - In MAY-2007, Contaminant: IESWTR. Follow-up actions: St Violation/Reminder Notice (JUL-13-2007), St Public Notif requested (JUL-13-2007), St Public Notif received (JUL-18-2007), St Compliance achieved (JUL-31-2007)
Monitoring, Turbidity (Enhanced SWTR) - In APR-2007, Contaminant: IESWTR. Follow-up actions: St Violation/Reminder Notice (JUL-13-2007), St Public Notif requested (JUL-13-2007), St Public Notif received (JUL-18-2007), St Compliance achieved (JUL-31-2007)
2 regular monitoring violations
12 other older monitoring violations
Drinking water stations with addresses in Pearl City that have no violations reported:
MILILANI MEMORIAL PARK (Population served: 100, Primary Water Source Type: Surface water)
Average household size: This place:
3.1 peopleHawaii:
2.9 people
Percentage of family households: This place:
79.5%Whole state:
68.9%
Percentage of households with unmarried partners: This place:
4.5%Whole state:
7.3%
Likely homosexual households (counted as self-reported same-sex unmarried-partner households)
Lesbian couples: 0.5% of all households Gay men: 0.2% of all households
People in group quarters in Pearl City in 2010:
3,411 people in military ships
156 people in nursing facilities/skilled-nursing facilities
59 people in group homes intended for adults
35 people in other noninstitutional facilities
24 people in workers' group living quarters and job corps centers
9 people in residential treatment centers for juveniles (non-correctional)
People in group quarters in Pearl City in 2000:
2,487 people in military ships
110 people in nursing homes
66 people in other group homes
14 people in homes for the physically handicapped
12 people in military barracks, etc.
12 people in homes for the mentally ill
9 people in homes for the mentally retarded
5 people in mental (psychiatric) hospitals or wards
4 people in religious group quarters
3 people in crews of maritime vessels
3 people in other noninstitutional group quarters
2 people in schools, hospitals, or wards for the intellectually disabled
Banks with branches in Pearl City (2011 data):
American Savings Bank, FSB: 850 Kamehameha Highway Branch, Pearl City, Kuala Street Branch. Info updated 2012/01/09: Bank assets: $4,910.1 mil, Deposits: $4,107.0 mil, headquarters in Honolulu, HI, positive income , Mortgage Lending Specialization, 57 total offices
Central Pacific Bank: Pearl City Don Quijote at 850 Kamehameha Highway, branch established on 1995/11/03; Pearl Highlands Branch at 1030 Makolu Street, branch established on 2007/08/30. Info updated 2010/08/20: Bank assets: $4,134.6 mil, Deposits: $3,489.2 mil, headquarters in Honolulu, HI, positive income , Commercial Lending Specialization, 34 total offices , Holding Company: Central Pacific Financial Corp.
Hawaii National Bank: Pearl City Branch at 98-1268 Kaahumanu Street, branch established on 1997/05/17. Info updated 2006/11/03: Bank assets: $618.2 mil, Deposits: $563.8 mil, headquarters in Honolulu, HI, positive income , Commercial Lending Specialization, 14 total offices , Holding Company: Hawaii National Bancshares, Inc.
Finance Factors, Ltd.: Pearl City Branch at 850 Kamehameha Highway, branch established on 1967/06/19. Info updated 2006/11/03: Bank assets: $488.1 mil, Deposits: $408.1 mil, headquarters in Honolulu, HI, negative income in the last year , Commercial Lending Specialization, 14 total offices
First Hawaiian Bank: Pearl City Branch at 890 Kamehameha Highway, branch established on 1961/08/25. Info updated 2012/02/02: Bank assets: $15,830.2 mil, Deposits: $12,165.6 mil, headquarters in Honolulu, HI, positive income , 59 total offices , Holding Company: Bnp Paribas
HomeStreet Bank: Pearl City Branch at 98-1254 Kaahumanu Street, branch established on 2008/08/25. Info updated 2010/08/31: Bank assets: $2,248.5 mil, Deposits: $2,011.6 mil, headquarters in Seattle, WA, positive income , Commercial Lending Specialization, 20 total offices
Territorial Savings Bank: Pearl City Branch at 850 Kamehameha Highway, Suite B2, branch established on 2004/06/07. Info updated 2011/07/21: Bank assets: $1,537.6 mil, Deposits: $1,189.2 mil, headquarters in Honolulu, HI, positive income , Mortgage Lending Specialization, 27 total offices
Bank of Hawaii: Pearl City Branch at 850 Kamehameha Highway, branch established on 1957/03/11. Info updated 2010/09/12: Bank assets: $13,868.5 mil, Deposits: $10,599.9 mil, headquarters in Honolulu, HI, positive income , Mortgage Lending Specialization, 71 total offices , Holding Company: Bank Of Hawaii Corporation
For population 15 years and over in Pearl City:
Never married: 32.2%Now married: 51.6%Separated: 0.8%Widowed: 7.1%Divorced: 8.4% For population 25 years and over in Pearl City:
High school or higher: 95.0%Bachelor's degree or higher: 36.7%Graduate or professional degree: 11.9%Unemployed: 1.8%Mean travel time to work (commute): 24.5 minutes
Education Gini index (Inequality in education) Here:
10.0Hawaii average:
11.2
Religion statistics for Pearl City, HI (based on Honolulu County data)
Religion Adherents Congregations Catholic 173,716 39 Evangelical Protestant 92,310 382 Other 80,221 204 Mainline Protestant 28,013 115 Orthodox 300 4 None 578,647 -
Source: Clifford Grammich, Kirk Hadaway, Richard Houseal, Dale E.Jones, Alexei Krindatch, Richie Stanley and Richard H.Taylor. 2012. 2010 U.S.Religion Census: Religious Congregations & Membership Study. Association of Statisticians of American Religious Bodies. Jones, Dale E., et al. 2002. Congregations and Membership in the United States 2000. Nashville, TN: Glenmary Research Center. Graphs represent county-level data
Food Environment Statistics: Number of grocery stores : 195This county :
2.17 / 10,000 pop.Hawaii :
2.30 / 10,000 pop.
Number of supercenters and club stores : 9Honolulu County :
0.10 / 10,000 pop.Hawaii :
0.09 / 10,000 pop.
Number of convenience stores (no gas) : 126Here :
1.40 / 10,000 pop.State :
1.57 / 10,000 pop.
Number of convenience stores (with gas) : 141Here :
1.57 / 10,000 pop.Hawaii :
1.72 / 10,000 pop.
Number of full-service restaurants : 734Honolulu County :
8.15 / 10,000 pop.State :
9.00 / 10,000 pop.
Adult diabetes rate : Honolulu County :
8.3%State :
8.1%
Adult obesity rate : Honolulu County :
20.5%State :
20.8%
Low-income preschool obesity rate : This county :
8.9%Hawaii :
9.2%
Health and Nutrition: Healthy diet rate : This city:
56.2%State:
54.6%
Average overall health of teeth and gums : This city:
51.5%Hawaii:
50.5%
Average BMI : This city:
26.1Hawaii:
26.8
People feeling badly about themselves : This city:
14.2%Hawaii:
16.5%
People not drinking alcohol at all : Pearl City:
20.8%Hawaii:
18.1%
Average hours sleeping at night : General health condition : This city:
57.8%Hawaii:
57.4%
Average condition of hearing : Pearl City:
82.7%Hawaii:
82.1%
More about Health and Nutrition of Pearl City, HI Residents
4.80% of this county's 2021 resident taxpayers lived in other counties in 2020 ($72,704 average adjusted gross income )
Here:
4.80%Hawaii average:
4.91%
0.27% of residents moved from foreign countries ($4,064 average AGI )Honolulu County:
0.27%Hawaii average:
0.19%
Top counties from which taxpayers relocated into this county between 2020 and 2021:
5.90% of this county's 2020 resident taxpayers moved to other counties in 2021 ($71,643 average adjusted gross income )
Here:
5.90%Hawaii average:
5.53%
0.21% of residents moved to foreign countries ($2,928 average AGI )Honolulu County:
0.21%Hawaii average:
0.15%
Top counties to which taxpayers relocated from this county between 2020 and 2021:
Businesses in Pearl City, HI
Name Count Name Count
24 Hour Fitness 1 Panda Express 1 7-Eleven 1 Papa John's Pizza 1 AT&T 2 Payless 1 Blockbuster 1 Pier 1 Imports 1 Burger King 1 Sam's Club 1 CVS 2 Sears 1 Chuck E. Cheese's 1 Sprint Nextel 1 Dairy Queen 1 Starbucks 1 FedEx 1 Verizon Wireless 2 Home Depot 1 Walmart 1 IHOP 1 Wendy's 1 McDonald's 3
Strongest AM radio stations in Pearl City:
KJPN (1370 AM; 6 kW; PEARL CITY, HI; Owner: DIAMOND BROADCASTING CORPORATION)
KHNR (650 AM; 10 kW; HONOLULU, HI; Owner: SALEM MEDIA OF HAWAII, INC.)
KHCM (940 AM; 10 kW; WAIPAHU, HI; Owner: SALEM MEDIA OF HAWAII, INC.)
KLHT (1040 AM; 10 kW; HONOLULU, HI; Owner: CALVARY CHAPEL OF HONOLULU, INC.)
KSSK (590 AM; 8 kW; HONOLULU, HI; Owner: CAPSTAR TX LIMITED PARTNERSHIP)
KHVH (830 AM; 10 kW; HONOLULU, HI; Owner: CAPSTAR TX LIMITED PARTNERSHIP)
KUMU (1500 AM; 10 kW; HONOLULU, HI; Owner: MAVERICK MEDIA OF OAHU LICENSE LLC)
KORL (690 AM; 10 kW; HONOLULU, HI; Owner: NEW WAVE BROADCASTING, L.P.)
KGU (760 AM; 10 kW; HONOLULU, HI; Owner: SALEM MEDIA OF HAWAII, INC.)
KHBZ (990 AM; 5 kW; HONOLULU, HI; Owner: CAPSTAR TX LIMITED PARTNERSHIP)
KNDI (1270 AM; 5 kW; HONOLULU, HI; Owner: BROADCAST HOUSE OF THE PACIFIC INC.)
KKEA (1420 AM; 5 kW; HONOLULU, HI; Owner: BLOW UP, LLC)
KHRA (1460 AM; 5 kW; HONOLULU, HI; Owner: TRADE CENTER MANAGEMENT, INC.)
Strongest FM radio stations in Pearl City:
KAIM-FM (95.5 FM; HONOLULU, HI; Owner: SALEM MEDIA OF HAWAII, INC.)
KAHA (105.9 FM; HONOLULU, HI; Owner: KASA MOKU KA PAWA BROADCASTING, INC.)
KCCN-FM (100.3 FM; HONOLULU, HI; Owner: CXR HOLDINGS, INC.)
KGMZ-FM (107.9 FM; AIEA, HI; Owner: HONOLULU BROADCASTING, INC.)
KINE-FM (105.1 FM; HONOLULU, HI; Owner: CXR HOLDINGS, INC.)
KUCD (101.9 FM; PEARL CITY, HI; Owner: CAPSTAR TX LIMITED PARTNERSHIP)
KSSK-FM (92.3 FM; WAIPAHU, HI; Owner: CAPSTAR TX LIMITED PARTNERSHIP)
KIPO (89.3 FM; HONOLULU, HI; Owner: HAWAII PUBLIC RADIO)
KDDB (102.7 FM; WAIPAHU, HI; Owner: NEW WAVE BROADCASTING, L.P.)
KPOI-FM (97.5 FM; HONOLULU, HI; Owner: NEW WAVE BROADCASTING, L.P.)
KQMQ-FM (93.1 FM; HONOLULU, HI; Owner: NEW WAVE BROADCASTING, L.P.)
KHUI (99.5 FM; HONOLULU, HI; Owner: NEW WAVE BROADCASTING, L.P.)
KXME (104.3 FM; KANEOHE, HI; Owner: CXR HOLDINGS, INC.)
KRTR-FM (96.3 FM; KAILUA, HI; Owner: CXR HOLDINGS, INC.)
K215EH (90.9 FM; KAILUA, HI; Owner: CALVARY CHAPEL OF TWIN FALLS, INC.)
KUMU-FM (94.7 FM; HONOLULU, HI; Owner: MAVERICK MEDIA OF OAHU LICENSE LLC)
KDNN (98.5 FM; HONOLULU, HI; Owner: CAPSTAR TX LIMITED PARTNERSHIP)
TV broadcast stations around Pearl City:
KHON-TV (Channel 2; HONOLULU, HI; Owner: EMMIS TELEVISION LICENSE CORPORATION)
KGMB (Channel 9; HONOLULU, HI; Owner: EMMIS TELEVISION LICENSE CORPORATION)
KWHE (Channel 14; HONOLULU, HI; Owner: LESEA BROADCASTING CORPORATION)
KITV (Channel 4; HONOLULU, HI; Owner: KITV HEARST-ARGYLE TV, INC. (CA CORP.))
KBFD (Channel 32; HONOLULU, HI; Owner: THE ALLEN BROADCASTING CORP.)
KHET (Channel 11; HONOLULU, HI; Owner: HAWAII PUBLIC TELEVISION FOUNDATION)
KHNL (Channel 13; HONOLULU, HI; Owner: RAYCOM NATIONAL, INC.)
KIKU (Channel 20; HONOLULU, HI; Owner: KHLS, INC.)
KHLU-LP (Channel 60; HONOLULU, HI; Owner: HTV/HTN/HAWAIIAN TV NETWORK, LTD.)
KFVE (Channel 5; HONOLULU, HI; Owner: RAYCOM NATIONAL, INC.)
K54EX (Channel 54; HONOLULU, HI; Owner: CRAIG ALLYN JUE)
KAAH (Channel 26; HONOLULU, HI; Owner: TRINITY BROADCASTING NETWORK)
K42CO (Channel 42; HONOLULU, HI; Owner: OCEANIA BROADCASTING NETWORK, INC.)
KPXO (Channel 66; KANEOHE, HI; Owner: PAXSON HAWAII LICENSE, INC.)
KALO (Channel 38; HONOLULU, HI; Owner: PACIFICA BROADCASTING COMPANY)
KWBN (Channel 44; HONOLULU, HI; Owner: HO'ONA'AUAO COMMUNITY TV, INC.)
KHHI-LP (Channel 48; HONOLULU, HI; Owner: EQUITY BROADCASTING CORPORATION)
National Bridge Inventory (NBI) Statistics 11 Number of bridges643ft / 196m Total length $4,956,000 Total costs586,957 Total average daily traffic17,711 Total average daily truck traffic642,774 Total future (year 2025) average daily traffic
New bridges - historical statistics
1 1930-1939 2 1940-1949 3 1960-1969 4 1970-1979 1 1980-1989
See full National Bridge Inventory statistics for Pearl City, HI
Home Mortgage Disclosure Act Aggregated Statistics For Year 2009(Based on 4 full and 4 partial tracts) A) FHA, FSA/RHS & VA B) Conventional C) Refinancings D) Home Improvement Loans F) Non-occupant Loans on Number Average Value Number Average Value Number Average Value Number Average Value Number Average Value
LOANS ORIGINATED 32 $343,711 58 $321,389 381 $308,037 43 $275,974 34 $233,234 APPLICATIONS APPROVED, NOT ACCEPTED 1 $352,940 6 $319,402 33 $338,882 1 $142,490 5 $265,442 APPLICATIONS DENIED 4 $446,535 5 $473,972 93 $363,839 6 $310,860 11 $249,888 APPLICATIONS WITHDRAWN 2 $440,285 11 $370,508 68 $310,539 5 $276,192 10 $223,614 FILES CLOSED FOR INCOMPLETENESS 0 $0 0 $0 10 $342,806 0 $0 0 $0
Aggregated Statistics For Year 2008(Based on 4 full and 3 partial tracts) A) FHA, FSA/RHS & VA B) Conventional C) Refinancings D) Home Improvement Loans F) Non-occupant Loans on Number Average Value Number Average Value Number Average Value Number Average Value Number Average Value
LOANS ORIGINATED 7 $503,633 73 $337,513 179 $287,004 46 $190,637 24 $236,249 APPLICATIONS APPROVED, NOT ACCEPTED 2 $433,030 7 $414,204 36 $280,574 5 $155,732 2 $129,500 APPLICATIONS DENIED 2 $307,090 22 $454,445 92 $391,675 14 $202,126 12 $369,942 APPLICATIONS WITHDRAWN 4 $357,190 18 $429,487 49 $404,469 8 $191,179 5 $275,580 FILES CLOSED FOR INCOMPLETENESS 0 $0 2 $621,610 8 $441,975 0 $0 0 $0
Aggregated Statistics For Year 2007(Based on 4 full and 4 partial tracts) A) FHA, FSA/RHS & VA B) Conventional C) Refinancings D) Home Improvement Loans F) Non-occupant Loans on Number Average Value Number Average Value Number Average Value Number Average Value Number Average Value
LOANS ORIGINATED 6 $259,538 117 $300,137 254 $299,173 57 $188,884 42 $207,316 APPLICATIONS APPROVED, NOT ACCEPTED 0 $0 14 $332,744 52 $324,837 7 $166,746 4 $276,208 APPLICATIONS DENIED 0 $0 18 $258,536 130 $339,254 29 $200,919 15 $316,440 APPLICATIONS WITHDRAWN 1 $251,000 18 $315,945 81 $318,786 12 $199,803 11 $216,696 FILES CLOSED FOR INCOMPLETENESS 0 $0 2 $775,610 8 $389,018 1 $150,000 0 $0
Aggregated Statistics For Year 2006(Based on 4 full and 4 partial tracts) A) FHA, FSA/RHS & VA B) Conventional C) Refinancings D) Home Improvement Loans F) Non-occupant Loans on Number Average Value Number Average Value Number Average Value Number Average Value Number Average Value
LOANS ORIGINATED 10 $323,106 196 $264,394 357 $289,561 56 $174,878 71 $224,326 APPLICATIONS APPROVED, NOT ACCEPTED 0 $0 26 $292,628 60 $282,668 10 $148,442 11 $324,421 APPLICATIONS DENIED 1 $296,000 70 $217,780 116 $346,135 33 $173,747 20 $352,596 APPLICATIONS WITHDRAWN 1 $252,490 35 $230,762 140 $327,994 13 $189,399 8 $217,909 FILES CLOSED FOR INCOMPLETENESS 0 $0 6 $217,362 38 $339,616 0 $0 1 $322,620
Aggregated Statistics For Year 2005(Based on 4 full and 4 partial tracts) A) FHA, FSA/RHS & VA B) Conventional C) Refinancings D) Home Improvement Loans F) Non-occupant Loans on G) Loans On Manufactured Number Average Value Number Average Value Number Average Value Number Average Value Number Average Value Number Average Value
LOANS ORIGINATED 7 $253,616 250 $221,621 362 $271,363 55 $174,832 112 $176,793 0 $0 APPLICATIONS APPROVED, NOT ACCEPTED 0 $0 36 $202,378 50 $263,884 7 $153,723 14 $177,725 0 $0 APPLICATIONS DENIED 1 $349,000 61 $211,037 137 $281,482 16 $165,644 21 $158,360 2 $37,500 APPLICATIONS WITHDRAWN 1 $243,000 50 $229,254 106 $269,363 24 $260,155 21 $175,212 0 $0 FILES CLOSED FOR INCOMPLETENESS 1 $164,000 6 $228,833 34 $303,654 0 $0 1 $171,050 0 $0
Aggregated Statistics For Year 2004(Based on 4 full and 4 partial tracts) A) FHA, FSA/RHS & VA B) Conventional C) Refinancings D) Home Improvement Loans F) Non-occupant Loans on G) Loans On Manufactured Number Average Value Number Average Value Number Average Value Number Average Value Number Average Value Number Average Value
LOANS ORIGINATED 4 $163,035 244 $175,623 427 $207,703 36 $136,344 103 $128,152 0 $0 APPLICATIONS APPROVED, NOT ACCEPTED 1 $194,000 24 $175,631 87 $255,787 4 $75,515 8 $148,890 0 $0 APPLICATIONS DENIED 0 $0 34 $167,592 103 $215,021 19 $78,220 17 $151,202 1 $451,000 APPLICATIONS WITHDRAWN 1 $128,660 31 $189,766 126 $231,853 12 $132,547 19 $157,622 0 $0 FILES CLOSED FOR INCOMPLETENESS 0 $0 3 $87,267 7 $258,149 0 $0 0 $0 0 $0
Aggregated Statistics For Year 2003(Based on 4 full and 4 partial tracts) A) FHA, FSA/RHS & VA B) Conventional C) Refinancings D) Home Improvement Loans F) Non-occupant Loans on Number Average Value Number Average Value Number Average Value Number Average Value Number Average Value
LOANS ORIGINATED 8 $225,750 164 $187,293 897 $192,237 17 $89,497 103 $138,787 APPLICATIONS APPROVED, NOT ACCEPTED 0 $0 31 $170,893 75 $210,204 1 $32,550 16 $167,939 APPLICATIONS DENIED 0 $0 33 $161,590 139 $202,518 4 $110,150 21 $140,108 APPLICATIONS WITHDRAWN 0 $0 22 $182,855 123 $207,024 3 $30,913 14 $159,779 FILES CLOSED FOR INCOMPLETENESS 0 $0 4 $126,175 28 $199,514 0 $0 2 $149,010
Aggregated Statistics For Year 2002(Based on 4 full and 4 partial tracts) A) FHA, FSA/RHS & VA B) Conventional C) Refinancings D) Home Improvement Loans F) Non-occupant Loans on Number Average Value Number Average Value Number Average Value Number Average Value Number Average Value
LOANS ORIGINATED 3 $205,787 127 $165,053 365 $185,587 11 $34,100 53 $120,079 APPLICATIONS APPROVED, NOT ACCEPTED 1 $203,180 14 $179,574 32 $203,568 1 $30,000 8 $134,755 APPLICATIONS DENIED 1 $219,340 14 $150,584 48 $226,202 5 $32,336 9 $126,044 APPLICATIONS WITHDRAWN 2 $79,500 10 $142,566 79 $205,839 4 $14,568 11 $134,382 FILES CLOSED FOR INCOMPLETENESS 0 $0 5 $141,096 11 $142,403 0 $0 1 $84,740
Aggregated Statistics For Year 2001(Based on 4 full and 3 partial tracts) A) FHA, FSA/RHS & VA B) Conventional C) Refinancings D) Home Improvement Loans F) Non-occupant Loans on Number Average Value Number Average Value Number Average Value Number Average Value Number Average Value
LOANS ORIGINATED 8 $158,314 122 $152,115 281 $172,450 20 $29,706 50 $128,266 APPLICATIONS APPROVED, NOT ACCEPTED 1 $73,000 7 $198,636 16 $202,452 0 $0 3 $153,667 APPLICATIONS DENIED 1 $118,100 20 $143,882 43 $209,099 4 $32,832 6 $159,880 APPLICATIONS WITHDRAWN 1 $219,000 8 $204,364 48 $208,685 6 $42,047 4 $171,940 FILES CLOSED FOR INCOMPLETENESS 0 $0 2 $149,205 26 $220,662 0 $0 4 $194,555
Aggregated Statistics For Year 2000(Based on 4 full and 4 partial tracts) A) FHA, FSA/RHS & VA B) Conventional C) Refinancings D) Home Improvement Loans F) Non-occupant Loans on Number Average Value Number Average Value Number Average Value Number Average Value Number Average Value
LOANS ORIGINATED 12 $134,281 88 $148,583 75 $154,647 25 $36,740 25 $92,760 APPLICATIONS APPROVED, NOT ACCEPTED 1 $66,000 17 $122,278 17 $212,441 3 $39,333 1 $95,930 APPLICATIONS DENIED 1 $182,000 23 $127,187 36 $191,096 4 $23,758 2 $48,100 APPLICATIONS WITHDRAWN 0 $0 8 $153,095 16 $183,468 2 $81,730 0 $0 FILES CLOSED FOR INCOMPLETENESS 2 $185,500 1 $249,000 26 $229,379 0 $0 2 $286,000
Aggregated Statistics For Year 1999(Based on 4 full and 4 partial tracts) A) FHA, FSA/RHS & VA B) Conventional C) Refinancings D) Home Improvement Loans F) Non-occupant Loans on Number Average Value Number Average Value Number Average Value Number Average Value Number Average Value
LOANS ORIGINATED 14 $135,772 69 $156,764 238 $152,473 24 $38,078 37 $138,235 APPLICATIONS APPROVED, NOT ACCEPTED 1 $131,000 15 $144,953 36 $141,584 0 $0 4 $124,928 APPLICATIONS DENIED 4 $191,045 13 $138,581 51 $215,201 5 $23,662 4 $153,598 APPLICATIONS WITHDRAWN 2 $257,380 16 $166,036 48 $191,800 2 $52,770 6 $150,305 FILES CLOSED FOR INCOMPLETENESS 1 $141,000 1 $282,100 30 $231,547 0 $0 2 $220,595
Detailed HMDA statistics for the following Tracts:
0078.04
, 0080.01 , 0080.02 , 0080.03 , 0080.05 , 0080.06 , 0080.07 , 0081.00
Private Mortgage Insurance Companies Aggregated Statistics For Year 2009(Based on 3 full and 3 partial tracts) A) Conventional B) Refinancings Number Average Value Number Average Value
LOANS ORIGINATED 4 $395,898 1 $252,610 APPLICATIONS APPROVED, NOT ACCEPTED 1 $276,410 1 $578,860 APPLICATIONS DENIED 2 $257,455 2 $540,255 APPLICATIONS WITHDRAWN 2 $470,000 0 $0 FILES CLOSED FOR INCOMPLETENESS 0 $0 0 $0
Aggregated Statistics For Year 2008(Based on 4 full and 3 partial tracts) A) Conventional B) Refinancings C) Non-occupant Loans on Number Average Value Number Average Value Number Average Value
LOANS ORIGINATED 36 $365,129 7 $419,786 1 $261,000 APPLICATIONS APPROVED, NOT ACCEPTED 6 $482,873 2 $573,565 0 $0 APPLICATIONS DENIED 4 $497,162 0 $0 0 $0 APPLICATIONS WITHDRAWN 2 $354,385 0 $0 1 $266,000 FILES CLOSED FOR INCOMPLETENESS 1 $265,670 0 $0 0 $0
Aggregated Statistics For Year 2007(Based on 4 full and 3 partial tracts) A) Conventional B) Refinancings C) Non-occupant Loans on Number Average Value Number Average Value Number Average Value
LOANS ORIGINATED 23 $368,572 11 $435,075 1 $266,000 APPLICATIONS APPROVED, NOT ACCEPTED 1 $209,000 1 $520,000 0 $0 APPLICATIONS DENIED 0 $0 0 $0 0 $0 APPLICATIONS WITHDRAWN 3 $443,667 0 $0 0 $0 FILES CLOSED FOR INCOMPLETENESS 0 $0 0 $0 0 $0
Aggregated Statistics For Year 2006(Based on 2 full and 4 partial tracts) A) Conventional B) Refinancings C) Non-occupant Loans on Number Average Value Number Average Value Number Average Value
LOANS ORIGINATED 12 $298,697 3 $484,423 1 $216,000 APPLICATIONS APPROVED, NOT ACCEPTED 0 $0 0 $0 0 $0 APPLICATIONS DENIED 0 $0 0 $0 0 $0 APPLICATIONS WITHDRAWN 1 $380,000 0 $0 0 $0 FILES CLOSED FOR INCOMPLETENESS 0 $0 0 $0 0 $0
Aggregated Statistics For Year 2005(Based on 3 full and 3 partial tracts) A) Conventional B) Refinancings C) Non-occupant Loans on Number Average Value Number Average Value Number Average Value
LOANS ORIGINATED 18 $253,718 6 $248,890 2 $233,765 APPLICATIONS APPROVED, NOT ACCEPTED 2 $466,500 0 $0 0 $0 APPLICATIONS DENIED 0 $0 0 $0 0 $0 APPLICATIONS WITHDRAWN 0 $0 0 $0 0 $0 FILES CLOSED FOR INCOMPLETENESS 1 $108,000 0 $0 0 $0
Aggregated Statistics For Year 2004(Based on 4 full and 3 partial tracts) A) Conventional B) Refinancings C) Non-occupant Loans on Number Average Value Number Average Value Number Average Value
LOANS ORIGINATED 35 $216,644 10 $222,015 8 $129,740 APPLICATIONS APPROVED, NOT ACCEPTED 1 $281,950 2 $213,000 2 $121,000 APPLICATIONS DENIED 0 $0 0 $0 0 $0 APPLICATIONS WITHDRAWN 2 $205,000 2 $212,500 1 $102,000 FILES CLOSED FOR INCOMPLETENESS 0 $0 0 $0 0 $0
Aggregated Statistics For Year 2003(Based on 4 full and 3 partial tracts) A) Conventional B) Refinancings C) Non-occupant Loans on Number Average Value Number Average Value Number Average Value
LOANS ORIGINATED 44 $203,165 38 $275,273 8 $154,434 APPLICATIONS APPROVED, NOT ACCEPTED 3 $286,107 6 $240,983 1 $69,000 APPLICATIONS DENIED 0 $0 2 $117,905 0 $0 APPLICATIONS WITHDRAWN 0 $0 0 $0 0 $0 FILES CLOSED FOR INCOMPLETENESS 0 $0 0 $0 0 $0
Aggregated Statistics For Year 2002(Based on 4 full and 2 partial tracts) A) Conventional B) Refinancings C) Non-occupant Loans on Number Average Value Number Average Value Number Average Value
LOANS ORIGINATED 46 $197,483 33 $216,670 9 $139,238 APPLICATIONS APPROVED, NOT ACCEPTED 4 $249,840 4 $309,638 0 $0 APPLICATIONS DENIED 0 $0 0 $0 0 $0 APPLICATIONS WITHDRAWN 1 $345,000 2 $102,600 0 $0 FILES CLOSED FOR INCOMPLETENESS 0 $0 0 $0 0 $0
Aggregated Statistics For Year 2001(Based on 4 full and 3 partial tracts) A) Conventional B) Refinancings C) Non-occupant Loans on Number Average Value Number Average Value Number Average Value
LOANS ORIGINATED 43 $201,752 23 $261,700 2 $70,835 APPLICATIONS APPROVED, NOT ACCEPTED 6 $166,188 4 $196,450 1 $77,000 APPLICATIONS DENIED 0 $0 0 $0 0 $0 APPLICATIONS WITHDRAWN 2 $82,805 0 $0 0 $0 FILES CLOSED FOR INCOMPLETENESS 0 $0 0 $0 0 $0
Aggregated Statistics For Year 2000(Based on 4 full and 3 partial tracts) A) Conventional B) Refinancings C) Non-occupant Loans on Number Average Value Number Average Value Number Average Value
LOANS ORIGINATED 35 $211,326 14 $237,259 0 $0 APPLICATIONS APPROVED, NOT ACCEPTED 2 $175,835 3 $242,667 1 $198,000 APPLICATIONS DENIED 2 $190,000 0 $0 0 $0 APPLICATIONS WITHDRAWN 0 $0 0 $0 0 $0 FILES CLOSED FOR INCOMPLETENESS 0 $0 0 $0 0 $0
Aggregated Statistics For Year 1999(Based on 4 full and 3 partial tracts) A) Conventional B) Refinancings C) Non-occupant Loans on Number Average Value Number Average Value Number Average Value
LOANS ORIGINATED 29 $212,211 16 $245,082 1 $367,100 APPLICATIONS APPROVED, NOT ACCEPTED 0 $0 4 $219,640 0 $0 APPLICATIONS DENIED 1 $149,930 0 $0 0 $0 APPLICATIONS WITHDRAWN 0 $0 1 $264,000 0 $0 FILES CLOSED FOR INCOMPLETENESS 0 $0 0 $0 0 $0
Detailed PMIC statistics for the following Tracts:
0078.04
, 0080.01 , 0080.02 , 0080.03 , 0080.05 , 0080.06 , 0080.07 , 0081.00
Most common first names in Pearl City, HI among deceased individuals Name Count Lived (average)
Richard 74 70.9 years George 73 71.8 years John 69 71.4 years Robert 68 71.2 years William 63 68.6 years James 61 69.8 years Mary 56 78.5 years Joseph 46 67.6 years Helen 40 76.0 years David 40 67.3 years
Most common last names in Pearl City, HI among deceased individuals Last name Count Lived (average)
Higa 52 78.6 years Wong 41 78.2 years Lee 40 76.8 years Oshiro 36 76.6 years Watanabe 33 74.4 years Yamamoto 30 76.4 years Chang 28 78.9 years Young 27 72.9 years Tanaka 26 78.3 years Arakaki 25 73.8 years
Pearl City compared to Hawaii state average:
Unemployed percentage significantly below state average. Length of stay since moving in significantly above state average. Pearl City on our top lists :
#3 on the list of "Top 101 cities with the largest percentage of people in military ships (population 1,000+)"
#48 on the list of "Top 101 cities with the largest percentage of people in crews of maritime vessels (population 1,000+)"
#58 on the list of "Top 101 cities with the most residents born in Japan (population 500+)"
#95 (96782) on the list of "Top 101 zip codes with the largest percentage of Portuguese first ancestries (pop 5,000+)"
#7 on the list of "Top 101 counties with the lowest average weight of females"
#15 on the list of "Top 101 counties with the highest ground withdrawal of fresh water for public supply"
#21 on the list of "Top 101 counties with the most Other congregations"
#25 on the list of "Top 101 counties with the most Other adherents"
#25 on the list of "Top 101 counties with the highest carbon monoxide air pollution readings in 2012 (ppm)"
Top Patent Applicants
Len Higashi (3)
Bertram Y. Ito (3)
Steven H. Miyasato (1)
Richard Abiemo (1)
Kelvin Miyahira (1)
Kyle Kikumoto (1)
Nancy Kikumoto (1)
Ruthsenne Gagarin (1)
Darcy Marumoto (1)
Gordon V. L. Wang (1)
Total of 16 patent applications in 2008-2024.


 Recent articles from our blog. Our writers, many of them Ph.D. graduates or candidates, create easy-to-read articles on a wide variety of topics.

 (2.3 miles
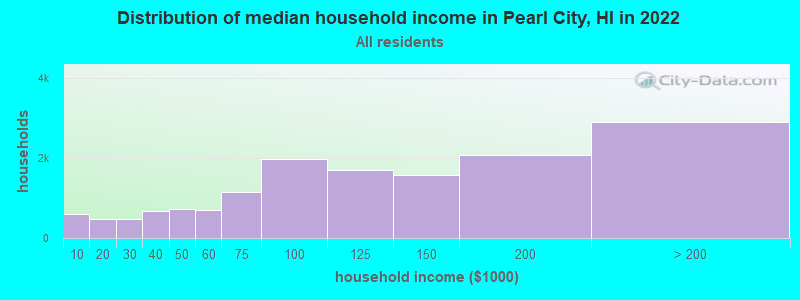
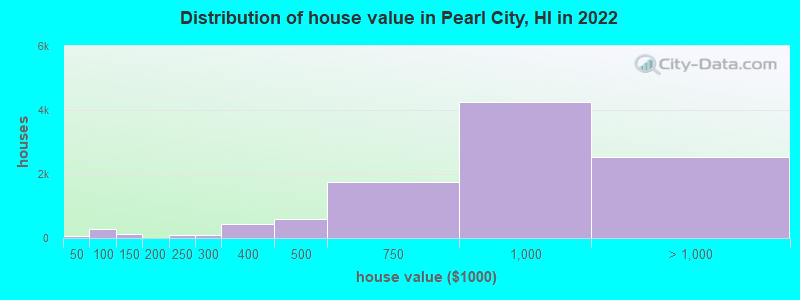
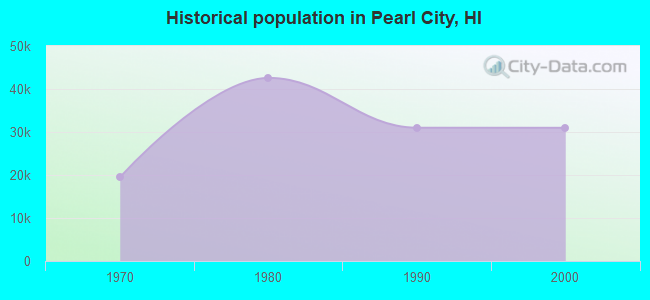
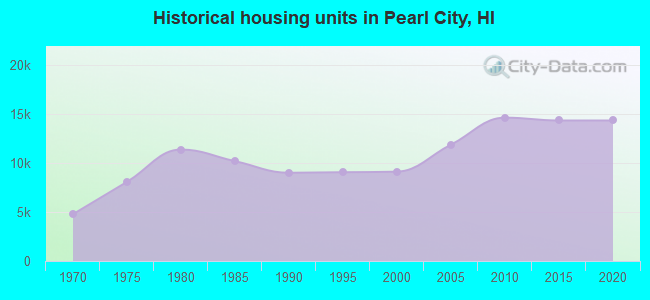
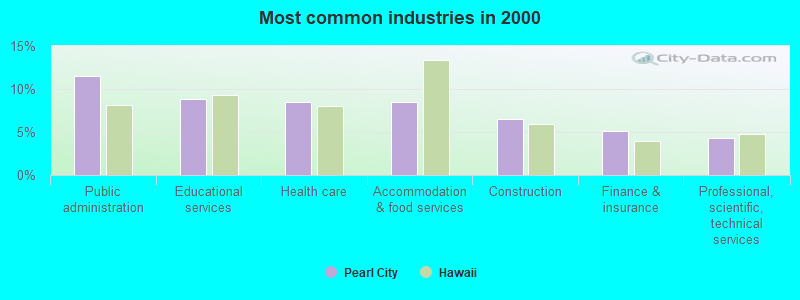
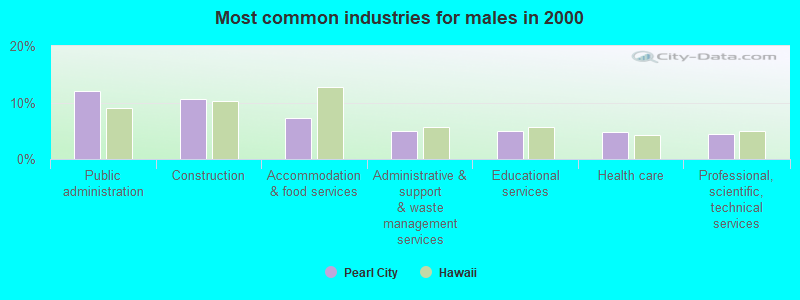
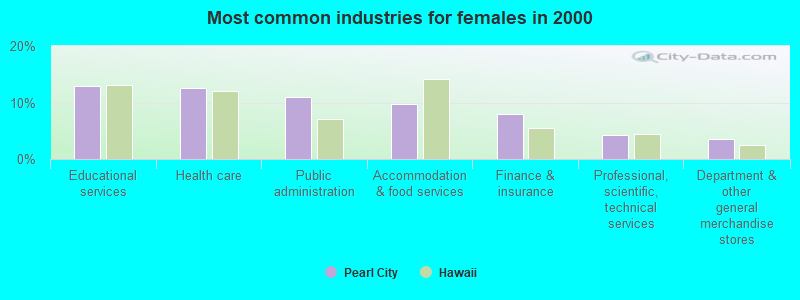

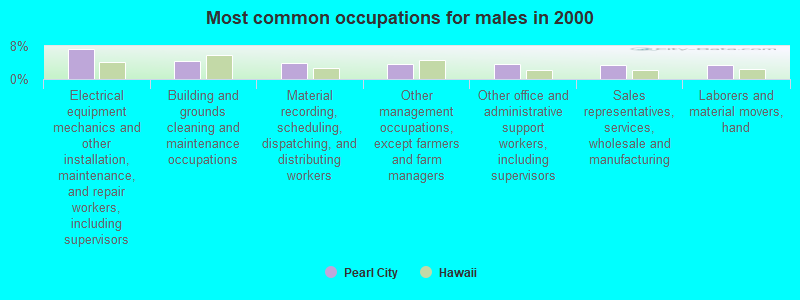
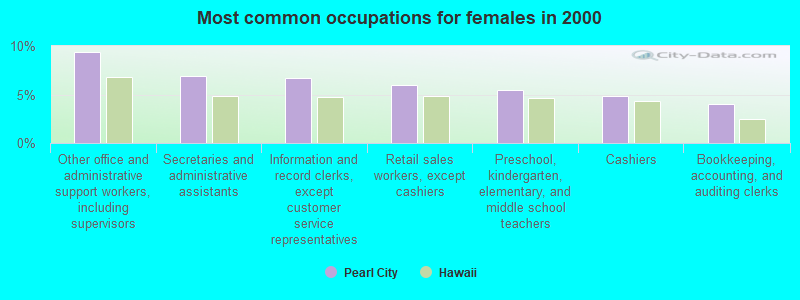
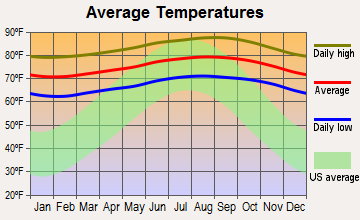
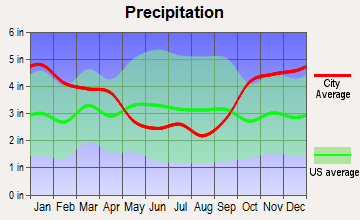
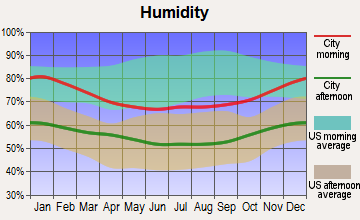
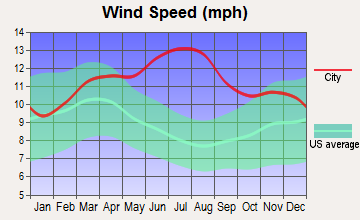
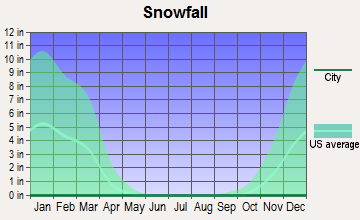
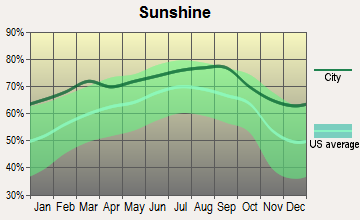
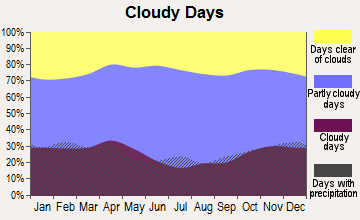
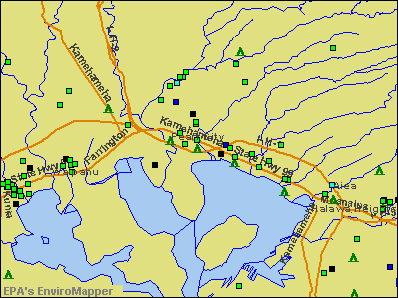

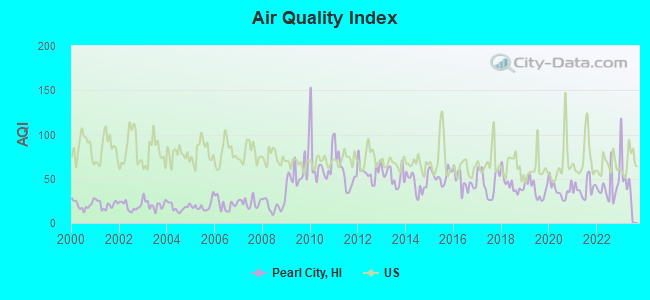
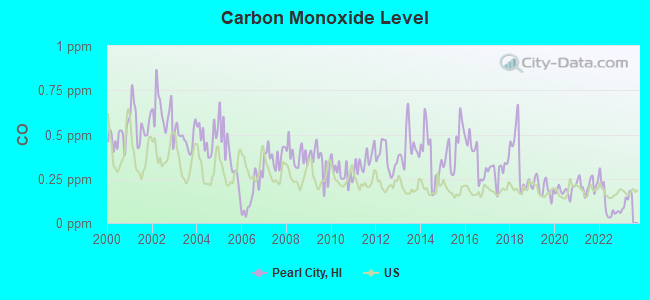
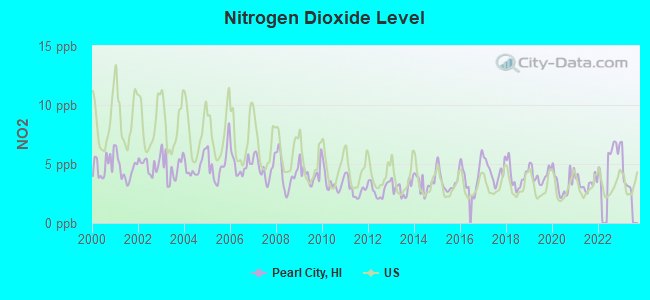
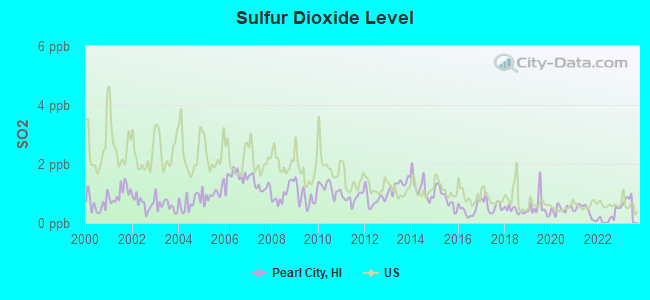
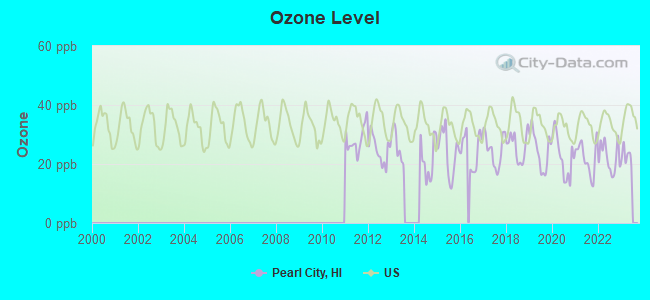
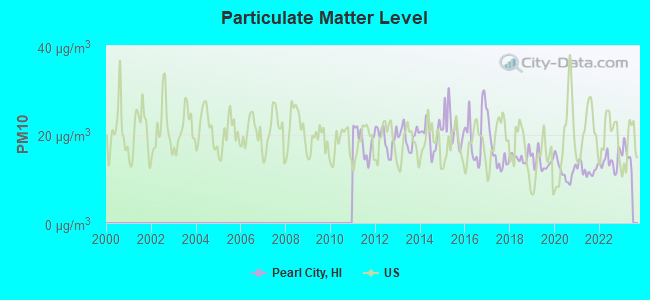
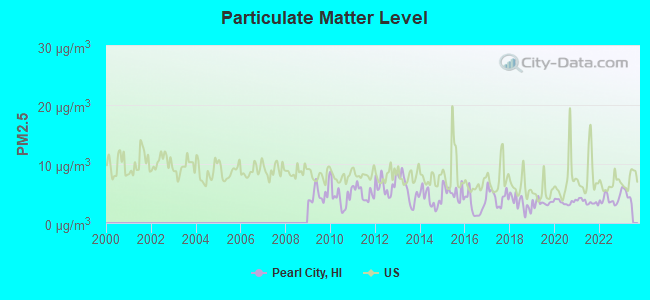
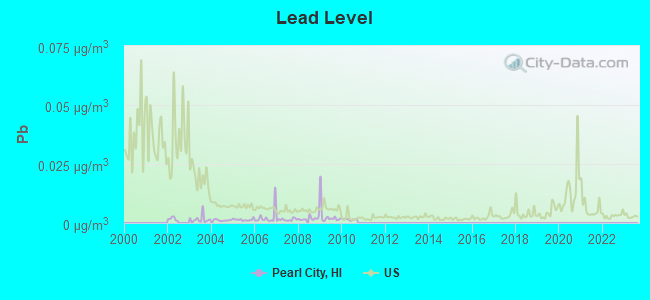

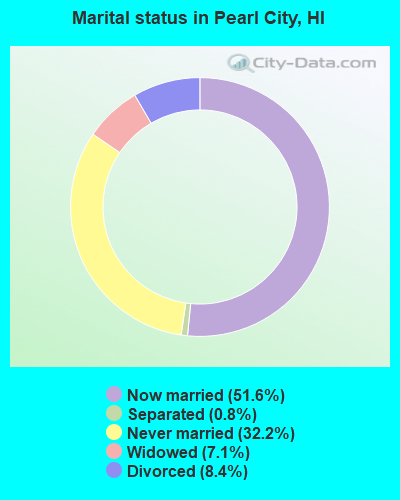
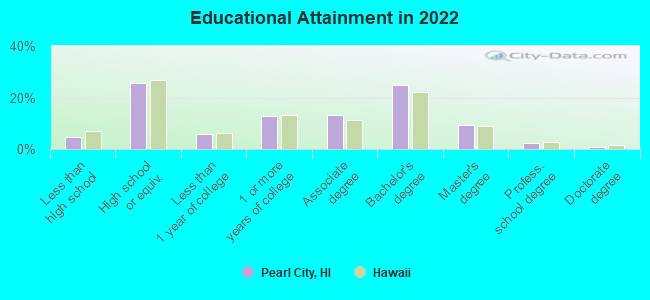
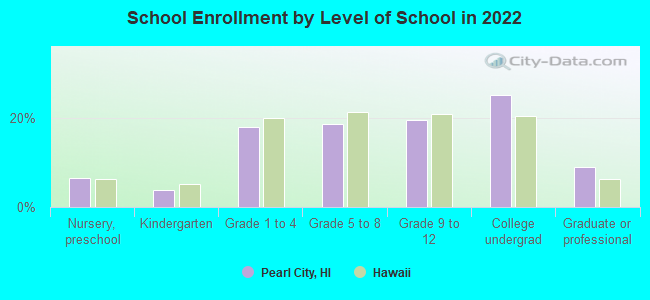
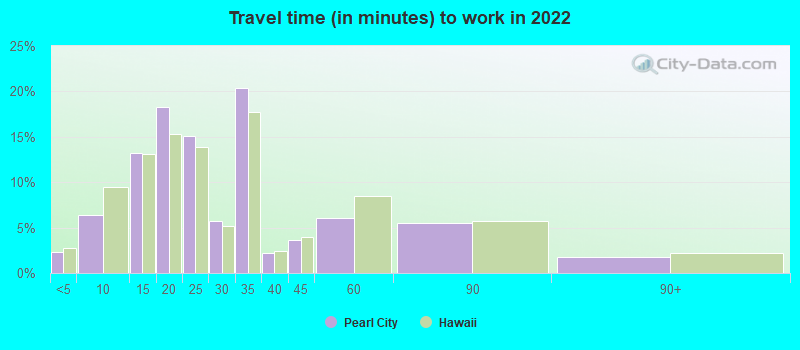
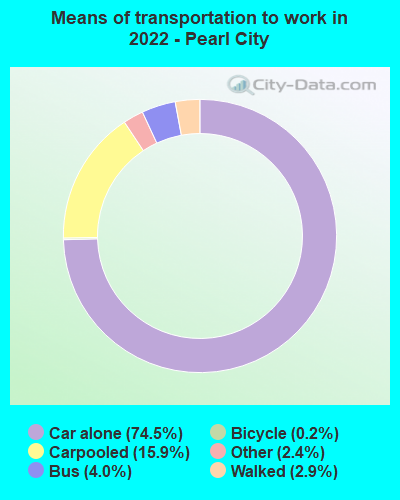
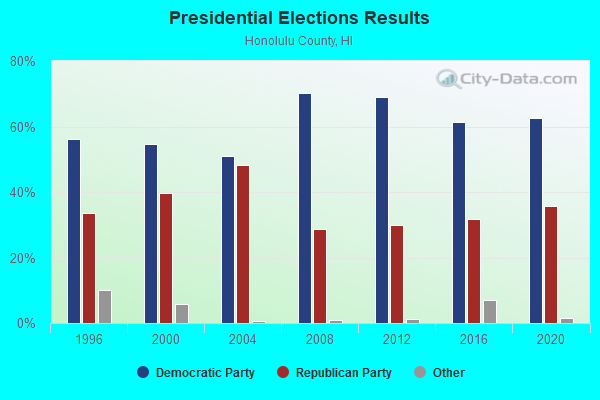
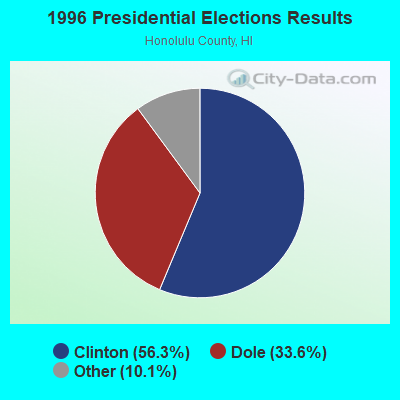
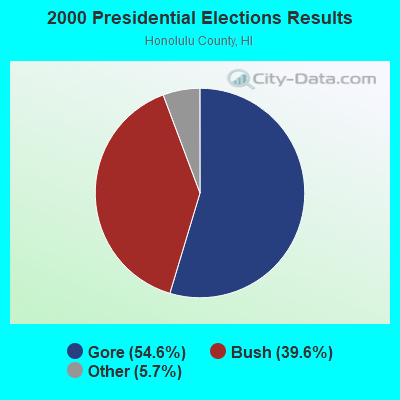
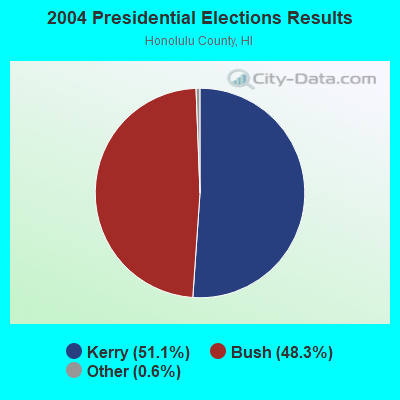
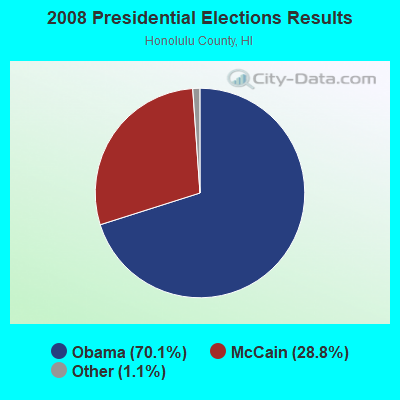
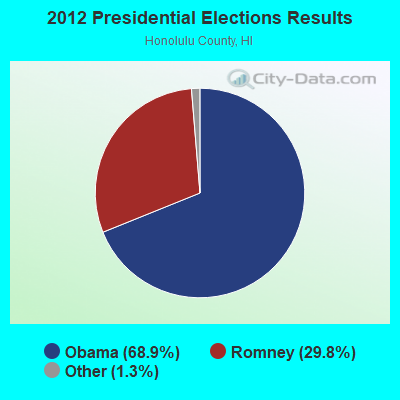
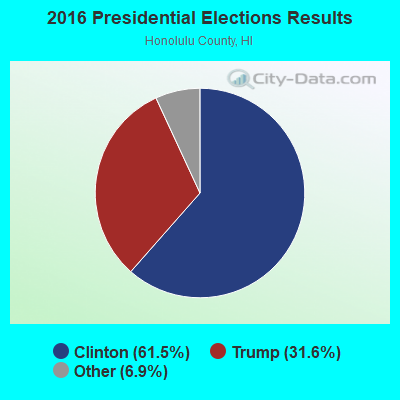
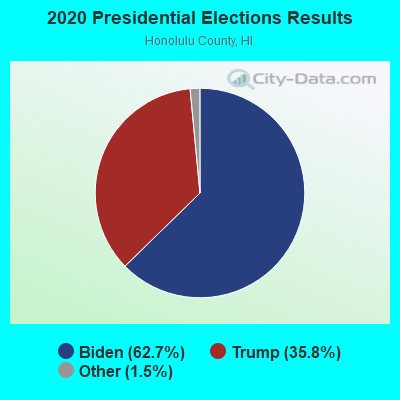
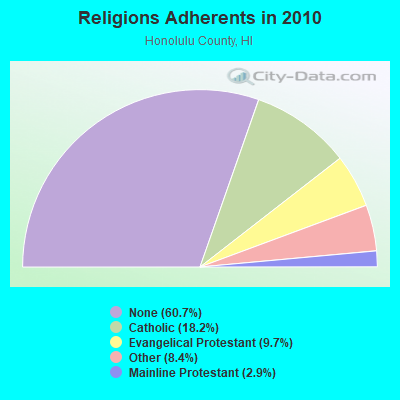
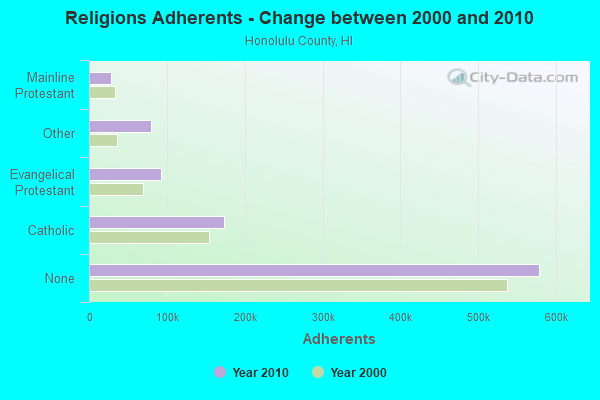
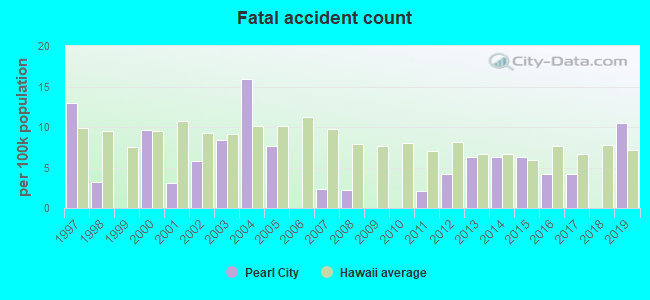
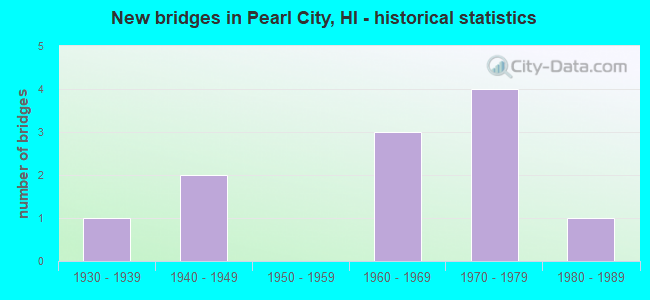
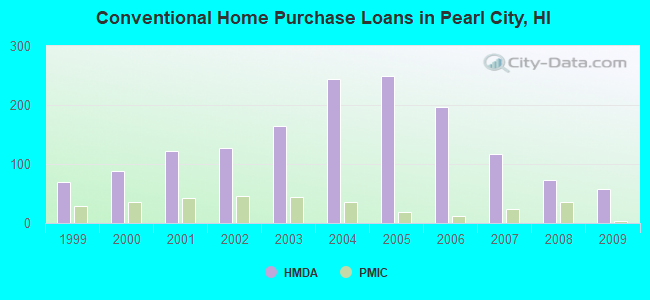
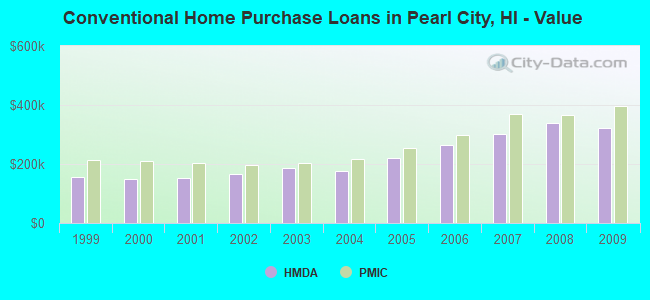
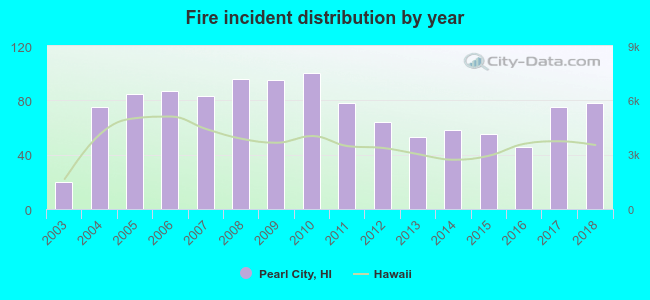 According to the data from the years 2003 - 2018 the average number of fire incidents per year is 72. The highest number of reported fires - 100 took place in 2010, and the least - 20 in 2003. The data has an increasing trend.
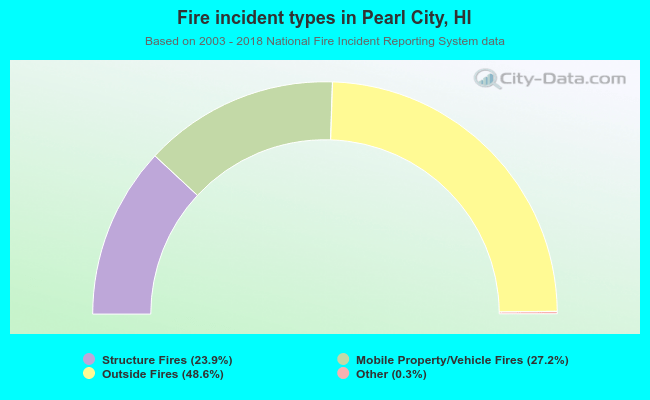 When looking into fire subcategories, the most reports belonged to: Outside Fires (48.6%), and Mobile Property/Vehicle Fires (27.2%).