Pelham, Alabama Submit your own pictures of this city and show them to the world
OSM Map
General Map
Google Map
MSN Map
OSM Map
General Map
Google Map
MSN Map
OSM Map
General Map
Google Map
MSN Map
OSM Map
General Map
Google Map
MSN Map
Please wait while loading the map...
Population in 2022: 24,755 (92% urban, 8% rural). Population change since 2000: +72.3%Males: 11,835 Females: 12,920
March 2022 cost of living index in Pelham: 88.6 (less than average, U.S. average is 100) Percentage of residents living in poverty in 2022: 5.3%for White Non-Hispanic residents , 2.3% for Black residents , 20.9% for Hispanic or Latino residents , 30.6% for other race residents , 21.1% for two or more races residents )
Profiles of local businesses
Business Search - 14 Million verified businesses
Data:
Median household income ($)
Median household income (% change since 2000)
Household income diversity
Ratio of average income to average house value (%)
Ratio of average income to average rent
Median household income ($) - White
Median household income ($) - Black or African American
Median household income ($) - Asian
Median household income ($) - Hispanic or Latino
Median household income ($) - American Indian and Alaska Native
Median household income ($) - Multirace
Median household income ($) - Other Race
Median household income for houses/condos with a mortgage ($)
Median household income for apartments without a mortgage ($)
Races - White alone (%)
Races - White alone (% change since 2000)
Races - Black alone (%)
Races - Black alone (% change since 2000)
Races - American Indian alone (%)
Races - American Indian alone (% change since 2000)
Races - Asian alone (%)
Races - Asian alone (% change since 2000)
Races - Hispanic (%)
Races - Hispanic (% change since 2000)
Races - Native Hawaiian and Other Pacific Islander alone (%)
Races - Native Hawaiian and Other Pacific Islander alone (% change since 2000)
Races - Two or more races (%)
Races - Two or more races (% change since 2000)
Races - Other race alone (%)
Races - Other race alone (% change since 2000)
Racial diversity
Unemployment (%)
Unemployment (% change since 2000)
Unemployment (%) - White
Unemployment (%) - Black or African American
Unemployment (%) - Asian
Unemployment (%) - Hispanic or Latino
Unemployment (%) - American Indian and Alaska Native
Unemployment (%) - Multirace
Unemployment (%) - Other Race
Population density (people per square mile)
Population - Males (%)
Population - Females (%)
Population - Males (%) - White
Population - Males (%) - Black or African American
Population - Males (%) - Asian
Population - Males (%) - Hispanic or Latino
Population - Males (%) - American Indian and Alaska Native
Population - Males (%) - Multirace
Population - Males (%) - Other Race
Population - Females (%) - White
Population - Females (%) - Black or African American
Population - Females (%) - Asian
Population - Females (%) - Hispanic or Latino
Population - Females (%) - American Indian and Alaska Native
Population - Females (%) - Multirace
Population - Females (%) - Other Race
Coronavirus confirmed cases (Apr 27, 2024)
Deaths caused by coronavirus (Apr 27, 2024)
Coronavirus confirmed cases (per 100k population) (Apr 27, 2024)
Deaths caused by coronavirus (per 100k population) (Apr 27, 2024)
Daily increase in number of cases (Apr 27, 2024)
Weekly increase in number of cases (Apr 27, 2024)
Cases doubled (in days) (Apr 27, 2024)
Hospitalized patients (Apr 18, 2022)
Negative test results (Apr 18, 2022)
Total test results (Apr 18, 2022)
COVID Vaccine doses distributed (per 100k population) (Sep 19, 2023)
COVID Vaccine doses administered (per 100k population) (Sep 19, 2023)
COVID Vaccine doses distributed (Sep 19, 2023)
COVID Vaccine doses administered (Sep 19, 2023)
Likely homosexual households (%)
Likely homosexual households (% change since 2000)
Likely homosexual households - Lesbian couples (%)
Likely homosexual households - Lesbian couples (% change since 2000)
Likely homosexual households - Gay men (%)
Likely homosexual households - Gay men (% change since 2000)
Cost of living index
Median gross rent ($)
Median contract rent ($)
Median monthly housing costs ($)
Median house or condo value ($)
Median house or condo value ($ change since 2000)
Mean house or condo value by units in structure - 1, detached ($)
Mean house or condo value by units in structure - 1, attached ($)
Mean house or condo value by units in structure - 2 ($)
Mean house or condo value by units in structure by units in structure - 3 or 4 ($)
Mean house or condo value by units in structure - 5 or more ($)
Mean house or condo value by units in structure - Boat, RV, van, etc. ($)
Mean house or condo value by units in structure - Mobile home ($)
Median house or condo value ($) - White
Median house or condo value ($) - Black or African American
Median house or condo value ($) - Asian
Median house or condo value ($) - Hispanic or Latino
Median house or condo value ($) - American Indian and Alaska Native
Median house or condo value ($) - Multirace
Median house or condo value ($) - Other Race
Median resident age
Resident age diversity
Median resident age - Males
Median resident age - Females
Median resident age - White
Median resident age - Black or African American
Median resident age - Asian
Median resident age - Hispanic or Latino
Median resident age - American Indian and Alaska Native
Median resident age - Multirace
Median resident age - Other Race
Median resident age - Males - White
Median resident age - Males - Black or African American
Median resident age - Males - Asian
Median resident age - Males - Hispanic or Latino
Median resident age - Males - American Indian and Alaska Native
Median resident age - Males - Multirace
Median resident age - Males - Other Race
Median resident age - Females - White
Median resident age - Females - Black or African American
Median resident age - Females - Asian
Median resident age - Females - Hispanic or Latino
Median resident age - Females - American Indian and Alaska Native
Median resident age - Females - Multirace
Median resident age - Females - Other Race
Commute - mean travel time to work (minutes)
Travel time to work - Less than 5 minutes (%)
Travel time to work - Less than 5 minutes (% change since 2000)
Travel time to work - 5 to 9 minutes (%)
Travel time to work - 5 to 9 minutes (% change since 2000)
Travel time to work - 10 to 19 minutes (%)
Travel time to work - 10 to 19 minutes (% change since 2000)
Travel time to work - 20 to 29 minutes (%)
Travel time to work - 20 to 29 minutes (% change since 2000)
Travel time to work - 30 to 39 minutes (%)
Travel time to work - 30 to 39 minutes (% change since 2000)
Travel time to work - 40 to 59 minutes (%)
Travel time to work - 40 to 59 minutes (% change since 2000)
Travel time to work - 60 to 89 minutes (%)
Travel time to work - 60 to 89 minutes (% change since 2000)
Travel time to work - 90 or more minutes (%)
Travel time to work - 90 or more minutes (% change since 2000)
Marital status - Never married (%)
Marital status - Now married (%)
Marital status - Separated (%)
Marital status - Widowed (%)
Marital status - Divorced (%)
Median family income ($)
Median family income (% change since 2000)
Median non-family income ($)
Median non-family income (% change since 2000)
Median per capita income ($)
Median per capita income (% change since 2000)
Median family income ($) - White
Median family income ($) - Black or African American
Median family income ($) - Asian
Median family income ($) - Hispanic or Latino
Median family income ($) - American Indian and Alaska Native
Median family income ($) - Multirace
Median family income ($) - Other Race
Median year house/condo built
Median year apartment built
Year house built - Built 2005 or later (%)
Year house built - Built 2000 to 2004 (%)
Year house built - Built 1990 to 1999 (%)
Year house built - Built 1980 to 1989 (%)
Year house built - Built 1970 to 1979 (%)
Year house built - Built 1960 to 1969 (%)
Year house built - Built 1950 to 1959 (%)
Year house built - Built 1940 to 1949 (%)
Year house built - Built 1939 or earlier (%)
Average household size
Household density (households per square mile)
Average household size - White
Average household size - Black or African American
Average household size - Asian
Average household size - Hispanic or Latino
Average household size - American Indian and Alaska Native
Average household size - Multirace
Average household size - Other Race
Occupied housing units (%)
Vacant housing units (%)
Owner occupied housing units (%)
Renter occupied housing units (%)
Vacancy status - For rent (%)
Vacancy status - For sale only (%)
Vacancy status - Rented or sold, not occupied (%)
Vacancy status - For seasonal, recreational, or occasional use (%)
Vacancy status - For migrant workers (%)
Vacancy status - Other vacant (%)
Residents with income below the poverty level (%)
Residents with income below 50% of the poverty level (%)
Children below poverty level (%)
Poor families by family type - Married-couple family (%)
Poor families by family type - Male, no wife present (%)
Poor families by family type - Female, no husband present (%)
Poverty status for native-born residents (%)
Poverty status for foreign-born residents (%)
Poverty among high school graduates not in families (%)
Poverty among people who did not graduate high school not in families (%)
Residents with income below the poverty level (%) - White
Residents with income below the poverty level (%) - Black or African American
Residents with income below the poverty level (%) - Asian
Residents with income below the poverty level (%) - Hispanic or Latino
Residents with income below the poverty level (%) - American Indian and Alaska Native
Residents with income below the poverty level (%) - Multirace
Residents with income below the poverty level (%) - Other Race
Air pollution - Air Quality Index (AQI)
Air pollution - CO
Air pollution - NO2
Air pollution - SO2
Air pollution - Ozone
Air pollution - PM10
Air pollution - PM25
Air pollution - Pb
Crime - Murders per 100,000 population
Crime - Rapes per 100,000 population
Crime - Robberies per 100,000 population
Crime - Assaults per 100,000 population
Crime - Burglaries per 100,000 population
Crime - Thefts per 100,000 population
Crime - Auto thefts per 100,000 population
Crime - Arson per 100,000 population
Crime - City-data.com crime index
Crime - Violent crime index
Crime - Property crime index
Crime - Murders per 100,000 population (5 year average)
Crime - Rapes per 100,000 population (5 year average)
Crime - Robberies per 100,000 population (5 year average)
Crime - Assaults per 100,000 population (5 year average)
Crime - Burglaries per 100,000 population (5 year average)
Crime - Thefts per 100,000 population (5 year average)
Crime - Auto thefts per 100,000 population (5 year average)
Crime - Arson per 100,000 population (5 year average)
Crime - City-data.com crime index (5 year average)
Crime - Violent crime index (5 year average)
Crime - Property crime index (5 year average)
1996 Presidential Elections Results (%) - Democratic Party (Clinton)
1996 Presidential Elections Results (%) - Republican Party (Dole)
1996 Presidential Elections Results (%) - Other
2000 Presidential Elections Results (%) - Democratic Party (Gore)
2000 Presidential Elections Results (%) - Republican Party (Bush)
2000 Presidential Elections Results (%) - Other
2004 Presidential Elections Results (%) - Democratic Party (Kerry)
2004 Presidential Elections Results (%) - Republican Party (Bush)
2004 Presidential Elections Results (%) - Other
2008 Presidential Elections Results (%) - Democratic Party (Obama)
2008 Presidential Elections Results (%) - Republican Party (McCain)
2008 Presidential Elections Results (%) - Other
2012 Presidential Elections Results (%) - Democratic Party (Obama)
2012 Presidential Elections Results (%) - Republican Party (Romney)
2012 Presidential Elections Results (%) - Other
2016 Presidential Elections Results (%) - Democratic Party (Clinton)
2016 Presidential Elections Results (%) - Republican Party (Trump)
2016 Presidential Elections Results (%) - Other
2020 Presidential Elections Results (%) - Democratic Party (Biden)
2020 Presidential Elections Results (%) - Republican Party (Trump)
2020 Presidential Elections Results (%) - Other
Ancestries Reported - Arab (%)
Ancestries Reported - Czech (%)
Ancestries Reported - Danish (%)
Ancestries Reported - Dutch (%)
Ancestries Reported - English (%)
Ancestries Reported - French (%)
Ancestries Reported - French Canadian (%)
Ancestries Reported - German (%)
Ancestries Reported - Greek (%)
Ancestries Reported - Hungarian (%)
Ancestries Reported - Irish (%)
Ancestries Reported - Italian (%)
Ancestries Reported - Lithuanian (%)
Ancestries Reported - Norwegian (%)
Ancestries Reported - Polish (%)
Ancestries Reported - Portuguese (%)
Ancestries Reported - Russian (%)
Ancestries Reported - Scotch-Irish (%)
Ancestries Reported - Scottish (%)
Ancestries Reported - Slovak (%)
Ancestries Reported - Subsaharan African (%)
Ancestries Reported - Swedish (%)
Ancestries Reported - Swiss (%)
Ancestries Reported - Ukrainian (%)
Ancestries Reported - United States (%)
Ancestries Reported - Welsh (%)
Ancestries Reported - West Indian (%)
Ancestries Reported - Other (%)
Educational Attainment - No schooling completed (%)
Educational Attainment - Less than high school (%)
Educational Attainment - High school or equivalent (%)
Educational Attainment - Less than 1 year of college (%)
Educational Attainment - 1 or more years of college (%)
Educational Attainment - Associate degree (%)
Educational Attainment - Bachelor's degree (%)
Educational Attainment - Master's degree (%)
Educational Attainment - Professional school degree (%)
Educational Attainment - Doctorate degree (%)
School Enrollment - Nursery, preschool (%)
School Enrollment - Kindergarten (%)
School Enrollment - Grade 1 to 4 (%)
School Enrollment - Grade 5 to 8 (%)
School Enrollment - Grade 9 to 12 (%)
School Enrollment - College undergrad (%)
School Enrollment - Graduate or professional (%)
School Enrollment - Not enrolled in school (%)
School enrollment - Public schools (%)
School enrollment - Private schools (%)
School enrollment - Not enrolled (%)
Median number of rooms in houses and condos
Median number of rooms in apartments
Housing units lacking complete plumbing facilities (%)
Housing units lacking complete kitchen facilities (%)
Density of houses
Urban houses (%)
Rural houses (%)
Households with people 60 years and over (%)
Households with people 65 years and over (%)
Households with people 75 years and over (%)
Households with one or more nonrelatives (%)
Households with no nonrelatives (%)
Population in households (%)
Family households (%)
Nonfamily households (%)
Population in families (%)
Family households with own children (%)
Median number of bedrooms in owner occupied houses
Mean number of bedrooms in owner occupied houses
Median number of bedrooms in renter occupied houses
Mean number of bedrooms in renter occupied houses
Median number of vehichles in owner occupied houses
Mean number of vehichles in owner occupied houses
Median number of vehichles in renter occupied houses
Mean number of vehichles in renter occupied houses
Mortgage status - with mortgage (%)
Mortgage status - with second mortgage (%)
Mortgage status - with home equity loan (%)
Mortgage status - with both second mortgage and home equity loan (%)
Mortgage status - without a mortgage (%)
Average family size
Average family size - White
Average family size - Black or African American
Average family size - Asian
Average family size - Hispanic or Latino
Average family size - American Indian and Alaska Native
Average family size - Multirace
Average family size - Other Race
Geographical mobility - Same house 1 year ago (%)
Geographical mobility - Moved within same county (%)
Geographical mobility - Moved from different county within same state (%)
Geographical mobility - Moved from different state (%)
Geographical mobility - Moved from abroad (%)
Place of birth - Born in state of residence (%)
Place of birth - Born in other state (%)
Place of birth - Native, outside of US (%)
Place of birth - Foreign born (%)
Housing units in structures - 1, detached (%)
Housing units in structures - 1, attached (%)
Housing units in structures - 2 (%)
Housing units in structures - 3 or 4 (%)
Housing units in structures - 5 to 9 (%)
Housing units in structures - 10 to 19 (%)
Housing units in structures - 20 to 49 (%)
Housing units in structures - 50 or more (%)
Housing units in structures - Mobile home (%)
Housing units in structures - Boat, RV, van, etc. (%)
House/condo owner moved in on average (years ago)
Renter moved in on average (years ago)
Year householder moved into unit - Moved in 1999 to March 2000 (%)
Year householder moved into unit - Moved in 1995 to 1998 (%)
Year householder moved into unit - Moved in 1990 to 1994 (%)
Year householder moved into unit - Moved in 1980 to 1989 (%)
Year householder moved into unit - Moved in 1970 to 1979 (%)
Year householder moved into unit - Moved in 1969 or earlier (%)
Means of transportation to work - Drove car alone (%)
Means of transportation to work - Carpooled (%)
Means of transportation to work - Public transportation (%)
Means of transportation to work - Bus or trolley bus (%)
Means of transportation to work - Streetcar or trolley car (%)
Means of transportation to work - Subway or elevated (%)
Means of transportation to work - Railroad (%)
Means of transportation to work - Ferryboat (%)
Means of transportation to work - Taxicab (%)
Means of transportation to work - Motorcycle (%)
Means of transportation to work - Bicycle (%)
Means of transportation to work - Walked (%)
Means of transportation to work - Other means (%)
Working at home (%)
Industry diversity
Most Common Industries - Agriculture, forestry, fishing and hunting, and mining (%)
Most Common Industries - Agriculture, forestry, fishing and hunting (%)
Most Common Industries - Mining, quarrying, and oil and gas extraction (%)
Most Common Industries - Construction (%)
Most Common Industries - Manufacturing (%)
Most Common Industries - Wholesale trade (%)
Most Common Industries - Retail trade (%)
Most Common Industries - Transportation and warehousing, and utilities (%)
Most Common Industries - Transportation and warehousing (%)
Most Common Industries - Utilities (%)
Most Common Industries - Information (%)
Most Common Industries - Finance and insurance, and real estate and rental and leasing (%)
Most Common Industries - Finance and insurance (%)
Most Common Industries - Real estate and rental and leasing (%)
Most Common Industries - Professional, scientific, and management, and administrative and waste management services (%)
Most Common Industries - Professional, scientific, and technical services (%)
Most Common Industries - Management of companies and enterprises (%)
Most Common Industries - Administrative and support and waste management services (%)
Most Common Industries - Educational services, and health care and social assistance (%)
Most Common Industries - Educational services (%)
Most Common Industries - Health care and social assistance (%)
Most Common Industries - Arts, entertainment, and recreation, and accommodation and food services (%)
Most Common Industries - Arts, entertainment, and recreation (%)
Most Common Industries - Accommodation and food services (%)
Most Common Industries - Other services, except public administration (%)
Most Common Industries - Public administration (%)
Occupation diversity
Most Common Occupations - Management, business, science, and arts occupations (%)
Most Common Occupations - Management, business, and financial occupations (%)
Most Common Occupations - Management occupations (%)
Most Common Occupations - Business and financial operations occupations (%)
Most Common Occupations - Computer, engineering, and science occupations (%)
Most Common Occupations - Computer and mathematical occupations (%)
Most Common Occupations - Architecture and engineering occupations (%)
Most Common Occupations - Life, physical, and social science occupations (%)
Most Common Occupations - Education, legal, community service, arts, and media occupations (%)
Most Common Occupations - Community and social service occupations (%)
Most Common Occupations - Legal occupations (%)
Most Common Occupations - Education, training, and library occupations (%)
Most Common Occupations - Arts, design, entertainment, sports, and media occupations (%)
Most Common Occupations - Healthcare practitioners and technical occupations (%)
Most Common Occupations - Health diagnosing and treating practitioners and other technical occupations (%)
Most Common Occupations - Health technologists and technicians (%)
Most Common Occupations - Service occupations (%)
Most Common Occupations - Healthcare support occupations (%)
Most Common Occupations - Protective service occupations (%)
Most Common Occupations - Fire fighting and prevention, and other protective service workers including supervisors (%)
Most Common Occupations - Law enforcement workers including supervisors (%)
Most Common Occupations - Food preparation and serving related occupations (%)
Most Common Occupations - Building and grounds cleaning and maintenance occupations (%)
Most Common Occupations - Personal care and service occupations (%)
Most Common Occupations - Sales and office occupations (%)
Most Common Occupations - Sales and related occupations (%)
Most Common Occupations - Office and administrative support occupations (%)
Most Common Occupations - Natural resources, construction, and maintenance occupations (%)
Most Common Occupations - Farming, fishing, and forestry occupations (%)
Most Common Occupations - Construction and extraction occupations (%)
Most Common Occupations - Installation, maintenance, and repair occupations (%)
Most Common Occupations - Production, transportation, and material moving occupations (%)
Most Common Occupations - Production occupations (%)
Most Common Occupations - Transportation occupations (%)
Most Common Occupations - Material moving occupations (%)
People in Group quarters - Institutionalized population (%)
People in Group quarters - Correctional institutions (%)
People in Group quarters - Federal prisons and detention centers (%)
People in Group quarters - Halfway houses (%)
People in Group quarters - Local jails and other confinement facilities (including police lockups) (%)
People in Group quarters - Military disciplinary barracks (%)
People in Group quarters - State prisons (%)
People in Group quarters - Other types of correctional institutions (%)
People in Group quarters - Nursing homes (%)
People in Group quarters - Hospitals/wards, hospices, and schools for the handicapped (%)
People in Group quarters - Hospitals/wards and hospices for chronically ill (%)
People in Group quarters - Hospices or homes for chronically ill (%)
People in Group quarters - Military hospitals or wards for chronically ill (%)
People in Group quarters - Other hospitals or wards for chronically ill (%)
People in Group quarters - Hospitals or wards for drug/alcohol abuse (%)
People in Group quarters - Mental (Psychiatric) hospitals or wards (%)
People in Group quarters - Schools, hospitals, or wards for the mentally retarded (%)
People in Group quarters - Schools, hospitals, or wards for the physically handicapped (%)
People in Group quarters - Institutions for the deaf (%)
People in Group quarters - Institutions for the blind (%)
People in Group quarters - Orthopedic wards and institutions for the physically handicapped (%)
People in Group quarters - Wards in general hospitals for patients who have no usual home elsewhere (%)
People in Group quarters - Wards in military hospitals for patients who have no usual home elsewhere (%)
People in Group quarters - Juvenile institutions (%)
People in Group quarters - Long-term care (%)
People in Group quarters - Homes for abused, dependent, and neglected children (%)
People in Group quarters - Residential treatment centers for emotionally disturbed children (%)
People in Group quarters - Training schools for juvenile delinquents (%)
People in Group quarters - Short-term care, detention or diagnostic centers for delinquent children (%)
People in Group quarters - Type of juvenile institution unknown (%)
People in Group quarters - Noninstitutionalized population (%)
People in Group quarters - College dormitories (includes college quarters off campus) (%)
People in Group quarters - Military quarters (%)
People in Group quarters - On base (%)
People in Group quarters - Barracks, unaccompanied personnel housing (UPH), (Enlisted/Officer), ;and similar group living quarters for military personnel (%)
People in Group quarters - Transient quarters for temporary residents (%)
People in Group quarters - Military ships (%)
People in Group quarters - Group homes (%)
People in Group quarters - Homes or halfway houses for drug/alcohol abuse (%)
People in Group quarters - Homes for the mentally ill (%)
People in Group quarters - Homes for the mentally retarded (%)
People in Group quarters - Homes for the physically handicapped (%)
People in Group quarters - Other group homes (%)
People in Group quarters - Religious group quarters (%)
People in Group quarters - Dormitories (%)
People in Group quarters - Agriculture workers' dormitories on farms (%)
People in Group quarters - Job Corps and vocational training facilities (%)
People in Group quarters - Other workers' dormitories (%)
People in Group quarters - Crews of maritime vessels (%)
People in Group quarters - Other nonhousehold living situations (%)
People in Group quarters - Other noninstitutional group quarters (%)
Residents speaking English at home (%)
Residents speaking English at home - Born in the United States (%)
Residents speaking English at home - Native, born elsewhere (%)
Residents speaking English at home - Foreign born (%)
Residents speaking Spanish at home (%)
Residents speaking Spanish at home - Born in the United States (%)
Residents speaking Spanish at home - Native, born elsewhere (%)
Residents speaking Spanish at home - Foreign born (%)
Residents speaking other language at home (%)
Residents speaking other language at home - Born in the United States (%)
Residents speaking other language at home - Native, born elsewhere (%)
Residents speaking other language at home - Foreign born (%)
Class of Workers - Employee of private company (%)
Class of Workers - Self-employed in own incorporated business (%)
Class of Workers - Private not-for-profit wage and salary workers (%)
Class of Workers - Local government workers (%)
Class of Workers - State government workers (%)
Class of Workers - Federal government workers (%)
Class of Workers - Self-employed workers in own not incorporated business and Unpaid family workers (%)
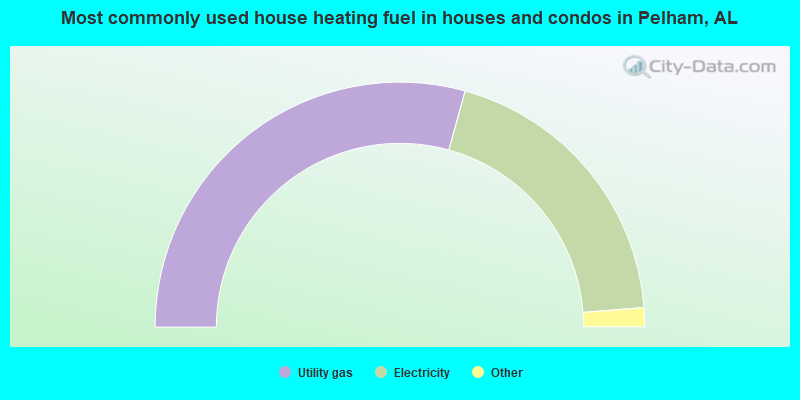
House heating fuel used in houses and condos - Utility gas (%)
House heating fuel used in houses and condos - Bottled, tank, or LP gas (%)
House heating fuel used in houses and condos - Electricity (%)
House heating fuel used in houses and condos - Fuel oil, kerosene, etc. (%)
House heating fuel used in houses and condos - Coal or coke (%)
House heating fuel used in houses and condos - Wood (%)
House heating fuel used in houses and condos - Solar energy (%)
House heating fuel used in houses and condos - Other fuel (%)
House heating fuel used in houses and condos - No fuel used (%)
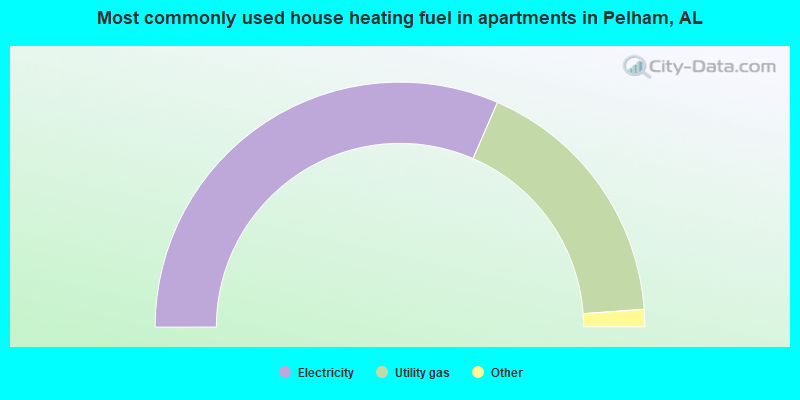
House heating fuel used in apartments - Utility gas (%)
House heating fuel used in apartments - Bottled, tank, or LP gas (%)
House heating fuel used in apartments - Electricity (%)
House heating fuel used in apartments - Fuel oil, kerosene, etc. (%)
House heating fuel used in apartments - Coal or coke (%)
House heating fuel used in apartments - Wood (%)
House heating fuel used in apartments - Solar energy (%)
House heating fuel used in apartments - Other fuel (%)
House heating fuel used in apartments - No fuel used (%)
Armed forces status - In Armed Forces (%)
Armed forces status - Civilian (%)
Armed forces status - Civilian - Veteran (%)
Armed forces status - Civilian - Nonveteran (%)
Fatal accidents locations in years 2005-2021
Fatal accidents locations in 2005
Fatal accidents locations in 2006
Fatal accidents locations in 2007
Fatal accidents locations in 2008
Fatal accidents locations in 2009
Fatal accidents locations in 2010
Fatal accidents locations in 2011
Fatal accidents locations in 2012
Fatal accidents locations in 2013
Fatal accidents locations in 2014
Fatal accidents locations in 2015
Fatal accidents locations in 2016
Fatal accidents locations in 2017
Fatal accidents locations in 2018
Fatal accidents locations in 2019
Fatal accidents locations in 2020
Fatal accidents locations in 2021
Alcohol use - People drinking some alcohol every month (%)
Alcohol use - People not drinking at all (%)
Alcohol use - Average days/month drinking alcohol
Alcohol use - Average drinks/week
Alcohol use - Average days/year people drink much
Audiometry - Average condition of hearing (%)
Audiometry - People that can hear a whisper from across a quiet room (%)
Audiometry - People that can hear normal voice from across a quiet room (%)
Audiometry - Ears ringing, roaring, buzzing (%)
Audiometry - Had a job exposure to loud noise (%)
Audiometry - Had off-work exposure to loud noise (%)
Blood Pressure & Cholesterol - Has high blood pressure (%)
Blood Pressure & Cholesterol - Checking blood pressure at home (%)
Blood Pressure & Cholesterol - Frequently checking blood cholesterol (%)
Blood Pressure & Cholesterol - Has high cholesterol level (%)
Consumer Behavior - Money monthly spent on food at supermarket/grocery store
Consumer Behavior - Money monthly spent on food at other stores
Consumer Behavior - Money monthly spent on eating out
Consumer Behavior - Money monthly spent on carryout/delivered foods
Consumer Behavior - Income spent on food at supermarket/grocery store (%)
Consumer Behavior - Income spent on food at other stores (%)
Consumer Behavior - Income spent on eating out (%)
Consumer Behavior - Income spent on carryout/delivered foods (%)
Current Health Status - General health condition (%)
Current Health Status - Blood donors (%)
Current Health Status - Has blood ever tested for HIV virus (%)
Current Health Status - Left-handed people (%)
Dermatology - People using sunscreen (%)
Diabetes - Diabetics (%)
Diabetes - Had a blood test for high blood sugar (%)
Diabetes - People taking insulin (%)
Diet Behavior & Nutrition - Diet health (%)
Diet Behavior & Nutrition - Milk product consumption (# of products/month)
Diet Behavior & Nutrition - Meals not home prepared (#/week)
Diet Behavior & Nutrition - Meals from fast food or pizza place (#/week)
Diet Behavior & Nutrition - Ready-to-eat foods (#/month)
Diet Behavior & Nutrition - Frozen meals/pizza (#/month)
Drug Use - People that ever used marijuana or hashish (%)
Drug Use - Ever used hard drugs (%)
Drug Use - Ever used any form of cocaine (%)
Drug Use - Ever used heroin (%)
Drug Use - Ever used methamphetamine (%)
Health Insurance - People covered by health insurance (%)
Kidney Conditions-Urology - Avg. # of times urinating at night
Medical Conditions - People with asthma (%)
Medical Conditions - People with anemia (%)
Medical Conditions - People with psoriasis (%)
Medical Conditions - People with overweight (%)
Medical Conditions - Elderly people having difficulties in thinking or remembering (%)
Medical Conditions - People who ever received blood transfusion (%)
Medical Conditions - People having trouble seeing even with glass/contacts (%)
Medical Conditions - People with arthritis (%)
Medical Conditions - People with gout (%)
Medical Conditions - People with congestive heart failure (%)
Medical Conditions - People with coronary heart disease (%)
Medical Conditions - People with angina pectoris (%)
Medical Conditions - People who ever had heart attack (%)
Medical Conditions - People who ever had stroke (%)
Medical Conditions - People with emphysema (%)
Medical Conditions - People with thyroid problem (%)
Medical Conditions - People with chronic bronchitis (%)
Medical Conditions - People with any liver condition (%)
Medical Conditions - People who ever had cancer or malignancy (%)
Mental Health - People who have little interest in doing things (%)
Mental Health - People feeling down, depressed, or hopeless (%)
Mental Health - People who have trouble sleeping or sleeping too much (%)
Mental Health - People feeling tired or having little energy (%)
Mental Health - People with poor appetite or overeating (%)
Mental Health - People feeling bad about themself (%)
Mental Health - People who have trouble concentrating on things (%)
Mental Health - People moving or speaking slowly or too fast (%)
Mental Health - People having thoughts they would be better off dead (%)
Oral Health - Average years since last visit a dentist
Oral Health - People embarrassed because of mouth (%)
Oral Health - People with gum disease (%)
Oral Health - General health of teeth and gums (%)
Oral Health - Average days a week using dental floss/device
Oral Health - Average days a week using mouthwash for dental problem
Oral Health - Average number of teeth
Pesticide Use - Households using pesticides to control insects (%)
Pesticide Use - Households using pesticides to kill weeds (%)
Physical Activity - People doing vigorous-intensity work activities (%)
Physical Activity - People doing moderate-intensity work activities (%)
Physical Activity - People walking or bicycling (%)
Physical Activity - People doing vigorous-intensity recreational activities (%)
Physical Activity - People doing moderate-intensity recreational activities (%)
Physical Activity - Average hours a day doing sedentary activities
Physical Activity - Average hours a day watching TV or videos
Physical Activity - Average hours a day using computer
Physical Functioning - People having limitations keeping them from working (%)
Physical Functioning - People limited in amount of work they can do (%)
Physical Functioning - People that need special equipment to walk (%)
Physical Functioning - People experiencing confusion/memory problems (%)
Physical Functioning - People requiring special healthcare equipment (%)
Prescription Medications - Average number of prescription medicines taking
Preventive Aspirin Use - Adults 40+ taking low-dose aspirin (%)
Reproductive Health - Vaginal deliveries (%)
Reproductive Health - Cesarean deliveries (%)
Reproductive Health - Deliveries resulted in a live birth (%)
Reproductive Health - Pregnancies resulted in a delivery (%)
Reproductive Health - Women breastfeeding newborns (%)
Reproductive Health - Women that had a hysterectomy (%)
Reproductive Health - Women that had both ovaries removed (%)
Reproductive Health - Women that have ever taken birth control pills (%)
Reproductive Health - Women taking birth control pills (%)
Reproductive Health - Women that have ever used Depo-Provera or injectables (%)
Reproductive Health - Women that have ever used female hormones (%)
Sexual Behavior - People 18+ that ever had sex (vaginal, anal, or oral) (%)
Sexual Behavior - Males 18+ that ever had vaginal sex with a woman (%)
Sexual Behavior - Males 18+ that ever performed oral sex on a woman (%)
Sexual Behavior - Males 18+ that ever had anal sex with a woman (%)
Sexual Behavior - Males 18+ that ever had any sex with a man (%)
Sexual Behavior - Females 18+ that ever had vaginal sex with a man (%)
Sexual Behavior - Females 18+ that ever performed oral sex on a man (%)
Sexual Behavior - Females 18+ that ever had anal sex with a man (%)
Sexual Behavior - Females 18+ that ever had any kind of sex with a woman (%)
Sexual Behavior - Average age people first had sex
Sexual Behavior - Average number of female sex partners in lifetime (males 18+)
Sexual Behavior - Average number of female vaginal sex partners in lifetime (males 18+)
Sexual Behavior - Average age people first performed oral sex on a woman (18+)
Sexual Behavior - Average number of woman performed oral sex on in lifetime (18+)
Sexual Behavior - Average number of male sex partners in lifetime (males 18+)
Sexual Behavior - Average number of male anal sex partners in lifetime (males 18+)
Sexual Behavior - Average age people first performed oral sex on a man (18+)
Sexual Behavior - Average number of male oral sex partners in lifetime (18+)
Sexual Behavior - People using protection when performing oral sex (%)
Sexual Behavior - Average number of times people have vaginal or anal sex a year
Sexual Behavior - People having sex without condom (%)
Sexual Behavior - Average number of male sex partners in lifetime (females 18+)
Sexual Behavior - Average number of male vaginal sex partners in lifetime (females 18+)
Sexual Behavior - Average number of female sex partners in lifetime (females 18+)
Sexual Behavior - Circumcised males 18+ (%)
Sleep Disorders - Average hours sleeping at night
Sleep Disorders - People that has trouble sleeping (%)
Smoking-Cigarette Use - People smoking cigarettes (%)
Taste & Smell - People 40+ having problems with smell (%)
Taste & Smell - People 40+ having problems with taste (%)
Taste & Smell - People 40+ that ever had wisdom teeth removed (%)
Taste & Smell - People 40+ that ever had tonsils teeth removed (%)
Taste & Smell - People 40+ that ever had a loss of consciousness because of a head injury (%)
Taste & Smell - People 40+ that ever had a broken nose or other serious injury to face or skull (%)
Taste & Smell - People 40+ that ever had two or more sinus infections (%)
Weight - Average height (inches)
Weight - Average weight (pounds)
Weight - Average BMI
Weight - People that are obese (%)
Weight - People that ever were obese (%)
Weight - People trying to lose weight (%)
17,289 69.5% White alone 3,083 12.4% Black alone 2,899 11.6% Hispanic 1,007 4.0% Asian alone 609 2.4% Two or more races 89 0.4% Other race alone 20 0.08% Native Hawaiian and Other 4 0.02% American Indian alone
According to our research of Alabama and other state lists, there were 13 registered sex offenders living in Pelham, Alabama as of April 26, 2024 . The ratio of all residents to sex offenders in Pelham is 1,746 to 1.The ratio of registered sex offenders to all residents in this city is much lower than the state average.
Officers per 1,000 residents here:
2.65Alabama average:
2.40
Latest news from Pelham, AL collected exclusively by city-data.com from local newspapers, TV, and radio stations
Ancestries: American (14.4%), English (10.6%), Irish (7.5%), German (5.0%), European (4.2%), Italian (2.7%).
Current Local Time:
Land area: 38.0 square miles.
Population density: 652 people per square mile (low).
1,764 residents are foreign born (4.3% Latin America , 2.3% Asia ).
This city:
7.1%Alabama:
3.5%
Median real estate property taxes paid for housing units with mortgages in 2022: $1,468 (0.5%)Median real estate property taxes paid for housing units with no mortgage in 2022: $1,174 (0.4%)
Nearest city with pop. 50,000+: Hoover, AL
Nearest city with pop. 200,000+: Birmingham, AL
Nearest city with pop. 1,000,000+: Houston, TX
Nearest cities:
Latitude: 33.30 N, Longitude: 86.78 W
Daytime population change due to commuting: +4,972 (+20.0%)Workers who live and work in this city: 5,124 (37.2%)
Area code commonly used in this area: 205
Pelham tourist attractions:
Single-family new house construction building permits:
2022: 136 buildings , average cost: $303,8002021: 130 buildings , average cost: $363,8002020: 125 buildings , average cost: $294,9002019: 103 buildings , average cost: $316,9002018: 111 buildings , average cost: $266,4002017: 117 buildings , average cost: $256,3002016: 138 buildings , average cost: $228,2002015: 102 buildings , average cost: $220,5002014: 91 buildings , average cost: $226,2002013: 113 buildings , average cost: $213,7002012: 78 buildings , average cost: $215,6002011: 64 buildings , average cost: $189,4002010: 55 buildings , average cost: $169,6002009: 80 buildings , average cost: $180,1002008: 91 buildings , average cost: $181,4002007: 258 buildings , average cost: $174,4002006: 315 buildings , average cost: $196,3002005: 292 buildings , average cost: $209,6002004: 411 buildings , average cost: $162,5002003: 296 buildings , average cost: $151,9002002: 344 buildings , average cost: $119,8002001: 435 buildings , average cost: $131,4002000: 393 buildings , average cost: $132,8001999: 369 buildings , average cost: $134,8001998: 306 buildings , average cost: $119,9001997: 267 buildings , average cost: $126,500Unemployment in December 2023:
Population change in the 1990s: +4,825 (+50.6%).
Most common occupations in Pelham, AL (%)
Both Males Females
Computer specialists (5.9%)
Other management occupations, except farmers and farm managers (5.1%)
Sales representatives, services, wholesale and manufacturing (4.8%)
Other office and administrative support workers, including supervisors (4.8%)
Other sales and related occupations, including supervisors (3.8%)
Retail sales workers, except cashiers (3.8%)
Secretaries and administrative assistants (3.3%)
Computer specialists (7.8%)
Sales representatives, services, wholesale and manufacturing (6.6%)
Other management occupations, except farmers and farm managers (5.6%)
Top executives (4.4%)
Other sales and related occupations, including supervisors (4.3%)
Engineers (4.1%)
Laborers and material movers, hand (3.7%)
Other office and administrative support workers, including supervisors (9.1%)
Secretaries and administrative assistants (7.3%)
Registered nurses (5.0%)
Other management occupations, except farmers and farm managers (4.5%)
Retail sales workers, except cashiers (4.0%)
Preschool, kindergarten, elementary, and middle school teachers (3.9%)
Health technologists and technicians (3.6%)
Tornado activity:
Pelham-area historical tornado activity is slightly above Alabama state average. It is 129% greater than the overall U.S. average.
On 4/4/1977, a category F5 (max. wind speeds 261-318 mph) tornado 17.1 miles away from the Pelham city center killed 22 people and injured 130 people and caused between $5,000,000 and $50,000,000 in damages.
On 4/8/1998, a category F5 tornado 19.7 miles away from the city center killed 32 people and injured 259 people and caused $200 million in damages.
Earthquake activity:
Pelham-area historical earthquake activity is significantly above Alabama state average. It is 120% greater than the overall U.S. average. On 1/18/1999 at 07:00:53, a magnitude 4.8 (4.8 MB, 4.0 LG, Depth: 0.6 mi, Class: Light, Intensity: IV - V) earthquake occurred 28.0 miles away from the city center On 4/29/2003 at 08:59:39, a magnitude 4.9 (4.4 MB, 4.6 MW, 4.9 LG) earthquake occurred 105.7 miles away from Pelham center On 6/24/1975 at 11:11:36, a magnitude 4.5 (4.5 MB) earthquake occurred 67.3 miles away from Pelham center On 10/24/1997 at 08:35:17, a magnitude 4.9 (4.8 MB, 4.2 MS, 4.9 LG, Depth: 6.2 mi) earthquake occurred 153.6 miles away from Pelham center On 4/29/2003 at 08:59:39, a magnitude 4.6 (4.6 MW, Depth: 12.3 mi) earthquake occurred 105.6 miles away from the city center On 11/7/2004 at 11:20:21, a magnitude 4.3 (4.3 MW, Depth: 3.1 mi) earthquake occurred 80.6 miles away from Pelham center Magnitude types: regional Lg-wave magnitude (LG), body-wave magnitude (MB), surface-wave magnitude (MS), moment magnitude (MW) Natural disasters: The number of natural disasters in Shelby County (19) is greater than the US average (15).Major Disasters (Presidential) Declared: 11Emergencies Declared: 6Storms: 10, Floods: 8, Tornadoes: 8, Hurricanes: 4, Winds: 3, Drought: 1, Fire: 1, Snowfall: 1, Winter Storm: 1, Other: 1 (Note: some incidents may be assigned to more than one category). Hospitals and medical centers in Pelham: FMC CAHABA VALLEY (120 CAHABA VALLEY PARKWAY)
Other hospitals and medical centers near Pelham: WIREGRASS HOSPICE BIRMINGHAM (Hospital, about 4 miles away; BIRMINGHAM, AL)
NEW BEACON OF ALABASTER (Hospital, about 5 miles away; ALABASTER, AL)
SHELBY RIDGE NURSING HOME (Nursing Home, about 5 miles away; ALABASTER, AL)
FAMILY COMFORT HOSPICE OF ALABASTER (Hospital, about 5 miles away; ALABASTER, AL)
GALLERIA WOODS SKILLED NURSING FACILITY (Nursing Home, about 5 miles away; BIRMINGHAM, AL)
HELPING HANDS HOSPICE (Hospital, about 5 miles away; HOOVER, AL)
HOSPICE SERVICES OF ALABAMA, LLC (Hospital, about 5 miles away; BIRMINGHAM, AL)
Amtrak station near Pelham: 15 miles: BIRMINGHAM (1819 MORRIS AVE.) Services: ticket office, partially wheelchair accessible, enclosed waiting area, public restrooms, public payphones, vending machines, paid short-term parking, paid long-term parking, call for taxi service.
Colleges/universities with over 2000 students nearest to Pelham:
Samford University (about 12 miles; Birmingham, AL ; Full-time enrollment: 3,829)
Virginia College-Birmingham (about 12 miles; Birmingham, AL ; FT enrollment: 8,167)
Lawson State Community College-Birmingham Campus (about 12 miles; Birmingham, AL ; FT enrollment: 2,695)
University of Alabama at Birmingham (about 14 miles; Birmingham, AL ; FT enrollment: 14,853)
University of Montevallo (about 15 miles; Montevallo, AL ; FT enrollment: 2,826)
Jefferson State Community College (about 25 miles; Birmingham, AL ; FT enrollment: 6,041)
The University of Alabama (about 45 miles; Tuscaloosa, AL ; FT enrollment: 30,931)
Public high schools in Pelham: PELHAM HIGH SCHOOL Students: 1, Location: 2500 PANTHER CIR, Grades: 9-12)LINDA NOLEN LEARNING CENTER Location: 2280 HIGHWY 35, Grades: PK-12)
Public elementary/middle schools in Pelham:
See full list of schools located in Pelham Library in Pelham: PELHAM PUBLIC LIBRARY Operating income: $1,093,611; Location: 3160 PELHAM PARKWAY; 46,748 books ; 2,800 audio materials ; 4,536 video materials ; 81 state licensed databases ; 4 other licensed databases ; 45 print serial subscriptions ; 81 electronic serial subscriptions )
Notable locations in Pelham: (A) , Foothills Visitors Center (B) , Pelham Fire Department Station 1 (C) , Pelham Fire Department Station 4 (D) , Pelham Fire Department Station 3 (E) , Pelham Fire Department Station 5 (F) , Pelham Fire Department Station 2 (G) . Display/hide their locations on the map
Shopping Centers: (1) , Riverbrook Plaza Shopping Center (2) , Southgate Village Shopping Center (3) , Shelby Mart Shopping Center (4) , Harvey Square Shopping Center (5) , Pelham Plaza Shopping Center (6) . Display/hide their locations on the map
Churches in Pelham include: (A) , Pelham United Methodist Church (B) , Pelham First Baptist Church (C) , Oak Mountain Baptist Church (D) . Display/hide their locations on the map
Cemeteries: (1) , Pelham Cemetery (2) , Deerhurst Cemetery (3) . Display/hide their locations on the map
Reservoirs: (A) , Lunker Lake (B) , Double Oak Lake (C) , Holtzclaw Lake (D) , Lake Warren (E) , Williams Lake (F) , Old Lake (G) , Wyatt Lake (H) . Display/hide their locations on the map
Streams, rivers, and creeks: (A) , Peavine Branch (B) , Lee Branch (C) , Johnson Brook (D) , Hogpen Creek (E) , Coales Branch (F) , Cahaba Valley Creek (G) , Big Sucker Brook (H) , Beech Branch (I) . Display/hide their locations on the map
Parks in Pelham include: (1) , Oak Mountain State Park (2) . Display/hide their locations on the map
Tourist attractions: (1) , Grand Slam USA (Amusement & Theme Parks; 2967 Pelham Parkway) (2) . Display/hide their approximate locations on the map
Hotels: (1) , Travelodge (410 Oak Mountain Circle) (2) , Sleep Inn Pelham (200 Southgate Drive) (3) , Apartment Hunters Inc (8841 Helena Road) (4) , Hampton Inn & Suites Birmingham/Pelham ( (232 Cahaba Valley Road) (5) , Comfort Inn (110 Cahaba Valley Parkway) (6) , Comfort Inn Pelham (110 Cahaba Valley Parkway) (7) , Best Western At Oak Mountain (100 Bishop Circle) (8) , Ramada Inn Limited at Pelham (113 Cahaba Valley Parkway) (9) . Display/hide their approximate locations on the map
Birthplace of: Brent Hinds - Heavy metal guitarist, Michael Adams - College football player (Louisville Cardinals), Montez Billings - Football player.
Shelby County has a predicted average indoor radon screening level between 2 and 4 pCi/L (pico curies per liter) - Moderate Potential Average household size: This city:
2.6 peopleAlabama:
2.5 people
Percentage of family households: This city:
70.7%Whole state:
67.8%
Percentage of households with unmarried partners: This city:
4.1%Whole state:
4.7%
Likely homosexual households (counted as self-reported same-sex unmarried-partner households)
Lesbian couples: 0.5% of all households Gay men: 0.3% of all households
2 people in local jails and other municipal confinement facilities in 2010people in nursing homes in 2000people in other noninstitutional group quarters in 2000
Banks with most branches in Pelham (2011 data):
Regions Bank: Pelham Branch at 2964 Pelham Parkway, branch established on 1972/07/13; Pelham Branch at 2228 Pelham Parkway, branch established on 1995/01/23. Info updated 2011/02/24: Bank assets: $123,368.2 mil, Deposits: $98,301.3 mil, headquarters in Birmingham, AL, positive income , Commercial Lending Specialization, 1778 total offices , Holding Company: Regions Financial Corporation
Wells Fargo Bank, National Association: North Shelby Branch at 3350 Pelham Parkway, branch established on 1984/01/23; Oak Mountain Branch at 2261 Highway 31 South, branch established on 1971/12/13. Info updated 2011/04/05: Bank assets: $1,161,490.0 mil, Deposits: $905,653.0 mil, headquarters in Sioux Falls, SD, positive income , 6395 total offices , Holding Company: Wells Fargo & Company
Union State Bank: Pelham Branch at 2267 Pelham Parkway, branch established on 1996/01/29. Info updated 2011/02/24: Bank assets: $274.5 mil, Deposits: $250.5 mil, headquarters in Pell City, AL, negative income in the last year , Commercial Lending Specialization, 15 total offices , Holding Company: Union Bancshares, Inc.
Synovus Bank: Pelham Branch at 2304 Pelham Parkway, branch established on 1997/03/24. Info updated 2011/01/25: Bank assets: $26,863.3 mil, Deposits: $22,415.0 mil, headquarters in Columbus, GA, positive income , Commercial Lending Specialization, 296 total offices , Holding Company: Synovus Financial Corp.
Central State Bank: Pelham Branch at 3145 Highway 31 South, branch established on 2005/10/10. Info updated 2011/02/24: Bank assets: $155.4 mil, Deposits: $131.3 mil, headquarters in Calera, AL, positive income , Commercial Lending Specialization, 4 total offices , Holding Company: Central State Bancorporation
Iberiabank: Pelham Branch at 2695 Pelham Parkway, branch established on 2003/03/31. Info updated 2011/06/08: Bank assets: $11,676.7 mil, Deposits: $9,387.9 mil, headquarters in Lafayette, LA, positive income , Commercial Lending Specialization, 187 total offices , Holding Company: Iberiabank Corporation
Frontier Bank: Pelham Branch at 2723 Pelham Parkway, branch established on 2006/10/03. Info updated 2012/03/01: Bank assets: $297.8 mil, Deposits: $253.4 mil, headquarters in Lagrange, GA, negative income in the last year , Commercial Lending Specialization, 10 total offices , Holding Company: Frontier National Corporation
Merchants and Farmers Bank: Pelham Branch at 3513 Pelham Parkway, branch established on 1986/03/31. Info updated 2007/01/11: Bank assets: $1,561.3 mil, Deposits: $1,372.4 mil, headquarters in Kosciusko, MS, positive income , Commercial Lending Specialization, 39 total offices , Holding Company: First M & F Corporation
First Financial Bank: Pelham Branch at 3304 Pelham Parkway, branch established on 1936/11/23. Info updated 2011/02/24: Bank assets: $208.9 mil, Deposits: $166.7 mil, headquarters in Bessemer, AL, negative income in the last year , Commercial Lending Specialization, 9 total offices , Holding Company: Firstfed Bancorp, Inc. Employee Stock Ownership Plan
4 other banks with 4 local branches
For population 15 years and over in Pelham:
Never married: 26.5%Now married: 59.7%Separated: 0.2%Widowed: 4.7%Divorced: 8.9% For population 25 years and over in Pelham:
High school or higher: 95.6%Bachelor's degree or higher: 47.8%Graduate or professional degree: 17.3%Unemployed: 3.1%Mean travel time to work (commute): 23.5 minutes
Education Gini index (Inequality in education) Here:
10.2Alabama average:
11.5
Religion statistics for Pelham, AL (based on Shelby County data)
Religion Adherents Congregations Evangelical Protestant 61,933 172 Mainline Protestant 16,076 38 Catholic 2,883 1 Black Protestant 2,421 12 Other 2,337 6 Orthodox 58 1 None 109,377 -
Source: Clifford Grammich, Kirk Hadaway, Richard Houseal, Dale E.Jones, Alexei Krindatch, Richie Stanley and Richard H.Taylor. 2012. 2010 U.S.Religion Census: Religious Congregations & Membership Study. Association of Statisticians of American Religious Bodies. Jones, Dale E., et al. 2002. Congregations and Membership in the United States 2000. Nashville, TN: Glenmary Research Center. Graphs represent county-level data
Food Environment Statistics: Number of grocery stores : 24Shelby County :
1.31 / 10,000 pop.State :
1.89 / 10,000 pop.
Number of supercenters and club stores : 3Shelby County :
0.16 / 10,000 pop.Alabama :
0.20 / 10,000 pop.
Number of convenience stores (no gas) : 5This county :
0.27 / 10,000 pop.State :
0.65 / 10,000 pop.
Number of convenience stores (with gas) : 94Shelby County :
5.14 / 10,000 pop.Alabama :
6.32 / 10,000 pop.
Number of full-service restaurants : 124Shelby County :
6.78 / 10,000 pop.State :
5.75 / 10,000 pop.
Adult diabetes rate : Shelby County :
7.4%Alabama :
11.8%
Adult obesity rate : This county :
28.1%Alabama :
31.7%
Low-income preschool obesity rate : Shelby County :
17.2%Alabama :
13.5%
Health and Nutrition: Healthy diet rate : Pelham:
48.5%Alabama:
49.0%
Average overall health of teeth and gums : Pelham:
46.3%Alabama:
45.7%
People feeling badly about themselves : This city:
21.7%Alabama:
20.7%
People not drinking alcohol at all : This city:
9.2%Alabama:
11.0%
Average hours sleeping at night : Overweight people : This city:
34.4%Alabama:
34.4%
General health condition : This city:
56.6%Alabama:
55.2%
Average condition of hearing : More about Health and Nutrition of Pelham, AL Residents
Local government employment and payroll (March 2022)
Function
Full-time employees
Monthly full-time payroll
Average yearly full-time wage
Part-time employees
Monthly part-time payroll
Firefighters
79 $521,768 $79,256 0 $0 Police Protection - Officers
67 $392,976 $70,384 0 $0 Parks and Recreation
34 $182,550 $64,429 65 $39,642 Streets and Highways
26 $132,762 $61,275 0 $0 Water Supply
20 $94,313 $56,588 0 $0 Police - Other
15 $70,997 $56,798 2 $1,238 Other Government Administration
12 $92,489 $92,489 0 $0 Local Libraries
10 $51,325 $61,590 7 $5,943 Financial Administration
7 $46,166 $79,142 2 $3,333 Sewerage
6 $30,927 $61,854 0 $0 Judicial and Legal
5 $27,929 $67,030 1 $1,827 Other and Unallocable
2 $13,129 $78,774 0 $0 Fire - Other
1 $5,330 $63,960 0 $0
Totals for Government
284 $1,662,659 $70,253 77 $51,983
Pelham government finances - Expenditure in 2021 (per resident):
Construction - General - Other: $11,107,000 ($448.68)
Parks and Recreation: $4,476,000 ($180.81)Sewerage: $841,000 ($33.97)Water Utilities: $686,000 ($27.71)Current Operations - Central Staff Services: $12,304,000 ($497.03)
Parks and Recreation: $9,079,000 ($366.75)Police Protection: $8,748,000 ($353.38)Local Fire Protection: $8,609,000 ($347.77)Sewerage: $3,525,000 ($142.40)Regular Highways: $2,590,000 ($104.63)Water Utilities: $2,577,000 ($104.10)Libraries: $1,579,000 ($63.79)Solid Waste Management: $1,346,000 ($54.37)General - Other: $662,000 ($26.74)General - Interest on Debt: $1,982,000 ($80.06)
Other Capital Outlay - Police Protection: $157,000 ($6.34)
Regular Highways: $134,000 ($5.41)Libraries: $74,000 ($2.99)Parks and Recreation: $5,000 ($0.20)Water Utilities - Interest on Debt: $266,000 ($10.75)
Pelham government finances - Revenue in 2021 (per resident):
Charges - Sewerage: $6,140,000 ($248.03)
Parks and Recreation: $5,840,000 ($235.91)Solid Waste Management: $1,428,000 ($57.69)Other: $379,000 ($15.31)Miscellaneous - General Revenue - Other: $3,782,000 ($152.78)
Fines and Forfeits: $2,205,000 ($89.07)Interest Earnings: $2,182,000 ($88.14)Sale of Property: $1,631,000 ($65.89)Revenue - Water Utilities: $4,707,000 ($190.14)
Tax - General Sales and Gross Receipts: $30,672,000 ($1239.02)
Property: $6,915,000 ($279.34)Other License: $5,093,000 ($205.74)Motor Fuels Sales: $937,000 ($37.85)Other Selective Sales: $283,000 ($11.43)
Pelham government finances - Debt in 2021 (per resident):
Long Term Debt - Beginning Outstanding - Unspecified Public Purpose: $57,309,000 ($2315.05)
Outstanding Unspecified Public Purpose: $50,765,000 ($2050.70)Retired Unspecified Public Purpose: $6,544,000 ($264.35)Beginning Outstanding - Public Debt for Private Purpose: $5,912,000 ($238.82)Outstanding Nonguaranteed - Industrial Revenue: $4,148,000 ($167.56)Retired Nonguaranteed - Public Debt for Private Purpose: $1,764,000 ($71.26)
Pelham government finances - Cash and Securities in 2021 (per resident):
Other Funds - Cash and Securities: $17,560,000 ($709.35)
Sinking Funds - Cash and Securities: $10,531,000 ($425.41)
Businesses in Pelham, AL
Name Count Name Count
AT&T 1 Marriott 1 Advance Auto Parts 2 MasterBrand Cabinets 3 Applebee's 1 Mazda 1 Arby's 1 McDonald's 1 AutoZone 2 Papa John's Pizza 1 Best Western 1 Penske 1 Budget Car Rental 1 Pizza Hut 1 Burger King 1 Popeyes 1 CVS 2 Publix Super Markets 1 Chick-Fil-A 1 Quality 1 Comfort Suites 1 Ramada 1 Cracker Barrel 1 Rite Aid 1 Dairy Queen 1 Ruby Tuesday 1 Domino's Pizza 1 SONIC Drive-In 2 Dunkin Donuts 1 Sleep Inn 1 FedEx 4 Subway 4 Firestone Complete Auto Care 1 T-Mobile 1 GNC 1 Taco Bell 1 H&R Block 1 Travelodge 1 Hilton 1 U-Haul 1 Holiday Inn 1 UPS 7 Home Depot 1 Waffle House 2 IHOP 1 Walgreens 2 KFC 2 Walmart 1 Lane Furniture 1 YMCA 1
Strongest AM radio stations in Pelham:
WJOX (690 AM; 50 kW; BIRMINGHAM, AL; Owner: CITADEL BROADCASTING COMPANY)
WAPI (1070 AM; 50 kW; BIRMINGHAM, AL; Owner: CITADEL BROADCASTING COMPANY)
WDJC (850 AM; 50 kW; BIRMINGHAM, AL; Owner: KIMTRON, INC.)
WQCR (1500 AM; 2 kW; ALABASTER, AL; Owner: WGTT, INC.)
WERC (960 AM; 5 kW; BIRMINGHAM, AL; Owner: CAPSTAR TX LIMITED PARTNERSHIP)
WYDE (1260 AM; 5 kW; BIRMINGHAM, AL; Owner: KIMTRON, INC.)
WNSI (810 AM; 50 kW; JACKSONVILLE, AL; Owner: UNITED BROADCASTING NETWORK, INC.)
WRJS (1320 AM; 5 kW; BIRMINGHAM, AL; Owner: CXR HOLDINGS, INC.)
WLPH (1480 AM; daytime; 5 kW; IRONDALE, AL; Owner: BIRMINGHAM CHRISTIAN RADIO, INC.)
WKNG (1060 AM; daytime; 50 kW; TALLAPOOSA, GA; Owner: WKNG, INC.)
WAYE (1220 AM; 1 kW; BIRMINGHAM, AL; Owner: BIRMINGHAM CHRISTIAN RADIO, INC.)
WSMQ (1450 AM; 1 kW; BESSEMER, AL; Owner: BESSEMER RADIO INC.)
WJLD (1400 AM; 1 kW; FAIRFIELD, AL; Owner: RICHARDSON BROADCASTING CORPORATION)
Strongest FM radio stations in Pelham:
WQEM (101.5 FM; COLUMBIANA, AL; Owner: GLEN IRIS BAPTIST SCHOOL)
WODL (97.3 FM; HOMEWOOD, AL; Owner: CXR HOLDINGS, INC.)
WMJJ (96.5 FM; BIRMINGHAM, AL; Owner: CAPSTAR TX LIMITED PARTNERSHIP)
WYSF (94.5 FM; BIRMINGHAM, AL; Owner: CITADEL BROADCASTING COMPANY)
WBHK (98.7 FM; WARRIOR, AL; Owner: CXR HOLDINGS, INC.)
WZZK-FM (104.7 FM; BIRMINGHAM, AL; Owner: CXR HOLDINGS, INC.)
WQEN (103.7 FM; GADSDEN, AL; Owner: CAPSTAR TX LIMITED PARTNERSHIP)
WBPT (106.9 FM; BIRMINGHAM, AL; Owner: CXR HOLDINGS, INC.)
WZRR (99.5 FM; BIRMINGHAM, AL; Owner: CITADEL BROADCASTING COMPANY)
WDJC-FM (93.7 FM; BIRMINGHAM, AL; Owner: KIMTRON, INC.)
WBHM (90.3 FM; BIRMINGHAM, AL; Owner: BD OF TRUSTEES/U OF AL AT BIRMINGHAM)
WLJR (88.5 FM; BIRMINGHAM, AL; Owner: BRIARWOOD PRESBYTERIAN CHURCH)
WGIB (91.9 FM; BIRMINGHAM, AL; Owner: GLEN IRIS BAPTIST SCHOOL)
W281AB (104.1 FM; MOUNTAIN BROOK, AL; Owner: FAMILY STATIONS, INC.)
WBFR (89.5 FM; BIRMINGHAM, AL; Owner: FAMILY STATIONS, INC.)
WVSU-FM (91.1 FM; BIRMINGHAM, AL; Owner: SAMFORD UNIVERSITY)
WDXB (102.5 FM; JASPER, AL; Owner: CAPSTAR TX LIMITED PARTNERSHIP)
WRAX (107.7 FM; BIRMINGHAM, AL; Owner: CITADEL BROADCASTING COMPANY)
WENN (105.9 FM; TRUSSVILLE, AL; Owner: CAPSTAR TX LIMITED PARTNERSHIP)
WANZ (100.7 FM; NORTHPORT, AL; Owner: APEX BRAODCASTING INC.)
TV broadcast stations around Pelham:
WABM (Channel 68; BIRMINGHAM, AL; Owner: BIRMINGHAM (WABM-TV) LICENSEE, INC.)
WIAT (Channel 42; BIRMINGHAM, AL; Owner: MEDIA GENERAL COMMUNICATIONS, INC.)
WBIQ (Channel 10; BIRMINGHAM, AL; Owner: ALABAMA EDUCATIONAL TELEVISION COMMISSION)
WTTO (Channel 21; HOMEWOOD, AL; Owner: WTTO LICENSEE, LLC)
WBXA-CA (Channel 2; BIRMINGHAM, AL; Owner: THE BOX WORLDWIDE LLC)
WBRC (Channel 6; BIRMINGHAM, AL; Owner: WBRC LICENSE, INC.)
WVTM-TV (Channel 13; BIRMINGHAM, AL; Owner: BIRMINGHAM BROADCASTING (WVTM-TV), LLC)
W27CM (Channel 27; BIRMINGHAM, AL; Owner: EQUITY BROADCASTING CORPORATION)
WBMA-LP (Channel 58; BIRMINGHAM, AL; Owner: TV ALABAMA, INC.)
WDBB (Channel 17; BESSEMER, AL; Owner: WDBB-TV, INC.)
WCFT-TV (Channel 33; TUSCALOOSA, AL; Owner: TV ALABAMA, INCORPORATED)
W34BI (Channel 34; BIRMINGHAM, AL; Owner: VENTANA TELEVISION, INC.)
W46DK (Channel 46; BIRMINGHAM, AL; Owner: TRINITY BROADCASTING NETWORK)
W15AZ (Channel 15; ALABASTER, AL; Owner: GLEN IRIS BAPTIST CHURCH SCHOOL)
WOTM-LP (Channel 19; MONTEVALLO, AL; Owner: JAMES DONALD EARLEY)
W49AY (Channel 49; BIRMINGHAM, AL; Owner: GLEN IRIS BAPTIST SCHOOL)
W62BG (Channel 62; BIRMINGHAM, AL; Owner: WTTO LICENSEE, LLC)
WJSU-TV (Channel 40; ANNISTON, AL; Owner: TV ALABAMA, INC.)
National Bridge Inventory (NBI) Statistics 39 Number of bridges354ft / 108m Total length $71,159,000 Total costs605,563 Total average daily traffic85,923 Total average daily truck traffic
New bridges - historical statistics
1 1920-1929 2 1930-1939 1 1940-1949 5 1950-1959 11 1970-1979 7 1980-1989 7 1990-1999 5 2000-2009
See full National Bridge Inventory statistics for Pelham, AL
Home Mortgage Disclosure Act Aggregated Statistics For Year 2009(Based on 7 partial tracts) A) FHA, FSA/RHS & VA B) Conventional C) Refinancings D) Home Improvement Loans F) Non-occupant Loans on G) Loans On Manufactured Number Average Value Number Average Value Number Average Value Number Average Value Number Average Value Number Average Value
LOANS ORIGINATED 175 $146,288 95 $151,366 554 $168,356 28 $62,285 21 $98,380 2 $25,685 APPLICATIONS APPROVED, NOT ACCEPTED 6 $123,628 7 $122,329 49 $181,690 3 $85,307 3 $187,190 2 $34,600 APPLICATIONS DENIED 18 $146,848 15 $113,740 190 $172,720 23 $16,354 5 $201,620 6 $34,113 APPLICATIONS WITHDRAWN 27 $149,324 24 $178,415 181 $170,933 3 $145,413 5 $123,326 0 $0 FILES CLOSED FOR INCOMPLETENESS 4 $164,342 2 $154,735 37 $162,525 4 $102,198 1 $173,210 0 $0
Aggregated Statistics For Year 2008(Based on 7 partial tracts) A) FHA, FSA/RHS & VA B) Conventional C) Refinancings D) Home Improvement Loans F) Non-occupant Loans on G) Loans On Manufactured Number Average Value Number Average Value Number Average Value Number Average Value Number Average Value Number Average Value
LOANS ORIGINATED 138 $148,672 213 $157,412 328 $167,670 34 $42,732 36 $141,988 5 $46,284 APPLICATIONS APPROVED, NOT ACCEPTED 6 $168,553 19 $162,723 59 $155,114 5 $92,644 4 $106,998 4 $45,182 APPLICATIONS DENIED 19 $155,694 36 $256,469 192 $157,310 37 $69,675 13 $157,368 12 $48,926 APPLICATIONS WITHDRAWN 15 $125,963 21 $177,793 119 $165,784 10 $126,620 5 $149,626 0 $0 FILES CLOSED FOR INCOMPLETENESS 3 $177,467 10 $172,722 25 $166,017 2 $57,690 1 $134,220 0 $0
Aggregated Statistics For Year 2007(Based on 7 partial tracts) A) FHA, FSA/RHS & VA B) Conventional C) Refinancings D) Home Improvement Loans F) Non-occupant Loans on G) Loans On Manufactured Number Average Value Number Average Value Number Average Value Number Average Value Number Average Value Number Average Value
LOANS ORIGINATED 47 $145,039 555 $148,680 362 $141,422 52 $55,326 44 $113,837 3 $42,617 APPLICATIONS APPROVED, NOT ACCEPTED 5 $113,734 49 $141,384 77 $124,281 10 $59,068 4 $87,338 2 $49,900 APPLICATIONS DENIED 3 $132,723 62 $122,871 218 $145,338 57 $71,182 11 $155,627 12 $43,646 APPLICATIONS WITHDRAWN 5 $148,102 55 $153,768 121 $153,852 16 $100,376 6 $140,005 0 $0 FILES CLOSED FOR INCOMPLETENESS 2 $88,535 18 $130,272 42 $170,735 2 $126,735 2 $116,845 0 $0
Aggregated Statistics For Year 2006(Based on 7 partial tracts) A) FHA, FSA/RHS & VA B) Conventional C) Refinancings D) Home Improvement Loans E) Loans on Dwellings For 5+ Families F) Non-occupant Loans on G) Loans On Manufactured Number Average Value Number Average Value Number Average Value Number Average Value Number Average Value Number Average Value Number Average Value
LOANS ORIGINATED 34 $152,185 742 $134,030 398 $129,293 45 $56,473 1 $7,288,980 53 $132,205 8 $49,665 APPLICATIONS APPROVED, NOT ACCEPTED 1 $118,680 69 $120,705 59 $110,657 13 $34,358 0 $0 3 $82,203 8 $35,132 APPLICATIONS DENIED 3 $127,757 83 $116,266 210 $142,952 55 $54,167 0 $0 12 $117,334 14 $50,818 APPLICATIONS WITHDRAWN 6 $136,293 81 $126,884 150 $134,812 26 $94,042 0 $0 8 $120,186 1 $43,580 FILES CLOSED FOR INCOMPLETENESS 1 $109,400 25 $147,690 58 $150,488 4 $86,225 0 $0 2 $109,180 0 $0
Aggregated Statistics For Year 2005(Based on 7 partial tracts) A) FHA, FSA/RHS & VA B) Conventional C) Refinancings D) Home Improvement Loans E) Loans on Dwellings For 5+ Families F) Non-occupant Loans on G) Loans On Manufactured Number Average Value Number Average Value Number Average Value Number Average Value Number Average Value Number Average Value Number Average Value
LOANS ORIGINATED 44 $133,840 810 $129,736 456 $137,119 51 $42,509 1 $7,066,220 50 $114,827 14 $46,858 APPLICATIONS APPROVED, NOT ACCEPTED 2 $102,820 67 $130,087 74 $129,323 6 $56,828 0 $0 3 $133,460 8 $48,710 APPLICATIONS DENIED 5 $143,204 110 $99,923 241 $131,932 72 $34,805 0 $0 8 $123,770 31 $40,526 APPLICATIONS WITHDRAWN 1 $145,710 116 $143,770 152 $150,404 32 $89,473 0 $0 13 $109,357 5 $66,946 FILES CLOSED FOR INCOMPLETENESS 1 $105,780 22 $144,817 96 $144,854 5 $96,750 0 $0 1 $133,600 2 $84,945
Aggregated Statistics For Year 2004(Based on 7 partial tracts) A) FHA, FSA/RHS & VA B) Conventional C) Refinancings D) Home Improvement Loans F) Non-occupant Loans on G) Loans On Manufactured Number Average Value Number Average Value Number Average Value Number Average Value Number Average Value Number Average Value
LOANS ORIGINATED 61 $126,353 777 $124,689 508 $137,262 38 $36,534 52 $96,191 13 $28,832 APPLICATIONS APPROVED, NOT ACCEPTED 3 $107,220 54 $126,107 101 $130,925 4 $18,885 4 $89,370 7 $46,034 APPLICATIONS DENIED 5 $113,914 92 $114,396 240 $128,042 49 $35,480 11 $123,378 23 $39,427 APPLICATIONS WITHDRAWN 10 $114,676 76 $126,694 176 $137,905 16 $55,309 6 $125,083 2 $81,600 FILES CLOSED FOR INCOMPLETENESS 0 $0 29 $134,392 88 $141,585 3 $90,223 3 $95,077 1 $39,870
Aggregated Statistics For Year 2003(Based on 7 partial tracts) A) FHA, FSA/RHS & VA B) Conventional C) Refinancings D) Home Improvement Loans E) Loans on Dwellings For 5+ Families F) Non-occupant Loans on Number Average Value Number Average Value Number Average Value Number Average Value Number Average Value Number Average Value
LOANS ORIGINATED 108 $122,753 688 $127,717 1,141 $131,690 44 $36,044 1 $8,999,700 35 $94,857 APPLICATIONS APPROVED, NOT ACCEPTED 2 $156,520 45 $141,030 132 $133,144 10 $55,089 0 $0 5 $93,838 APPLICATIONS DENIED 4 $118,355 60 $112,050 268 $118,508 33 $34,032 0 $0 5 $192,932 APPLICATIONS WITHDRAWN 11 $129,961 71 $129,144 192 $127,579 10 $75,689 0 $0 5 $139,950 FILES CLOSED FOR INCOMPLETENESS 1 $151,810 22 $108,557 52 $143,165 2 $21,735 0 $0 1 $204,810
Aggregated Statistics For Year 2002(Based on 1 partial tract) A) FHA, FSA/RHS & VA B) Conventional C) Refinancings D) Home Improvement Loans F) Non-occupant Loans on Number Average Value Number Average Value Number Average Value Number Average Value Number Average Value
LOANS ORIGINATED 11 $127,706 167 $155,454 220 $190,630 9 $34,918 5 $152,320 APPLICATIONS APPROVED, NOT ACCEPTED 0 $0 11 $163,311 13 $194,245 2 $48,370 0 $0 APPLICATIONS DENIED 1 $63,320 15 $137,546 24 $171,712 4 $15,098 0 $0 APPLICATIONS WITHDRAWN 5 $125,116 15 $173,389 23 $152,030 0 $0 1 $140,130 FILES CLOSED FOR INCOMPLETENESS 0 $0 4 $100,550 12 $177,112 1 $17,590 1 $40,450
Aggregated Statistics For Year 2001(Based on 1 partial tract) A) FHA, FSA/RHS & VA B) Conventional C) Refinancings D) Home Improvement Loans F) Non-occupant Loans on Number Average Value Number Average Value Number Average Value Number Average Value Number Average Value
LOANS ORIGINATED 12 $119,019 152 $159,801 150 $177,891 11 $24,145 6 $110,615 APPLICATIONS APPROVED, NOT ACCEPTED 0 $0 9 $157,193 5 $79,972 2 $34,300 0 $0 APPLICATIONS DENIED 1 $56,280 13 $100,483 21 $211,626 4 $49,690 1 $1,760 APPLICATIONS WITHDRAWN 1 $147,160 6 $146,770 20 $169,382 1 $37,520 0 $0 FILES CLOSED FOR INCOMPLETENESS 1 $40,450 1 $155,370 4 $170,468 1 $7,040 0 $0
Aggregated Statistics For Year 2000(Based on 1 partial tract) A) FHA, FSA/RHS & VA B) Conventional C) Refinancings D) Home Improvement Loans F) Non-occupant Loans on Number Average Value Number Average Value Number Average Value Number Average Value Number Average Value
LOANS ORIGINATED 7 $122,369 119 $165,627 26 $138,006 6 $26,285 3 $82,473 APPLICATIONS APPROVED, NOT ACCEPTED 0 $0 7 $91,966 8 $129,132 2 $22,280 0 $0 APPLICATIONS DENIED 1 $46,320 37 $55,461 13 $121,815 2 $14,660 1 $133,680 APPLICATIONS WITHDRAWN 1 $123,710 14 $144,858 9 $158,106 1 $110,810 1 $85,010 FILES CLOSED FOR INCOMPLETENESS 1 $48,660 5 $163,344 2 $178,820 0 $0 1 $60,390
Aggregated Statistics For Year 1999(Based on 4 partial tracts) A) FHA, FSA/RHS & VA B) Conventional C) Refinancings D) Home Improvement Loans F) Non-occupant Loans on Number Average Value Number Average Value Number Average Value Number Average Value Number Average Value
LOANS ORIGINATED 141 $103,945 475 $115,096 192 $102,103 36 $15,051 16 $75,972 APPLICATIONS APPROVED, NOT ACCEPTED 4 $87,878 37 $78,930 24 $80,944 8 $13,605 0 $0 APPLICATIONS DENIED 8 $118,709 111 $53,422 58 $82,288 13 $12,304 7 $44,437 APPLICATIONS WITHDRAWN 8 $113,018 34 $113,609 28 $96,095 2 $61,725 0 $0 FILES CLOSED FOR INCOMPLETENESS 1 $116,970 5 $88,722 22 $109,949 0 $0 0 $0
Detailed HMDA statistics for the following Tracts:
0303.07
, 0303.13 , 0303.15 , 0303.16 , 0303.18 , 0306.08 , 0306.09
Private Mortgage Insurance Companies Aggregated Statistics For Year 2009(Based on 7 partial tracts) A) Conventional B) Refinancings Number Average Value Number Average Value
LOANS ORIGINATED 24 $184,622 35 $187,929 APPLICATIONS APPROVED, NOT ACCEPTED 7 $237,171 8 $196,392 APPLICATIONS DENIED 5 $206,522 5 $181,894 APPLICATIONS WITHDRAWN 4 $165,978 1 $283,540 FILES CLOSED FOR INCOMPLETENESS 1 $34,610 3 $153,423
Aggregated Statistics For Year 2008(Based on 7 partial tracts) A) Conventional B) Refinancings C) Non-occupant Loans on Number Average Value Number Average Value Number Average Value
LOANS ORIGINATED 94 $163,486 55 $196,371 10 $120,222 APPLICATIONS APPROVED, NOT ACCEPTED 27 $162,551 25 $188,281 3 $144,073 APPLICATIONS DENIED 12 $184,762 2 $269,085 7 $137,540 APPLICATIONS WITHDRAWN 3 $159,283 4 $203,632 1 $199,470 FILES CLOSED FOR INCOMPLETENESS 3 $150,137 1 $179,700 1 $102,770
Aggregated Statistics For Year 2007(Based on 7 partial tracts) A) Conventional B) Refinancings C) Non-occupant Loans on Number Average Value Number Average Value Number Average Value
LOANS ORIGINATED 212 $160,241 72 $165,444 6 $166,252 APPLICATIONS APPROVED, NOT ACCEPTED 22 $166,437 15 $156,132 3 $157,700 APPLICATIONS DENIED 5 $178,614 2 $202,905 1 $272,310 APPLICATIONS WITHDRAWN 10 $149,041 2 $282,660 1 $97,780 FILES CLOSED FOR INCOMPLETENESS 1 $116,360 0 $0 0 $0
Aggregated Statistics For Year 2006(Based on 7 partial tracts) A) Conventional B) Refinancings C) Non-occupant Loans on Number Average Value Number Average Value Number Average Value
LOANS ORIGINATED 150 $155,831 38 $158,641 7 $113,529 APPLICATIONS APPROVED, NOT ACCEPTED 16 $149,939 12 $175,761 0 $0 APPLICATIONS DENIED 1 $89,080 0 $0 0 $0 APPLICATIONS WITHDRAWN 10 $141,480 5 $154,142 0 $0 FILES CLOSED FOR INCOMPLETENESS 0 $0 0 $0 0 $0
Aggregated Statistics For Year 2005(Based on 7 partial tracts) A) Conventional B) Refinancings C) Non-occupant Loans on Number Average Value Number Average Value Number Average Value
LOANS ORIGINATED 140 $155,213 54 $147,575 10 $126,081 APPLICATIONS APPROVED, NOT ACCEPTED 14 $149,886 13 $151,408 1 $52,730 APPLICATIONS DENIED 0 $0 1 $91,280 0 $0 APPLICATIONS WITHDRAWN 12 $137,488 3 $135,807 1 $112,450 FILES CLOSED FOR INCOMPLETENESS 0 $0 0 $0 0 $0
Aggregated Statistics For Year 2004(Based on 7 partial tracts) A) Conventional B) Refinancings C) Non-occupant Loans on D) Loans On Manufactured Number Average Value Number Average Value Number Average Value Number Average Value
LOANS ORIGINATED 182 $144,351 67 $141,183 10 $114,523 1 $108,070 APPLICATIONS APPROVED, NOT ACCEPTED 22 $140,368 22 $138,307 3 $114,420 0 $0 APPLICATIONS DENIED 1 $220,360 1 $132,970 0 $0 0 $0 APPLICATIONS WITHDRAWN 12 $145,769 4 $158,042 1 $70,940 0 $0 FILES CLOSED FOR INCOMPLETENESS 2 $112,850 0 $0 0 $0 0 $0
Aggregated Statistics For Year 2003(Based on 7 partial tracts) A) Conventional B) Refinancings C) Non-occupant Loans on Number Average Value Number Average Value Number Average Value
LOANS ORIGINATED 222 $140,625 240 $135,556 5 $128,134 APPLICATIONS APPROVED, NOT ACCEPTED 11 $178,730 47 $141,488 1 $74,910 APPLICATIONS DENIED 4 $136,010 2 $228,575 2 $76,960 APPLICATIONS WITHDRAWN 10 $124,049 14 $160,000 1 $87,110 FILES CLOSED FOR INCOMPLETENESS 1 $64,130 1 $138,950 0 $0
Aggregated Statistics For Year 2002(Based on 1 partial tract) A) Conventional B) Refinancings C) Non-occupant Loans on Number Average Value Number Average Value Number Average Value
LOANS ORIGINATED 41 $183,669 29 $202,658 1 $187,030 APPLICATIONS APPROVED, NOT ACCEPTED 6 $167,193 3 $179,800 1 $92,640 APPLICATIONS DENIED 0 $0 0 $0 0 $0 APPLICATIONS WITHDRAWN 2 $189,375 4 $236,718 1 $152,440 FILES CLOSED FOR INCOMPLETENESS 0 $0 0 $0 0 $0
Aggregated Statistics For Year 2001(Based on 1 partial tract) A) Conventional B) Refinancings C) Non-occupant Loans on Number Average Value Number Average Value Number Average Value
LOANS ORIGINATED 47 $187,504 23 $198,730 1 $192,890 APPLICATIONS APPROVED, NOT ACCEPTED 3 $229,440 2 $192,600 0 $0 APPLICATIONS DENIED 1 $235,110 1 $46,900 0 $0 APPLICATIONS WITHDRAWN 1 $185,270 0 $0 0 $0 FILES CLOSED FOR INCOMPLETENESS 0 $0 0 $0 0 $0
Aggregated Statistics For Year 2000(Based on 1 partial tract) A) Conventional B) Refinancings C) Non-occupant Loans on Number Average Value Number Average Value Number Average Value
LOANS ORIGINATED 36 $201,036 5 $166,626 0 $0 APPLICATIONS APPROVED, NOT ACCEPTED 4 $217,810 1 $113,160 1 $89,700 APPLICATIONS DENIED 1 $274,970 1 $286,110 0 $0 APPLICATIONS WITHDRAWN 0 $0 0 $0 0 $0 FILES CLOSED FOR INCOMPLETENESS 1 $114,910 0 $0 0 $0
Aggregated Statistics For Year 1999(Based on 4 partial tracts) A) Conventional B) Refinancings C) Non-occupant Loans on Number Average Value Number Average Value Number Average Value
LOANS ORIGINATED 224 $125,320 44 $119,294 1 $79,080 APPLICATIONS APPROVED, NOT ACCEPTED 6 $132,625 6 $145,938 0 $0 APPLICATIONS DENIED 4 $159,592 0 $0 0 $0 APPLICATIONS WITHDRAWN 5 $162,648 1 $57,700 0 $0 FILES CLOSED FOR INCOMPLETENESS 1 $122,480 1 $87,270 0 $0
Detailed PMIC statistics for the following Tracts:
0303.07
, 0303.13 , 0303.15 , 0303.16 , 0303.18 , 0306.08 , 0306.09 Fire-safe hotels and motels in Pelham, Alabama:
Comfort Inn, 110 Cahaba Valley Pkwy, Pelham, Alabama 35124 Phone: (205) 444-9200, Fax: (205) 444-9846
Travelodge, 410 Oak Mtn Cir, Pelham, Alabama 35124 Phone: (205) 987-2233
Best Western Inn, 100 Bishop Cir, Pelham, Alabama 35124 Phone: (205) 982-1113, Fax: (205) 982-0452
Sleep Inn, 200 Southgate Dr, Pelham, Alabama 35124 Phone: (205) 982-9800, Fax: (205) 982-0525
Hampton Inn And Suites, 232 Cahaba Valley Rd, Pelham, Alabama 35124 Phone: (205) 313-9500, Fax: (205) 313-9600
Ramada Limited, 113 Cahaba Vly Park E, Pelham, Alabama 35124 Phone: (205) 987-0444, Fax: (205) 987-4816
Comfort Suites Pelham, 2235 Pelham Pkwy, Pelham, Alabama 35124 Phone: (205) 982-1999, Fax: (205) 989-6930
Fairfield Inn And Suites By Marriott, 230 Cahaba Valley Rd, Pelham, Alabama 35124 Phone: (205) 987-9879, Fax: (205) 987-9709
2 other hotels and motels
All 10 fire-safe hotels and motels in Pelham, Alabama Pelham compared to Alabama state average:
Median household income above state average. Median house value above state average. Unemployed percentage significantly below state average. Hispanic race population percentage significantly above state average. Median age below state average. Foreign-born population percentage significantly above state average. Renting percentage below state average. Length of stay since moving in above state average. House age significantly below state average. Percentage of population with a bachelor's degree or higher significantly above state average.
#45 on the list of "Top 101 cities with the most full-time firefighters per 1000 residents (population 5,000+)"
#45 on the list of "Top 101 cities with the most full-time park and recreation workers per 1000 residents (population 5,000+)"
#19 on the list of "Top 101 counties with highest percentage of residents voting for Romney (Republican) in the 2012 Presidential Election (pop. 50,000+)"
#34 on the list of "Top 101 counties with the largest decrease in the number of births per 1000 residents 2000-2006 to 2007-2013 (pop 50,000+)"
#80 on the list of "Top 101 counties with the lowest surface withdrawal of fresh water for public supply (pop. 50,000+)"
Top Patent Applicants
Larry G. Felix (11)
Keith E. Branham (9)
Larry Gordon Felix (6)
Wayne J. Brouillette (6)
Rene Glover (6)
Charles D. Amsler (6)
Gary Tennyson (5)
Keith Edward Branham (4)
Keith Branham (4)
James W. Dow (3)
Total of 97 patent applications in 2008-2024.
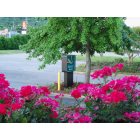
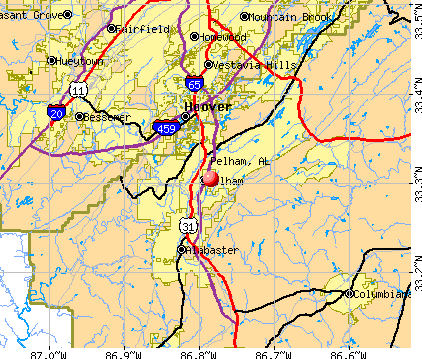


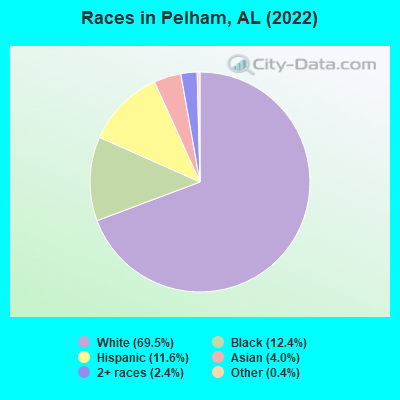
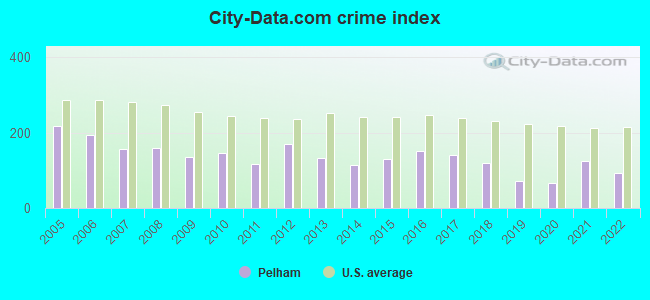
 Recent articles from our blog. Our writers, many of them Ph.D. graduates or candidates, create easy-to-read articles on a wide variety of topics.

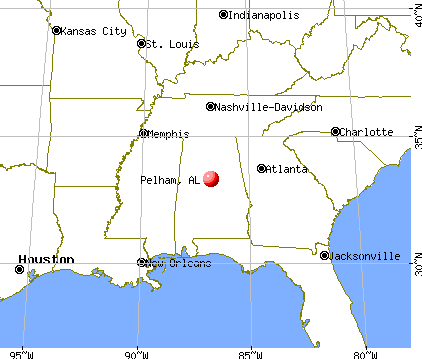
 (5.8 miles
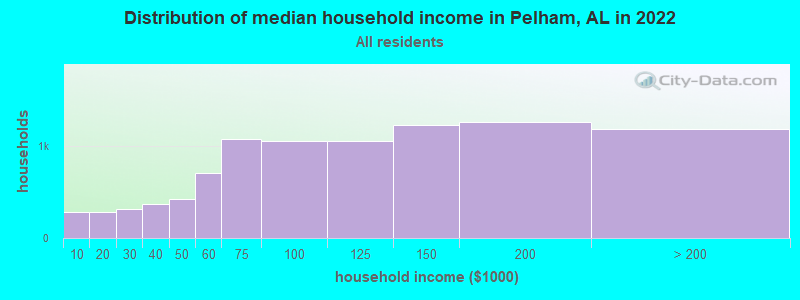
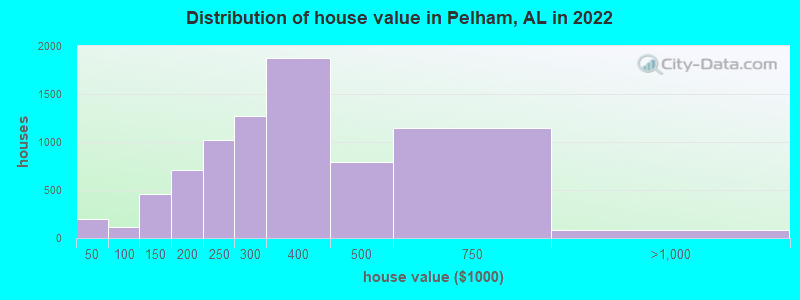
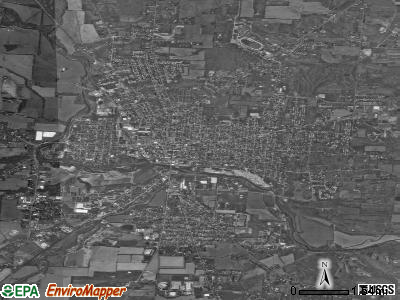
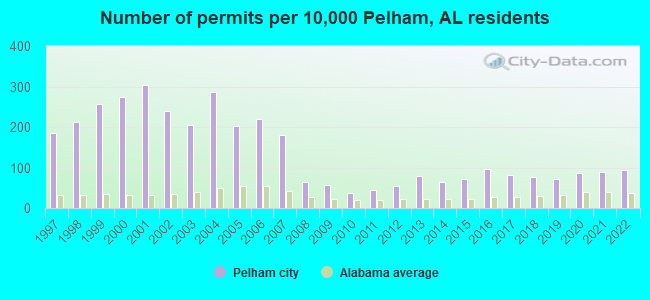
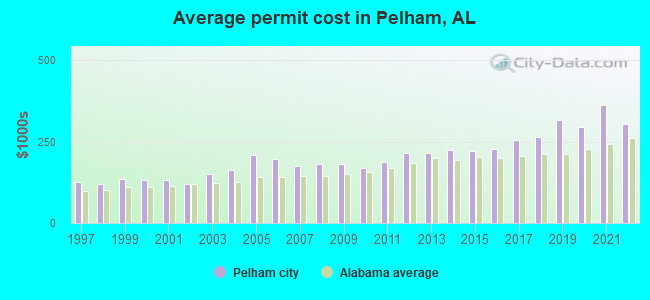
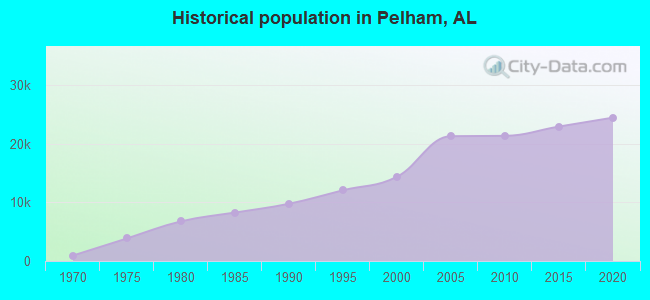
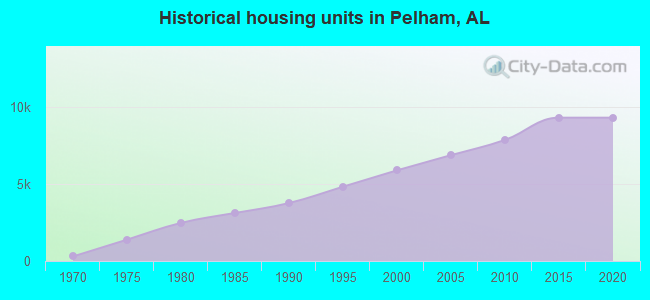
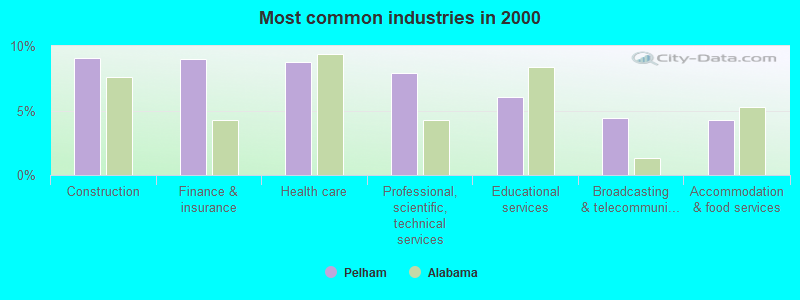
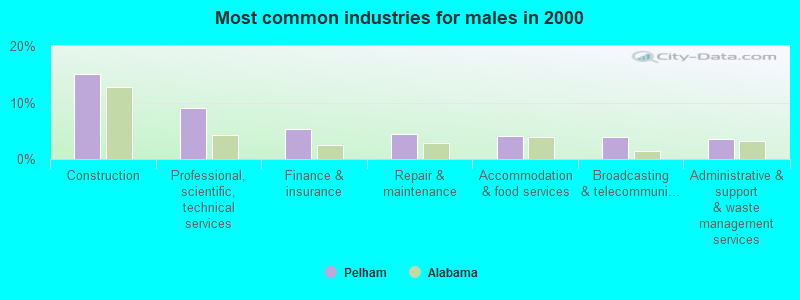
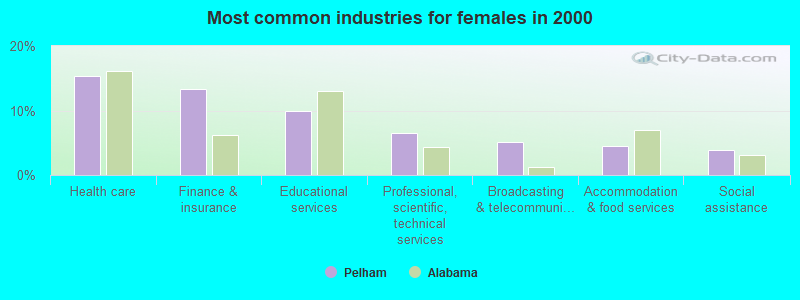
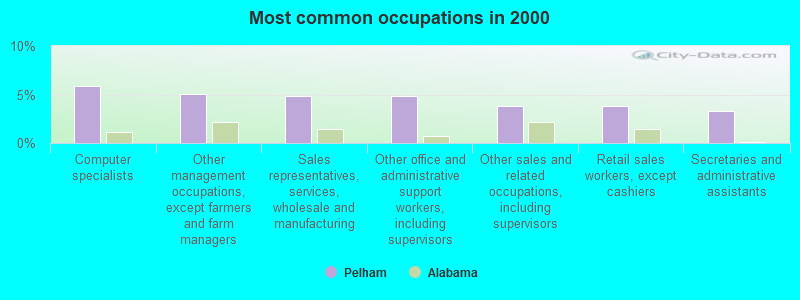
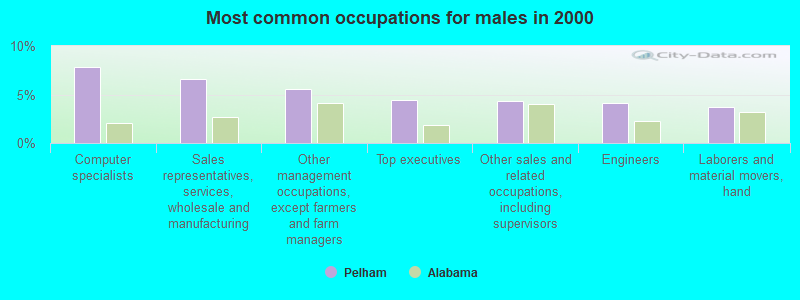
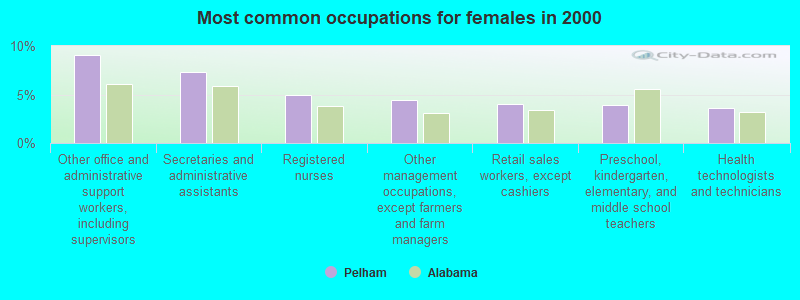
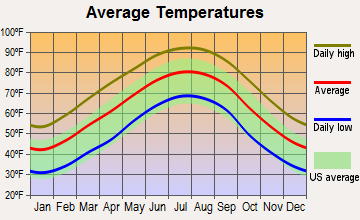
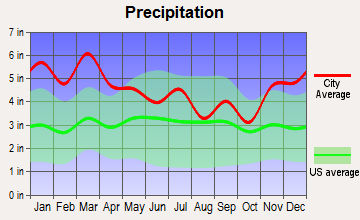
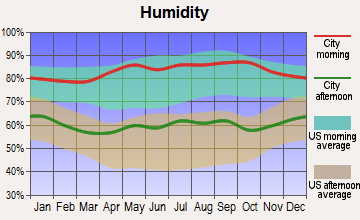
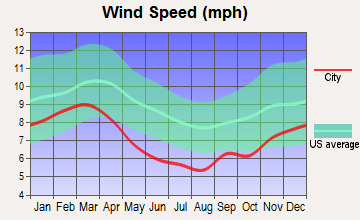
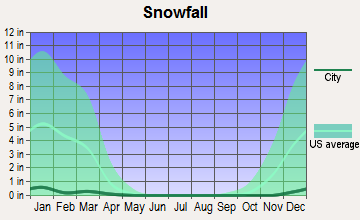
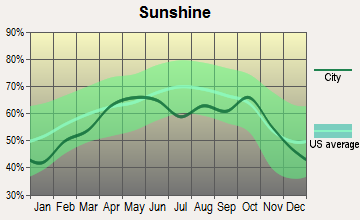
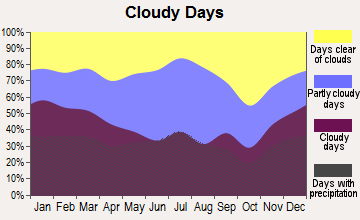
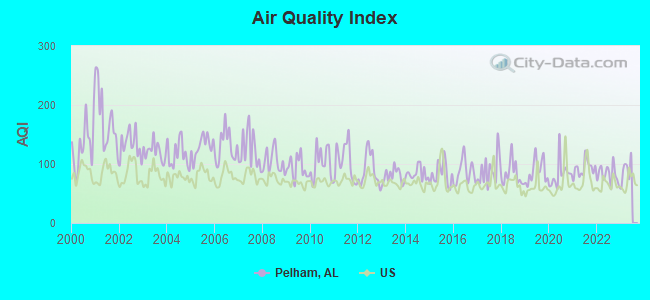
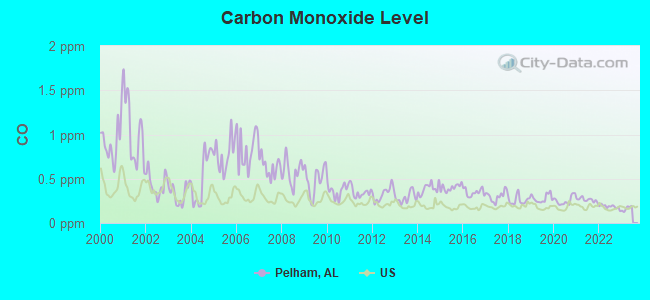
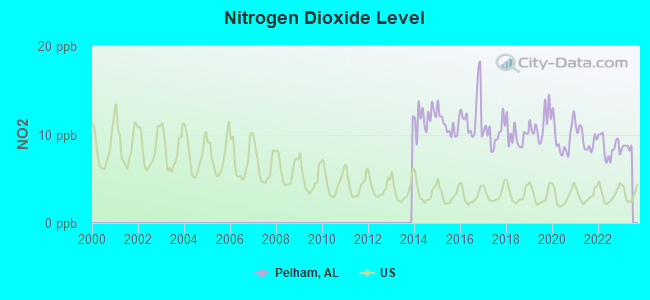
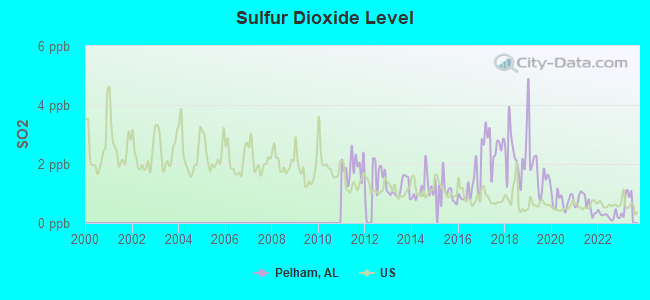
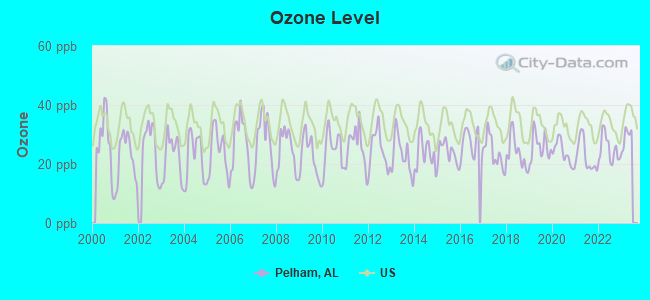
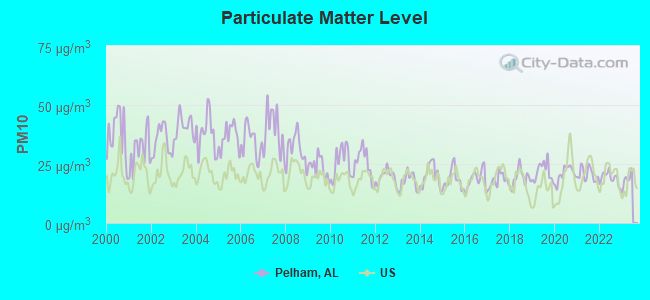
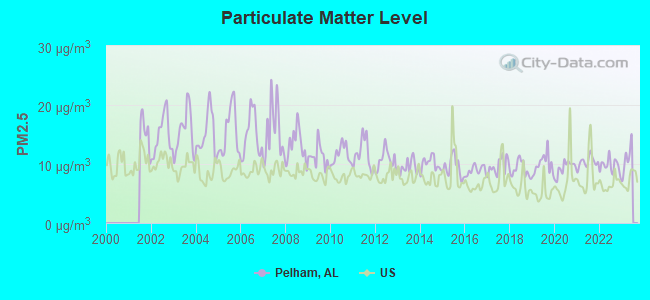
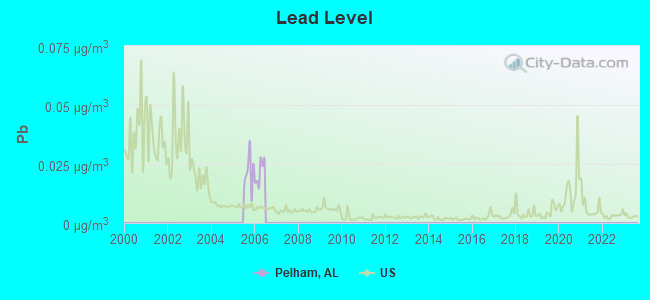
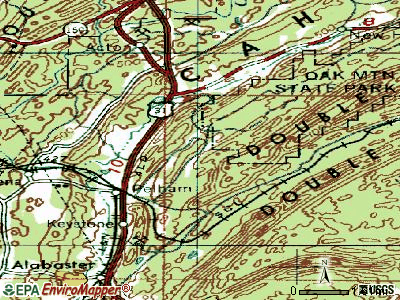
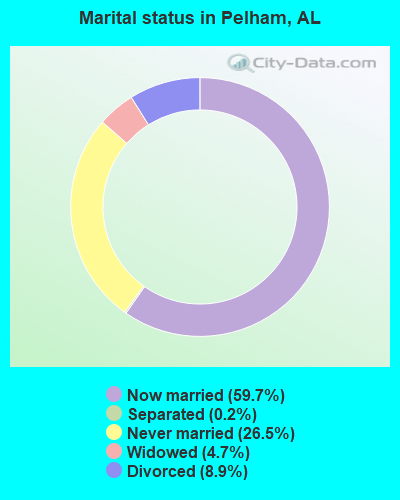
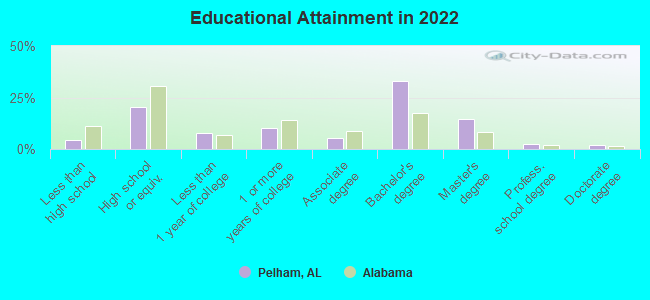
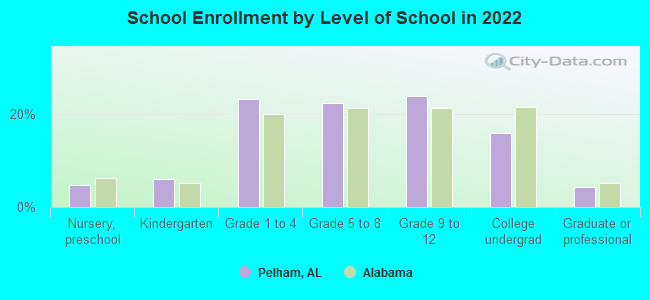

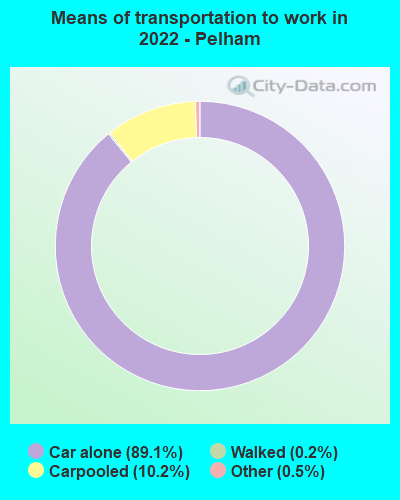
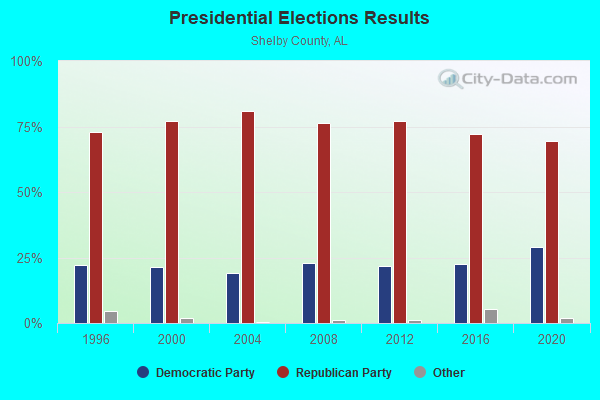
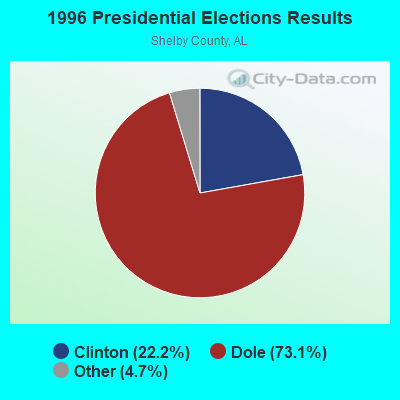
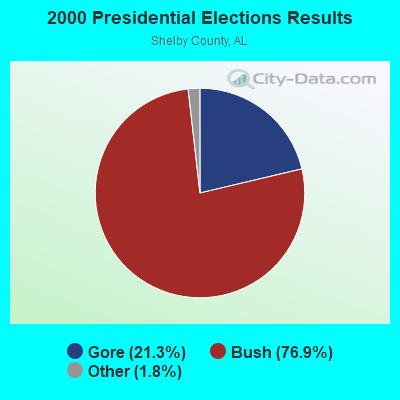
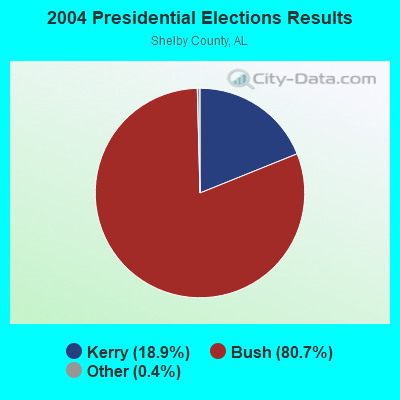
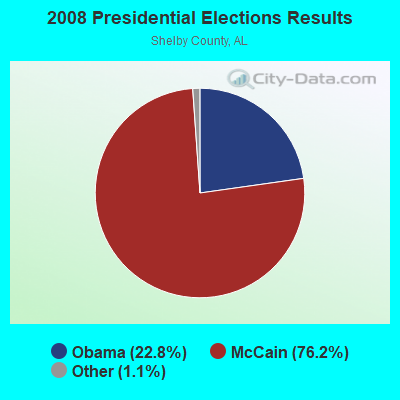
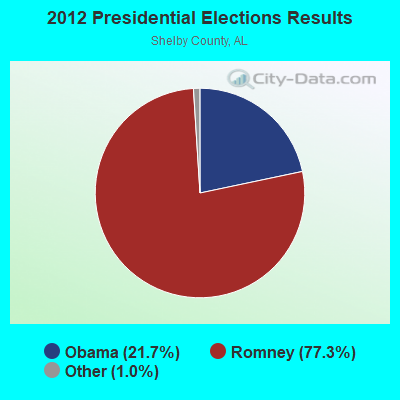
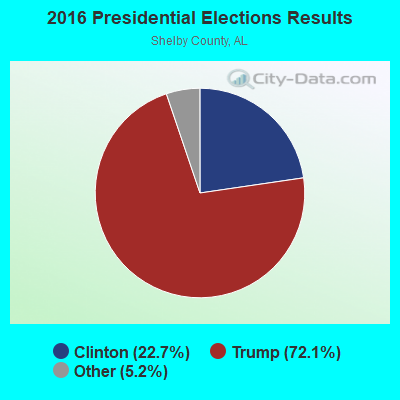
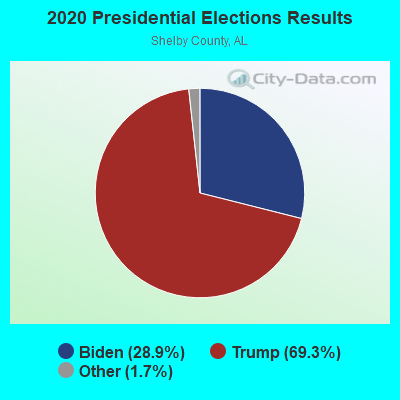
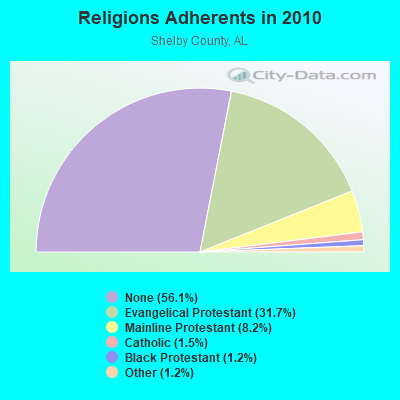
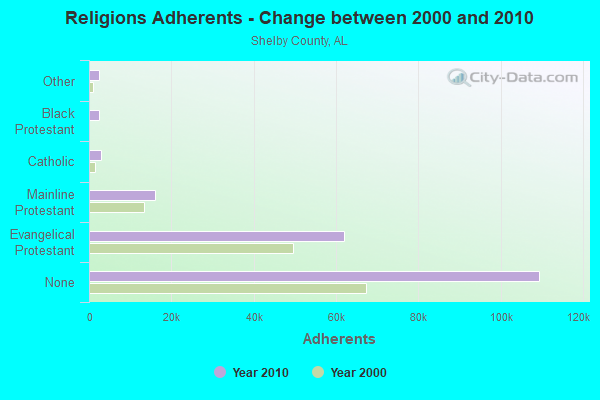
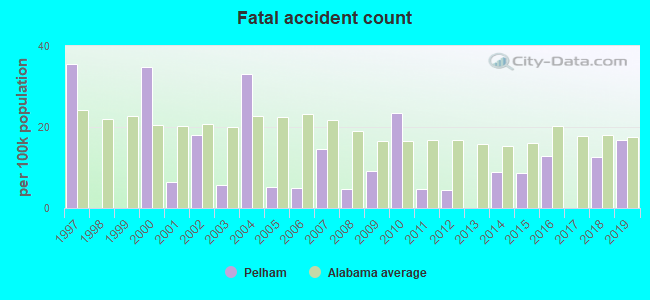
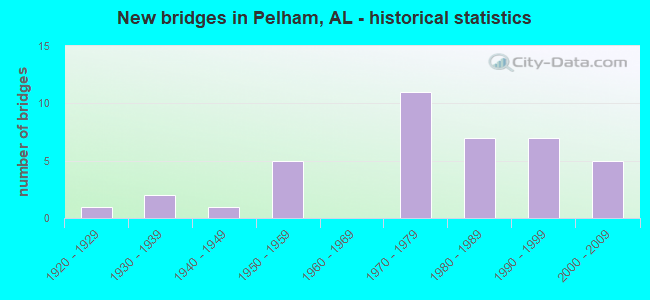
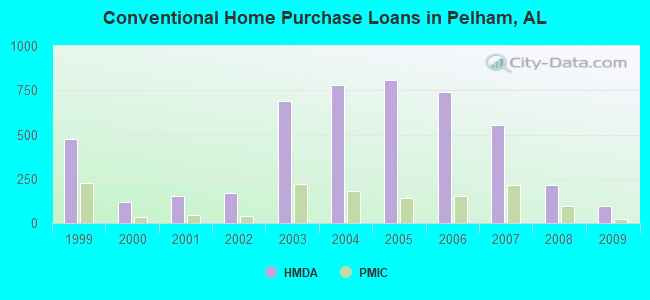

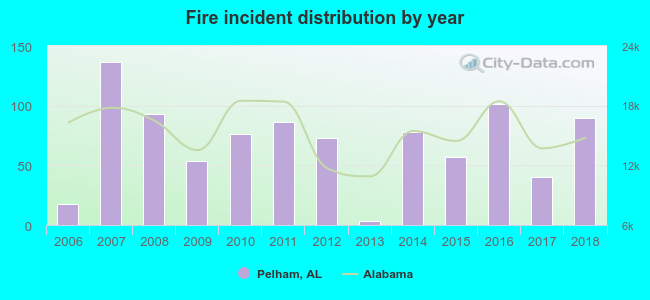 According to the data from the years 2006 - 2018 the average number of fire incidents per year is 70. The highest number of fires - 137 took place in 2007, and the least - 3 in 2013. The data has an increasing trend.
 When looking into fire subcategories, the most reports belonged to: Outside Fires (52.5%), and Structure Fires (23.5%).