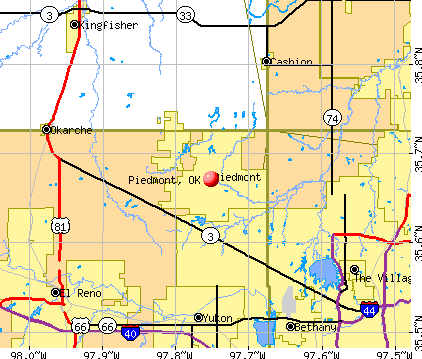
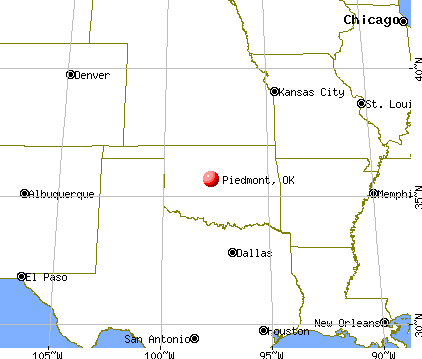
Piedmont, Oklahoma
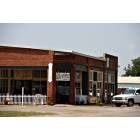
Piedmont: Piedmont Downtown

Piedmont: Sunset in Piedmont
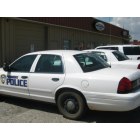
Piedmont: Piedmont Police Station, Piedmont, Oklahoma
Piedmont: Piedmont Police Station, Piedmont, Oklahoma

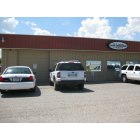
Piedmont: Off Sara Rd just north of 178th street, Piedmont, Oklahoma
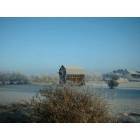
Piedmont: Cold Frosty Snowy PIedmont OK morning.
- add
your
Submit your own pictures of this city and show them to the world
- OSM Map
- General Map
- Google Map
- MSN Map
Population change since 2000: +131.4%
| Males: 4,357 | |
| Females: 4,088 |
| Median resident age: | 40.8 years |
| Oklahoma median age: | 37.1 years |
Zip codes: 73078.
| Piedmont: | $84,921 |
| OK: | $59,673 |
Estimated per capita income in 2022: $41,419 (it was $21,265 in 2000)
Piedmont city income, earnings, and wages data
Estimated median house or condo value in 2022: $291,940 (it was $102,200 in 2000)
| Piedmont: | $291,940 |
| OK: | $191,700 |
Mean prices in 2022: all housing units: $355,085; detached houses: $349,740
Median gross rent in 2022: $1,131.
(1.4% for White Non-Hispanic residents, 1.1% for two or more races residents)
Detailed information about poverty and poor residents in Piedmont, OK
Compare current foreclosures near Piedmont, OK:
| Photo | Address | Area | Beds / Baths | Price | Details |
|---|---|---|---|---|---|

|
#1
Jefferson Ave NE
Piedmont, OK 73078
|
1,440 sq. feet
|
1 baths 3 beds |
show details | |

|
#2
Frisco Rd
Piedmont, OK 73078
|
4,588 sq. feet
|
2 baths 3 beds |
show details | |

|
#3
Wagon Train Cir
Piedmont, OK 73078
|
1,752 sq. feet
|
2 baths 3 beds |
show details | |

|
#4
Washington Ave E
Piedmont, OK 73078
|
1,698 sq. feet
|
2 baths 3 beds |
show details | |

|
#5
Monroe Ave NW
Piedmont, OK 73078
|
1,696 sq. feet
|
2 baths 2 beds |
show details | |

|
#6
Terry Ln NE
Piedmont, OK 73078
|
1,535 sq. feet
|
2 baths 3 beds |
show details | |

|
#7
Every Ave NW
Piedmont, OK 73078
|
1,493 sq. feet
|
1 baths 3 beds |
show details | |

|
#8
NW 130th St
Piedmont, OK 73078
|
- sq. feet
|
- baths - beds |
show details | |

|
#9
Peony Cir
Piedmont, OK 73078
|
- sq. feet
|
- baths - beds |
show details | |

|
#10
NW 135th St
Piedmont, OK 73078
|
- sq. feet
|
- baths - beds |
show details |
| Photo | Address | Area | Beds / Baths | Price | Details |
|---|---|---|---|---|---|

|
#11
Silver Crossings Cir
Piedmont, OK 73078
|
- sq. feet
|
- baths - beds |
show details | |

|
#12
Frisco Rd NW
Piedmont, OK 73078
|
- sq. feet
|
- baths - beds |
show details | |

|
#13
NW 130th St
Piedmont, OK 73078
|
- sq. feet
|
- baths - beds |
show details | |

|
#14
Eastridge Cir NE
Piedmont, OK 73078
|
- sq. feet
|
- baths - beds |
show details | |

|
#15
Northwood Village Dr
Piedmont, OK 73078
|
- sq. feet
|
- baths - beds |
show details | |

|
#16
Raymond Ln
Piedmont, OK 73078
|
- sq. feet
|
- baths - beds |
show details | |

|
#17
Northwood Vlg Dr
Piedmont, OK 73078
|
- sq. feet
|
- baths - beds |
show details | |

|
#18
Center Village Way
Piedmont, OK 73078
|
- sq. feet
|
- baths - beds |
show details | |

|
#19
NW 132nd Ter
Piedmont, OK 73078
|
- sq. feet
|
- baths - beds |
show details | |

|
#20
Hudson Ln NE
Piedmont, OK 73078
|
- sq. feet
|
- baths - beds |
show details |
| Photo | Address | Area | Beds / Baths | Price | Details |
|---|---|---|---|---|---|

|
#21
Front Porch Dr
Piedmont, OK 73078
|
- sq. feet
|
- baths - beds |
show details | |

|
#22
Sandy Cir
Yukon, OK 73099
|
1,784 sq. feet
|
2 baths 4 beds |
show details | |

|
#23
NW 114th St
Oklahoma City, OK 73162
|
2,561 sq. feet
|
2 baths 4 beds |
show details | |

|
#24
Lucinda Ln
Kingfisher, OK 73750
|
1,506 sq. feet
|
2 baths 3 beds |
show details | |

|
#25
Bradford Farms Ln
Edmond, OK 73025
|
2,745 sq. feet
|
2 baths 4 beds |
show details | |

|
#26
St
Oklahoma City, OK 73159
|
- sq. feet
|
2 baths 3 beds |
show details | |

|
#27
W Gemini Rd
Edmond, OK 73003
|
1,475 sq. feet
|
1 baths 3 beds |
show details | |

|
#28
S Jensen Ave
El Reno, OK 73036
|
1,693 sq. feet
|
2 baths 3 beds |
show details | |

|
#29
Oak Creek Dr
Yukon, OK 73099
|
1,232 sq. feet
|
2 baths 3 beds |
show details | |

|
#30
Ryder Dr
Yukon, OK 73099
|
1,837 sq. feet
|
2 baths 4 beds |
show details |
| Photo | Address | Area | Beds / Baths | Price | Details |
|---|---|---|---|---|---|

|
#31
NW 37th St
Yukon, OK 73099
|
1,842 sq. feet
|
2 baths 3 beds |
show details | |

|
#32
Fedderson Dr
El Reno, OK 73036
|
1,162 sq. feet
|
2 baths 3 beds |
show details | |

|
#33
N Sterling Ave
Oklahoma City, OK 73122
|
764 sq. feet
|
1 baths 2 beds |
show details | |

|
#34
Smith Blvd
Oklahoma City, OK 73112
|
1,991 sq. feet
|
2 baths 3 beds |
show details | |

|
#35
NW 34th St
Bethany, OK 73008
|
858 sq. feet
|
1 baths 3 beds |
show details | |

|
#36
NW 145th Ct
Edmond, OK 73013
|
3,093 sq. feet
|
2 baths 4 beds |
show details | |

|
#37
Big Horn
Edmond, OK 73012
|
1,685 sq. feet
|
2 baths 3 beds |
show details | |

|
#38
N University Ave
Oklahoma City, OK 73114
|
1,748 sq. feet
|
2 baths 4 beds |
show details | |

|
#39
NW 66th St
Oklahoma City, OK 73116
|
1,036 sq. feet
|
1 baths 3 beds |
show details | |

|
#40
N Libby Ave
Oklahoma City, OK 73122
|
1,290 sq. feet
|
1 baths 3 beds |
show details |
| Photo | Address | Area | Beds / Baths | Price | Details |
|---|---|---|---|---|---|

|
#41
NW 140th St
Edmond, OK 73013
|
1,510 sq. feet
|
1 baths 3 beds |
show details | |

|
#42
Ellsworth Ave
Yukon, OK 73099
|
1,857 sq. feet
|
2 baths 4 beds |
show details | |

|
#43
NW 160th Ter
Edmond, OK 73013
|
1,985 sq. feet
|
2 baths 3 beds |
show details | |

|
#44
N Wall St
Oklahoma City, OK 73122
|
786 sq. feet
|
1 baths 2 beds |
show details | |

|
#45
N Redmond Ave
Bethany, OK 73008
|
1,224 sq. feet
|
2 baths 3 beds |
show details | |

|
#46
Woodbridge Cir
Edmond, OK 73012
|
1,456 sq. feet
|
1 baths 2 beds |
show details | |

|
#47
Hunters Glen Cir
Edmond, OK 73012
|
1,895 sq. feet
|
1 baths 4 beds |
show details | |

|
#48
Dublin Rd
Oklahoma City, OK 73120
|
1,168 sq. feet
|
1 baths 3 beds |
show details | |

|
#49
Traditions Blvd
Edmond, OK 73013
|
1,986 sq. feet
|
2 baths 3 beds |
show details | |

|
Check over 1 million property listings on Foreclosure.com!
|
browse all offers | |||


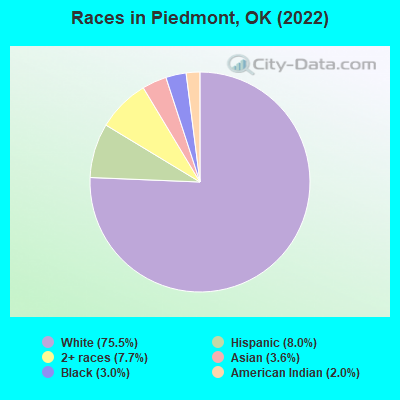
- 6,21975.5%White alone
- 6568.0%Hispanic
- 6347.7%Two or more races
- 2963.6%Asian alone
- 2503.0%Black alone
- 1632.0%American Indian alone
Races in Piedmont detailed stats: ancestries, foreign born residents, place of birth
According to our research of Oklahoma and other state lists, there were 7 registered sex offenders living in Piedmont, Oklahoma as of April 27, 2024.
The ratio of all residents to sex offenders in Piedmont is 1,020 to 1.
The ratio of registered sex offenders to all residents in this city is lower than the state average.
Type |
2009 |
2010 |
2011 |
2012 |
2013 |
2014 |
2015 |
2016 |
2017 |
2018 |
2019 |
2020 |
2021 |
2022 |
|---|---|---|---|---|---|---|---|---|---|---|---|---|---|---|
| Murders (per 100,000) | 0 (0.0) | 0 (0.0) | 0 (0.0) | 0 (0.0) | 0 (0.0) | 0 (0.0) | 0 (0.0) | 0 (0.0) | 0 (0.0) | 0 (0.0) | 0 (0.0) | 0 (0.0) | 0 (0.0) | 0 (0.0) |
| Rapes (per 100,000) | 1 (17.4) | 0 (0.0) | 0 (0.0) | 0 (0.0) | 0 (0.0) | 1 (15.0) | 0 (0.0) | 2 (27.0) | 0 (0.0) | 1 (12.4) | 0 (0.0) | 0 (0.0) | 4 (42.6) | 1 (12.0) |
| Robberies (per 100,000) | 0 (0.0) | 0 (0.0) | 0 (0.0) | 1 (16.8) | 0 (0.0) | 1 (15.0) | 1 (14.3) | 0 (0.0) | 0 (0.0) | 1 (12.4) | 0 (0.0) | 0 (0.0) | 0 (0.0) | 0 (0.0) |
| Assaults (per 100,000) | 1 (17.4) | 1 (17.5) | 0 (0.0) | 4 (67.1) | 6 (94.0) | 0 (0.0) | 1 (14.3) | 3 (40.4) | 7 (90.5) | 3 (37.1) | 8 (93.5) | 7 (78.4) | 3 (32.0) | 2 (24.0) |
| Burglaries (per 100,000) | 12 (208.5) | 24 (419.6) | 10 (173.0) | 21 (352.5) | 10 (156.6) | 7 (104.9) | 10 (142.9) | 7 (94.3) | 9 (116.3) | 4 (49.5) | 10 (116.9) | 13 (145.6) | 6 (63.9) | 10 (120.2) |
| Thefts (per 100,000) | 43 (747.0) | 22 (384.6) | 43 (743.8) | 36 (604.3) | 42 (657.9) | 35 (524.4) | 26 (371.6) | 23 (310.0) | 22 (284.3) | 13 (160.9) | 27 (315.7) | 30 (335.9) | 20 (213.1) | 31 (372.7) |
| Auto thefts (per 100,000) | 1 (17.4) | 2 (35.0) | 3 (51.9) | 8 (134.3) | 6 (94.0) | 3 (45.0) | 0 (0.0) | 5 (67.4) | 1 (12.9) | 2 (24.8) | 4 (46.8) | 2 (22.4) | 4 (42.6) | 1 (12.0) |
| Arson (per 100,000) | 0 (0.0) | 0 (0.0) | 0 (0.0) | 1 (16.8) | 1 (15.7) | 0 (0.0) | 1 (14.3) | 1 (13.5) | 0 (0.0) | 1 (12.4) | 0 (0.0) | 2 (22.4) | 1 (10.7) | 0 (0.0) |
| City-Data.com crime index | 63.2 | 51.0 | 46.0 | 78.1 | 63.6 | 48.4 | 32.0 | 54.0 | 38.6 | 32.9 | 43.3 | 41.1 | 56.9 | 38.7 |
The City-Data.com crime index weighs serious crimes and violent crimes more heavily. Higher means more crime, U.S. average is 246.1. It adjusts for the number of visitors and daily workers commuting into cities.
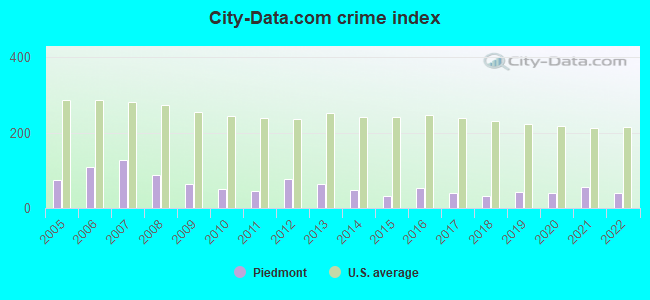
Crime rate in Piedmont detailed stats: murders, rapes, robberies, assaults, burglaries, thefts, arson
Full-time law enforcement employees in 2021, including police officers: 11 (9 officers - 7 male; 2 female).
| Officers per 1,000 residents here: | 0.96 |
| Oklahoma average: | 2.27 |
 Recent articles from our blog. Our writers, many of them Ph.D. graduates or candidates, create easy-to-read articles on a wide variety of topics.

 | Are Tulsa and OKC having an influx of Californians like Texas? (64 replies) |
| Any Big Houses in OKC (8 replies) |
| Fastest growing city in Ok by 2040 (10 replies) |
| Moving to OKC from Hawaii (28 replies) |
| Why are there no quality grocery stores in OKC? (302 replies) |
| Oklahoma Options for Country Living (8 replies) |
Latest news from Piedmont, OK collected exclusively by city-data.com from local newspapers, TV, and radio stations
Ancestries: American (13.4%), German (13.2%), English (8.5%), Irish (2.4%), Brazilian (2.4%), Scottish (1.5%).
Current Local Time: CST time zone
Elevation: 1190 feet
Land area: 43.8 square miles.
Population density: 193 people per square mile (very low).
385 residents are foreign born (3.5% Latin America, 1.6% Asia).
| This city: | 4.7% |
| Oklahoma: | 6.1% |
Median real estate property taxes paid for housing units with mortgages in 2022: $2,325 (0.8%)
Median real estate property taxes paid for housing units with no mortgage in 2022: $2,183 (0.7%)
Nearest city with pop. 50,000+: East Canadian, OK (12.9 miles  , pop. 61,645).
Nearest city with pop. 200,000+: Oklahoma City, OK (17.9 miles , pop. 506,132).
Nearest city with pop. 1,000,000+: Dallas, TX (206.1 miles , pop. 1,188,580).
Nearest cities:
), )Latitude: 35.67 N, Longitude: 97.75 W
Area code: 405
Piedmont, Oklahoma accommodation & food services, waste management - Economy and Business Data
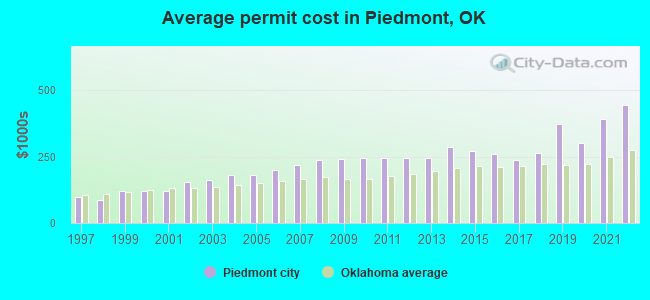
Single-family new house construction building permits:
- 2022: 42 buildings, average cost: $444,100
- 2021: 104 buildings, average cost: $389,600
- 2020: 74 buildings, average cost: $299,500
- 2019: 80 buildings, average cost: $371,900
- 2018: 90 buildings, average cost: $263,600
- 2017: 83 buildings, average cost: $236,200
- 2016: 74 buildings, average cost: $258,600
- 2015: 64 buildings, average cost: $272,200
- 2014: 86 buildings, average cost: $286,300
- 2013: 51 buildings, average cost: $244,100
- 2012: 41 buildings, average cost: $244,200
- 2011: 35 buildings, average cost: $244,000
- 2010: 32 buildings, average cost: $244,900
- 2009: 45 buildings, average cost: $241,600
- 2008: 58 buildings, average cost: $236,200
- 2007: 83 buildings, average cost: $220,400
- 2006: 108 buildings, average cost: $199,700
- 2005: 121 buildings, average cost: $181,200
- 2004: 110 buildings, average cost: $179,600
- 2003: 81 buildings, average cost: $163,100
- 2002: 63 buildings, average cost: $155,000
- 2001: 51 buildings, average cost: $118,900
- 2000: 51 buildings, average cost: $118,900
- 1999: 53 buildings, average cost: $122,000
- 1998: 61 buildings, average cost: $86,300
- 1997: 51 buildings, average cost: $98,300
| Here: | 2.7% |
| Oklahoma: | 3.2% |
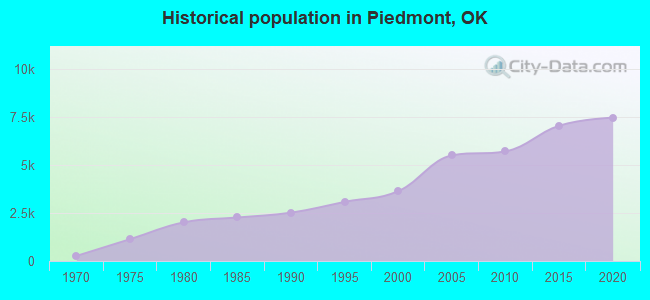
Population change in the 1990s: +1,076 (+41.8%).
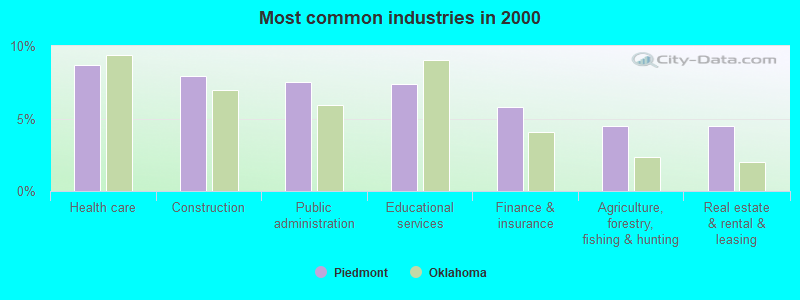
- Health care (8.7%)
- Construction (8.0%)
- Public administration (7.5%)
- Educational services (7.4%)
- Finance & insurance (5.8%)
- Agriculture, forestry, fishing & hunting (4.5%)
- Real estate & rental & leasing (4.5%)
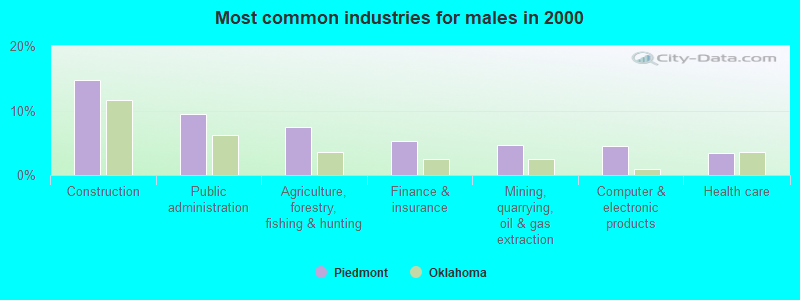
- Construction (14.7%)
- Public administration (9.4%)
- Agriculture, forestry, fishing & hunting (7.5%)
- Finance & insurance (5.3%)
- Mining, quarrying, oil & gas extraction (4.6%)
- Computer & electronic products (4.4%)
- Health care (3.4%)
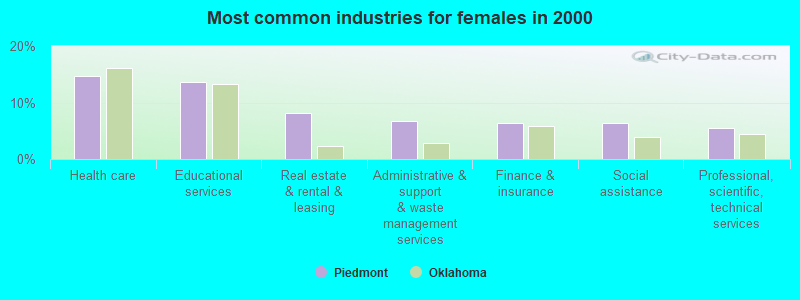
- Health care (14.7%)
- Educational services (13.7%)
- Real estate & rental & leasing (8.1%)
- Administrative & support & waste management services (6.7%)
- Finance & insurance (6.4%)
- Social assistance (6.3%)
- Professional, scientific, technical services (5.5%)
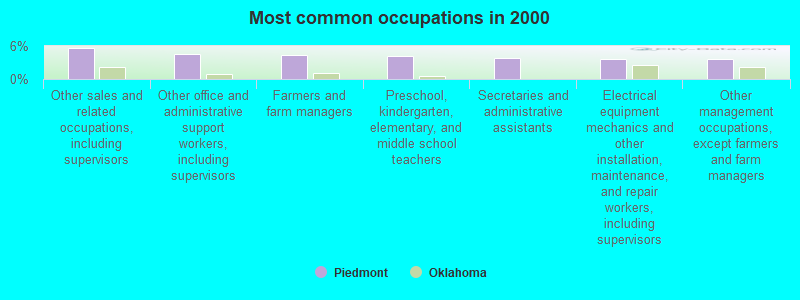
- Other sales and related occupations, including supervisors (5.7%)
- Other office and administrative support workers, including supervisors (4.5%)
- Farmers and farm managers (4.3%)
- Preschool, kindergarten, elementary, and middle school teachers (4.2%)
- Secretaries and administrative assistants (3.8%)
- Electrical equipment mechanics and other installation, maintenance, and repair workers, including supervisors (3.7%)
- Other management occupations, except farmers and farm managers (3.6%)
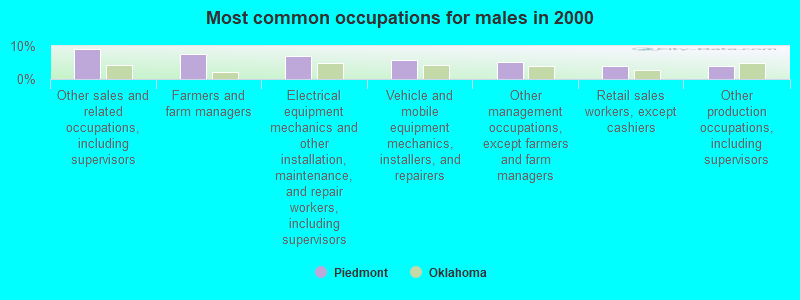
- Other sales and related occupations, including supervisors (9.1%)
- Farmers and farm managers (7.5%)
- Electrical equipment mechanics and other installation, maintenance, and repair workers, including supervisors (7.0%)
- Vehicle and mobile equipment mechanics, installers, and repairers (5.9%)
- Other management occupations, except farmers and farm managers (5.2%)
- Retail sales workers, except cashiers (3.9%)
- Other production occupations, including supervisors (3.9%)

- Other office and administrative support workers, including supervisors (8.6%)
- Preschool, kindergarten, elementary, and middle school teachers (8.4%)
- Secretaries and administrative assistants (8.1%)
- Health technologists and technicians (5.5%)
- Waiters and waitresses (4.8%)
- Child care workers (4.0%)
- Registered nurses (4.0%)
Average climate in Piedmont, Oklahoma
Based on data reported by over 4,000 weather stations


(lower is better)
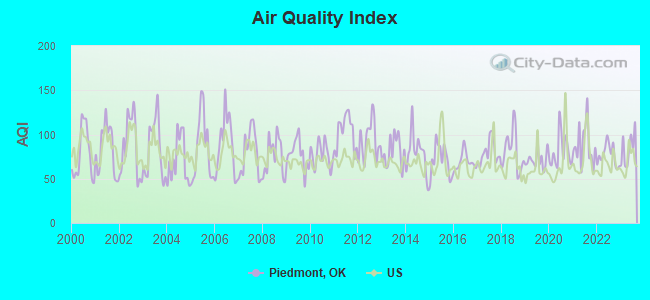
Air Quality Index (AQI) level in 2023 was 83.9. This is about average.
| City: | 83.9 |
| U.S.: | 72.6 |
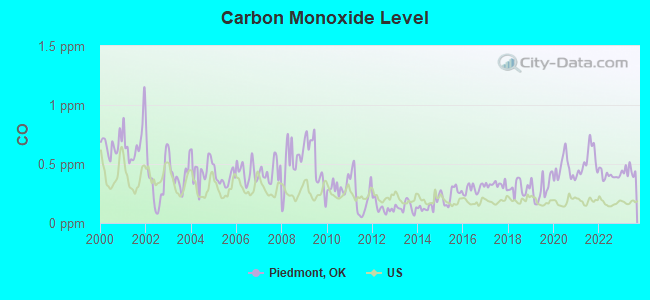
Carbon Monoxide (CO) [ppm] level in 2023 was 0.441. This is significantly worse than average. Closest monitor was 15.2 miles away from the city center.
| City: | 0.441 |
| U.S.: | 0.251 |
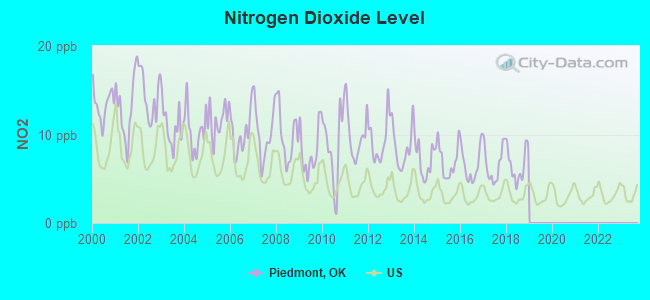
Nitrogen Dioxide (NO2) [ppb] level in 2018 was 6.55. This is worse than average. Closest monitor was 15.2 miles away from the city center.
| City: | 6.55 |
| U.S.: | 5.11 |
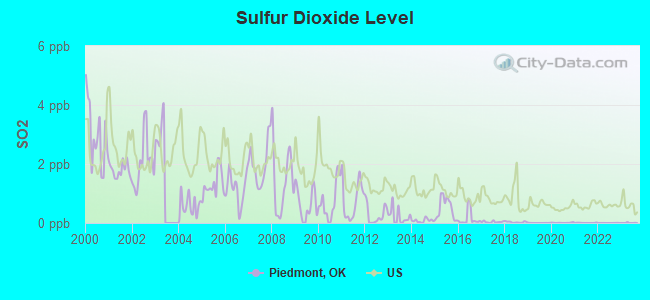
Sulfur Dioxide (SO2) [ppb] level in 2023 was 0.00505. This is significantly better than average. Closest monitor was 10.9 miles away from the city center.
| City: | 0.00505 |
| U.S.: | 1.51465 |
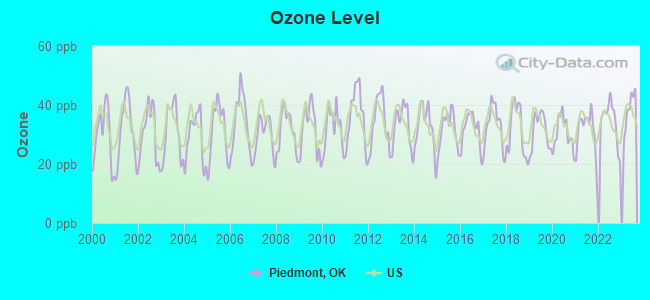
Ozone [ppb] level in 2023 was 38.1. This is about average. Closest monitor was 13.3 miles away from the city center.
| City: | 38.1 |
| U.S.: | 33.3 |
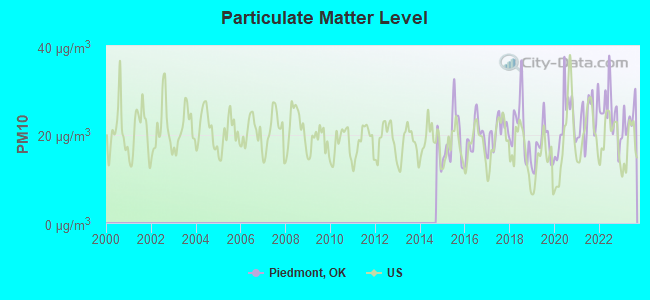
Particulate Matter (PM10) [µg/m3] level in 2023 was 23.7. This is worse than average. Closest monitor was 15.2 miles away from the city center.
| City: | 23.7 |
| U.S.: | 19.2 |
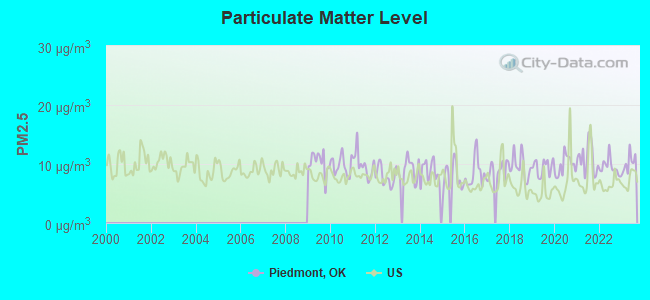
Particulate Matter (PM2.5) [µg/m3] level in 2023 was 10.2. This is worse than average. Closest monitor was 14.1 miles away from the city center.
| City: | 10.2 |
| U.S.: | 8.1 |
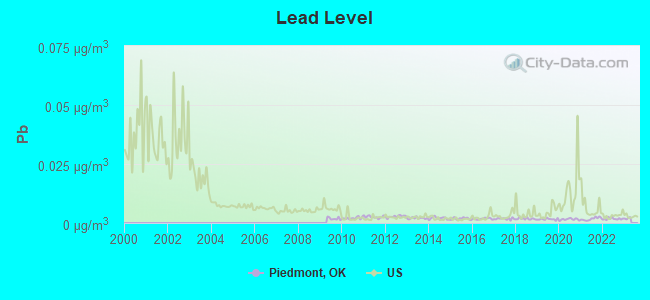
Lead (Pb) [µg/m3] level in 2022 was 0.00179. This is significantly better than average. Closest monitor was 12.2 miles away from the city center.
| City: | 0.00179 |
| U.S.: | 0.00931 |
Tornado activity:
Piedmont-area historical tornado activity is slightly above Oklahoma state average. It is 238% greater than the overall U.S. average.
On 5/3/1999, a category F5 (max. wind speeds 261-318 mph) tornado 23.7 miles away from the Piedmont city center killed 36 people and injured 583 people and caused $1000 million in damages.
On 4/30/1978, a category F4 (max. wind speeds 207-260 mph) tornado 6.3 miles away from the city center caused between $500,000 and $5,000,000 in damages.
Earthquake activity:
Piedmont-area historical earthquake activity is significantly above Oklahoma state average. It is 883% greater than the overall U.S. average.On 9/3/2016 at 12:02:44, a magnitude 5.8 (5.8 MW, Depth: 3.5 mi, Class: Moderate, Intensity: VI - VII) earthquake occurred 69.6 miles away from Piedmont center
On 11/6/2011 at 03:53:10, a magnitude 5.7 (5.7 MW, Depth: 3.2 mi) earthquake occurred 56.3 miles away from the city center
On 2/13/2016 at 17:07:06, a magnitude 5.1 (5.1 MW, Depth: 5.2 mi) earthquake occurred 77.9 miles away from the city center
On 11/7/2016 at 01:44:24, a magnitude 5.0 (5.0 MW, Depth: 2.8 mi) earthquake occurred 57.6 miles away from Piedmont center
On 11/8/2011 at 02:46:57, a magnitude 4.8 (4.8 MW, Depth: 3.1 mi, Class: Light, Intensity: IV - V) earthquake occurred 55.1 miles away from the city center
On 11/5/2011 at 07:12:45, a magnitude 4.8 (4.8 MW, Depth: 1.9 mi) earthquake occurred 56.2 miles away from Piedmont center
Magnitude types: moment magnitude (MW)
Natural disasters:
The number of natural disasters in Canadian County (36) is a lot greater than the US average (15).Major Disasters (Presidential) Declared: 28
Emergencies Declared: 5
Causes of natural disasters: Floods: 18, Storms: 17, Tornadoes: 13, Winter Storms: 12, Winds: 3, Fires: 2, Ice Storms: 2, Hurricane: 1, Other: 1 (Note: some incidents may be assigned to more than one category).
Hospitals and medical centers near Piedmont:
- HOME CARE OPTIONS, INC (Home Health Center, about 4 miles away; OKLAHOMA CITY, OK)
- QUAIL CREEK NURSING AND REHABILITATION CENTER (Nursing Home, about 9 miles away; OKLAHOMA CITY, OK)
- ENTRUSTED HEARTS (Home Health Center, about 9 miles away; OKLAHOMA CITY, OK)
- BAPTIST VILLAGE OF OKLAHOMA CITY (Nursing Home, about 9 miles away; OKLAHOMA CITY, OK)
- UNITY HOME CARE, L L C (Home Health Center, about 10 miles away; OKLAHOMA CITY, OK)
- ELITE HOME CARE, L L C (Home Health Center, about 10 miles away; OKLAHOMA CITY, OK)
- THE HEALTH CENTER AT CONCORDIA (Nursing Home, about 10 miles away; OKLAHOMA CITY, OK)
Airports located in Piedmont:
- Caribou Airport (2OK9) (Runways: 1)
Colleges/universities with over 2000 students nearest to Piedmont:
- Southern Nazarene University (about 13 miles; Bethany, OK; Full-time enrollment: 2,064)
- University of Central Oklahoma (about 16 miles; Edmond, OK; FT enrollment: 13,790)
- Oklahoma Christian University (about 17 miles; Edmond, OK; FT enrollment: 2,173)
- Oklahoma State University-Oklahoma City (about 17 miles; Oklahoma City, OK; FT enrollment: 4,784)
- Oklahoma City University (about 17 miles; Oklahoma City, OK; FT enrollment: 2,547)
- University of Oklahoma-Health Sciences Center (about 20 miles; Oklahoma City, OK; FT enrollment: 2,507)
- Oklahoma City Community College (about 23 miles; Oklahoma City, OK; FT enrollment: 8,904)
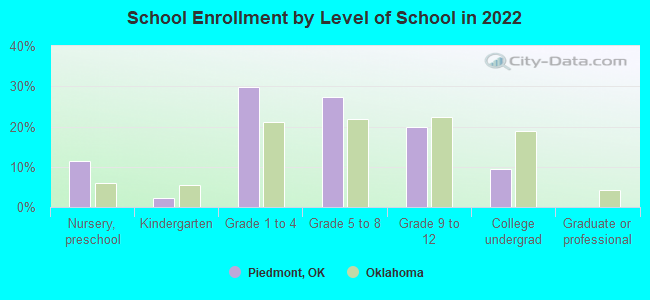
Public high school in Piedmont:
- PIEDMONT HS (Students: 608, Location: 1055 EDMOND ROAD NORTHWEST, Grades: 9-12)
Public elementary/middle schools in Piedmont:
- PIEDMONT ES (Students: 535, Location: 1011 PIEDMONT ROAD NORTH, Grades: KG-4)
- PIEDMONT MS (Students: 484, Location: 823 SECOND STREET NORTHWEST, Grades: 7-8)
- NORTHWOOD ES (Location: 14100 NORTHWOOD DRIVE, Grades: KG-4)
- PIEDMONT INTERMEDIATE ES (Location: 977 WASHINGTON AVENUE, Grades: 5-6)
User-submitted facts and corrections:
- The high school is now located at 1055 Edmond Rd. NW. And you need to update!!!
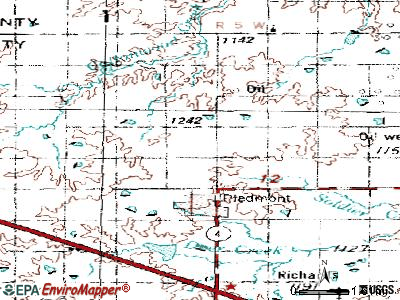
Points of interest:
Notable location: Piedmont Fire Department (A). Display/hide its location on the map
Cemeteries: Kansas Cemetery (1), Mathewson Cemetery (2). Display/hide their locations on the map
Reservoirs: Cottonwood Creek Site 17 Reservoir (A), Cypert 209 Reservoir (B), Oknoname 017003 Reservoir (C), Cypert-Holcomb-Eli 209 Reservoir (D), Oknoname 017200 Reservoir (E). Display/hide their locations on the map
| This city: | 2.9 people |
| Oklahoma: | 2.5 people |
| This city: | 85.2% |
| Whole state: | 66.8% |
| This city: | 3.0% |
| Whole state: | 5.9% |
Likely homosexual households (counted as self-reported same-sex unmarried-partner households)
- Lesbian couples: 0.3% of all households
- Gay men: 0.2% of all households
Banks with branches in Piedmont (2011 data):
- F & M Bank: Piedmont Branch at 1216 Piedmont Road, branch established on 1998/08/10. Info updated 2011/11/04: Bank assets: $231.6 mil, Deposits: $191.3 mil, headquarters in Edmond, OK, positive income, Commercial Lending Specialization, 8 total offices, Holding Company: F&M Bancshares, Inc.
- BancFirst: Bancfirst-Piedont Branch at 410 Piedmont Rd, branch established on 2011/09/12. Info updated 2012/02/24: Bank assets: $5,407.8 mil, Deposits: $4,893.4 mil, headquarters in Oklahoma City, OK, positive income, Commercial Lending Specialization, 101 total offices, Holding Company: Bancfirst Corporation
For population 15 years and over in Piedmont:
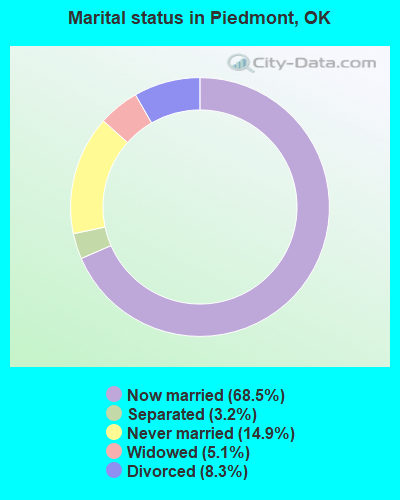
- Never married: 14.9%
- Now married: 68.5%
- Separated: 3.2%
- Widowed: 5.1%
- Divorced: 8.3%
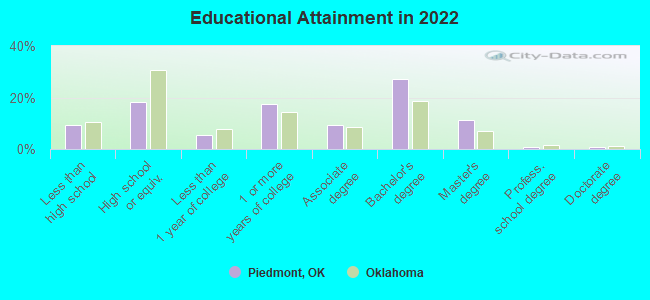
For population 25 years and over in Piedmont:
- High school or higher: 89.1%
- Bachelor's degree or higher: 39.2%
- Graduate or professional degree: 12.6%
- Unemployed: 2.1%
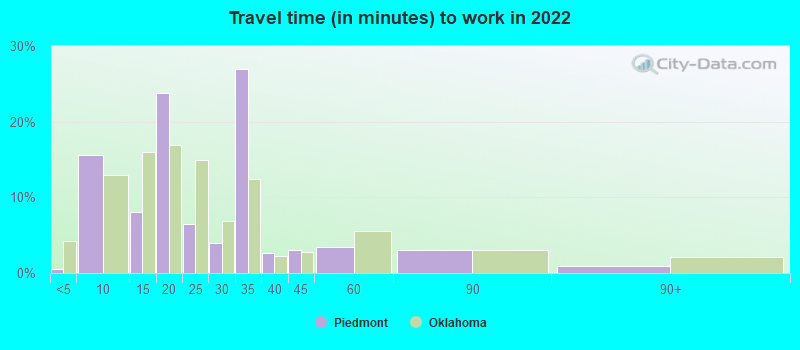
- Mean travel time to work (commute): 28.4 minutes
| Here: | 10.4 |
| Oklahoma average: | 11.3 |


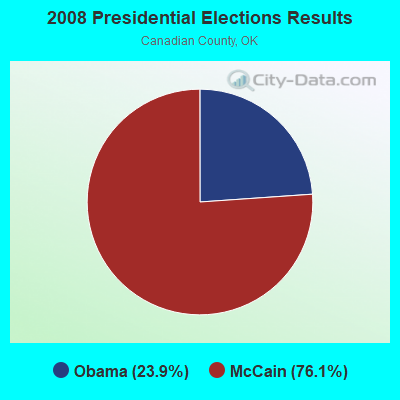
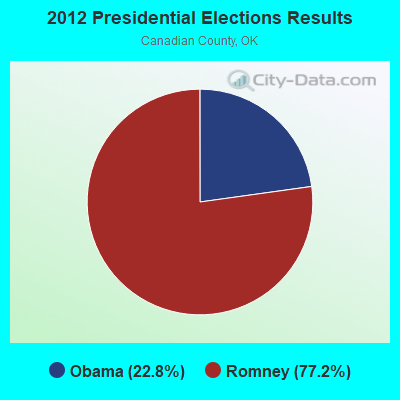
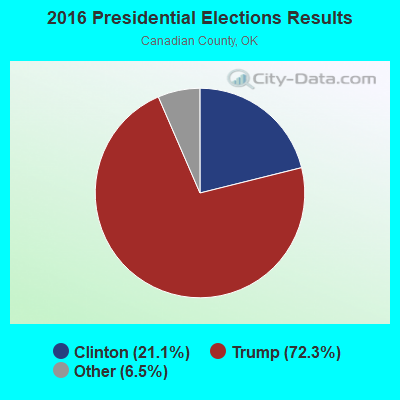
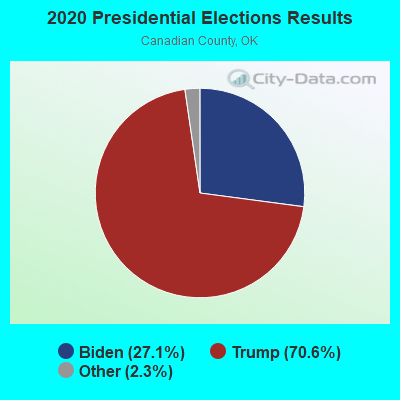
Graphs represent county-level data. Detailed 2008 Election Results
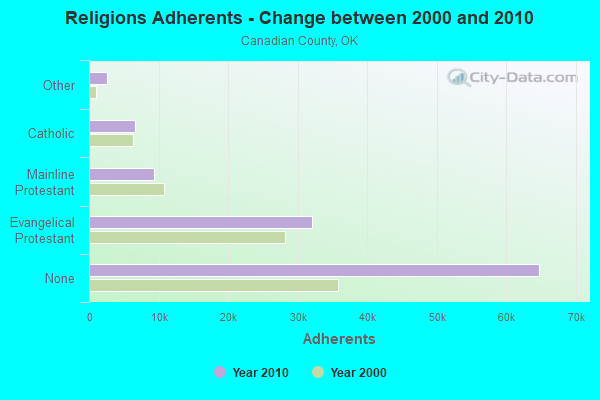
Religion statistics for Piedmont, OK (based on Canadian County data)
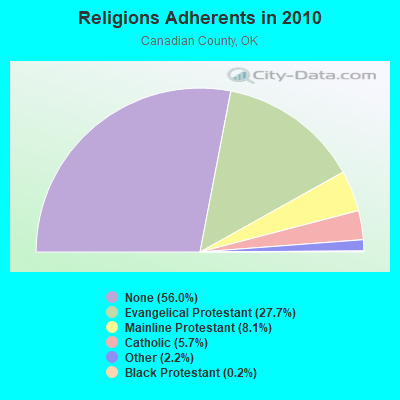
| Religion | Adherents | Congregations |
|---|---|---|
| Evangelical Protestant | 31,997 | 95 |
| Mainline Protestant | 9,358 | 22 |
| Catholic | 6,622 | 7 |
| Other | 2,561 | 8 |
| Black Protestant | 254 | 2 |
| None | 64,749 | - |
Food Environment Statistics:
| This county: | 1.45 / 10,000 pop. |
| State: | 1.97 / 10,000 pop. |
| This county: | 0.19 / 10,000 pop. |
| Oklahoma: | 0.20 / 10,000 pop. |
| Here: | 0.29 / 10,000 pop. |
| Oklahoma: | 0.76 / 10,000 pop. |
| Canadian County: | 3.29 / 10,000 pop. |
| State: | 4.35 / 10,000 pop. |
| Canadian County: | 5.32 / 10,000 pop. |
| Oklahoma: | 6.89 / 10,000 pop. |
| Here: | 9.8% |
| Oklahoma: | 10.3% |
| Canadian County: | 27.7% |
| Oklahoma: | 29.2% |
Health and Nutrition:
| Piedmont: | 47.3% |
| State: | 48.6% |
| Here: | 44.8% |
| Oklahoma: | 45.2% |
| Piedmont: | 29.1 |
| State: | 28.7 |
| Piedmont: | 24.7% |
| Oklahoma: | 21.4% |
| Here: | 8.5% |
| Oklahoma: | 10.8% |
| Piedmont: | 6.7 |
| Oklahoma: | 6.8 |
| Here: | 35.9% |
| Oklahoma: | 33.9% |
| Piedmont: | 55.9% |
| Oklahoma: | 55.2% |
| Here: | 79.0% |
| Oklahoma: | 78.4% |
More about Health and Nutrition of Piedmont, OK Residents
| Local government employment and payroll (March 2022) | |||||
| Function | Full-time employees | Monthly full-time payroll | Average yearly full-time wage | Part-time employees | Monthly part-time payroll |
|---|---|---|---|---|---|
| Other Government Administration | 9 | $11,677 | $15,569 | 0 | $0 |
| Police Protection - Officers | 9 | $37,751 | $50,335 | 2 | $1,278 |
| Firefighters | 7 | $28,247 | $48,423 | 0 | $0 |
| Streets and Highways | 3 | $12,859 | $51,436 | 0 | $0 |
| Financial Administration | 3 | $19,484 | $77,936 | 0 | $0 |
| Other and Unallocable | 2 | $10,224 | $61,344 | 0 | $0 |
| Police - Other | 2 | $6,673 | $40,038 | 0 | $0 |
| Water Supply | 2 | $10,790 | $64,740 | 0 | $0 |
| Sewerage | 2 | $7,229 | $43,374 | 0 | $0 |
| Local Libraries | 1 | $4,160 | $49,920 | 3 | $2,566 |
| Judicial and Legal | 1 | $4,160 | $49,920 | 1 | $1,174 |
| Totals for Government | 41 | $153,254 | $44,855 | 6 | $5,019 |
Piedmont government finances - Expenditure in 2017 (per resident):
- Construction - Regular Highways: $245,000 ($29.01)
Sewerage: $43,000 ($5.09)
- Current Operations - Police Protection: $1,021,000 ($120.90)
Water Utilities: $885,000 ($104.80)
Central Staff Services: $820,000 ($97.10)
Financial Administration: $398,000 ($47.13)
Local Fire Protection: $358,000 ($42.39)
Sewerage: $280,000 ($33.16)
General - Other: $268,000 ($31.73)
Regular Highways: $145,000 ($17.17)
Libraries: $111,000 ($13.14)
Judicial and Legal Services: $86,000 ($10.18)
Parks and Recreation: $22,000 ($2.61)
Health - Other: $6,000 ($0.71)
- General - Interest on Debt: $64,000 ($7.58)
- Other Capital Outlay - Police Protection: $29,000 ($3.43)
Sewerage: $20,000 ($2.37)
General - Other: $14,000 ($1.66)
Libraries: $5,000 ($0.59)
Water Utilities: $2,000 ($0.24)
- Total Salaries and Wages: $1,365,000 ($161.63)
- Water Utilities - Interest on Debt: $192,000 ($22.74)
Piedmont government finances - Revenue in 2017 (per resident):
- Charges - Solid Waste Management: $622,000 ($73.65)
Sewerage: $207,000 ($24.51)
Other: $1,000 ($0.12)
Parks and Recreation: $1,000 ($0.12)
- Federal Intergovernmental - Housing and Community Development: $1,145,000 ($135.58)
Other: $294,000 ($34.81)
- Miscellaneous - Fines and Forfeits: $316,000 ($37.42)
General Revenue - Other: $149,000 ($17.64)
Donations From Private Sources: $96,000 ($11.37)
Interest Earnings: $1,000 ($0.12)
- Revenue - Water Utilities: $1,211,000 ($143.40)
- State Intergovernmental - Other: $111,000 ($13.14)
Highways: $44,000 ($5.21)
General Local Government Support: $40,000 ($4.74)
- Tax - General Sales and Gross Receipts: $2,083,000 ($246.65)
Occupation and Business License - Other: $206,000 ($24.39)
Public Utilities Sales: $186,000 ($22.02)
Piedmont government finances - Debt in 2017 (per resident):
- Long Term Debt - Beginning Outstanding - Unspecified Public Purpose: $7,725,000 ($914.74)
Outstanding Unspecified Public Purpose: $7,127,000 ($843.93)
Retired Unspecified Public Purpose: $598,000 ($70.81)
Piedmont government finances - Cash and Securities in 2017 (per resident):
- Other Funds - Cash and Securities: $2,210,000 ($261.69)
12.61% of this county's 2021 resident taxpayers lived in other counties in 2020 ($56,364 average adjusted gross income)
| Here: | 12.61% |
| Oklahoma average: | 8.28% |
0.04% of residents moved from foreign countries ($167 average AGI)
Canadian County: 0.04% Oklahoma average: 0.04%
Top counties from which taxpayers relocated into this county between 2020 and 2021:
| from Oklahoma County, OK | |
| from Cleveland County, OK | |
| from Grady County, OK |
| Businesses in Piedmont, OK | ||||
| Name | Count | Name | Count | |
|---|---|---|---|---|
| Cricket Wireless | 1 | Subway | 1 | |
| FedEx | 1 | UPS | 1 | |
| SONIC Drive-In | 1 | |||
Strongest AM radio stations in Piedmont:
- KOMA (1520 AM; 50 kW; OKLAHOMA CITY, OK; Owner: RENDA BROADCASTING CORP. OF NEVADA)
- WKY (930 AM; 5 kW; OKLAHOMA CITY, OK; Owner: CITADEL BROADCASTING COMPANY)
- KQCV (800 AM; 2 kW; OKLAHOMA CITY, OK; Owner: BOTT BROADCASTING COMPANY)
- KRMG (740 AM; 50 kW; TULSA, OK; Owner: CXR HOLDINGS, INC.)
- WWLS (640 AM; 5 kW; MOORE, OK; Owner: CITADEL BROADCASTING COMPANY)
- KTOK (1000 AM; 5 kW; OKLAHOMA CITY, OK; Owner: CLEAR CHANNEL BROADCASTING LICENSES, INC.)
- KTLR (890 AM; daytime; 1 kW; OKLAHOMA CITY, OK; Owner: TYLER BROADCASTING CORPORATION)
- KFAQ (1170 AM; 50 kW; TULSA, OK; Owner: JOURNAL BROADCAST CORPORATION)
- KCRC (1390 AM; 10 kW; ENID, OK; Owner: CHISHOLM TRAIL BROADCASTING CO.)
- KJON (850 AM; daytime; 5 kW; ANADARKO, OK; Owner: CARROLLTON BROADCASTING OF TEXAS, LP)
- KEBC (1340 AM; 1 kW; OKLAHOMA CITY, OK; Owner: CLEAR CHANNEL BROADCASTING LICENSES, INC.)
- KZUE (1460 AM; 0 kW; EL RENO, OK; Owner: LA TREMENDA RADIO MEXICO, INC.)
- KTBZ (1430 AM; 25 kW; TULSA, OK; Owner: CLEAR CHANNEL BROADCASTING LICENSES, INC.)
Strongest FM radio stations in Piedmont:
- KTUZ-FM (106.7 FM; OKARCHE, OK; Owner: TYLER BROADCASTING CORPORATION)
- KHBZ-FM (94.7 FM; OKLAHOMA CITY, OK; Owner: CLEAR CHANNEL BROADCASTING LICENSES, INC.)
- KTST (101.9 FM; OKLAHOMA CITY, OK; Owner: CLEAR CHANNEL BROADCASTING LICENSES, INC.)
- KJYO (102.7 FM; OKLAHOMA CITY, OK; Owner: CLEAR CHANNEL BROADCASTING LICENSES, INC.)
- KXXY-FM (96.1 FM; OKLAHOMA CITY, OK; Owner: CLEAR CHANNEL BROADCASTING LICENSES, INC.)
- KMGL (104.1 FM; OKLAHOMA CITY, OK; Owner: RENDA BROADCASTING CORP. OF NEVADA)
- KATT-FM (100.5 FM; OKLAHOMA CITY, OK; Owner: CITADEL BROADCASTING COMPANY)
- KYIS (98.9 FM; OKLAHOMA CITY, OK; Owner: CITADEL BROADCASTING COMPANY)
- KOMA-FM (92.5 FM; OKLAHOMA CITY, OK; Owner: RENDA BROADCASTING CORPORATION OF NV)
- KRXO (107.7 FM; OKLAHOMA CITY, OK; Owner: RENDA BROADCASTING CORPORATION OF NV)
- KCSC (90.1 FM; EDMOND, OK; Owner: THE UNIVERSITY OF CENTRAL OKLAHOMA)
- KYLV (88.9 FM; OKLAHOMA CITY, OK; Owner: EDUCATIONAL MEDIA FOUNDATION)
- KKNG-FM (93.3 FM; NEWCASTLE, OK; Owner: TYLER BROADCASTING CORPORATION)
- KOKF (90.9 FM; EDMOND, OK; Owner: R.D.M BROADCASTING ENTERPRISES, INC.)
- KRMP (103.5 FM; ANADARKO, OK; Owner: PERRY BROADCASTING OF SOUTHWEST OKLAHOMA, INC.)
- WWLS-FM (104.9 FM; BETHANY, OK; Owner: CITADEL BROADCASTING COMPANY)
- K259AM (99.7 FM; OKLAHOMA CITY, OK; Owner: THE LOVE STATION, INC.)
- KROU (105.7 FM; SPENCER, OK; Owner: UNIVERSITY OF OKLAHOMA)
- KKWD (97.9 FM; EDMOND, OK; Owner: CITADEL BROADCASTING COMPANY)
- K246AF (97.1 FM; OKLAHOMA CITY, OK; Owner: MICHAEL A. BROOKS / DBA JIME'NEZ COM)
TV broadcast stations around Piedmont:
- KWTV (Channel 9; OKLAHOMA CITY, OK; Owner: GRIFFIN ENTITIES, L.L.C.)
- KOCO-TV (Channel 5; OKLAHOMA CITY, OK; Owner: OHIO/OKLAHOMA HEARST- ARGYLE TELEVISION)
- KOPX (Channel 62; OKLAHOMA CITY, OK; Owner: PAXSON OKLAHOMA CITY LICENSE, INC.)
- KFOR-TV (Channel 4; OKLAHOMA CITY, OK; Owner: NEW YORK TIMES MANAGEMENT SERVICES)
- KSBI (Channel 52; OKLAHOMA CITY, OK; Owner: LOCKE SUPPLY CO.)
- KETA-TV (Channel 13; OKLAHOMA CITY, OK; Owner: OKLAHOMA EDUCATIONAL TELEVISION AUTHORITY)
- KOKH-TV (Channel 25; OKLAHOMA CITY, OK; Owner: KOKH LICENSEE, LLC)
- KOCB (Channel 34; OKLAHOMA CITY, OK; Owner: KOCB LICENSEE, LLC)
- KTBO-TV (Channel 14; OKLAHOMA CITY, OK; Owner: TRINITY BROADCASTING OF OKLAHOMA CITY, INC.)
- KXOC-LP (Channel 54; OKLAHOMA CITY, OK; Owner: LOCKE SUPPLY CO.)
- K69EK (Channel 69; OKLAHOMA CITY, OK; Owner: ARKANSAS MEDIA, L.L.C.)
- KOHC-LP (Channel 7; OKLAHOMA CITY, OK; Owner: TIGER EYE BROADCASTING CORPORATION)
- KDSA-LP (Channel 11; NORMAN, OK; Owner: DAY STAR BROADCASTING CORPORATION)
- KQOK (Channel 30; SHAWNEE, OK; Owner: SHAWNEE BROADCASTING, INC.)
- KCHM-LP (Channel 59; OKLAHOMA CITY, OK; Owner: TIGER EYE BROADCASTING CORPORATION)
- KKCC-LP (Channel 19; OKLAHOMA CITY, OK; Owner: EICB-TV, LLC)
- National Bridge Inventory (NBI) Statistics
- 53Number of bridges
- 305ft / 93.0mTotal length
- $28,121,000Total costs
- 54,019Total average daily traffic
- 9,847Total average daily truck traffic
- 81,184Total future (year 2040) average daily traffic
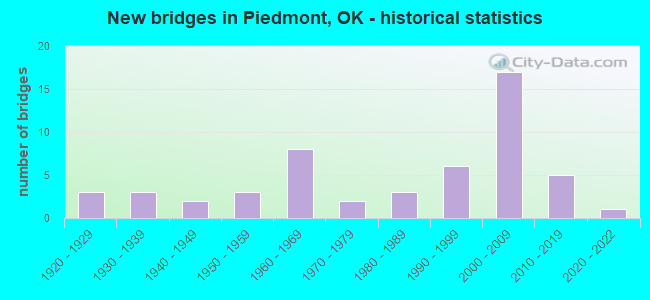
- New bridges - historical statistics
- 31920-1929
- 31930-1939
- 21940-1949
- 31950-1959
- 81960-1969
- 21970-1979
- 31980-1989
- 61990-1999
- 172000-2009
- 52010-2019
- 12020-2022
FCC Registered Antenna Towers: 62 (See the full list of FCC Registered Antenna Towers)
FCC Registered Broadcast Land Mobile Towers: 9 (See the full list of FCC Registered Broadcast Land Mobile Towers in Piedmont, OK)
FCC Registered Microwave Towers: 11 (See the full list of FCC Registered Microwave Towers in this town)
FCC Registered Amateur Radio Licenses: 62 (See the full list of FCC Registered Amateur Radio Licenses in Piedmont)
FAA Registered Aircraft: 16 (See the full list of FAA Registered Aircraft in Piedmont)
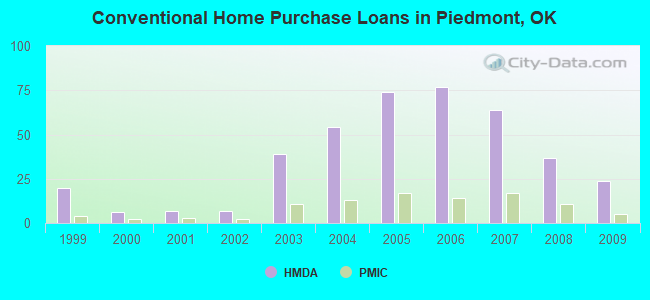
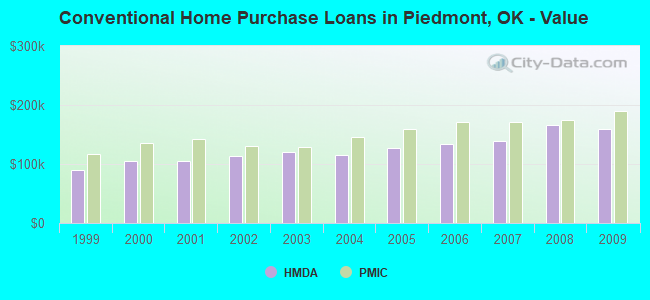
| Home Mortgage Disclosure Act Aggregated Statistics For Year 2009 (Based on 3 partial tracts) | ||||||||||||
| A) FHA, FSA/RHS & VA Home Purchase Loans | B) Conventional Home Purchase Loans | C) Refinancings | D) Home Improvement Loans | F) Non-occupant Loans on < 5 Family Dwellings (A B C & D) | G) Loans On Manufactured Home Dwelling (A B C & D) | |||||||
|---|---|---|---|---|---|---|---|---|---|---|---|---|
| Number | Average Value | Number | Average Value | Number | Average Value | Number | Average Value | Number | Average Value | Number | Average Value | |
| LOANS ORIGINATED | 35 | $160,046 | 24 | $159,282 | 86 | $161,492 | 11 | $37,251 | 4 | $152,725 | 1 | $147,400 |
| APPLICATIONS APPROVED, NOT ACCEPTED | 1 | $135,120 | 1 | $56,740 | 7 | $173,473 | 1 | $4,720 | 0 | $0 | 0 | $0 |
| APPLICATIONS DENIED | 3 | $152,980 | 3 | $177,180 | 22 | $177,207 | 5 | $29,784 | 2 | $95,355 | 1 | $66,120 |
| APPLICATIONS WITHDRAWN | 4 | $179,915 | 4 | $185,768 | 25 | $180,462 | 1 | $11,570 | 1 | $103,940 | 0 | $0 |
| FILES CLOSED FOR INCOMPLETENESS | 1 | $105,370 | 0 | $0 | 5 | $171,052 | 0 | $0 | 0 | $0 | 0 | $0 |
Detailed HMDA statistics for the following Tracts: 3002.01 , 3008.01
| Private Mortgage Insurance Companies Aggregated Statistics For Year 2009 (Based on 3 partial tracts) | ||||
| A) Conventional Home Purchase Loans | B) Refinancings | |||
|---|---|---|---|---|
| Number | Average Value | Number | Average Value | |
| LOANS ORIGINATED | 5 | $190,506 | 4 | $219,655 |
| APPLICATIONS APPROVED, NOT ACCEPTED | 1 | $177,370 | 2 | $195,930 |
| APPLICATIONS DENIED | 0 | $0 | 1 | $178,490 |
| APPLICATIONS WITHDRAWN | 0 | $0 | 1 | $176,230 |
| FILES CLOSED FOR INCOMPLETENESS | 0 | $0 | 0 | $0 |
Detailed PMIC statistics for the following Tracts: 3002.01 , 3008.01
2004 - 2018 National Fire Incident Reporting System (NFIRS) incidents
- Fire incident types reported to NFIRS in Piedmont, OK
- 27860.0%Outside Fires
- 14531.3%Structure Fires
- 265.6%Mobile Property/Vehicle Fires
- 143.0%Other
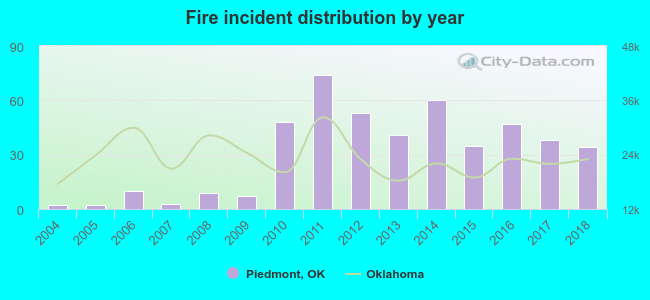 Based on the data from the years 2004 - 2018 the average number of fires per year is 31. The highest number of reported fires - 74 took place in 2011, and the least - 2 in 2004. The data has a rising trend.
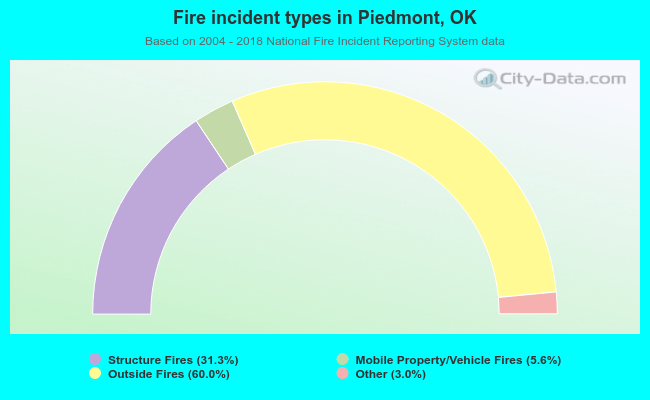 When looking into fire subcategories, the most incidents belonged to: Outside Fires (60.0%), and Structure Fires (31.3%).
| Most common first names in Piedmont, OK among deceased individuals | ||
| Name | Count | Lived (average) |
|---|---|---|
| Mary | 18 | 77.8 years |
| John | 12 | 72.1 years |
| Robert | 9 | 69.3 years |
| Mildred | 8 | 86.1 years |
| James | 8 | 72.5 years |
| Dorothy | 8 | 79.0 years |
| William | 7 | 82.3 years |
| Charles | 6 | 74.2 years |
| Ernest | 6 | 83.7 years |
| Richard | 6 | 68.7 years |
| Most common last names in Piedmont, OK among deceased individuals | ||
| Last name | Count | Lived (average) |
|---|---|---|
| Smith | 9 | 81.7 years |
| Every | 6 | 85.1 years |
| Young | 4 | 77.5 years |
| Davis | 4 | 65.3 years |
| Little | 4 | 79.7 years |
| Blyze | 4 | 73.8 years |
| Preston | 4 | 88.0 years |
| Robinson | 4 | 67.0 years |
| Taylor | 4 | 83.5 years |
| Treece | 4 | 83.0 years |
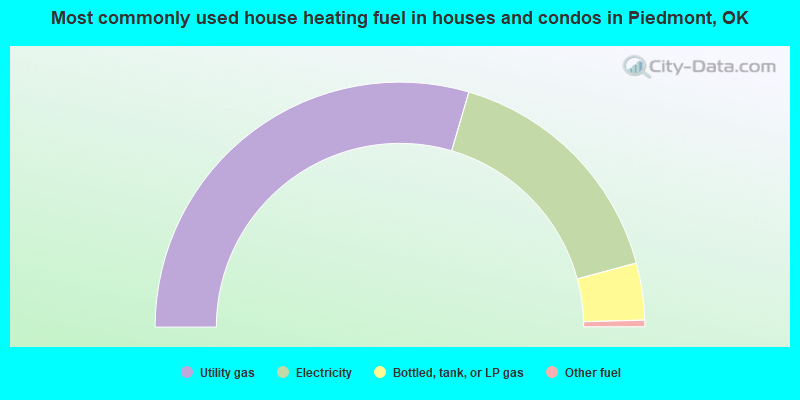
- 59.1%Utility gas
- 32.5%Electricity
- 7.5%Bottled, tank, or LP gas
- 0.9%Other fuel
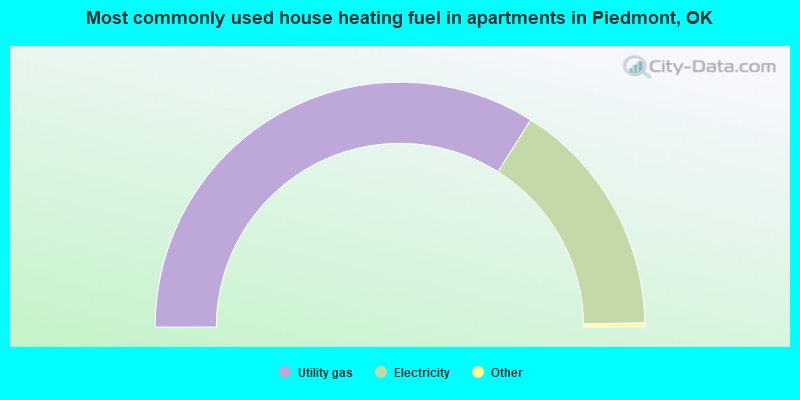
- 68.3%Utility gas
- 31.7%Electricity
Piedmont compared to Oklahoma state average:
- Median house value above state average.
- Unemployed percentage significantly below state average.
- Foreign-born population percentage above state average.
- Renting percentage significantly below state average.
- House age significantly below state average.
- Percentage of population with a bachelor's degree or higher above state average.
Piedmont on our top lists:
- #37 on the list of "Top 101 cities with the lowest number of auto thefts per 100,000 residents (population 5,000+)"
- #99 on the list of "Top 101 cities with largest percentage of females in industries: mining, quarrying, and oil and gas extraction (population 5,000+)"
- #4 on the list of "Top 101 counties with the highest percentage of residents that drank alcohol in the past 30 days"
- #14 on the list of "Top 101 counties with the largest number of people moving in compared to moving out (pop. 50,000+)"
- #20 on the list of "Top 101 counties with highest percentage of residents voting for Romney (Republican) in the 2012 Presidential Election (pop. 50,000+)"
- #26 on the list of "Top 101 counties with the lowest percentage of residents that exercised in the past month"
- #76 on the list of "Top 101 counties with the highest average weight of females"

|
|
Total of 16 patent applications in 2008-2024.