Prescott Valley, Arizona Submit your own pictures of this town and show them to the world
OSM Map
General Map
Google Map
MSN Map
OSM Map
General Map
Google Map
MSN Map
OSM Map
General Map
Google Map
MSN Map
OSM Map
General Map
Google Map
MSN Map
Please wait while loading the map...
Population in 2022: 49,075 (95% urban, 5% rural). Population change since 2000: +108.5%Males: 24,001 Females: 25,074
March 2022 cost of living index in Prescott Valley: 94.5 (less than average, U.S. average is 100) Percentage of residents living in poverty in 2022: 11.8%for White Non-Hispanic residents , 4.7% for Black residents , 19.6% for Hispanic or Latino residents , 16.2% for American Indian residents , 8.8% for other race residents , 24.0% for two or more races residents )
Profiles of local businesses
Business Search - 14 Million verified businesses
Data:
Median household income ($)
Median household income (% change since 2000)
Household income diversity
Ratio of average income to average house value (%)
Ratio of average income to average rent
Median household income ($) - White
Median household income ($) - Black or African American
Median household income ($) - Asian
Median household income ($) - Hispanic or Latino
Median household income ($) - American Indian and Alaska Native
Median household income ($) - Multirace
Median household income ($) - Other Race
Median household income for houses/condos with a mortgage ($)
Median household income for apartments without a mortgage ($)
Races - White alone (%)
Races - White alone (% change since 2000)
Races - Black alone (%)
Races - Black alone (% change since 2000)
Races - American Indian alone (%)
Races - American Indian alone (% change since 2000)
Races - Asian alone (%)
Races - Asian alone (% change since 2000)
Races - Hispanic (%)
Races - Hispanic (% change since 2000)
Races - Native Hawaiian and Other Pacific Islander alone (%)
Races - Native Hawaiian and Other Pacific Islander alone (% change since 2000)
Races - Two or more races (%)
Races - Two or more races (% change since 2000)
Races - Other race alone (%)
Races - Other race alone (% change since 2000)
Racial diversity
Unemployment (%)
Unemployment (% change since 2000)
Unemployment (%) - White
Unemployment (%) - Black or African American
Unemployment (%) - Asian
Unemployment (%) - Hispanic or Latino
Unemployment (%) - American Indian and Alaska Native
Unemployment (%) - Multirace
Unemployment (%) - Other Race
Population density (people per square mile)
Population - Males (%)
Population - Females (%)
Population - Males (%) - White
Population - Males (%) - Black or African American
Population - Males (%) - Asian
Population - Males (%) - Hispanic or Latino
Population - Males (%) - American Indian and Alaska Native
Population - Males (%) - Multirace
Population - Males (%) - Other Race
Population - Females (%) - White
Population - Females (%) - Black or African American
Population - Females (%) - Asian
Population - Females (%) - Hispanic or Latino
Population - Females (%) - American Indian and Alaska Native
Population - Females (%) - Multirace
Population - Females (%) - Other Race
Coronavirus confirmed cases (Apr 27, 2024)
Deaths caused by coronavirus (Apr 27, 2024)
Coronavirus confirmed cases (per 100k population) (Apr 27, 2024)
Deaths caused by coronavirus (per 100k population) (Apr 27, 2024)
Daily increase in number of cases (Apr 27, 2024)
Weekly increase in number of cases (Apr 27, 2024)
Cases doubled (in days) (Apr 27, 2024)
Hospitalized patients (Apr 18, 2022)
Negative test results (Apr 18, 2022)
Total test results (Apr 18, 2022)
COVID Vaccine doses distributed (per 100k population) (Sep 19, 2023)
COVID Vaccine doses administered (per 100k population) (Sep 19, 2023)
COVID Vaccine doses distributed (Sep 19, 2023)
COVID Vaccine doses administered (Sep 19, 2023)
Likely homosexual households (%)
Likely homosexual households (% change since 2000)
Likely homosexual households - Lesbian couples (%)
Likely homosexual households - Lesbian couples (% change since 2000)
Likely homosexual households - Gay men (%)
Likely homosexual households - Gay men (% change since 2000)
Cost of living index
Median gross rent ($)
Median contract rent ($)
Median monthly housing costs ($)
Median house or condo value ($)
Median house or condo value ($ change since 2000)
Mean house or condo value by units in structure - 1, detached ($)
Mean house or condo value by units in structure - 1, attached ($)
Mean house or condo value by units in structure - 2 ($)
Mean house or condo value by units in structure by units in structure - 3 or 4 ($)
Mean house or condo value by units in structure - 5 or more ($)
Mean house or condo value by units in structure - Boat, RV, van, etc. ($)
Mean house or condo value by units in structure - Mobile home ($)
Median house or condo value ($) - White
Median house or condo value ($) - Black or African American
Median house or condo value ($) - Asian
Median house or condo value ($) - Hispanic or Latino
Median house or condo value ($) - American Indian and Alaska Native
Median house or condo value ($) - Multirace
Median house or condo value ($) - Other Race
Median resident age
Resident age diversity
Median resident age - Males
Median resident age - Females
Median resident age - White
Median resident age - Black or African American
Median resident age - Asian
Median resident age - Hispanic or Latino
Median resident age - American Indian and Alaska Native
Median resident age - Multirace
Median resident age - Other Race
Median resident age - Males - White
Median resident age - Males - Black or African American
Median resident age - Males - Asian
Median resident age - Males - Hispanic or Latino
Median resident age - Males - American Indian and Alaska Native
Median resident age - Males - Multirace
Median resident age - Males - Other Race
Median resident age - Females - White
Median resident age - Females - Black or African American
Median resident age - Females - Asian
Median resident age - Females - Hispanic or Latino
Median resident age - Females - American Indian and Alaska Native
Median resident age - Females - Multirace
Median resident age - Females - Other Race
Commute - mean travel time to work (minutes)
Travel time to work - Less than 5 minutes (%)
Travel time to work - Less than 5 minutes (% change since 2000)
Travel time to work - 5 to 9 minutes (%)
Travel time to work - 5 to 9 minutes (% change since 2000)
Travel time to work - 10 to 19 minutes (%)
Travel time to work - 10 to 19 minutes (% change since 2000)
Travel time to work - 20 to 29 minutes (%)
Travel time to work - 20 to 29 minutes (% change since 2000)
Travel time to work - 30 to 39 minutes (%)
Travel time to work - 30 to 39 minutes (% change since 2000)
Travel time to work - 40 to 59 minutes (%)
Travel time to work - 40 to 59 minutes (% change since 2000)
Travel time to work - 60 to 89 minutes (%)
Travel time to work - 60 to 89 minutes (% change since 2000)
Travel time to work - 90 or more minutes (%)
Travel time to work - 90 or more minutes (% change since 2000)
Marital status - Never married (%)
Marital status - Now married (%)
Marital status - Separated (%)
Marital status - Widowed (%)
Marital status - Divorced (%)
Median family income ($)
Median family income (% change since 2000)
Median non-family income ($)
Median non-family income (% change since 2000)
Median per capita income ($)
Median per capita income (% change since 2000)
Median family income ($) - White
Median family income ($) - Black or African American
Median family income ($) - Asian
Median family income ($) - Hispanic or Latino
Median family income ($) - American Indian and Alaska Native
Median family income ($) - Multirace
Median family income ($) - Other Race
Median year house/condo built
Median year apartment built
Year house built - Built 2005 or later (%)
Year house built - Built 2000 to 2004 (%)
Year house built - Built 1990 to 1999 (%)
Year house built - Built 1980 to 1989 (%)
Year house built - Built 1970 to 1979 (%)
Year house built - Built 1960 to 1969 (%)
Year house built - Built 1950 to 1959 (%)
Year house built - Built 1940 to 1949 (%)
Year house built - Built 1939 or earlier (%)
Average household size
Household density (households per square mile)
Average household size - White
Average household size - Black or African American
Average household size - Asian
Average household size - Hispanic or Latino
Average household size - American Indian and Alaska Native
Average household size - Multirace
Average household size - Other Race
Occupied housing units (%)
Vacant housing units (%)
Owner occupied housing units (%)
Renter occupied housing units (%)
Vacancy status - For rent (%)
Vacancy status - For sale only (%)
Vacancy status - Rented or sold, not occupied (%)
Vacancy status - For seasonal, recreational, or occasional use (%)
Vacancy status - For migrant workers (%)
Vacancy status - Other vacant (%)
Residents with income below the poverty level (%)
Residents with income below 50% of the poverty level (%)
Children below poverty level (%)
Poor families by family type - Married-couple family (%)
Poor families by family type - Male, no wife present (%)
Poor families by family type - Female, no husband present (%)
Poverty status for native-born residents (%)
Poverty status for foreign-born residents (%)
Poverty among high school graduates not in families (%)
Poverty among people who did not graduate high school not in families (%)
Residents with income below the poverty level (%) - White
Residents with income below the poverty level (%) - Black or African American
Residents with income below the poverty level (%) - Asian
Residents with income below the poverty level (%) - Hispanic or Latino
Residents with income below the poverty level (%) - American Indian and Alaska Native
Residents with income below the poverty level (%) - Multirace
Residents with income below the poverty level (%) - Other Race
Air pollution - Air Quality Index (AQI)
Air pollution - CO
Air pollution - NO2
Air pollution - SO2
Air pollution - Ozone
Air pollution - PM10
Air pollution - PM25
Air pollution - Pb
Crime - Murders per 100,000 population
Crime - Rapes per 100,000 population
Crime - Robberies per 100,000 population
Crime - Assaults per 100,000 population
Crime - Burglaries per 100,000 population
Crime - Thefts per 100,000 population
Crime - Auto thefts per 100,000 population
Crime - Arson per 100,000 population
Crime - City-data.com crime index
Crime - Violent crime index
Crime - Property crime index
Crime - Murders per 100,000 population (5 year average)
Crime - Rapes per 100,000 population (5 year average)
Crime - Robberies per 100,000 population (5 year average)
Crime - Assaults per 100,000 population (5 year average)
Crime - Burglaries per 100,000 population (5 year average)
Crime - Thefts per 100,000 population (5 year average)
Crime - Auto thefts per 100,000 population (5 year average)
Crime - Arson per 100,000 population (5 year average)
Crime - City-data.com crime index (5 year average)
Crime - Violent crime index (5 year average)
Crime - Property crime index (5 year average)
1996 Presidential Elections Results (%) - Democratic Party (Clinton)
1996 Presidential Elections Results (%) - Republican Party (Dole)
1996 Presidential Elections Results (%) - Other
2000 Presidential Elections Results (%) - Democratic Party (Gore)
2000 Presidential Elections Results (%) - Republican Party (Bush)
2000 Presidential Elections Results (%) - Other
2004 Presidential Elections Results (%) - Democratic Party (Kerry)
2004 Presidential Elections Results (%) - Republican Party (Bush)
2004 Presidential Elections Results (%) - Other
2008 Presidential Elections Results (%) - Democratic Party (Obama)
2008 Presidential Elections Results (%) - Republican Party (McCain)
2008 Presidential Elections Results (%) - Other
2012 Presidential Elections Results (%) - Democratic Party (Obama)
2012 Presidential Elections Results (%) - Republican Party (Romney)
2012 Presidential Elections Results (%) - Other
2016 Presidential Elections Results (%) - Democratic Party (Clinton)
2016 Presidential Elections Results (%) - Republican Party (Trump)
2016 Presidential Elections Results (%) - Other
2020 Presidential Elections Results (%) - Democratic Party (Biden)
2020 Presidential Elections Results (%) - Republican Party (Trump)
2020 Presidential Elections Results (%) - Other
Ancestries Reported - Arab (%)
Ancestries Reported - Czech (%)
Ancestries Reported - Danish (%)
Ancestries Reported - Dutch (%)
Ancestries Reported - English (%)
Ancestries Reported - French (%)
Ancestries Reported - French Canadian (%)
Ancestries Reported - German (%)
Ancestries Reported - Greek (%)
Ancestries Reported - Hungarian (%)
Ancestries Reported - Irish (%)
Ancestries Reported - Italian (%)
Ancestries Reported - Lithuanian (%)
Ancestries Reported - Norwegian (%)
Ancestries Reported - Polish (%)
Ancestries Reported - Portuguese (%)
Ancestries Reported - Russian (%)
Ancestries Reported - Scotch-Irish (%)
Ancestries Reported - Scottish (%)
Ancestries Reported - Slovak (%)
Ancestries Reported - Subsaharan African (%)
Ancestries Reported - Swedish (%)
Ancestries Reported - Swiss (%)
Ancestries Reported - Ukrainian (%)
Ancestries Reported - United States (%)
Ancestries Reported - Welsh (%)
Ancestries Reported - West Indian (%)
Ancestries Reported - Other (%)
Educational Attainment - No schooling completed (%)
Educational Attainment - Less than high school (%)
Educational Attainment - High school or equivalent (%)
Educational Attainment - Less than 1 year of college (%)
Educational Attainment - 1 or more years of college (%)
Educational Attainment - Associate degree (%)
Educational Attainment - Bachelor's degree (%)
Educational Attainment - Master's degree (%)
Educational Attainment - Professional school degree (%)
Educational Attainment - Doctorate degree (%)
School Enrollment - Nursery, preschool (%)
School Enrollment - Kindergarten (%)
School Enrollment - Grade 1 to 4 (%)
School Enrollment - Grade 5 to 8 (%)
School Enrollment - Grade 9 to 12 (%)
School Enrollment - College undergrad (%)
School Enrollment - Graduate or professional (%)
School Enrollment - Not enrolled in school (%)
School enrollment - Public schools (%)
School enrollment - Private schools (%)
School enrollment - Not enrolled (%)
Median number of rooms in houses and condos
Median number of rooms in apartments
Housing units lacking complete plumbing facilities (%)
Housing units lacking complete kitchen facilities (%)
Density of houses
Urban houses (%)
Rural houses (%)
Households with people 60 years and over (%)
Households with people 65 years and over (%)
Households with people 75 years and over (%)
Households with one or more nonrelatives (%)
Households with no nonrelatives (%)
Population in households (%)
Family households (%)
Nonfamily households (%)
Population in families (%)
Family households with own children (%)
Median number of bedrooms in owner occupied houses
Mean number of bedrooms in owner occupied houses
Median number of bedrooms in renter occupied houses
Mean number of bedrooms in renter occupied houses
Median number of vehichles in owner occupied houses
Mean number of vehichles in owner occupied houses
Median number of vehichles in renter occupied houses
Mean number of vehichles in renter occupied houses
Mortgage status - with mortgage (%)
Mortgage status - with second mortgage (%)
Mortgage status - with home equity loan (%)
Mortgage status - with both second mortgage and home equity loan (%)
Mortgage status - without a mortgage (%)
Average family size
Average family size - White
Average family size - Black or African American
Average family size - Asian
Average family size - Hispanic or Latino
Average family size - American Indian and Alaska Native
Average family size - Multirace
Average family size - Other Race
Geographical mobility - Same house 1 year ago (%)
Geographical mobility - Moved within same county (%)
Geographical mobility - Moved from different county within same state (%)
Geographical mobility - Moved from different state (%)
Geographical mobility - Moved from abroad (%)
Place of birth - Born in state of residence (%)
Place of birth - Born in other state (%)
Place of birth - Native, outside of US (%)
Place of birth - Foreign born (%)
Housing units in structures - 1, detached (%)
Housing units in structures - 1, attached (%)
Housing units in structures - 2 (%)
Housing units in structures - 3 or 4 (%)
Housing units in structures - 5 to 9 (%)
Housing units in structures - 10 to 19 (%)
Housing units in structures - 20 to 49 (%)
Housing units in structures - 50 or more (%)
Housing units in structures - Mobile home (%)
Housing units in structures - Boat, RV, van, etc. (%)
House/condo owner moved in on average (years ago)
Renter moved in on average (years ago)
Year householder moved into unit - Moved in 1999 to March 2000 (%)
Year householder moved into unit - Moved in 1995 to 1998 (%)
Year householder moved into unit - Moved in 1990 to 1994 (%)
Year householder moved into unit - Moved in 1980 to 1989 (%)
Year householder moved into unit - Moved in 1970 to 1979 (%)
Year householder moved into unit - Moved in 1969 or earlier (%)
Means of transportation to work - Drove car alone (%)
Means of transportation to work - Carpooled (%)
Means of transportation to work - Public transportation (%)
Means of transportation to work - Bus or trolley bus (%)
Means of transportation to work - Streetcar or trolley car (%)
Means of transportation to work - Subway or elevated (%)
Means of transportation to work - Railroad (%)
Means of transportation to work - Ferryboat (%)
Means of transportation to work - Taxicab (%)
Means of transportation to work - Motorcycle (%)
Means of transportation to work - Bicycle (%)
Means of transportation to work - Walked (%)
Means of transportation to work - Other means (%)
Working at home (%)
Industry diversity
Most Common Industries - Agriculture, forestry, fishing and hunting, and mining (%)
Most Common Industries - Agriculture, forestry, fishing and hunting (%)
Most Common Industries - Mining, quarrying, and oil and gas extraction (%)
Most Common Industries - Construction (%)
Most Common Industries - Manufacturing (%)
Most Common Industries - Wholesale trade (%)
Most Common Industries - Retail trade (%)
Most Common Industries - Transportation and warehousing, and utilities (%)
Most Common Industries - Transportation and warehousing (%)
Most Common Industries - Utilities (%)
Most Common Industries - Information (%)
Most Common Industries - Finance and insurance, and real estate and rental and leasing (%)
Most Common Industries - Finance and insurance (%)
Most Common Industries - Real estate and rental and leasing (%)
Most Common Industries - Professional, scientific, and management, and administrative and waste management services (%)
Most Common Industries - Professional, scientific, and technical services (%)
Most Common Industries - Management of companies and enterprises (%)
Most Common Industries - Administrative and support and waste management services (%)
Most Common Industries - Educational services, and health care and social assistance (%)
Most Common Industries - Educational services (%)
Most Common Industries - Health care and social assistance (%)
Most Common Industries - Arts, entertainment, and recreation, and accommodation and food services (%)
Most Common Industries - Arts, entertainment, and recreation (%)
Most Common Industries - Accommodation and food services (%)
Most Common Industries - Other services, except public administration (%)
Most Common Industries - Public administration (%)
Occupation diversity
Most Common Occupations - Management, business, science, and arts occupations (%)
Most Common Occupations - Management, business, and financial occupations (%)
Most Common Occupations - Management occupations (%)
Most Common Occupations - Business and financial operations occupations (%)
Most Common Occupations - Computer, engineering, and science occupations (%)
Most Common Occupations - Computer and mathematical occupations (%)
Most Common Occupations - Architecture and engineering occupations (%)
Most Common Occupations - Life, physical, and social science occupations (%)
Most Common Occupations - Education, legal, community service, arts, and media occupations (%)
Most Common Occupations - Community and social service occupations (%)
Most Common Occupations - Legal occupations (%)
Most Common Occupations - Education, training, and library occupations (%)
Most Common Occupations - Arts, design, entertainment, sports, and media occupations (%)
Most Common Occupations - Healthcare practitioners and technical occupations (%)
Most Common Occupations - Health diagnosing and treating practitioners and other technical occupations (%)
Most Common Occupations - Health technologists and technicians (%)
Most Common Occupations - Service occupations (%)
Most Common Occupations - Healthcare support occupations (%)
Most Common Occupations - Protective service occupations (%)
Most Common Occupations - Fire fighting and prevention, and other protective service workers including supervisors (%)
Most Common Occupations - Law enforcement workers including supervisors (%)
Most Common Occupations - Food preparation and serving related occupations (%)
Most Common Occupations - Building and grounds cleaning and maintenance occupations (%)
Most Common Occupations - Personal care and service occupations (%)
Most Common Occupations - Sales and office occupations (%)
Most Common Occupations - Sales and related occupations (%)
Most Common Occupations - Office and administrative support occupations (%)
Most Common Occupations - Natural resources, construction, and maintenance occupations (%)
Most Common Occupations - Farming, fishing, and forestry occupations (%)
Most Common Occupations - Construction and extraction occupations (%)
Most Common Occupations - Installation, maintenance, and repair occupations (%)
Most Common Occupations - Production, transportation, and material moving occupations (%)
Most Common Occupations - Production occupations (%)
Most Common Occupations - Transportation occupations (%)
Most Common Occupations - Material moving occupations (%)
People in Group quarters - Institutionalized population (%)
People in Group quarters - Correctional institutions (%)
People in Group quarters - Federal prisons and detention centers (%)
People in Group quarters - Halfway houses (%)
People in Group quarters - Local jails and other confinement facilities (including police lockups) (%)
People in Group quarters - Military disciplinary barracks (%)
People in Group quarters - State prisons (%)
People in Group quarters - Other types of correctional institutions (%)
People in Group quarters - Nursing homes (%)
People in Group quarters - Hospitals/wards, hospices, and schools for the handicapped (%)
People in Group quarters - Hospitals/wards and hospices for chronically ill (%)
People in Group quarters - Hospices or homes for chronically ill (%)
People in Group quarters - Military hospitals or wards for chronically ill (%)
People in Group quarters - Other hospitals or wards for chronically ill (%)
People in Group quarters - Hospitals or wards for drug/alcohol abuse (%)
People in Group quarters - Mental (Psychiatric) hospitals or wards (%)
People in Group quarters - Schools, hospitals, or wards for the mentally retarded (%)
People in Group quarters - Schools, hospitals, or wards for the physically handicapped (%)
People in Group quarters - Institutions for the deaf (%)
People in Group quarters - Institutions for the blind (%)
People in Group quarters - Orthopedic wards and institutions for the physically handicapped (%)
People in Group quarters - Wards in general hospitals for patients who have no usual home elsewhere (%)
People in Group quarters - Wards in military hospitals for patients who have no usual home elsewhere (%)
People in Group quarters - Juvenile institutions (%)
People in Group quarters - Long-term care (%)
People in Group quarters - Homes for abused, dependent, and neglected children (%)
People in Group quarters - Residential treatment centers for emotionally disturbed children (%)
People in Group quarters - Training schools for juvenile delinquents (%)
People in Group quarters - Short-term care, detention or diagnostic centers for delinquent children (%)
People in Group quarters - Type of juvenile institution unknown (%)
People in Group quarters - Noninstitutionalized population (%)
People in Group quarters - College dormitories (includes college quarters off campus) (%)
People in Group quarters - Military quarters (%)
People in Group quarters - On base (%)
People in Group quarters - Barracks, unaccompanied personnel housing (UPH), (Enlisted/Officer), ;and similar group living quarters for military personnel (%)
People in Group quarters - Transient quarters for temporary residents (%)
People in Group quarters - Military ships (%)
People in Group quarters - Group homes (%)
People in Group quarters - Homes or halfway houses for drug/alcohol abuse (%)
People in Group quarters - Homes for the mentally ill (%)
People in Group quarters - Homes for the mentally retarded (%)
People in Group quarters - Homes for the physically handicapped (%)
People in Group quarters - Other group homes (%)
People in Group quarters - Religious group quarters (%)
People in Group quarters - Dormitories (%)
People in Group quarters - Agriculture workers' dormitories on farms (%)
People in Group quarters - Job Corps and vocational training facilities (%)
People in Group quarters - Other workers' dormitories (%)
People in Group quarters - Crews of maritime vessels (%)
People in Group quarters - Other nonhousehold living situations (%)
People in Group quarters - Other noninstitutional group quarters (%)
Residents speaking English at home (%)
Residents speaking English at home - Born in the United States (%)
Residents speaking English at home - Native, born elsewhere (%)
Residents speaking English at home - Foreign born (%)
Residents speaking Spanish at home (%)
Residents speaking Spanish at home - Born in the United States (%)
Residents speaking Spanish at home - Native, born elsewhere (%)
Residents speaking Spanish at home - Foreign born (%)
Residents speaking other language at home (%)
Residents speaking other language at home - Born in the United States (%)
Residents speaking other language at home - Native, born elsewhere (%)
Residents speaking other language at home - Foreign born (%)
Class of Workers - Employee of private company (%)
Class of Workers - Self-employed in own incorporated business (%)
Class of Workers - Private not-for-profit wage and salary workers (%)
Class of Workers - Local government workers (%)
Class of Workers - State government workers (%)
Class of Workers - Federal government workers (%)
Class of Workers - Self-employed workers in own not incorporated business and Unpaid family workers (%)
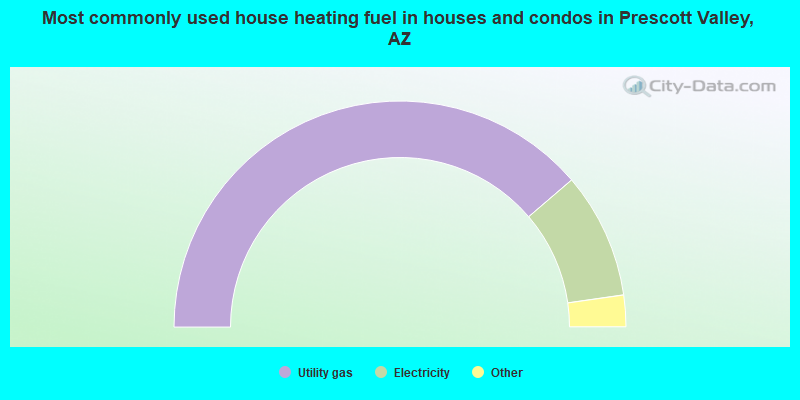
House heating fuel used in houses and condos - Utility gas (%)
House heating fuel used in houses and condos - Bottled, tank, or LP gas (%)
House heating fuel used in houses and condos - Electricity (%)
House heating fuel used in houses and condos - Fuel oil, kerosene, etc. (%)
House heating fuel used in houses and condos - Coal or coke (%)
House heating fuel used in houses and condos - Wood (%)
House heating fuel used in houses and condos - Solar energy (%)
House heating fuel used in houses and condos - Other fuel (%)
House heating fuel used in houses and condos - No fuel used (%)
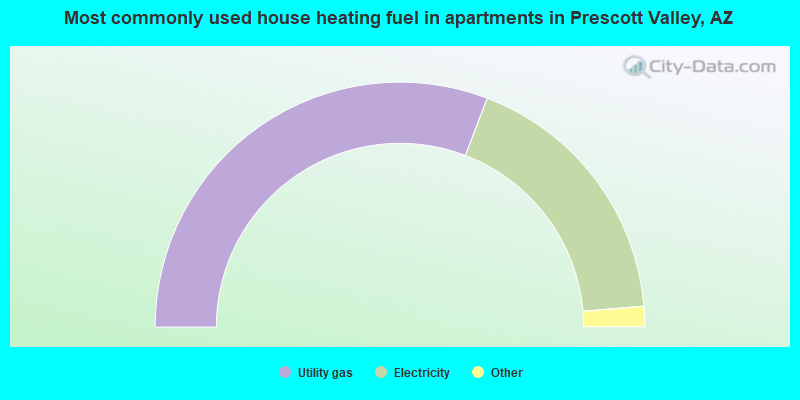
House heating fuel used in apartments - Utility gas (%)
House heating fuel used in apartments - Bottled, tank, or LP gas (%)
House heating fuel used in apartments - Electricity (%)
House heating fuel used in apartments - Fuel oil, kerosene, etc. (%)
House heating fuel used in apartments - Coal or coke (%)
House heating fuel used in apartments - Wood (%)
House heating fuel used in apartments - Solar energy (%)
House heating fuel used in apartments - Other fuel (%)
House heating fuel used in apartments - No fuel used (%)
Armed forces status - In Armed Forces (%)
Armed forces status - Civilian (%)
Armed forces status - Civilian - Veteran (%)
Armed forces status - Civilian - Nonveteran (%)
Fatal accidents locations in years 2005-2021
Fatal accidents locations in 2005
Fatal accidents locations in 2006
Fatal accidents locations in 2007
Fatal accidents locations in 2008
Fatal accidents locations in 2009
Fatal accidents locations in 2010
Fatal accidents locations in 2011
Fatal accidents locations in 2012
Fatal accidents locations in 2013
Fatal accidents locations in 2014
Fatal accidents locations in 2015
Fatal accidents locations in 2016
Fatal accidents locations in 2017
Fatal accidents locations in 2018
Fatal accidents locations in 2019
Fatal accidents locations in 2020
Fatal accidents locations in 2021
Alcohol use - People drinking some alcohol every month (%)
Alcohol use - People not drinking at all (%)
Alcohol use - Average days/month drinking alcohol
Alcohol use - Average drinks/week
Alcohol use - Average days/year people drink much
Audiometry - Average condition of hearing (%)
Audiometry - People that can hear a whisper from across a quiet room (%)
Audiometry - People that can hear normal voice from across a quiet room (%)
Audiometry - Ears ringing, roaring, buzzing (%)
Audiometry - Had a job exposure to loud noise (%)
Audiometry - Had off-work exposure to loud noise (%)
Blood Pressure & Cholesterol - Has high blood pressure (%)
Blood Pressure & Cholesterol - Checking blood pressure at home (%)
Blood Pressure & Cholesterol - Frequently checking blood cholesterol (%)
Blood Pressure & Cholesterol - Has high cholesterol level (%)
Consumer Behavior - Money monthly spent on food at supermarket/grocery store
Consumer Behavior - Money monthly spent on food at other stores
Consumer Behavior - Money monthly spent on eating out
Consumer Behavior - Money monthly spent on carryout/delivered foods
Consumer Behavior - Income spent on food at supermarket/grocery store (%)
Consumer Behavior - Income spent on food at other stores (%)
Consumer Behavior - Income spent on eating out (%)
Consumer Behavior - Income spent on carryout/delivered foods (%)
Current Health Status - General health condition (%)
Current Health Status - Blood donors (%)
Current Health Status - Has blood ever tested for HIV virus (%)
Current Health Status - Left-handed people (%)
Dermatology - People using sunscreen (%)
Diabetes - Diabetics (%)
Diabetes - Had a blood test for high blood sugar (%)
Diabetes - People taking insulin (%)
Diet Behavior & Nutrition - Diet health (%)
Diet Behavior & Nutrition - Milk product consumption (# of products/month)
Diet Behavior & Nutrition - Meals not home prepared (#/week)
Diet Behavior & Nutrition - Meals from fast food or pizza place (#/week)
Diet Behavior & Nutrition - Ready-to-eat foods (#/month)
Diet Behavior & Nutrition - Frozen meals/pizza (#/month)
Drug Use - People that ever used marijuana or hashish (%)
Drug Use - Ever used hard drugs (%)
Drug Use - Ever used any form of cocaine (%)
Drug Use - Ever used heroin (%)
Drug Use - Ever used methamphetamine (%)
Health Insurance - People covered by health insurance (%)
Kidney Conditions-Urology - Avg. # of times urinating at night
Medical Conditions - People with asthma (%)
Medical Conditions - People with anemia (%)
Medical Conditions - People with psoriasis (%)
Medical Conditions - People with overweight (%)
Medical Conditions - Elderly people having difficulties in thinking or remembering (%)
Medical Conditions - People who ever received blood transfusion (%)
Medical Conditions - People having trouble seeing even with glass/contacts (%)
Medical Conditions - People with arthritis (%)
Medical Conditions - People with gout (%)
Medical Conditions - People with congestive heart failure (%)
Medical Conditions - People with coronary heart disease (%)
Medical Conditions - People with angina pectoris (%)
Medical Conditions - People who ever had heart attack (%)
Medical Conditions - People who ever had stroke (%)
Medical Conditions - People with emphysema (%)
Medical Conditions - People with thyroid problem (%)
Medical Conditions - People with chronic bronchitis (%)
Medical Conditions - People with any liver condition (%)
Medical Conditions - People who ever had cancer or malignancy (%)
Mental Health - People who have little interest in doing things (%)
Mental Health - People feeling down, depressed, or hopeless (%)
Mental Health - People who have trouble sleeping or sleeping too much (%)
Mental Health - People feeling tired or having little energy (%)
Mental Health - People with poor appetite or overeating (%)
Mental Health - People feeling bad about themself (%)
Mental Health - People who have trouble concentrating on things (%)
Mental Health - People moving or speaking slowly or too fast (%)
Mental Health - People having thoughts they would be better off dead (%)
Oral Health - Average years since last visit a dentist
Oral Health - People embarrassed because of mouth (%)
Oral Health - People with gum disease (%)
Oral Health - General health of teeth and gums (%)
Oral Health - Average days a week using dental floss/device
Oral Health - Average days a week using mouthwash for dental problem
Oral Health - Average number of teeth
Pesticide Use - Households using pesticides to control insects (%)
Pesticide Use - Households using pesticides to kill weeds (%)
Physical Activity - People doing vigorous-intensity work activities (%)
Physical Activity - People doing moderate-intensity work activities (%)
Physical Activity - People walking or bicycling (%)
Physical Activity - People doing vigorous-intensity recreational activities (%)
Physical Activity - People doing moderate-intensity recreational activities (%)
Physical Activity - Average hours a day doing sedentary activities
Physical Activity - Average hours a day watching TV or videos
Physical Activity - Average hours a day using computer
Physical Functioning - People having limitations keeping them from working (%)
Physical Functioning - People limited in amount of work they can do (%)
Physical Functioning - People that need special equipment to walk (%)
Physical Functioning - People experiencing confusion/memory problems (%)
Physical Functioning - People requiring special healthcare equipment (%)
Prescription Medications - Average number of prescription medicines taking
Preventive Aspirin Use - Adults 40+ taking low-dose aspirin (%)
Reproductive Health - Vaginal deliveries (%)
Reproductive Health - Cesarean deliveries (%)
Reproductive Health - Deliveries resulted in a live birth (%)
Reproductive Health - Pregnancies resulted in a delivery (%)
Reproductive Health - Women breastfeeding newborns (%)
Reproductive Health - Women that had a hysterectomy (%)
Reproductive Health - Women that had both ovaries removed (%)
Reproductive Health - Women that have ever taken birth control pills (%)
Reproductive Health - Women taking birth control pills (%)
Reproductive Health - Women that have ever used Depo-Provera or injectables (%)
Reproductive Health - Women that have ever used female hormones (%)
Sexual Behavior - People 18+ that ever had sex (vaginal, anal, or oral) (%)
Sexual Behavior - Males 18+ that ever had vaginal sex with a woman (%)
Sexual Behavior - Males 18+ that ever performed oral sex on a woman (%)
Sexual Behavior - Males 18+ that ever had anal sex with a woman (%)
Sexual Behavior - Males 18+ that ever had any sex with a man (%)
Sexual Behavior - Females 18+ that ever had vaginal sex with a man (%)
Sexual Behavior - Females 18+ that ever performed oral sex on a man (%)
Sexual Behavior - Females 18+ that ever had anal sex with a man (%)
Sexual Behavior - Females 18+ that ever had any kind of sex with a woman (%)
Sexual Behavior - Average age people first had sex
Sexual Behavior - Average number of female sex partners in lifetime (males 18+)
Sexual Behavior - Average number of female vaginal sex partners in lifetime (males 18+)
Sexual Behavior - Average age people first performed oral sex on a woman (18+)
Sexual Behavior - Average number of woman performed oral sex on in lifetime (18+)
Sexual Behavior - Average number of male sex partners in lifetime (males 18+)
Sexual Behavior - Average number of male anal sex partners in lifetime (males 18+)
Sexual Behavior - Average age people first performed oral sex on a man (18+)
Sexual Behavior - Average number of male oral sex partners in lifetime (18+)
Sexual Behavior - People using protection when performing oral sex (%)
Sexual Behavior - Average number of times people have vaginal or anal sex a year
Sexual Behavior - People having sex without condom (%)
Sexual Behavior - Average number of male sex partners in lifetime (females 18+)
Sexual Behavior - Average number of male vaginal sex partners in lifetime (females 18+)
Sexual Behavior - Average number of female sex partners in lifetime (females 18+)
Sexual Behavior - Circumcised males 18+ (%)
Sleep Disorders - Average hours sleeping at night
Sleep Disorders - People that has trouble sleeping (%)
Smoking-Cigarette Use - People smoking cigarettes (%)
Taste & Smell - People 40+ having problems with smell (%)
Taste & Smell - People 40+ having problems with taste (%)
Taste & Smell - People 40+ that ever had wisdom teeth removed (%)
Taste & Smell - People 40+ that ever had tonsils teeth removed (%)
Taste & Smell - People 40+ that ever had a loss of consciousness because of a head injury (%)
Taste & Smell - People 40+ that ever had a broken nose or other serious injury to face or skull (%)
Taste & Smell - People 40+ that ever had two or more sinus infections (%)
Weight - Average height (inches)
Weight - Average weight (pounds)
Weight - Average BMI
Weight - People that are obese (%)
Weight - People that ever were obese (%)
Weight - People trying to lose weight (%)
35,378 72.7% White alone 10,106 20.8% Hispanic 1,857 3.8% Two or more races 497 1.0% American Indian alone 436 0.9% Asian alone 331 0.7% Black alone 119 0.2% Other race alone
Officers per 1,000 residents here:
1.51Arizona average:
1.75
Latest news from Prescott Valley, AZ collected exclusively by city-data.com from local newspapers, TV, and radio stations
Ancestries: German (12.4%), English (11.5%), American (10.1%), Irish (6.8%), Italian (4.2%), Scottish (2.8%).
Current Local Time:
Land area: 31.7 square miles.
Population density: 1,547 people per square mile (low).
3,900 residents are foreign born (5.8% Latin America , 1.0% Asia , 0.9% Europe ).
This town:
8.0%Arizona:
13.0%
Median real estate property taxes paid for housing units with mortgages in 2022: $1,742 (0.4%)Median real estate property taxes paid for housing units with no mortgage in 2022: $1,758 (0.4%)
Nearest city with pop. 50,000+: Flagstaff, AZ
Nearest city with pop. 200,000+: Glendale, AZ
Nearest city with pop. 1,000,000+: Phoenix, AZ
Nearest cities:
Latitude: 34.60 N, Longitude: 112.32 W
Daytime population change due to commuting: -3,739 (-7.7%)Workers who live and work in this town: 9,386 (46.7%)
Single-family new house construction building permits:
2022: 567 buildings , average cost: $359,5002021: 534 buildings , average cost: $284,9002020: 515 buildings , average cost: $264,7002019: 454 buildings , average cost: $270,0002018: 496 buildings , average cost: $271,9002017: 497 buildings , average cost: $246,8002016: 472 buildings , average cost: $229,6002015: 417 buildings , average cost: $225,8002014: 329 buildings , average cost: $224,4002013: 283 buildings , average cost: $210,8002012: 146 buildings , average cost: $206,6002011: 41 buildings , average cost: $194,0002010: 21 buildings , average cost: $176,0002009: 41 buildings , average cost: $207,9002008: 90 buildings , average cost: $190,9002007: 321 buildings , average cost: $191,1002006: 782 buildings , average cost: $187,8002005: 1146 buildings , average cost: $165,8002004: 1060 buildings , average cost: $119,6002003: 696 buildings , average cost: $99,9002002: 601 buildings , average cost: $151,4002001: 394 buildings , average cost: $81,6002000: 361 buildings , average cost: $78,1001999: 461 buildings , average cost: $78,3001998: 443 buildings , average cost: $73,8001997: 328 buildings , average cost: $70,700Unemployment in December 2023: Population change in the 1990s: +14,186 (+151.7%).
Most common occupations in Prescott Valley, AZ (%)
Both Males Females
Other sales and related occupations, including supervisors (7.4%)
Other management occupations, except farmers and farm managers (4.5%)
Building and grounds cleaning and maintenance occupations (3.5%)
Other production occupations, including supervisors (3.2%)
Retail sales workers, except cashiers (3.2%)
Other office and administrative support workers, including supervisors (3.2%)
Metal workers and plastic workers (2.6%)
Other sales and related occupations, including supervisors (7.9%)
Other management occupations, except farmers and farm managers (5.3%)
Other production occupations, including supervisors (4.6%)
Construction traders workers except carpenters, electricians, painters, plumbers, and construction laborers (4.5%)
Driver/sales workers and truck drivers (4.3%)
Vehicle and mobile equipment mechanics, installers, and repairers (4.1%)
Metal workers and plastic workers (4.1%)
Other sales and related occupations, including supervisors (6.8%)
Other office and administrative support workers, including supervisors (6.1%)
Secretaries and administrative assistants (5.1%)
Information and record clerks, except customer service representatives (5.0%)
Cashiers (4.5%)
Bookkeeping, accounting, and auditing clerks (4.2%)
Child care workers (3.8%)
Air pollution and air quality trends(lower is better)
AQI Ozone
Earthquake activity:
Prescott Valley-area historical earthquake activity is significantly above Arizona state average. It is 2912% greater than the overall U.S. average. On 6/28/1992 at 11:57:34, a magnitude 7.6 (6.2 MB, 7.6 MS, 7.3 MW, Depth: 0.7 mi, Class: Major, Intensity: VIII - XII) earthquake occurred 242.0 miles away from Prescott Valley center, causing 3 deaths ( 1 shaking deaths, 2 other deaths) and 400 injuries, causing $100,000,000 total damage and $40,000,000 insured lossesOn 10/16/1999 at 09:46:44, a magnitude 7.4 (6.3 MB, 7.4 MS, 7.2 MW, 7.3 ML) earthquake occurred 234.4 miles away from Prescott Valley center On 5/19/1940 at 04:36:40, a magnitude 7.2 (7.2 UK) earthquake occurred 216.0 miles away from Prescott Valley center, causing $33,000,000 total damage On 12/31/1934 at 18:45:56, a magnitude 7.1 (7.1 UK) earthquake occurred 238.3 miles away from the city center On 10/15/1979 at 23:16:54, a magnitude 7.0 (5.7 MB, 6.9 MS, 7.0 ML, 6.4 MW) earthquake occurred 227.4 miles away from Prescott Valley center On 7/21/1952 at 11:52:14, a magnitude 7.7 (7.7 UK) earthquake occurred 380.2 miles away from the city center, causing $50,000,000 total damage Magnitude types: body-wave magnitude (MB), local magnitude (ML), surface-wave magnitude (MS), moment magnitude (MW) Natural disasters: The number of natural disasters in Yavapai County (18) is near the US average (15).Major Disasters (Presidential) Declared: 9Emergencies Declared: 2Floods: 9, Storms: 8, Fires: 6, Drought: 1, Hurricane: 1, Tornado: 1, Winter Storm: 1, Other: 1 (Note: some incidents may be assigned to more than one category). Hospitals and medical centers in Prescott Valley: MOUNTAIN VALLEY REGIONAL REHABILITATION HOSPITAL (3700 NORTH WINDSONG DRIVE) YAVAPAI REGIONAL MEDICAL CENTER-EAST (Voluntary non-profit - Private, 7700 EAST FLORENTINE ROAD) YRMC HOSPICE (3262 WINDSONG DRIVE) NNI HOME CARE SERVICES (3085 NORTH WINDSONG DRIVE, SUITE A)
YRMC HOME HEALTH SERVICES (3262 NORTH WINDSONG DRIVE)
GOOD SAMARITAN SOCIETY-PRESCOTT VALLEY (3380 NORTH WINDSONG DRIVE)
College/University in Prescott Valley: Northcentral University Full-time enrollment: 5,927; Location: 10000 E. University Dr; Private, for-profit; Website: www.ncu.edu; Offers Doctor's degree )
Other colleges/universities with over 2000 students near Prescott Valley:
Yavapai College (about 9 miles; Prescott, AZ ; Full-time enrollment: 4,258)
Northern Arizona University (about 55 miles; Flagstaff, AZ ; FT enrollment: 22,494)
Coconino Community College (about 55 miles; Flagstaff, AZ ; FT enrollment: 2,090)
Universal Technical Institute of Arizona Inc-Motorcycle Mechanics Institute Division (about 65 miles; Phoenix, AZ ; FT enrollment: 2,976)
Paradise Valley Community College (about 69 miles; Phoenix, AZ ; FT enrollment: 5,259)
Arizona State University-West (about 70 miles; Glendale, AZ ; FT enrollment: 3,454)
Everest College-Phoenix (about 72 miles; Phoenix, AZ ; FT enrollment: 2,008)
Public schools in Prescott Valley: MOUNTAIN VIEW ELEMENTARY SCHOOL Students: 1,438, Location: 8601 E. LOOS DRIVE, Charter school )LIBERTY TRADITIONAL SCHOOL Students: 748, Location: 3300 LAKE VALLEY DRIVE)GLASSFORD HILL MIDDLE SCHOOL Students: 663, Location: 6901 PANTHER PATH, Charter school )COYOTE SPRINGS ELEMENTARY SCHOOL Students: 650, Location: 6625 N. ROBERT RD, Charter school )GRANVILLE ELEMENTARY SCHOOL Students: 531, Location: 5250 STOVER DRIVE)LAKE VALLEY ELEMENTARY SCHOOL Students: 467, Location: 3900 N. STARLIGHT DRIVE, Charter school )FRANKLIN PHONETIC PRIMARY SCHOOL Students: 414, Location: 6116 E. HIGHWAY 69, Charter school )ACORN MONTESSORI CHARTER SCHOOL Students: 285, Location: 8556 EAST LOOS DRIVE, Charter school )PRESCOTT VALLEY SCHOOL Students: 180, Location: 9500 LORNA LANE, Charter school )PARK VIEW MIDDLE SCHOOL Students: 154, Location: 8300 E DANA DR, Charter school )YAVAPAI COUNTY HIGH SCHOOL Students: 76, Location: 6325 BAJA CIRCLE)CANYON VIEW PREP ACADEMY Location: 9030 E FLORENTINE ROAD, Charter school )
PACE PREPARATORY ACADEMY Location: 6650 E. 2ND STREET, Charter school )
ACORN MONTESSORI CHARTER SCHOOL INC. - WEST Location: 7555 E. LONG LOOK DRIVE, Charter school )
MIJTED - BRADSHAW MOUNTAIN HIGH SCHOOL Location: 6000 EAST LONG LOOK DRIVE)
ARIZONA AGRIBUSINESS & EQUINE CENTER INC. - PRESC Location: 7500 CIVIC CIRCLE DR., Charter school )
BRADSHAW MOUNTAIN HIGH SCHOOL Location: 6000 LONGLOOK RD.)
BRIGHT FUTURES PRESCHOOL Location: 3300 N. LAKE VALLEY ROAD)
See full list of schools located in Prescott Valley Library in Prescott Valley: PRESCOTT VALLEY PUBLIC LIBRARY Operating income: $1,489,016; Location: 7501 CIVIC CIRCLE; 84,000 books ; 435 e-books ; 3,356 audio materials ; 7,413 video materials ; 2 local licensed databases ; 39 state licensed databases ; 2 other licensed databases ; 83 print serial subscriptions ; 1 electronic serial subscriptions )
User-submitted facts and corrections:
When asked, "Where are you from?" the answer will most likely be, "California".
Notable locations in Prescott Valley: (A) , Yeager (B) , Central Yavapai Fire District Station 59 (C) , Central Yavapai Fire District Station 533 (D) , Central Yavapai Fire District Station 53 (E) , Prescott Valley Police Department (F) . Display/hide their locations on the map
Shopping Centers: (1) , Town and Country Valley Mall (2) . Display/hide their locations on the map
Churches in Prescott Valley include: (A) , First Southern Baptist Church of Prescott Valley (B) , Emmanuel Lutheran Church (C) , Christ Evangelical Lutheran Church (D) , Chapel of the Valley (E) , Bethel Baptist Church (F) , Robert Road Southern Baptist Church (G) , Prescott Valley United Methodist Church (H) , Prescott Valley Church of the Nazarene (I) . Display/hide their locations on the map
Lakes and reservoirs: (A) , Mesa Reservoir (B) . Display/hide their locations on the map
Streams, rivers, and creeks: (A) . Display/hide its location on the map
Parks in Prescott Valley include: (1) , Prescott Valley Recreation Area (2) . Display/hide their locations on the map
Hotels: (1) , Prescott Valley-Days Inn (7875 E. Highway 69) (2) , Prescott Valley Motel (8390 East State Route 69) (3) . Display/hide their approximate locations on the map
Birthplace of: Matt Lyon - College basketball player (Northern Arizona Lumberjacks).
Yavapai County has a predicted average indoor radon screening level between 2 and 4 pCi/L (pico curies per liter) - Moderate Potential Drinking water stations with addresses in Prescott Valley and their reported violations in the past:
DIAMOND VALLEY WATER USERS (Population served: 2,000, Purch groundwater):
Past monitoring violations:
Monitoring and Reporting (DBP) - Between JUL-2013 and SEP-2013, Contaminant: Chlorine
Monitoring and Reporting (DBP) - Between OCT-2012 and DEC-2012, Contaminant: Chlorine. Follow-up actions: St Violation/Reminder Notice (APR-02-2013), St Formal NOV issued (MAY-22-2013), St Compliance achieved (2 times from AUG-28-2013 to OCT-02-2013)
Monitoring and Reporting (DBP) - Between JUL-2012 and SEP-2012, Contaminant: Chlorine. Follow-up actions: St Formal NOV issued (MAY-22-2013), St Compliance achieved (2 times from AUG-28-2013 to OCT-02-2013)
Monitoring and Reporting (DBP) - Between JAN-2012 and DEC-2012, Contaminant: TTHM. Follow-up actions: St Violation/Reminder Notice (APR-23-2013), St Formal NOV issued (MAY-22-2013), St Compliance achieved (OCT-02-2013)
Monitoring and Reporting (DBP) - Between JAN-2012 and DEC-2012, Contaminant: Total Haloacetic Acids (HAA5). Follow-up actions: St Violation/Reminder Notice (APR-23-2013), St Formal NOV issued (MAY-22-2013), St Compliance achieved (OCT-02-2013)
2 routine major monitoring violations
24 other older monitoring violations
Address: 7340 N SADDLE RD Population served: 700, Groundwater):
Past health violations:
MCL, Average - Between APR-2014 and JUN-2014, Contaminant: Arsenic. Follow-up actions: St AO (w/o penalty) issued (DEC-11-2012)
MCL, Average - Between JAN-2014 and MAR-2014, Contaminant: Arsenic. Follow-up actions: St AO (w/o penalty) issued (DEC-11-2012)
MCL, Average - Between OCT-2013 and DEC-2013, Contaminant: Arsenic. Follow-up actions: St AO (w/o penalty) issued (DEC-11-2012)
MCL, Average - Between JUL-2013 and SEP-2013, Contaminant: Arsenic. Follow-up actions: St AO (w/o penalty) issued (DEC-11-2012), St Violation/Reminder Notice (DEC-02-2013)
MCL, Average - Between APR-2013 and JUN-2013, Contaminant: Arsenic. Follow-up actions: St AO (w/o penalty) issued (DEC-11-2012), St Violation/Reminder Notice (OCT-01-2013)
MCL, Average - Between JAN-2012 and MAR-2012, Contaminant: Nitrate. Follow-up actions: St Formal NOV issued (JUL-23-2012), St AO (w/o penalty) issued (DEC-11-2012), St Compliance achieved (FEB-05-2013)
Past monitoring violations:
Monitoring and Reporting (DBP) - Between APR-2013 and JUN-2013, Contaminant: Chlorine
Monitoring and Reporting (DBP) - Between JUL-2012 and SEP-2012, Contaminant: Chlorine. Follow-up actions: St Compliance achieved (MAR-15-2013)
Follow-up Or Routine LCR Tap M/R - In OCT-01-2008, Contaminant: Lead and Copper Rule. Follow-up actions: St Violation/Reminder Notice (FEB-11-2009), St Compliance achieved (JUL-07-2009)
Initial Tap Sampling for Pb and Cu - In JAN-01-2008, Contaminant: Lead and Copper Rule. Follow-up actions: St Compliance achieved (JUL-12-2011)
Follow-up Or Routine LCR Tap M/R - In OCT-01-2005, Contaminant: Lead and Copper Rule. Follow-up actions: St Compliance achieved (DEC-06-2006)
18 regular monitoring violations
4 other older monitoring violations
Address: 7501 E CIVIC CIR Population served: 288, Groundwater):
Past monitoring violations:
Monitoring and Reporting (DBP) - Between JAN-2008 and MAR-2008, Contaminant: Chlorine. Follow-up actions: St Compliance achieved (MAY-05-2008)
Monitoring and Reporting (DBP) - Between JUL-2006 and SEP-2006, Contaminant: Chlorine
Monitoring and Reporting (DBP) - Between JAN-2006 and MAR-2006, Contaminant: Chlorine. Follow-up actions: St Compliance achieved (MAY-12-2006)
Monitoring and Reporting (DBP) - Between JUL-2005 and SEP-2005, Contaminant: Chlorine. Follow-up actions: St Compliance achieved (DEC-06-2006)
Monitoring and Reporting (DBP) - Between APR-2005 and JUN-2005, Contaminant: Chlorine. Follow-up actions: St Compliance achieved (DEC-06-2006)
One routine major monitoring violation
3 other older monitoring violations
Population served: 130, Groundwater):
Past health violations:
MCL, Monthly (TCR) - In MAY-2011, Contaminant: Coliform. Follow-up actions: St Violation/Reminder Notice (JUN-29-2011), St Compliance achieved (AUG-12-2011)
Past monitoring violations:
3 routine major monitoring violations
Average household size: This town:
2.5 peopleArizona:
2.6 people
Percentage of family households: This town:
68.9%Whole state:
66.2%
Percentage of households with unmarried partners: This town:
7.5%Whole state:
7.8%
Likely homosexual households (counted as self-reported same-sex unmarried-partner households)
Lesbian couples: 0.4% of all households Gay men: 0.2% of all households
People in group quarters in Prescott Valley in 2010:
118 people in nursing facilities/skilled-nursing facilities
44 people in group homes intended for adults
33 people in hospitals with patients who have no usual home elsewhere
7 people in residential treatment centers for juveniles (non-correctional)
7 people in workers' group living quarters and job corps centers
People in group quarters in Prescott Valley in 2000:
131 people in nursing homes
40 people in other noninstitutional group quarters
23 people in other group homes
4 people in other nonhousehold living situations
Arena or stadium:
Tim's Toyota Center. Capacity: 5,264.
Banks with branches in Prescott Valley (2011 data):
JPMorgan Chase Bank, National Association: Prescott Valley Frys Banking Center, Highway 69 & Sundog Ranch Road Banki, Prescott Valley Branch. Info updated 2011/11/10: Bank assets: $1,811,678.0 mil, Deposits: $1,190,738.0 mil, headquarters in Columbus, OH, positive income , International Specialization, 5577 total offices , Holding Company: Jpmorgan Chase & Co.
Wells Fargo Bank, National Association: Prescott Valley Branch at 7520 E State Rte 69, branch established on 1971/06/28; Prescott Valley Center Branch at 7720 East Highway 69, branch established on 1997/07/16. Info updated 2011/04/05: Bank assets: $1,161,490.0 mil, Deposits: $905,653.0 mil, headquarters in Sioux Falls, SD, positive income , 6395 total offices , Holding Company: Wells Fargo & Company
National Bank of Arizona: Prescott Valley Branch at 2825 North Glasford Hill Road, branch established on 1995/12/04. Info updated 2008/09/11: Bank assets: $4,485.6 mil, Deposits: $3,731.3 mil, headquarters in Tucson, AZ, positive income , Commercial Lending Specialization, 73 total offices , Holding Company: Zions Bancorporation
BMO Harris Bank National Association: Prescott Valley Branch at 7221 East Floretine Road, branch established on 2005/11/30. Info updated 2011/07/14: Bank assets: $97,264.0 mil, Deposits: $75,624.6 mil, headquarters in Chicago, IL, positive income , 717 total offices , Holding Company: Bank Of Montreal
Bank of America, National Association: Prescott Valley Branch at 7490 East Highway 69, branch established on 1963/01/01. Info updated 2009/11/18: Bank assets: $1,451,969.3 mil, Deposits: $1,077,176.8 mil, headquarters in Charlotte, NC, positive income , 5782 total offices , Holding Company: Bank Of America Corporation
Compass Bank: Prescott Valley Branch at 7860 East Highway 69, Suite F-8, branch established on 1997/09/02. Info updated 2011/02/24: Bank assets: $63,107.0 mil, Deposits: $46,232.4 mil, headquarters in Birmingham, AL, negative income in the last year , Commercial Lending Specialization, 720 total offices , Holding Company: Banco Bilbao Vizcaya Argentaria, S.A.
Country Bank: Prescottvalley Branch at 3044 N Glassford Hill Road, branch established on 2006/10/16. Info updated 2006/11/03: Bank assets: $154.4 mil, Deposits: $137.2 mil, headquarters in Prescott, AZ, positive income , Commercial Lending Specialization, 4 total offices
Washington Federal: Prescott Valley at 5980 E 2nd St, branch established on 2008/10/14. Info updated 2011/12/19: Bank assets: $13,653.0 mil, Deposits: $8,905.8 mil, headquarters in Seattle, WA, positive income , Mortgage Lending Specialization, 174 total offices
For population 15 years and over in Prescott Valley:
Never married: 23.1%Now married: 55.2%Separated: 1.1%Widowed: 6.8%Divorced: 13.9% For population 25 years and over in Prescott Valley:
High school or higher: 91.0%Bachelor's degree or higher: 22.5%Graduate or professional degree: 9.0%Unemployed: 5.0%Mean travel time to work (commute): 18.5 minutes
Education Gini index (Inequality in education) Here:
10.0Arizona average:
12.2
Religion statistics for Prescott Valley, AZ (based on Yavapai County data)
Religion Adherents Congregations Evangelical Protestant 22,957 156 Catholic 16,500 14 Other 10,740 47 Mainline Protestant 4,525 22 Orthodox 100 1 None 156,211 -
Source: Clifford Grammich, Kirk Hadaway, Richard Houseal, Dale E.Jones, Alexei Krindatch, Richie Stanley and Richard H.Taylor. 2012. 2010 U.S.Religion Census: Religious Congregations & Membership Study. Association of Statisticians of American Religious Bodies. Jones, Dale E., et al. 2002. Congregations and Membership in the United States 2000. Nashville, TN: Glenmary Research Center. Graphs represent county-level data
Food Environment Statistics: Number of grocery stores : 41Yavapai County :
1.93 / 10,000 pop.Arizona :
1.36 / 10,000 pop.
Number of supercenters and club stores : 3This county :
0.14 / 10,000 pop.Arizona :
0.14 / 10,000 pop.
Number of convenience stores (no gas) : 12Here :
0.57 / 10,000 pop.State :
0.55 / 10,000 pop.
Number of convenience stores (with gas) : 69Yavapai County :
3.25 / 10,000 pop.Arizona :
2.47 / 10,000 pop.
Number of full-service restaurants : 216This county :
10.18 / 10,000 pop.Arizona :
6.21 / 10,000 pop.
Adult diabetes rate : This county :
7.5%State :
8.0%
Adult obesity rate : This county :
17.7%State :
22.8%
Low-income preschool obesity rate : This county :
10.4%Arizona :
14.2%
Health and Nutrition:
Average overall health of teeth and gums : Prescott Valley:
45.7%State:
47.3%
Average BMI : This city:
28.7Arizona:
28.5
People feeling badly about themselves : Prescott Valley:
21.4%Arizona:
20.8%
People not drinking alcohol at all : Average hours sleeping at night : Prescott Valley:
6.9State:
6.8
General health condition : Average condition of hearing : More about Health and Nutrition of Prescott Valley, AZ Residents
Local government employment and payroll (March 2022)
Function
Full-time employees
Monthly full-time payroll
Average yearly full-time wage
Part-time employees
Monthly part-time payroll
Police Protection - Officers
80 $515,534 $77,330 0 $0 Other and Unallocable
24 $126,788 $63,394 0 $0 Streets and Highways
23 $122,262 $63,789 0 $0 Police - Other
22 $89,497 $48,817 1 $2,223 Parks and Recreation
20 $77,206 $46,324 11 $6,736 Other Government Administration
14 $102,699 $88,028 8 $6,817 Local Libraries
14 $57,921 $49,647 8 $12,874 Financial Administration
13 $77,210 $71,271 0 $0 Water Supply
12 $68,335 $68,335 0 $0 Judicial and Legal
11 $75,879 $82,777 1 $1,962 Housing and Community Development (Local)
7 $32,971 $56,522 1 $3,485
Totals for Government
240 $1,346,301 $67,315 30 $34,097
Prescott Valley government finances - Expenditure in 2021 (per resident):
Construction - Parks and Recreation: $17,400,000 ($354.56)
General - Other: $5,832,000 ($118.84)Water Utilities: $1,156,000 ($23.56)Regular Highways: $488,000 ($9.94)Current Operations - Police Protection: $14,349,000 ($292.39)
Water Utilities: $6,736,000 ($137.26)General - Other: $6,581,000 ($134.10)Parks and Recreation: $6,395,000 ($130.31)Regular Highways: $5,444,000 ($110.93)Sewerage: $4,043,000 ($82.38)Financial Administration: $2,456,000 ($50.05)Central Staff Services: $2,373,000 ($48.35)Libraries: $2,154,000 ($43.89)Judicial and Legal Services: $1,580,000 ($32.20)Protective Inspection and Regulation - Other: $869,000 ($17.71)General Public Buildings: $590,000 ($12.02)Miscellaneous Commercial Activities - Other: $166,000 ($3.38)General - Interest on Debt: $2,195,000 ($44.73)
Other Capital Outlay - Sewerage: $531,000 ($10.82)
Water Utilities: $284,000 ($5.79)Water Utilities - Interest on Debt: $168,000 ($3.42)
Prescott Valley government finances - Revenue in 2021 (per resident):
Charges - Sewerage: $6,021,000 ($122.69)
Parks and Recreation: $1,934,000 ($39.41)Other: $260,000 ($5.30)Regular Highways: $8,000 ($0.16)Federal Intergovernmental - Other: $730,000 ($14.88)
Miscellaneous - Special Assessments: $5,994,000 ($122.14)
Interest Earnings: $668,000 ($13.61)Fines and Forfeits: $660,000 ($13.45)Rents: $382,000 ($7.78)General Revenue - Other: $338,000 ($6.89)Donations From Private Sources: $240,000 ($4.89)Revenue - Water Utilities: $10,206,000 ($207.97)
State Intergovernmental - General Local Government Support: $13,830,000 ($281.81)
Highways: $4,012,000 ($81.75)Other: $2,863,000 ($58.34)Tax - General Sales and Gross Receipts: $28,460,000 ($579.93)
Property: $2,059,000 ($41.96)Other License: $1,490,000 ($30.36)Public Utilities Sales: $429,000 ($8.74)Alcoholic Beverage License: $193,000 ($3.93)
Prescott Valley government finances - Debt in 2021 (per resident):
Long Term Debt - Beginning Outstanding - Unspecified Public Purpose: $67,035,000 ($1365.97)
Outstanding Unspecified Public Purpose: $59,441,000 ($1211.23)Retired Unspecified Public Purpose: $7,594,000 ($154.74)
Prescott Valley government finances - Cash and Securities in 2021 (per resident):
Bond Funds - Cash and Securities: $4,333,000 ($88.29)
Other Funds - Cash and Securities: $78,455,000 ($1598.68)
Sinking Funds - Cash and Securities: $6,125,000 ($124.81)
Businesses in Prescott Valley, AZ
Name Count Name Count
Ace Hardware 1 Kohl's 1 Albertsons 1 Kroger 1 Arby's 1 La-Z-Boy 1 AutoZone 1 Little Caesars Pizza 2 Baja Fresh Mexican Grill 1 McDonald's 1 Baskin-Robbins 1 Panda Express 1 Big O Tires 1 Papa John's Pizza 1 Buffalo Wild Wings 1 Penske 1 Burger King 1 Pizza Hut 1 CVS 1 Quiznos 1 Circle K 2 RadioShack 1 Comfort Suites 1 SONIC Drive-In 1 Cracker Barrel 1 Safeway 1 Curves 1 Sam's Club 1 Dairy Queen 1 Sprint Nextel 1 Days Inn 1 Starbucks 2 Dennys 1 Super 8 1 FedEx 3 T-Mobile 1 GNC 1 Taco Bell 1 H&R Block 1 The Room Place 1 Hobby Lobby 1 U-Haul 6 Home Depot 1 UPS 5 IHOP 1 Verizon Wireless 2 Jones New York 2 Vons 1 KFC 1 Walgreens 1 Kmart 1 Wendy's 1
Strongest AM radio stations in Prescott Valley:
KQNA (1130 AM; daytime; 1 kW; PRESCOTT VALLEY, AZ; Owner: PRESCOTT VALLEY BROADCASTING CO. INC)
KMIA (710 AM; 50 kW; BLACK CANYON CITY, AZ; Owner: ENTRAVISION HOLDINGS, LLC)
KFNX (1100 AM; 50 kW; CAVE CREEK, AZ; Owner: NORTH AMERICAN BROADCASTING CO., INC.)
KNOT (1450 AM; 1 kW; PRESCOTT, AZ; Owner: PAYNE-PRESCOTT BROADCASTING COMPANY)
KYCA (1490 AM; 1 kW; PRESCOTT, AZ; Owner: SOUTHWEST BROADCASTING CO.)
KPXQ (1360 AM; 50 kW; GLENDALE, AZ; Owner: COMMON GROUND BROADCASTING, INC.)
KAZM (780 AM; 5 kW; SEDONA, AZ; Owner: TABBACK BROADCASTING CO.)
KMIK (1580 AM; 50 kW; TEMPE, AZ; Owner: ABC, INC.)
KYET (1180 AM; 10 kW; WILLIAMS, AZ; Owner: GRAND CANYON GATEWAY BROADCASTING, LLC)
KFNN (1510 AM; 22 kW; MESA, AZ; Owner: CRC BROADCASTING COMPANY, INC.)
KXEM (1010 AM; 15 kW; TOLLESON, AZ; Owner: JAMES CRYSTAL ENTERPRISES OF PHOENIX, INC.)
KFLT (830 AM; 50 kW; TUCSON, AZ; Owner: FAMILY LIFE B/CING SYSTEM, INC.)
KDWN (720 AM; 50 kW; LAS VEGAS, NV; Owner: RADIO NEVADA CORP.)
Strongest FM radio stations in Prescott Valley:
KAHM (102.1 FM; PRESCOTT, AZ; Owner: SOUTHWEST FM BROADCASTING CO., INC.)
K201CQ (88.1 FM; PRESCOTT, AZ; Owner: FAMILY STATIONS, INC.)
KVRD-FM (105.7 FM; COTTONWOOD, AZ; Owner: YAVAPAI BROADCASTING CORPORATION)
KKLD (98.3 FM; PRESCOTT VALLEY, AZ; Owner: W. GRANT HAFLEY)
KGCB (90.9 FM; PRESCOTT, AZ; Owner: GRAND CANYON BROADCASTERS, INC.)
KZGL (95.9 FM; COTTONWOOD, AZ; Owner: YAVAPAI BROADCASTING CORPORATION)
KNOT-FM (99.1 FM; PRESCOTT, AZ; Owner: PAYNE-PRESCOTT BROADCASTING COMPANY)
K246AA (97.1 FM; PRESCOTT, AZ; Owner: LERNER FILM & TAPE PROD., INC.)
KPPV (106.7 FM; PRESCOTT VALLEY, AZ; Owner: PRESCOTT VALLEY BROADCASTING CO. INC)
KNAQ (89.3 FM; PRESCOTT, AZ; Owner: NORTHERN ARIZONA UNIVERSITY)
K223AG (92.5 FM; PRESCOTT, AZ; Owner: LERNER FILM & TAPE PROD., INC.)
K207BR (89.3 FM; PRESCOTT, AZ; Owner: NORTHERN ARIZONA UNIVERSITY)
K220GI (91.9 FM; CAMP VERDE, AZ; Owner: CALVARY CHAPEL OF TWIN FALLS, INC.)
KWMX (96.7 FM; WILLIAMS, AZ; Owner: RED ROCK COMMUNICATIONS II, LTD.)
KJZA (89.5 FM; DRAKE, AZ; Owner: ST. PAUL BIBLE COLLEGE)
KHOV-FM (105.3 FM; WICKENBURG, AZ; Owner: HBC LICENSE CORPORATION)
KWMX-FM1 (96.7 FM; FLAGSTAFF, AZ; Owner: RED ROCK COMMUNICATIONS II, LTD.)
KFLX (105.1 FM; KACHINA VILLAGE, AZ; Owner: RED ROCK COMMUNICATIONS, LTD)
KSWG (94.1 FM; WICKENBURG, AZ; Owner: CIRCLE S BROADCASTING CO., INC.)
K265DN (100.9 FM; FLAGSTAFF, AZ; Owner: FAMILY LIFE BROADCASTING, INC.)
TV broadcast stations around Prescott Valley:
K14HC (Channel 14; PRESCOTT, AZ; Owner: FOX TELEVISION STATIONS, INC.)
K34EE (Channel 34; PRESCOTT/COTTONWOOD, AZ; Owner: KTVK, INC.)
KAZT-TV (Channel 7; PRESCOTT, AZ; Owner: KAZT, L.L.C.)
K16BP (Channel 16; COTTONWOOD, AZ; Owner: FOX TELEVISION STATIONS, INC.)
K58AV (Channel 58; COTTONWOOD, AZ; Owner: TRINITY BROADCASTING OF ARIZONA, INC.)
K18DD (Channel 18; CAMP VERDE, AZ; Owner: CENTRAL STATES COMMUNICATIONS)
Home Mortgage Disclosure Act Aggregated Statistics For Year 2009(Based on 1 full and 3 partial tracts) A) FHA, FSA/RHS & VA B) Conventional C) Refinancings D) Home Improvement Loans F) Non-occupant Loans on G) Loans On Manufactured Number Average Value Number Average Value Number Average Value Number Average Value Number Average Value Number Average Value
LOANS ORIGINATED 177 $140,269 169 $129,839 554 $149,833 10 $66,241 115 $142,014 63 $88,907 APPLICATIONS APPROVED, NOT ACCEPTED 5 $164,972 17 $125,814 64 $144,714 1 $128,570 19 $165,623 12 $69,331 APPLICATIONS DENIED 43 $139,759 36 $159,288 278 $164,986 14 $66,566 46 $164,374 31 $74,426 APPLICATIONS WITHDRAWN 30 $123,225 25 $131,662 146 $155,033 4 $156,405 20 $140,656 20 $78,346 FILES CLOSED FOR INCOMPLETENESS 7 $126,361 3 $182,860 39 $167,931 5 $97,430 5 $186,804 6 $95,470
Aggregated Statistics For Year 2008(Based on 1 full and 3 partial tracts) A) FHA, FSA/RHS & VA B) Conventional C) Refinancings D) Home Improvement Loans E) Loans on Dwellings For 5+ Families F) Non-occupant Loans on G) Loans On Manufactured Number Average Value Number Average Value Number Average Value Number Average Value Number Average Value Number Average Value Number Average Value
LOANS ORIGINATED 145 $161,477 214 $162,401 476 $159,966 46 $108,714 0 $0 114 $165,392 98 $98,135 APPLICATIONS APPROVED, NOT ACCEPTED 5 $182,774 29 $163,222 77 $167,447 9 $105,708 0 $0 19 $193,608 11 $84,124 APPLICATIONS DENIED 39 $164,851 71 $168,433 360 $173,777 58 $111,243 0 $0 65 $163,421 73 $86,808 APPLICATIONS WITHDRAWN 28 $166,075 31 $147,631 160 $168,613 16 $95,266 1 $155,360 24 $136,420 27 $89,736 FILES CLOSED FOR INCOMPLETENESS 1 $112,730 2 $165,960 73 $171,124 8 $61,719 0 $0 5 $108,766 12 $78,351
Aggregated Statistics For Year 2007(Based on 1 full and 3 partial tracts) A) FHA, FSA/RHS & VA B) Conventional C) Refinancings D) Home Improvement Loans F) Non-occupant Loans on G) Loans On Manufactured Number Average Value Number Average Value Number Average Value Number Average Value Number Average Value Number Average Value
LOANS ORIGINATED 64 $177,659 528 $173,952 791 $162,369 87 $113,710 260 $166,911 129 $99,112 APPLICATIONS APPROVED, NOT ACCEPTED 2 $66,610 81 $166,866 175 $170,745 23 $110,235 48 $188,153 19 $101,558 APPLICATIONS DENIED 21 $168,560 123 $175,632 583 $172,203 122 $93,962 74 $185,453 97 $94,207 APPLICATIONS WITHDRAWN 10 $131,759 52 $163,637 265 $176,268 34 $126,562 34 $175,693 31 $101,918 FILES CLOSED FOR INCOMPLETENESS 1 $79,110 9 $200,384 108 $199,341 20 $119,322 8 $162,570 7 $89,219
Aggregated Statistics For Year 2006(Based on 1 full and 3 partial tracts) A) FHA, FSA/RHS & VA B) Conventional C) Refinancings D) Home Improvement Loans F) Non-occupant Loans on G) Loans On Manufactured Number Average Value Number Average Value Number Average Value Number Average Value Number Average Value Number Average Value
LOANS ORIGINATED 63 $168,918 1,119 $168,736 1,136 $162,063 131 $87,775 454 $179,029 148 $103,383 APPLICATIONS APPROVED, NOT ACCEPTED 6 $157,995 176 $172,824 190 $164,415 30 $106,405 58 $181,670 26 $103,281 APPLICATIONS DENIED 8 $184,932 283 $175,042 619 $152,175 122 $91,741 96 $189,690 113 $93,117 APPLICATIONS WITHDRAWN 12 $150,388 170 $160,798 431 $162,366 34 $107,333 50 $173,738 33 $108,676 FILES CLOSED FOR INCOMPLETENESS 0 $0 38 $166,357 139 $178,536 6 $128,107 12 $191,197 3 $127,113
Aggregated Statistics For Year 2005(Based on 1 full and 3 partial tracts) A) FHA, FSA/RHS & VA B) Conventional C) Refinancings D) Home Improvement Loans E) Loans on Dwellings For 5+ Families F) Non-occupant Loans on G) Loans On Manufactured Number Average Value Number Average Value Number Average Value Number Average Value Number Average Value Number Average Value Number Average Value
LOANS ORIGINATED 43 $150,507 1,316 $149,147 1,189 $137,822 139 $103,650 0 $0 593 $158,545 136 $84,824 APPLICATIONS APPROVED, NOT ACCEPTED 3 $142,113 163 $147,152 171 $124,241 22 $70,948 0 $0 55 $155,117 23 $84,539 APPLICATIONS DENIED 9 $126,581 249 $148,792 675 $127,645 120 $66,088 1 $204,150 93 $157,000 106 $81,049 APPLICATIONS WITHDRAWN 9 $138,640 165 $137,406 391 $143,397 58 $116,728 1 $148,620 76 $145,234 33 $92,587 FILES CLOSED FOR INCOMPLETENESS 0 $0 43 $151,556 290 $145,618 5 $102,384 0 $0 14 $139,699 19 $100,547
Aggregated Statistics For Year 2004(Based on 1 full and 3 partial tracts) A) FHA, FSA/RHS & VA B) Conventional C) Refinancings D) Home Improvement Loans E) Loans on Dwellings For 5+ Families F) Non-occupant Loans on G) Loans On Manufactured Number Average Value Number Average Value Number Average Value Number Average Value Number Average Value Number Average Value Number Average Value
LOANS ORIGINATED 76 $136,091 1,244 $122,033 875 $111,152 82 $53,957 1 $201,100 524 $124,482 98 $78,414 APPLICATIONS APPROVED, NOT ACCEPTED 5 $117,444 119 $126,556 169 $107,541 16 $47,558 0 $0 48 $131,971 24 $73,188 APPLICATIONS DENIED 14 $124,604 184 $107,185 615 $105,118 101 $56,651 0 $0 67 $114,519 110 $72,151 APPLICATIONS WITHDRAWN 6 $145,075 155 $123,387 417 $111,390 36 $55,244 0 $0 74 $128,398 32 $69,387 FILES CLOSED FOR INCOMPLETENESS 2 $73,900 33 $120,809 267 $115,610 5 $27,760 0 $0 24 $97,125 27 $73,534
Detailed HMDA statistics for the following Tracts:
0005.00
, 0006.01 , 0006.02 , 0006.03
Private Mortgage Insurance Companies Aggregated Statistics For Year 2009(Based on 1 full and 3 partial tracts) A) Conventional B) Refinancings C) Non-occupant Loans on Number Average Value Number Average Value Number Average Value
LOANS ORIGINATED 17 $153,228 10 $192,746 1 $282,010 APPLICATIONS APPROVED, NOT ACCEPTED 4 $140,775 7 $198,246 1 $143,100 APPLICATIONS DENIED 2 $187,445 4 $145,312 0 $0 APPLICATIONS WITHDRAWN 1 $217,840 2 $96,360 0 $0 FILES CLOSED FOR INCOMPLETENESS 1 $159,170 0 $0 0 $0
Aggregated Statistics For Year 2008(Based on 1 full and 3 partial tracts) A) Conventional B) Refinancings C) Non-occupant Loans on D) Loans On Manufactured Number Average Value Number Average Value Number Average Value Number Average Value
LOANS ORIGINATED 52 $186,244 36 $200,089 11 $160,335 3 $112,463 APPLICATIONS APPROVED, NOT ACCEPTED 15 $185,646 20 $230,436 8 $193,108 2 $58,820 APPLICATIONS DENIED 6 $191,347 3 $275,023 1 $244,980 0 $0 APPLICATIONS WITHDRAWN 0 $0 4 $173,280 1 $186,180 0 $0 FILES CLOSED FOR INCOMPLETENESS 0 $0 0 $0 0 $0 0 $0
Aggregated Statistics For Year 2007(Based on 1 full and 3 partial tracts) A) Conventional B) Refinancings C) Non-occupant Loans on D) Loans On Manufactured Number Average Value Number Average Value Number Average Value Number Average Value
LOANS ORIGINATED 100 $201,310 55 $223,757 16 $202,329 4 $77,765 APPLICATIONS APPROVED, NOT ACCEPTED 10 $210,941 15 $264,974 3 $252,870 1 $162,980 APPLICATIONS DENIED 8 $149,732 2 $177,610 2 $160,120 4 $101,982 APPLICATIONS WITHDRAWN 7 $177,033 4 $265,682 0 $0 0 $0 FILES CLOSED FOR INCOMPLETENESS 0 $0 0 $0 0 $0 0 $0
Aggregated Statistics For Year 2006(Based on 1 full and 3 partial tracts) A) Conventional B) Refinancings C) Non-occupant Loans on D) Loans On Manufactured Number Average Value Number Average Value Number Average Value Number Average Value
LOANS ORIGINATED 89 $207,378 38 $217,977 15 $184,749 8 $115,335 APPLICATIONS APPROVED, NOT ACCEPTED 11 $196,627 13 $200,473 2 $150,605 3 $93,120 APPLICATIONS DENIED 4 $203,690 1 $196,340 0 $0 2 $123,875 APPLICATIONS WITHDRAWN 4 $224,582 5 $189,152 3 $169,397 0 $0 FILES CLOSED FOR INCOMPLETENESS 1 $248,710 0 $0 0 $0 0 $0
Aggregated Statistics For Year 2005(Based on 1 full and 3 partial tracts) A) Conventional B) Refinancings C) Non-occupant Loans on D) Loans On Manufactured Number Average Value Number Average Value Number Average Value Number Average Value
LOANS ORIGINATED 106 $171,946 44 $151,816 36 $178,962 14 $84,686 APPLICATIONS APPROVED, NOT ACCEPTED 17 $175,141 9 $179,343 7 $196,016 0 $0 APPLICATIONS DENIED 3 $87,810 1 $69,730 0 $0 3 $87,810 APPLICATIONS WITHDRAWN 5 $198,570 3 $125,567 3 $188,117 0 $0 FILES CLOSED FOR INCOMPLETENESS 0 $0 0 $0 0 $0 0 $0
Aggregated Statistics For Year 2004(Based on 1 full and 3 partial tracts) A) Conventional B) Refinancings C) Non-occupant Loans on D) Loans On Manufactured Number Average Value Number Average Value Number Average Value Number Average Value
LOANS ORIGINATED 206 $138,679 76 $122,114 52 $135,733 14 $84,410 APPLICATIONS APPROVED, NOT ACCEPTED 29 $148,333 17 $130,727 15 $147,189 1 $74,340 APPLICATIONS DENIED 3 $174,373 1 $90,640 2 $161,005 0 $0 APPLICATIONS WITHDRAWN 9 $160,021 2 $143,435 4 $139,200 0 $0 FILES CLOSED FOR INCOMPLETENESS 1 $246,100 0 $0 1 $73,800 0 $0
Detailed PMIC statistics for the following Tracts:
0005.00
, 0006.01 , 0006.02 , 0006.03 Fire-safe hotels and motels in Prescott Valley, Arizona:
Americas Best Value Inn, 8383 E State Rt 69, Prescott Valley, Arizona 86314 Phone: (928) 772-2200, Fax: (928) 772-7293
Hampton Inn & Suites Prescott Valley, 2901 Glassford Hls, Prescott Valley, Arizona 86314 Phone: (928) 772-1800, Fax: (928) 772-8437
Comfort Suites, 2601 N Crownpointe Dr, Prescott Valley, Arizona 86314 Phone: (928) 771-2100, Fax: (928) 771-2228
All 3 fire-safe hotels and motels in Prescott Valley, Arizona
Most common first names in Prescott Valley, AZ among deceased individuals Name Count Lived (average)
Robert 99 72.9 years John 93 73.8 years James 75 74.4 years William 74 73.5 years Mary 66 79.1 years Charles 62 71.9 years Richard 51 68.9 years George 42 76.5 years Donald 42 72.7 years Dorothy 39 80.7 years
Most common last names in Prescott Valley, AZ among deceased individuals Last name Count Lived (average)
Smith 36 73.2 years Jones 19 73.7 years Johnson 17 75.6 years Miller 16 75.7 years Walker 15 72.7 years Brown 15 74.5 years White 15 77.4 years Thompson 13 73.4 years Williams 12 78.1 years Taylor 12 77.3 years
Prescott Valley compared to Arizona state average:
Unemployed percentage below state average. Black race population percentage significantly below state average. Median age above state average. Length of stay since moving in significantly above state average. House age below state average. Prescott Valley on our top lists :
#30 on the list of "Top 101 cities with the most residents born in Other Southern Africa (population 500+)"
#43 on the list of "Top 101 cities with largest percentage of females in occupations: installation, maintenance, and repair occupations (population 5,000+)"
#67 on the list of "Top 101 cities with the most local government spending on highway construction per resident (population 10,000+)"
#69 on the list of "Top 101 cities with largest percentage of females in occupations: transportation occupations (population 5,000+)"
#16 on the list of "Top 101 counties with the lowest Particulate Matter (PM2.5 ) Annual air pollution readings in 2012 (µg/m3 )"
#20 on the list of "Top 101 counties with the lowest number of births per 1000 residents 2007-2013"
#45 on the list of "Top 101 counties with the lowest Particulate Matter (PM10 ) Annual air pollution readings in 2012 (µg/m3 )"
#68 on the list of "Top 101 counties with the highest Ozone (1-hour) air pollution readings in 2012 (ppm)"
#76 on the list of "Top 101 counties with the highest number of deaths per 1000 residents 2007-2013 (pop. 50,000+)"
Top Patent Applicants
Jan Allen Hinshaw (16)
Timothy C. Haynes (8)
James Mcgarry (6)
Bill Elmer Richardson (5)
Gregory E. Young (4)
Yan C. Huang (4)
David Viscio (4)
David B. Viscio (3)
William F. Baty (3)
Kevin C. Payne (3)
Total of 76 patent applications in 2008-2024.


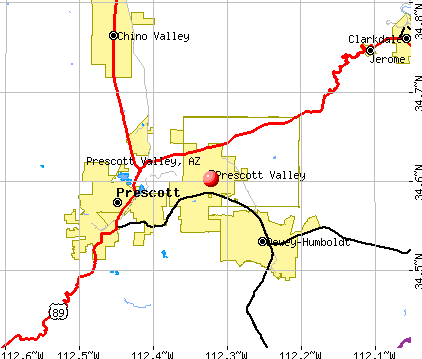


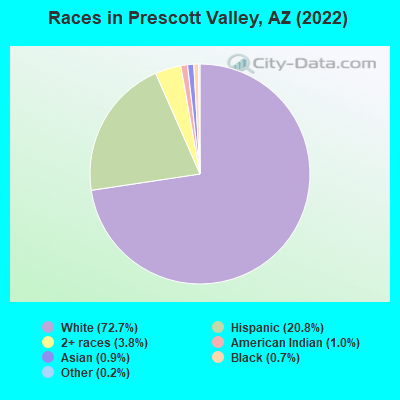
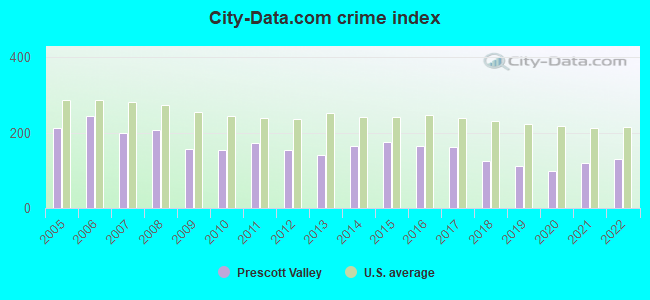
 Recent articles from our blog. Our writers, many of them Ph.D. graduates or candidates, create easy-to-read articles on a wide variety of topics.

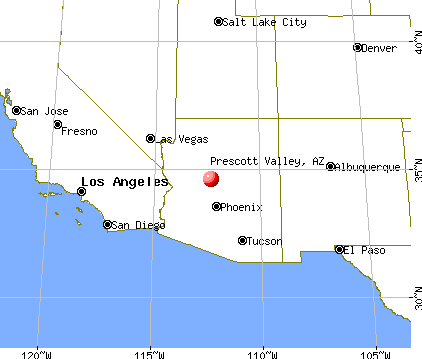
 (56.9 miles
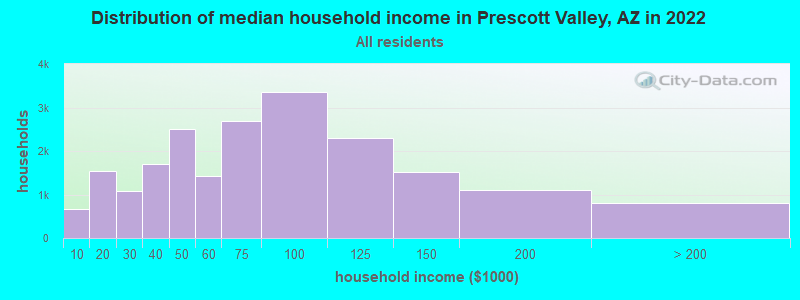
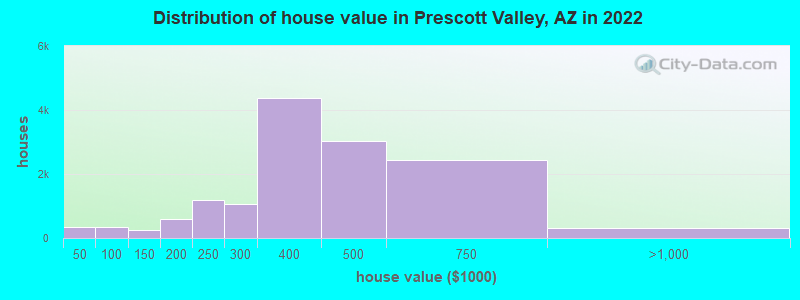
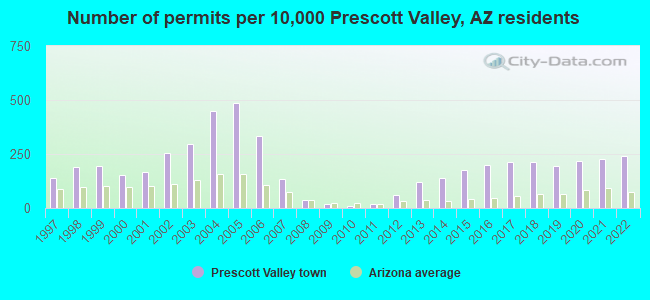
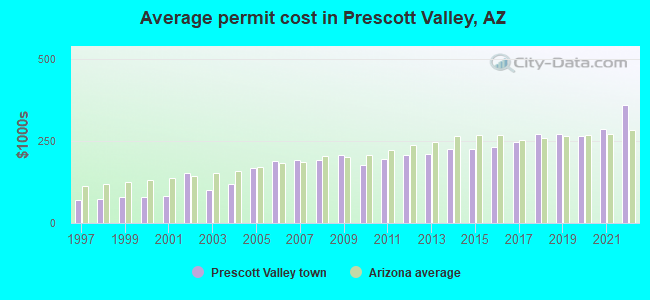
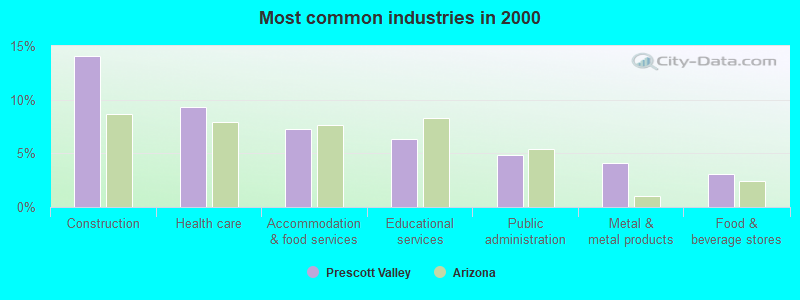
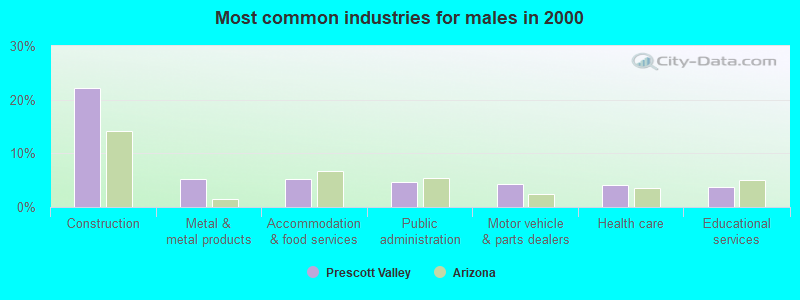
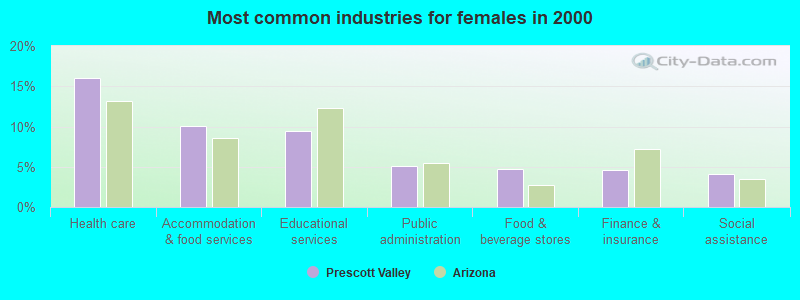
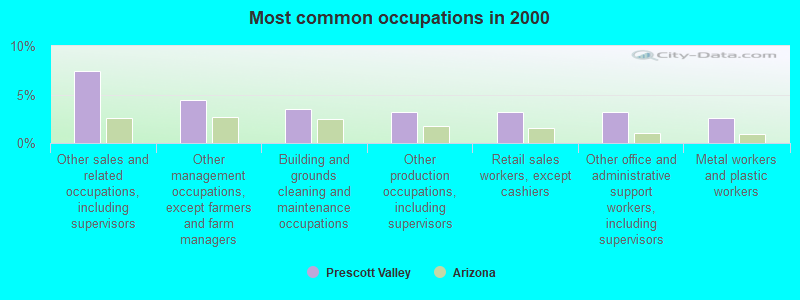
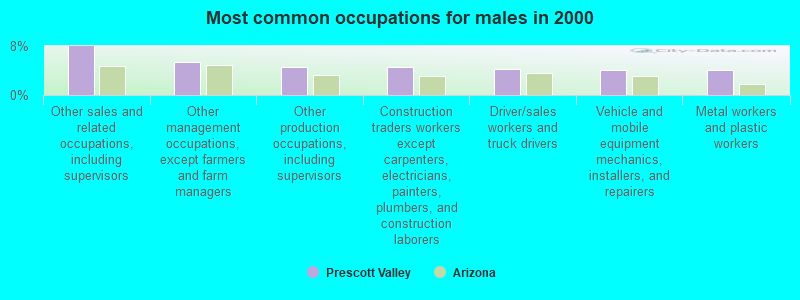
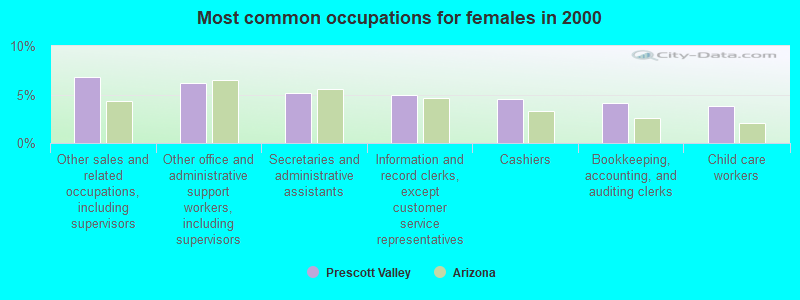
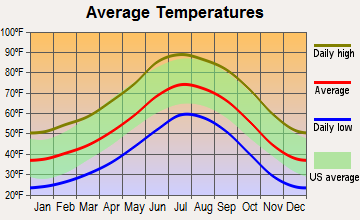
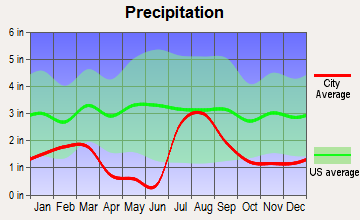
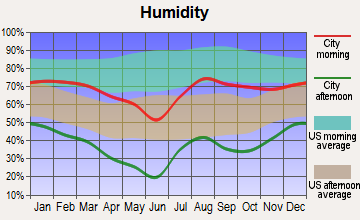
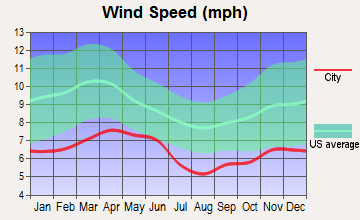
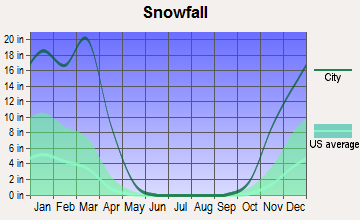

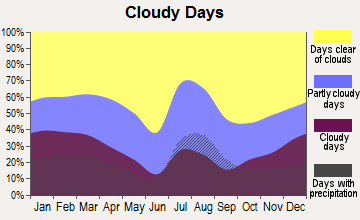
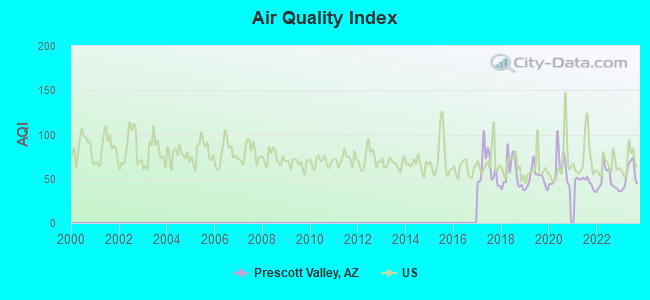
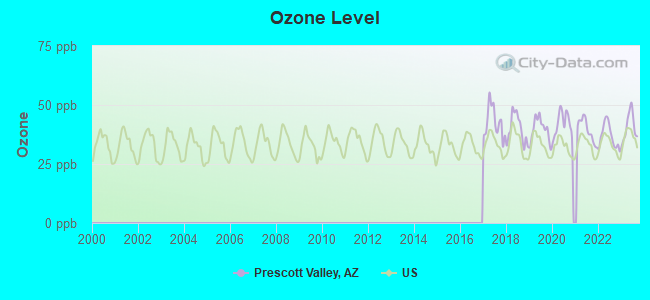
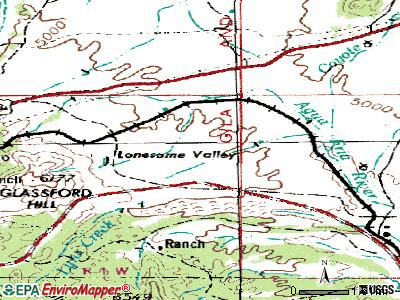
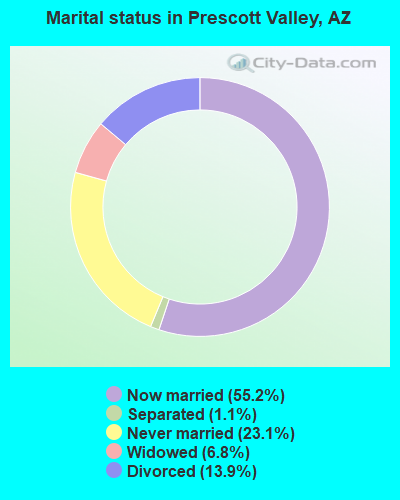
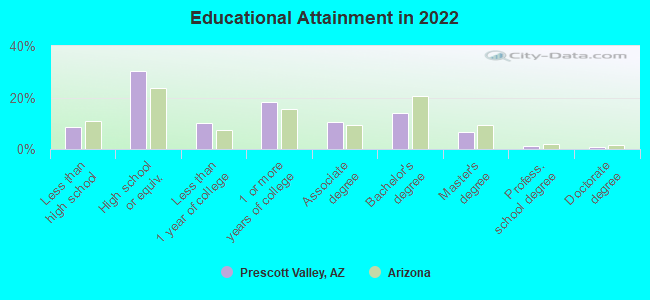
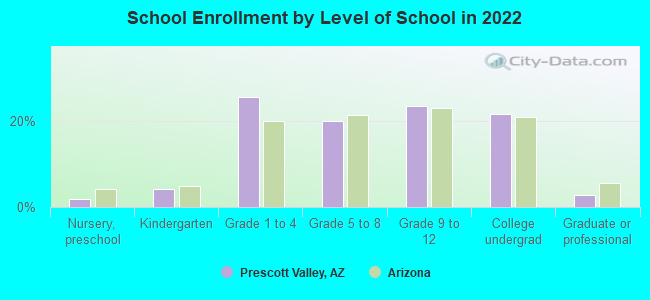
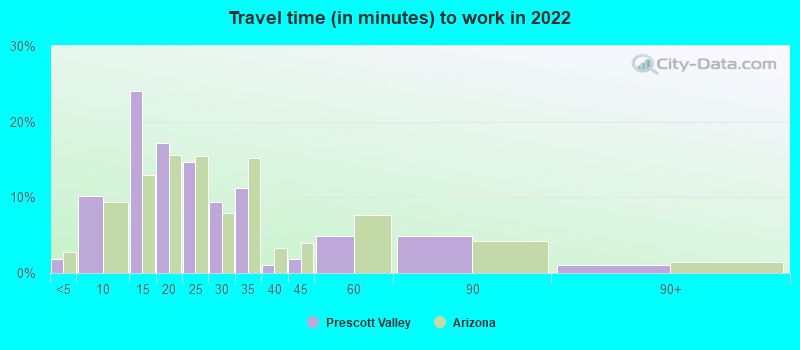
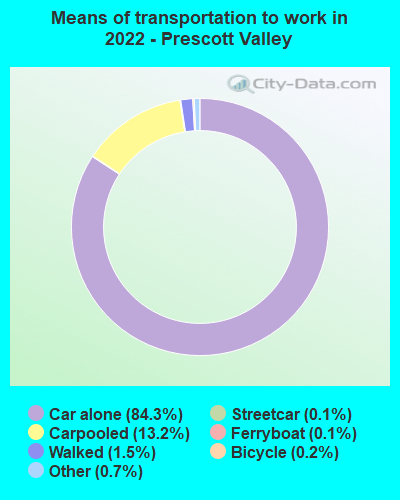
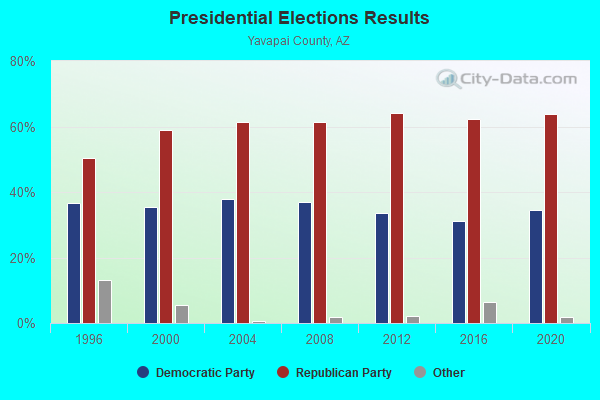
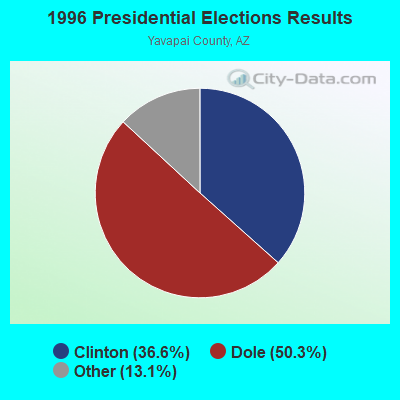
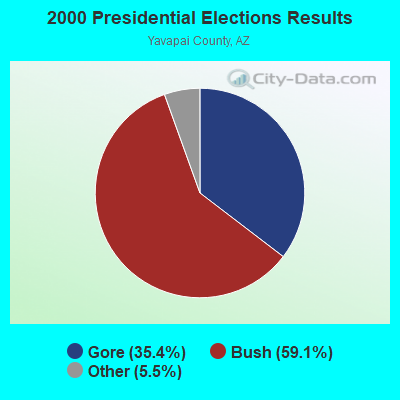
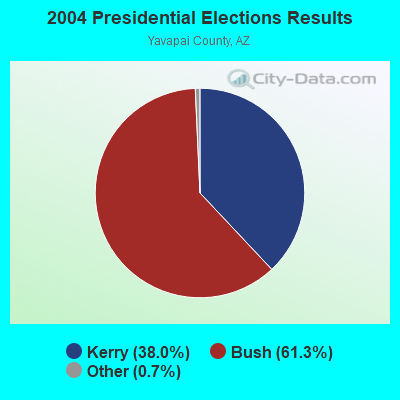
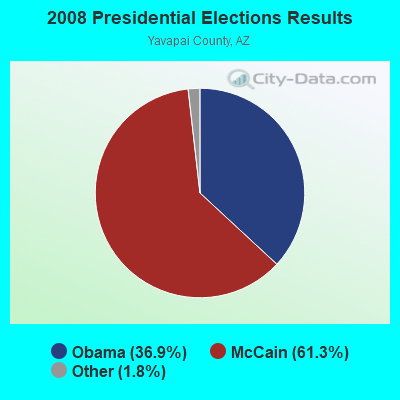

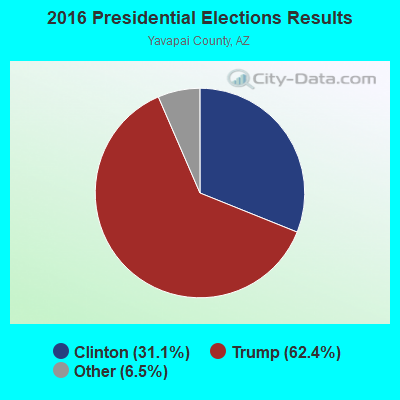
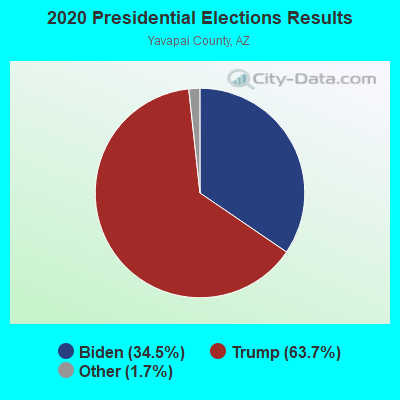
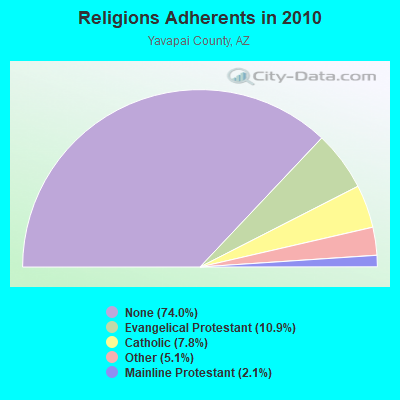
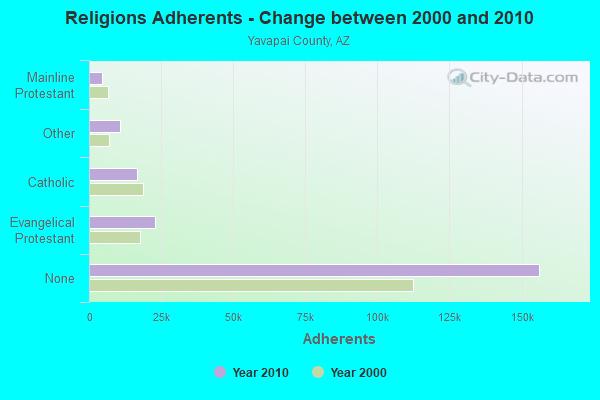
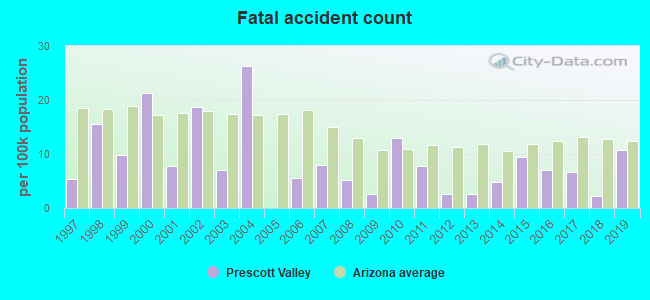
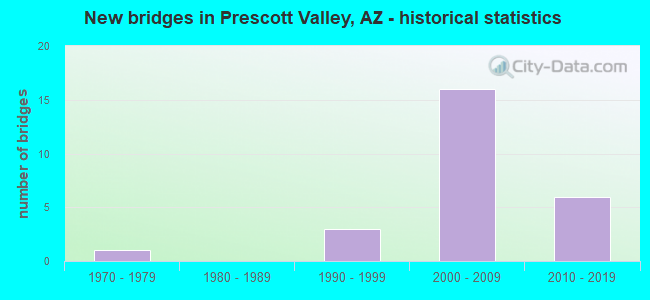
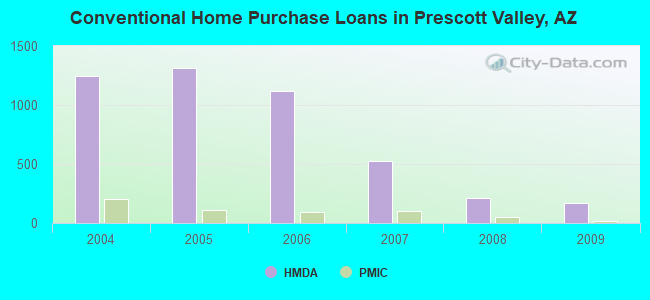
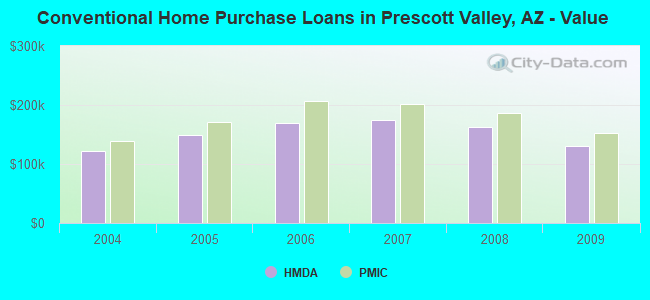
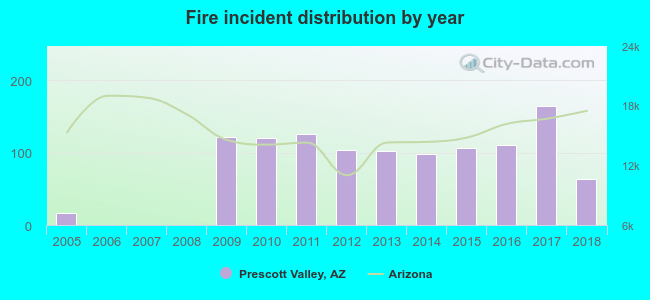 According to the data from the years 2005 - 2018 the average number of fires per year is 81. The highest number of fire incidents - 165 took place in 2017, and the least - 0 in 2006. The data has a rising trend.
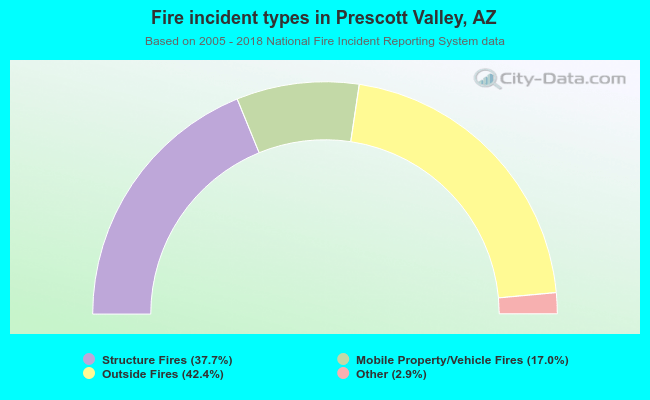 When looking into fire subcategories, the most reports belonged to: Outside Fires (42.4%), and Structure Fires (37.7%).