Pullman, Washington Submit your own pictures of this city and show them to the world
OSM Map
General Map
Google Map
MSN Map
OSM Map
General Map
Google Map
MSN Map
OSM Map
General Map
Google Map
MSN Map
OSM Map
General Map
Google Map
MSN Map
Please wait while loading the map...
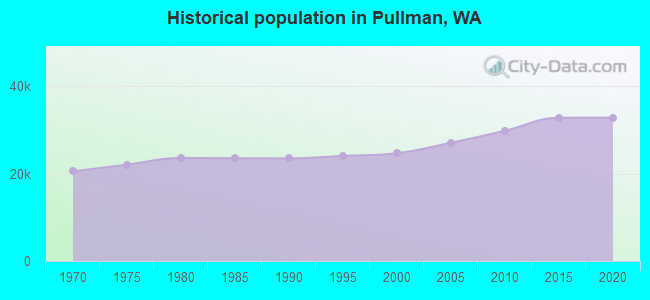
Population in 2022: 32,508 (100% urban, 0% rural). Population change since 2000: +31.7%Males: 16,550 Females: 15,958
March 2022 cost of living index in Pullman: 95.8 (near average, U.S. average is 100) Percentage of residents living in poverty in 2022: 32.4%for White Non-Hispanic residents , 48.1% for Black residents , 24.4% for Hispanic or Latino residents , 76.8% for American Indian residents , 100.0% for Native Hawaiian and other Pacific Islander residents , 29.9% for other race residents , 19.5% for two or more races residents )
Profiles of local businesses
Business Search - 14 Million verified businesses
Data:
Median household income ($)
Median household income (% change since 2000)
Household income diversity
Ratio of average income to average house value (%)
Ratio of average income to average rent
Median household income ($) - White
Median household income ($) - Black or African American
Median household income ($) - Asian
Median household income ($) - Hispanic or Latino
Median household income ($) - American Indian and Alaska Native
Median household income ($) - Multirace
Median household income ($) - Other Race
Median household income for houses/condos with a mortgage ($)
Median household income for apartments without a mortgage ($)
Races - White alone (%)
Races - White alone (% change since 2000)
Races - Black alone (%)
Races - Black alone (% change since 2000)
Races - American Indian alone (%)
Races - American Indian alone (% change since 2000)
Races - Asian alone (%)
Races - Asian alone (% change since 2000)
Races - Hispanic (%)
Races - Hispanic (% change since 2000)
Races - Native Hawaiian and Other Pacific Islander alone (%)
Races - Native Hawaiian and Other Pacific Islander alone (% change since 2000)
Races - Two or more races (%)
Races - Two or more races (% change since 2000)
Races - Other race alone (%)
Races - Other race alone (% change since 2000)
Racial diversity
Unemployment (%)
Unemployment (% change since 2000)
Unemployment (%) - White
Unemployment (%) - Black or African American
Unemployment (%) - Asian
Unemployment (%) - Hispanic or Latino
Unemployment (%) - American Indian and Alaska Native
Unemployment (%) - Multirace
Unemployment (%) - Other Race
Population density (people per square mile)
Population - Males (%)
Population - Females (%)
Population - Males (%) - White
Population - Males (%) - Black or African American
Population - Males (%) - Asian
Population - Males (%) - Hispanic or Latino
Population - Males (%) - American Indian and Alaska Native
Population - Males (%) - Multirace
Population - Males (%) - Other Race
Population - Females (%) - White
Population - Females (%) - Black or African American
Population - Females (%) - Asian
Population - Females (%) - Hispanic or Latino
Population - Females (%) - American Indian and Alaska Native
Population - Females (%) - Multirace
Population - Females (%) - Other Race
Coronavirus confirmed cases (Apr 27, 2024)
Deaths caused by coronavirus (Apr 27, 2024)
Coronavirus confirmed cases (per 100k population) (Apr 27, 2024)
Deaths caused by coronavirus (per 100k population) (Apr 27, 2024)
Daily increase in number of cases (Apr 27, 2024)
Weekly increase in number of cases (Apr 27, 2024)
Cases doubled (in days) (Apr 27, 2024)
Hospitalized patients (Apr 18, 2022)
Negative test results (Apr 18, 2022)
Total test results (Apr 18, 2022)
COVID Vaccine doses distributed (per 100k population) (Sep 19, 2023)
COVID Vaccine doses administered (per 100k population) (Sep 19, 2023)
COVID Vaccine doses distributed (Sep 19, 2023)
COVID Vaccine doses administered (Sep 19, 2023)
Likely homosexual households (%)
Likely homosexual households (% change since 2000)
Likely homosexual households - Lesbian couples (%)
Likely homosexual households - Lesbian couples (% change since 2000)
Likely homosexual households - Gay men (%)
Likely homosexual households - Gay men (% change since 2000)
Cost of living index
Median gross rent ($)
Median contract rent ($)
Median monthly housing costs ($)
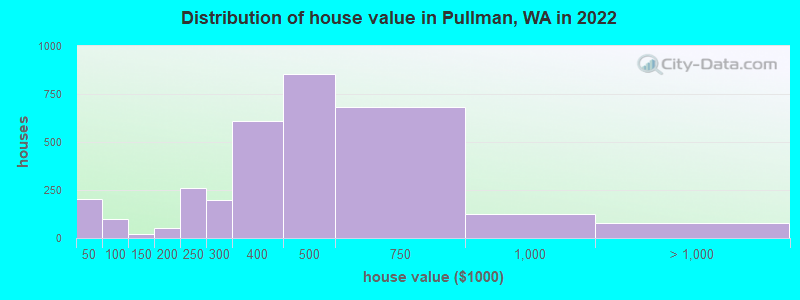
Median house or condo value ($)
Median house or condo value ($ change since 2000)
Mean house or condo value by units in structure - 1, detached ($)
Mean house or condo value by units in structure - 1, attached ($)
Mean house or condo value by units in structure - 2 ($)
Mean house or condo value by units in structure by units in structure - 3 or 4 ($)
Mean house or condo value by units in structure - 5 or more ($)
Mean house or condo value by units in structure - Boat, RV, van, etc. ($)
Mean house or condo value by units in structure - Mobile home ($)
Median house or condo value ($) - White
Median house or condo value ($) - Black or African American
Median house or condo value ($) - Asian
Median house or condo value ($) - Hispanic or Latino
Median house or condo value ($) - American Indian and Alaska Native
Median house or condo value ($) - Multirace
Median house or condo value ($) - Other Race
Median resident age
Resident age diversity
Median resident age - Males
Median resident age - Females
Median resident age - White
Median resident age - Black or African American
Median resident age - Asian
Median resident age - Hispanic or Latino
Median resident age - American Indian and Alaska Native
Median resident age - Multirace
Median resident age - Other Race
Median resident age - Males - White
Median resident age - Males - Black or African American
Median resident age - Males - Asian
Median resident age - Males - Hispanic or Latino
Median resident age - Males - American Indian and Alaska Native
Median resident age - Males - Multirace
Median resident age - Males - Other Race
Median resident age - Females - White
Median resident age - Females - Black or African American
Median resident age - Females - Asian
Median resident age - Females - Hispanic or Latino
Median resident age - Females - American Indian and Alaska Native
Median resident age - Females - Multirace
Median resident age - Females - Other Race
Commute - mean travel time to work (minutes)
Travel time to work - Less than 5 minutes (%)
Travel time to work - Less than 5 minutes (% change since 2000)
Travel time to work - 5 to 9 minutes (%)
Travel time to work - 5 to 9 minutes (% change since 2000)
Travel time to work - 10 to 19 minutes (%)
Travel time to work - 10 to 19 minutes (% change since 2000)
Travel time to work - 20 to 29 minutes (%)
Travel time to work - 20 to 29 minutes (% change since 2000)
Travel time to work - 30 to 39 minutes (%)
Travel time to work - 30 to 39 minutes (% change since 2000)
Travel time to work - 40 to 59 minutes (%)
Travel time to work - 40 to 59 minutes (% change since 2000)
Travel time to work - 60 to 89 minutes (%)
Travel time to work - 60 to 89 minutes (% change since 2000)
Travel time to work - 90 or more minutes (%)
Travel time to work - 90 or more minutes (% change since 2000)
Marital status - Never married (%)
Marital status - Now married (%)
Marital status - Separated (%)
Marital status - Widowed (%)
Marital status - Divorced (%)
Median family income ($)
Median family income (% change since 2000)
Median non-family income ($)
Median non-family income (% change since 2000)
Median per capita income ($)
Median per capita income (% change since 2000)
Median family income ($) - White
Median family income ($) - Black or African American
Median family income ($) - Asian
Median family income ($) - Hispanic or Latino
Median family income ($) - American Indian and Alaska Native
Median family income ($) - Multirace
Median family income ($) - Other Race
Median year house/condo built
Median year apartment built
Year house built - Built 2005 or later (%)
Year house built - Built 2000 to 2004 (%)
Year house built - Built 1990 to 1999 (%)
Year house built - Built 1980 to 1989 (%)
Year house built - Built 1970 to 1979 (%)
Year house built - Built 1960 to 1969 (%)
Year house built - Built 1950 to 1959 (%)
Year house built - Built 1940 to 1949 (%)
Year house built - Built 1939 or earlier (%)
Average household size
Household density (households per square mile)
Average household size - White
Average household size - Black or African American
Average household size - Asian
Average household size - Hispanic or Latino
Average household size - American Indian and Alaska Native
Average household size - Multirace
Average household size - Other Race
Occupied housing units (%)
Vacant housing units (%)
Owner occupied housing units (%)
Renter occupied housing units (%)
Vacancy status - For rent (%)
Vacancy status - For sale only (%)
Vacancy status - Rented or sold, not occupied (%)
Vacancy status - For seasonal, recreational, or occasional use (%)
Vacancy status - For migrant workers (%)
Vacancy status - Other vacant (%)
Residents with income below the poverty level (%)
Residents with income below 50% of the poverty level (%)
Children below poverty level (%)
Poor families by family type - Married-couple family (%)
Poor families by family type - Male, no wife present (%)
Poor families by family type - Female, no husband present (%)
Poverty status for native-born residents (%)
Poverty status for foreign-born residents (%)
Poverty among high school graduates not in families (%)
Poverty among people who did not graduate high school not in families (%)
Residents with income below the poverty level (%) - White
Residents with income below the poverty level (%) - Black or African American
Residents with income below the poverty level (%) - Asian
Residents with income below the poverty level (%) - Hispanic or Latino
Residents with income below the poverty level (%) - American Indian and Alaska Native
Residents with income below the poverty level (%) - Multirace
Residents with income below the poverty level (%) - Other Race
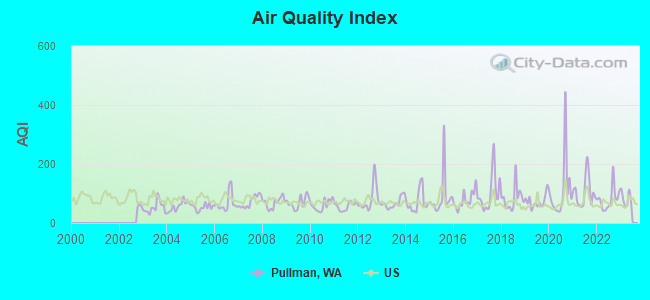
Air pollution - Air Quality Index (AQI)
Air pollution - CO
Air pollution - NO2
Air pollution - SO2
Air pollution - Ozone
Air pollution - PM10
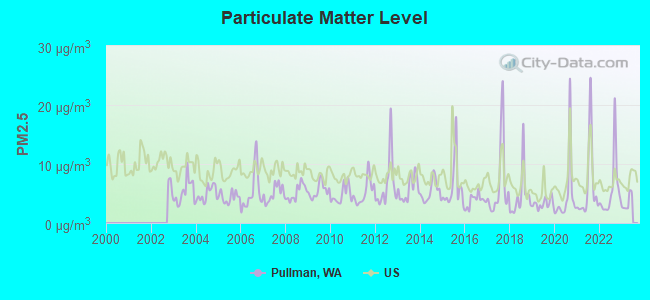
Air pollution - PM25
Air pollution - Pb
Crime - Murders per 100,000 population
Crime - Rapes per 100,000 population
Crime - Robberies per 100,000 population
Crime - Assaults per 100,000 population
Crime - Burglaries per 100,000 population
Crime - Thefts per 100,000 population
Crime - Auto thefts per 100,000 population
Crime - Arson per 100,000 population
Crime - City-data.com crime index
Crime - Violent crime index
Crime - Property crime index
Crime - Murders per 100,000 population (5 year average)
Crime - Rapes per 100,000 population (5 year average)
Crime - Robberies per 100,000 population (5 year average)
Crime - Assaults per 100,000 population (5 year average)
Crime - Burglaries per 100,000 population (5 year average)
Crime - Thefts per 100,000 population (5 year average)
Crime - Auto thefts per 100,000 population (5 year average)
Crime - Arson per 100,000 population (5 year average)
Crime - City-data.com crime index (5 year average)
Crime - Violent crime index (5 year average)
Crime - Property crime index (5 year average)
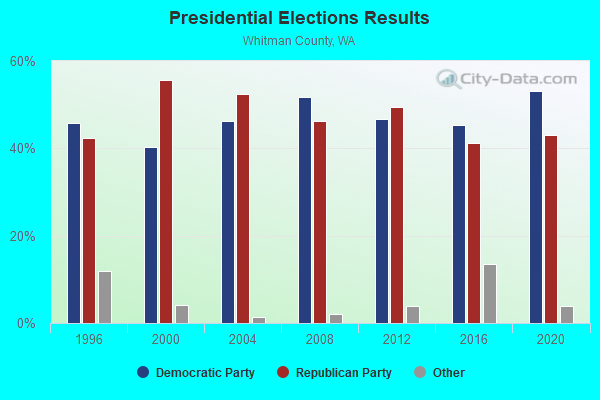
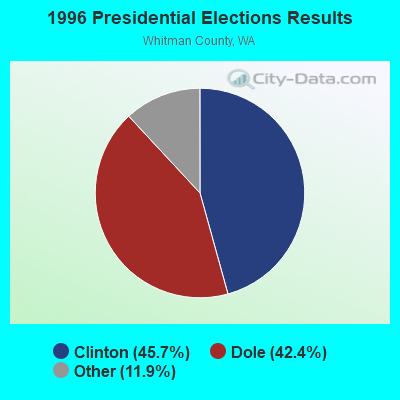
1996 Presidential Elections Results (%) - Democratic Party (Clinton)
1996 Presidential Elections Results (%) - Republican Party (Dole)
1996 Presidential Elections Results (%) - Other
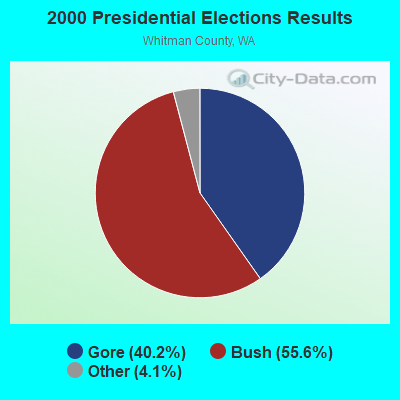
2000 Presidential Elections Results (%) - Democratic Party (Gore)
2000 Presidential Elections Results (%) - Republican Party (Bush)
2000 Presidential Elections Results (%) - Other
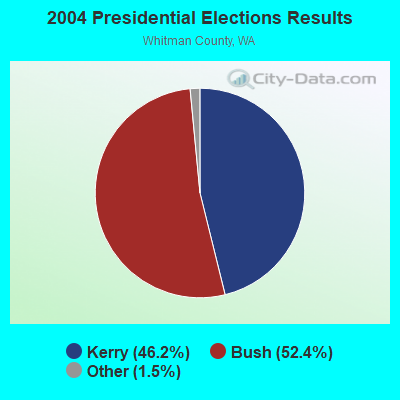
2004 Presidential Elections Results (%) - Democratic Party (Kerry)
2004 Presidential Elections Results (%) - Republican Party (Bush)
2004 Presidential Elections Results (%) - Other
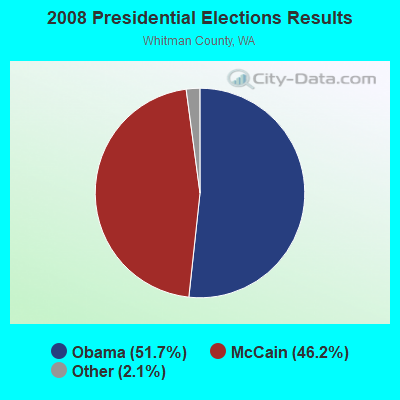
2008 Presidential Elections Results (%) - Democratic Party (Obama)
2008 Presidential Elections Results (%) - Republican Party (McCain)
2008 Presidential Elections Results (%) - Other
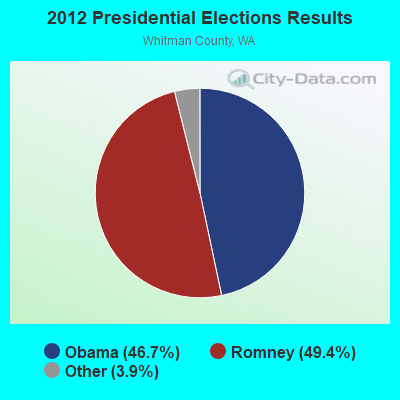
2012 Presidential Elections Results (%) - Democratic Party (Obama)
2012 Presidential Elections Results (%) - Republican Party (Romney)
2012 Presidential Elections Results (%) - Other
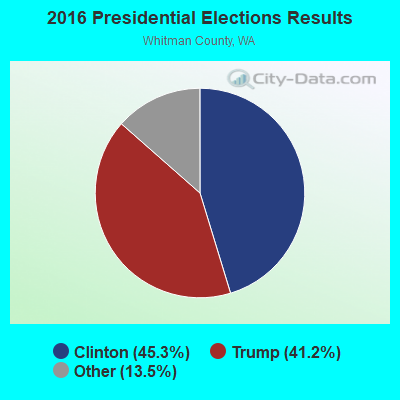
2016 Presidential Elections Results (%) - Democratic Party (Clinton)
2016 Presidential Elections Results (%) - Republican Party (Trump)
2016 Presidential Elections Results (%) - Other
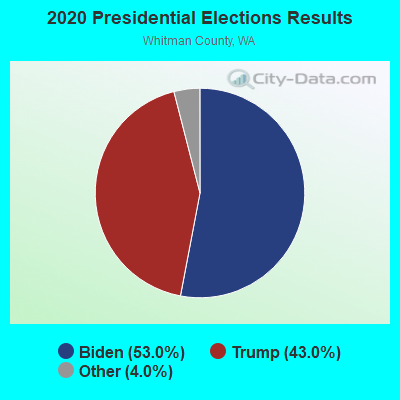
2020 Presidential Elections Results (%) - Democratic Party (Biden)
2020 Presidential Elections Results (%) - Republican Party (Trump)
2020 Presidential Elections Results (%) - Other
Ancestries Reported - Arab (%)
Ancestries Reported - Czech (%)
Ancestries Reported - Danish (%)
Ancestries Reported - Dutch (%)
Ancestries Reported - English (%)
Ancestries Reported - French (%)
Ancestries Reported - French Canadian (%)
Ancestries Reported - German (%)
Ancestries Reported - Greek (%)
Ancestries Reported - Hungarian (%)
Ancestries Reported - Irish (%)
Ancestries Reported - Italian (%)
Ancestries Reported - Lithuanian (%)
Ancestries Reported - Norwegian (%)
Ancestries Reported - Polish (%)
Ancestries Reported - Portuguese (%)
Ancestries Reported - Russian (%)
Ancestries Reported - Scotch-Irish (%)
Ancestries Reported - Scottish (%)
Ancestries Reported - Slovak (%)
Ancestries Reported - Subsaharan African (%)
Ancestries Reported - Swedish (%)
Ancestries Reported - Swiss (%)
Ancestries Reported - Ukrainian (%)
Ancestries Reported - United States (%)
Ancestries Reported - Welsh (%)
Ancestries Reported - West Indian (%)
Ancestries Reported - Other (%)
Educational Attainment - No schooling completed (%)
Educational Attainment - Less than high school (%)
Educational Attainment - High school or equivalent (%)
Educational Attainment - Less than 1 year of college (%)
Educational Attainment - 1 or more years of college (%)
Educational Attainment - Associate degree (%)
Educational Attainment - Bachelor's degree (%)
Educational Attainment - Master's degree (%)
Educational Attainment - Professional school degree (%)
Educational Attainment - Doctorate degree (%)
School Enrollment - Nursery, preschool (%)
School Enrollment - Kindergarten (%)
School Enrollment - Grade 1 to 4 (%)
School Enrollment - Grade 5 to 8 (%)
School Enrollment - Grade 9 to 12 (%)
School Enrollment - College undergrad (%)
School Enrollment - Graduate or professional (%)
School Enrollment - Not enrolled in school (%)
School enrollment - Public schools (%)
School enrollment - Private schools (%)
School enrollment - Not enrolled (%)
Median number of rooms in houses and condos
Median number of rooms in apartments
Housing units lacking complete plumbing facilities (%)
Housing units lacking complete kitchen facilities (%)
Density of houses
Urban houses (%)
Rural houses (%)
Households with people 60 years and over (%)
Households with people 65 years and over (%)
Households with people 75 years and over (%)
Households with one or more nonrelatives (%)
Households with no nonrelatives (%)
Population in households (%)
Family households (%)
Nonfamily households (%)
Population in families (%)
Family households with own children (%)
Median number of bedrooms in owner occupied houses
Mean number of bedrooms in owner occupied houses
Median number of bedrooms in renter occupied houses
Mean number of bedrooms in renter occupied houses
Median number of vehichles in owner occupied houses
Mean number of vehichles in owner occupied houses
Median number of vehichles in renter occupied houses
Mean number of vehichles in renter occupied houses
Mortgage status - with mortgage (%)
Mortgage status - with second mortgage (%)
Mortgage status - with home equity loan (%)
Mortgage status - with both second mortgage and home equity loan (%)
Mortgage status - without a mortgage (%)
Average family size
Average family size - White
Average family size - Black or African American
Average family size - Asian
Average family size - Hispanic or Latino
Average family size - American Indian and Alaska Native
Average family size - Multirace
Average family size - Other Race
Geographical mobility - Same house 1 year ago (%)
Geographical mobility - Moved within same county (%)
Geographical mobility - Moved from different county within same state (%)
Geographical mobility - Moved from different state (%)
Geographical mobility - Moved from abroad (%)
Place of birth - Born in state of residence (%)
Place of birth - Born in other state (%)
Place of birth - Native, outside of US (%)
Place of birth - Foreign born (%)
Housing units in structures - 1, detached (%)
Housing units in structures - 1, attached (%)
Housing units in structures - 2 (%)
Housing units in structures - 3 or 4 (%)
Housing units in structures - 5 to 9 (%)
Housing units in structures - 10 to 19 (%)
Housing units in structures - 20 to 49 (%)
Housing units in structures - 50 or more (%)
Housing units in structures - Mobile home (%)
Housing units in structures - Boat, RV, van, etc. (%)
House/condo owner moved in on average (years ago)
Renter moved in on average (years ago)
Year householder moved into unit - Moved in 1999 to March 2000 (%)
Year householder moved into unit - Moved in 1995 to 1998 (%)
Year householder moved into unit - Moved in 1990 to 1994 (%)
Year householder moved into unit - Moved in 1980 to 1989 (%)
Year householder moved into unit - Moved in 1970 to 1979 (%)
Year householder moved into unit - Moved in 1969 or earlier (%)
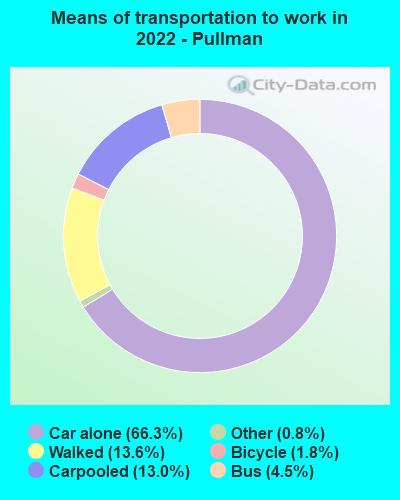
Means of transportation to work - Drove car alone (%)
Means of transportation to work - Carpooled (%)
Means of transportation to work - Public transportation (%)
Means of transportation to work - Bus or trolley bus (%)
Means of transportation to work - Streetcar or trolley car (%)
Means of transportation to work - Subway or elevated (%)
Means of transportation to work - Railroad (%)
Means of transportation to work - Ferryboat (%)
Means of transportation to work - Taxicab (%)
Means of transportation to work - Motorcycle (%)
Means of transportation to work - Bicycle (%)
Means of transportation to work - Walked (%)
Means of transportation to work - Other means (%)
Working at home (%)
Industry diversity
Most Common Industries - Agriculture, forestry, fishing and hunting, and mining (%)
Most Common Industries - Agriculture, forestry, fishing and hunting (%)
Most Common Industries - Mining, quarrying, and oil and gas extraction (%)
Most Common Industries - Construction (%)
Most Common Industries - Manufacturing (%)
Most Common Industries - Wholesale trade (%)
Most Common Industries - Retail trade (%)
Most Common Industries - Transportation and warehousing, and utilities (%)
Most Common Industries - Transportation and warehousing (%)
Most Common Industries - Utilities (%)
Most Common Industries - Information (%)
Most Common Industries - Finance and insurance, and real estate and rental and leasing (%)
Most Common Industries - Finance and insurance (%)
Most Common Industries - Real estate and rental and leasing (%)
Most Common Industries - Professional, scientific, and management, and administrative and waste management services (%)
Most Common Industries - Professional, scientific, and technical services (%)
Most Common Industries - Management of companies and enterprises (%)
Most Common Industries - Administrative and support and waste management services (%)
Most Common Industries - Educational services, and health care and social assistance (%)
Most Common Industries - Educational services (%)
Most Common Industries - Health care and social assistance (%)
Most Common Industries - Arts, entertainment, and recreation, and accommodation and food services (%)
Most Common Industries - Arts, entertainment, and recreation (%)
Most Common Industries - Accommodation and food services (%)
Most Common Industries - Other services, except public administration (%)
Most Common Industries - Public administration (%)
Occupation diversity
Most Common Occupations - Management, business, science, and arts occupations (%)
Most Common Occupations - Management, business, and financial occupations (%)
Most Common Occupations - Management occupations (%)
Most Common Occupations - Business and financial operations occupations (%)
Most Common Occupations - Computer, engineering, and science occupations (%)
Most Common Occupations - Computer and mathematical occupations (%)
Most Common Occupations - Architecture and engineering occupations (%)
Most Common Occupations - Life, physical, and social science occupations (%)
Most Common Occupations - Education, legal, community service, arts, and media occupations (%)
Most Common Occupations - Community and social service occupations (%)
Most Common Occupations - Legal occupations (%)
Most Common Occupations - Education, training, and library occupations (%)
Most Common Occupations - Arts, design, entertainment, sports, and media occupations (%)
Most Common Occupations - Healthcare practitioners and technical occupations (%)
Most Common Occupations - Health diagnosing and treating practitioners and other technical occupations (%)
Most Common Occupations - Health technologists and technicians (%)
Most Common Occupations - Service occupations (%)
Most Common Occupations - Healthcare support occupations (%)
Most Common Occupations - Protective service occupations (%)
Most Common Occupations - Fire fighting and prevention, and other protective service workers including supervisors (%)
Most Common Occupations - Law enforcement workers including supervisors (%)
Most Common Occupations - Food preparation and serving related occupations (%)
Most Common Occupations - Building and grounds cleaning and maintenance occupations (%)
Most Common Occupations - Personal care and service occupations (%)
Most Common Occupations - Sales and office occupations (%)
Most Common Occupations - Sales and related occupations (%)
Most Common Occupations - Office and administrative support occupations (%)
Most Common Occupations - Natural resources, construction, and maintenance occupations (%)
Most Common Occupations - Farming, fishing, and forestry occupations (%)
Most Common Occupations - Construction and extraction occupations (%)
Most Common Occupations - Installation, maintenance, and repair occupations (%)
Most Common Occupations - Production, transportation, and material moving occupations (%)
Most Common Occupations - Production occupations (%)
Most Common Occupations - Transportation occupations (%)
Most Common Occupations - Material moving occupations (%)
People in Group quarters - Institutionalized population (%)
People in Group quarters - Correctional institutions (%)
People in Group quarters - Federal prisons and detention centers (%)
People in Group quarters - Halfway houses (%)
People in Group quarters - Local jails and other confinement facilities (including police lockups) (%)
People in Group quarters - Military disciplinary barracks (%)
People in Group quarters - State prisons (%)
People in Group quarters - Other types of correctional institutions (%)
People in Group quarters - Nursing homes (%)
People in Group quarters - Hospitals/wards, hospices, and schools for the handicapped (%)
People in Group quarters - Hospitals/wards and hospices for chronically ill (%)
People in Group quarters - Hospices or homes for chronically ill (%)
People in Group quarters - Military hospitals or wards for chronically ill (%)
People in Group quarters - Other hospitals or wards for chronically ill (%)
People in Group quarters - Hospitals or wards for drug/alcohol abuse (%)
People in Group quarters - Mental (Psychiatric) hospitals or wards (%)
People in Group quarters - Schools, hospitals, or wards for the mentally retarded (%)
People in Group quarters - Schools, hospitals, or wards for the physically handicapped (%)
People in Group quarters - Institutions for the deaf (%)
People in Group quarters - Institutions for the blind (%)
People in Group quarters - Orthopedic wards and institutions for the physically handicapped (%)
People in Group quarters - Wards in general hospitals for patients who have no usual home elsewhere (%)
People in Group quarters - Wards in military hospitals for patients who have no usual home elsewhere (%)
People in Group quarters - Juvenile institutions (%)
People in Group quarters - Long-term care (%)
People in Group quarters - Homes for abused, dependent, and neglected children (%)
People in Group quarters - Residential treatment centers for emotionally disturbed children (%)
People in Group quarters - Training schools for juvenile delinquents (%)
People in Group quarters - Short-term care, detention or diagnostic centers for delinquent children (%)
People in Group quarters - Type of juvenile institution unknown (%)
People in Group quarters - Noninstitutionalized population (%)
People in Group quarters - College dormitories (includes college quarters off campus) (%)
People in Group quarters - Military quarters (%)
People in Group quarters - On base (%)
People in Group quarters - Barracks, unaccompanied personnel housing (UPH), (Enlisted/Officer), ;and similar group living quarters for military personnel (%)
People in Group quarters - Transient quarters for temporary residents (%)
People in Group quarters - Military ships (%)
People in Group quarters - Group homes (%)
People in Group quarters - Homes or halfway houses for drug/alcohol abuse (%)
People in Group quarters - Homes for the mentally ill (%)
People in Group quarters - Homes for the mentally retarded (%)
People in Group quarters - Homes for the physically handicapped (%)
People in Group quarters - Other group homes (%)
People in Group quarters - Religious group quarters (%)
People in Group quarters - Dormitories (%)
People in Group quarters - Agriculture workers' dormitories on farms (%)
People in Group quarters - Job Corps and vocational training facilities (%)
People in Group quarters - Other workers' dormitories (%)
People in Group quarters - Crews of maritime vessels (%)
People in Group quarters - Other nonhousehold living situations (%)
People in Group quarters - Other noninstitutional group quarters (%)
Residents speaking English at home (%)
Residents speaking English at home - Born in the United States (%)
Residents speaking English at home - Native, born elsewhere (%)
Residents speaking English at home - Foreign born (%)
Residents speaking Spanish at home (%)
Residents speaking Spanish at home - Born in the United States (%)
Residents speaking Spanish at home - Native, born elsewhere (%)
Residents speaking Spanish at home - Foreign born (%)
Residents speaking other language at home (%)
Residents speaking other language at home - Born in the United States (%)
Residents speaking other language at home - Native, born elsewhere (%)
Residents speaking other language at home - Foreign born (%)
Class of Workers - Employee of private company (%)
Class of Workers - Self-employed in own incorporated business (%)
Class of Workers - Private not-for-profit wage and salary workers (%)
Class of Workers - Local government workers (%)
Class of Workers - State government workers (%)
Class of Workers - Federal government workers (%)
Class of Workers - Self-employed workers in own not incorporated business and Unpaid family workers (%)
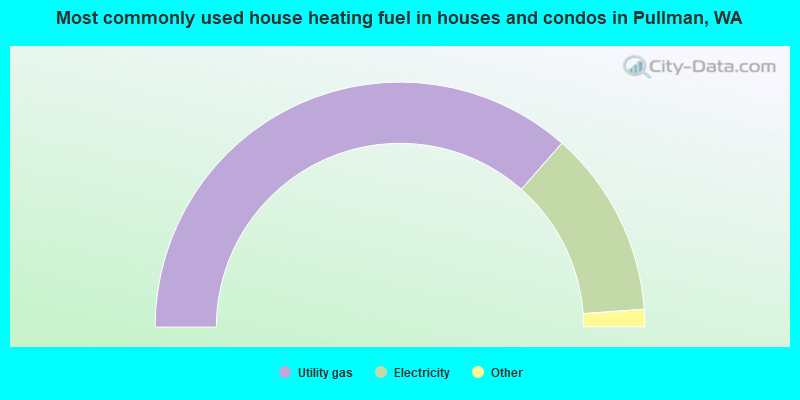
House heating fuel used in houses and condos - Utility gas (%)
House heating fuel used in houses and condos - Bottled, tank, or LP gas (%)
House heating fuel used in houses and condos - Electricity (%)
House heating fuel used in houses and condos - Fuel oil, kerosene, etc. (%)
House heating fuel used in houses and condos - Coal or coke (%)
House heating fuel used in houses and condos - Wood (%)
House heating fuel used in houses and condos - Solar energy (%)
House heating fuel used in houses and condos - Other fuel (%)
House heating fuel used in houses and condos - No fuel used (%)
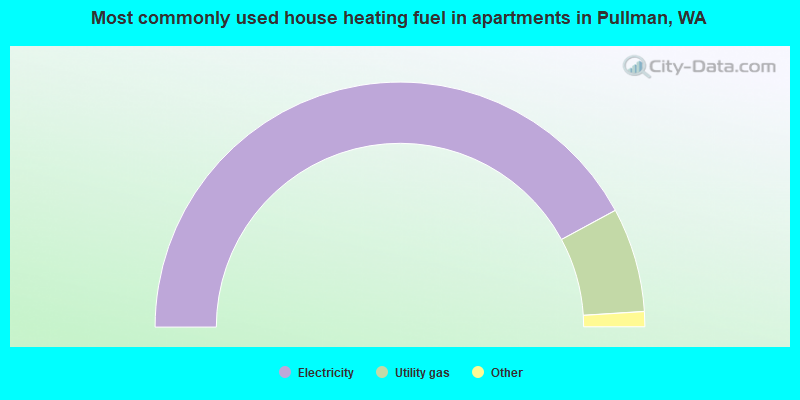
House heating fuel used in apartments - Utility gas (%)
House heating fuel used in apartments - Bottled, tank, or LP gas (%)
House heating fuel used in apartments - Electricity (%)
House heating fuel used in apartments - Fuel oil, kerosene, etc. (%)
House heating fuel used in apartments - Coal or coke (%)
House heating fuel used in apartments - Wood (%)
House heating fuel used in apartments - Solar energy (%)
House heating fuel used in apartments - Other fuel (%)
House heating fuel used in apartments - No fuel used (%)
Armed forces status - In Armed Forces (%)
Armed forces status - Civilian (%)
Armed forces status - Civilian - Veteran (%)
Armed forces status - Civilian - Nonveteran (%)
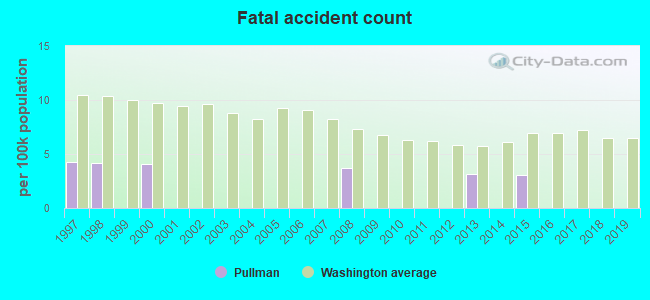
Fatal accidents locations in years 2005-2021
Fatal accidents locations in 2005
Fatal accidents locations in 2006
Fatal accidents locations in 2007
Fatal accidents locations in 2008
Fatal accidents locations in 2009
Fatal accidents locations in 2010
Fatal accidents locations in 2011
Fatal accidents locations in 2012
Fatal accidents locations in 2013
Fatal accidents locations in 2014
Fatal accidents locations in 2015
Fatal accidents locations in 2016
Fatal accidents locations in 2017
Fatal accidents locations in 2018
Fatal accidents locations in 2019
Fatal accidents locations in 2020
Fatal accidents locations in 2021
Alcohol use - People drinking some alcohol every month (%)
Alcohol use - People not drinking at all (%)
Alcohol use - Average days/month drinking alcohol
Alcohol use - Average drinks/week
Alcohol use - Average days/year people drink much
Audiometry - Average condition of hearing (%)
Audiometry - People that can hear a whisper from across a quiet room (%)
Audiometry - People that can hear normal voice from across a quiet room (%)
Audiometry - Ears ringing, roaring, buzzing (%)
Audiometry - Had a job exposure to loud noise (%)
Audiometry - Had off-work exposure to loud noise (%)
Blood Pressure & Cholesterol - Has high blood pressure (%)
Blood Pressure & Cholesterol - Checking blood pressure at home (%)
Blood Pressure & Cholesterol - Frequently checking blood cholesterol (%)
Blood Pressure & Cholesterol - Has high cholesterol level (%)
Consumer Behavior - Money monthly spent on food at supermarket/grocery store
Consumer Behavior - Money monthly spent on food at other stores
Consumer Behavior - Money monthly spent on eating out
Consumer Behavior - Money monthly spent on carryout/delivered foods
Consumer Behavior - Income spent on food at supermarket/grocery store (%)
Consumer Behavior - Income spent on food at other stores (%)
Consumer Behavior - Income spent on eating out (%)
Consumer Behavior - Income spent on carryout/delivered foods (%)
Current Health Status - General health condition (%)
Current Health Status - Blood donors (%)
Current Health Status - Has blood ever tested for HIV virus (%)
Current Health Status - Left-handed people (%)
Dermatology - People using sunscreen (%)
Diabetes - Diabetics (%)
Diabetes - Had a blood test for high blood sugar (%)
Diabetes - People taking insulin (%)
Diet Behavior & Nutrition - Diet health (%)
Diet Behavior & Nutrition - Milk product consumption (# of products/month)
Diet Behavior & Nutrition - Meals not home prepared (#/week)
Diet Behavior & Nutrition - Meals from fast food or pizza place (#/week)
Diet Behavior & Nutrition - Ready-to-eat foods (#/month)
Diet Behavior & Nutrition - Frozen meals/pizza (#/month)
Drug Use - People that ever used marijuana or hashish (%)
Drug Use - Ever used hard drugs (%)
Drug Use - Ever used any form of cocaine (%)
Drug Use - Ever used heroin (%)
Drug Use - Ever used methamphetamine (%)
Health Insurance - People covered by health insurance (%)
Kidney Conditions-Urology - Avg. # of times urinating at night
Medical Conditions - People with asthma (%)
Medical Conditions - People with anemia (%)
Medical Conditions - People with psoriasis (%)
Medical Conditions - People with overweight (%)
Medical Conditions - Elderly people having difficulties in thinking or remembering (%)
Medical Conditions - People who ever received blood transfusion (%)
Medical Conditions - People having trouble seeing even with glass/contacts (%)
Medical Conditions - People with arthritis (%)
Medical Conditions - People with gout (%)
Medical Conditions - People with congestive heart failure (%)
Medical Conditions - People with coronary heart disease (%)
Medical Conditions - People with angina pectoris (%)
Medical Conditions - People who ever had heart attack (%)
Medical Conditions - People who ever had stroke (%)
Medical Conditions - People with emphysema (%)
Medical Conditions - People with thyroid problem (%)
Medical Conditions - People with chronic bronchitis (%)
Medical Conditions - People with any liver condition (%)
Medical Conditions - People who ever had cancer or malignancy (%)
Mental Health - People who have little interest in doing things (%)
Mental Health - People feeling down, depressed, or hopeless (%)
Mental Health - People who have trouble sleeping or sleeping too much (%)
Mental Health - People feeling tired or having little energy (%)
Mental Health - People with poor appetite or overeating (%)
Mental Health - People feeling bad about themself (%)
Mental Health - People who have trouble concentrating on things (%)
Mental Health - People moving or speaking slowly or too fast (%)
Mental Health - People having thoughts they would be better off dead (%)
Oral Health - Average years since last visit a dentist
Oral Health - People embarrassed because of mouth (%)
Oral Health - People with gum disease (%)
Oral Health - General health of teeth and gums (%)
Oral Health - Average days a week using dental floss/device
Oral Health - Average days a week using mouthwash for dental problem
Oral Health - Average number of teeth
Pesticide Use - Households using pesticides to control insects (%)
Pesticide Use - Households using pesticides to kill weeds (%)
Physical Activity - People doing vigorous-intensity work activities (%)
Physical Activity - People doing moderate-intensity work activities (%)
Physical Activity - People walking or bicycling (%)
Physical Activity - People doing vigorous-intensity recreational activities (%)
Physical Activity - People doing moderate-intensity recreational activities (%)
Physical Activity - Average hours a day doing sedentary activities
Physical Activity - Average hours a day watching TV or videos
Physical Activity - Average hours a day using computer
Physical Functioning - People having limitations keeping them from working (%)
Physical Functioning - People limited in amount of work they can do (%)
Physical Functioning - People that need special equipment to walk (%)
Physical Functioning - People experiencing confusion/memory problems (%)
Physical Functioning - People requiring special healthcare equipment (%)
Prescription Medications - Average number of prescription medicines taking
Preventive Aspirin Use - Adults 40+ taking low-dose aspirin (%)
Reproductive Health - Vaginal deliveries (%)
Reproductive Health - Cesarean deliveries (%)
Reproductive Health - Deliveries resulted in a live birth (%)
Reproductive Health - Pregnancies resulted in a delivery (%)
Reproductive Health - Women breastfeeding newborns (%)
Reproductive Health - Women that had a hysterectomy (%)
Reproductive Health - Women that had both ovaries removed (%)
Reproductive Health - Women that have ever taken birth control pills (%)
Reproductive Health - Women taking birth control pills (%)
Reproductive Health - Women that have ever used Depo-Provera or injectables (%)
Reproductive Health - Women that have ever used female hormones (%)
Sexual Behavior - People 18+ that ever had sex (vaginal, anal, or oral) (%)
Sexual Behavior - Males 18+ that ever had vaginal sex with a woman (%)
Sexual Behavior - Males 18+ that ever performed oral sex on a woman (%)
Sexual Behavior - Males 18+ that ever had anal sex with a woman (%)
Sexual Behavior - Males 18+ that ever had any sex with a man (%)
Sexual Behavior - Females 18+ that ever had vaginal sex with a man (%)
Sexual Behavior - Females 18+ that ever performed oral sex on a man (%)
Sexual Behavior - Females 18+ that ever had anal sex with a man (%)
Sexual Behavior - Females 18+ that ever had any kind of sex with a woman (%)
Sexual Behavior - Average age people first had sex
Sexual Behavior - Average number of female sex partners in lifetime (males 18+)
Sexual Behavior - Average number of female vaginal sex partners in lifetime (males 18+)
Sexual Behavior - Average age people first performed oral sex on a woman (18+)
Sexual Behavior - Average number of woman performed oral sex on in lifetime (18+)
Sexual Behavior - Average number of male sex partners in lifetime (males 18+)
Sexual Behavior - Average number of male anal sex partners in lifetime (males 18+)
Sexual Behavior - Average age people first performed oral sex on a man (18+)
Sexual Behavior - Average number of male oral sex partners in lifetime (18+)
Sexual Behavior - People using protection when performing oral sex (%)
Sexual Behavior - Average number of times people have vaginal or anal sex a year
Sexual Behavior - People having sex without condom (%)
Sexual Behavior - Average number of male sex partners in lifetime (females 18+)
Sexual Behavior - Average number of male vaginal sex partners in lifetime (females 18+)
Sexual Behavior - Average number of female sex partners in lifetime (females 18+)
Sexual Behavior - Circumcised males 18+ (%)
Sleep Disorders - Average hours sleeping at night
Sleep Disorders - People that has trouble sleeping (%)
Smoking-Cigarette Use - People smoking cigarettes (%)
Taste & Smell - People 40+ having problems with smell (%)
Taste & Smell - People 40+ having problems with taste (%)
Taste & Smell - People 40+ that ever had wisdom teeth removed (%)
Taste & Smell - People 40+ that ever had tonsils teeth removed (%)
Taste & Smell - People 40+ that ever had a loss of consciousness because of a head injury (%)
Taste & Smell - People 40+ that ever had a broken nose or other serious injury to face or skull (%)
Taste & Smell - People 40+ that ever had two or more sinus infections (%)
Weight - Average height (inches)
Weight - Average weight (pounds)
Weight - Average BMI
Weight - People that are obese (%)
Weight - People that ever were obese (%)
Weight - People trying to lose weight (%)
According to our research of Washington and other state lists, there were 3 registered sex offenders living in Pullman, Washington as of April 27, 2024 . The ratio of all residents to sex offenders in Pullman is 11,051 to 1.The ratio of registered sex offenders to all residents in this city is much lower than the state average.
Officers per 1,000 residents here:
0.83Washington average:
1.35
Latest news from Pullman, WA collected exclusively by city-data.com from local newspapers, TV, and radio stations
Ancestries: German (15.9%), European (7.0%), Norwegian (4.3%), Irish (4.3%), English (4.2%), Italian (3.9%).
Current Local Time:
Land area: 9.00 square miles.
Population density: 3,611 people per square mile (average).
4,297 residents are foreign born (8.1% Asia , 1.9% Europe , 1.5% Latin America ).
This city:
13.3%Washington:
14.9%
Median real estate property taxes paid for housing units with mortgages in 2022: $3,313 (0.7%)Median real estate property taxes paid for housing units with no mortgage in 2022: $3,551 (0.9%)
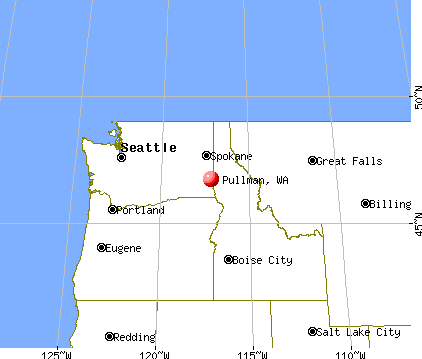
Nearest city with pop. 50,000+: Spokane Valley, WA (65.1 miles
Nearest city with pop. 200,000+: East Seattle, WA (242.6 miles
Nearest city with pop. 1,000,000+: Los Angeles, CA
Nearest cities:
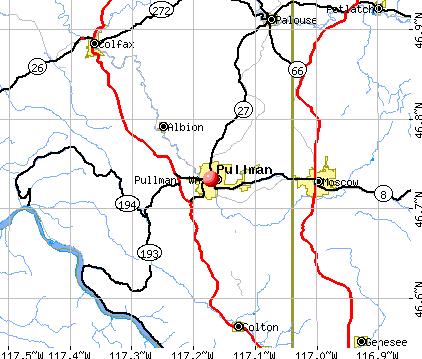
Latitude: 46.73 N, Longitude: 117.17 W
Nickname or alias (official or unofficial): Lentil Capital
Daytime population change due to commuting: +3,768 (+11.6%)Workers who live and work in this city: 14,805 (91.7%)
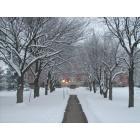
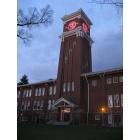
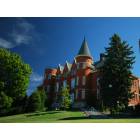
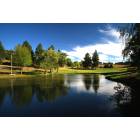
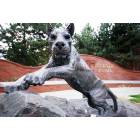
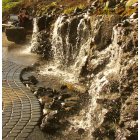
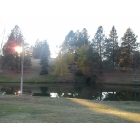
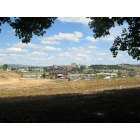
Pullman tourist attractions:
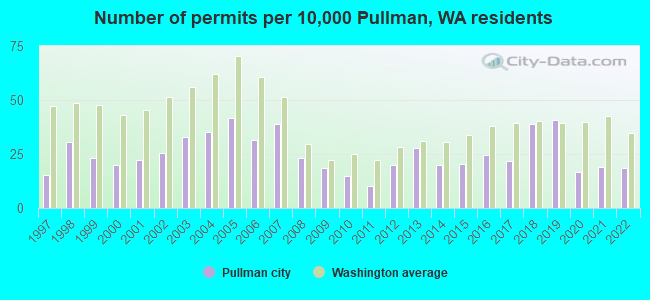
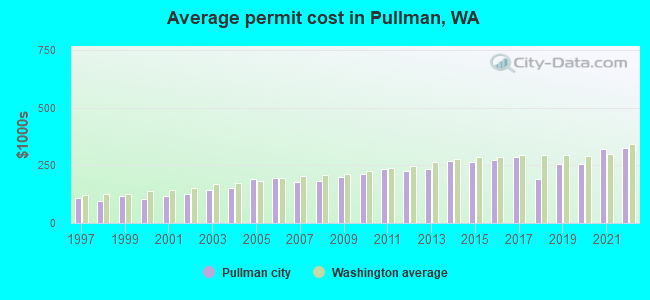
Single-family new house construction building permits:
2022: 46 buildings , average cost: $323,8002021: 47 buildings , average cost: $321,1002020: 41 buildings , average cost: $256,3002019: 101 buildings , average cost: $254,5002018: 96 buildings , average cost: $190,8002017: 54 buildings , average cost: $287,6002016: 60 buildings , average cost: $272,5002015: 50 buildings , average cost: $264,9002014: 49 buildings , average cost: $271,1002013: 69 buildings , average cost: $234,8002012: 49 buildings , average cost: $225,0002011: 25 buildings , average cost: $233,4002010: 37 buildings , average cost: $210,7002009: 46 buildings , average cost: $201,4002008: 57 buildings , average cost: $182,2002007: 96 buildings , average cost: $177,1002006: 78 buildings , average cost: $194,4002005: 103 buildings , average cost: $190,6002004: 87 buildings , average cost: $150,2002003: 81 buildings , average cost: $144,9002002: 63 buildings , average cost: $128,3002001: 55 buildings , average cost: $116,8002000: 49 buildings , average cost: $105,6001999: 57 buildings , average cost: $115,8001998: 75 buildings , average cost: $96,8001997: 38 buildings , average cost: $110,300Unemployment in December 2023:
Population change in the 1990s: +1,111 (+4.7%).
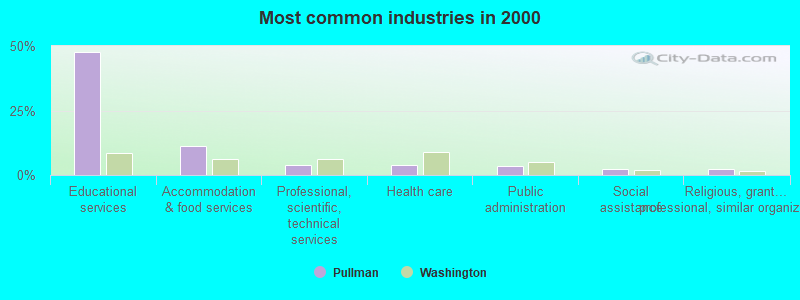
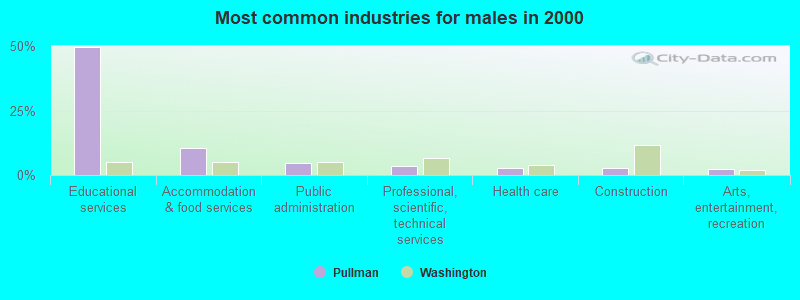
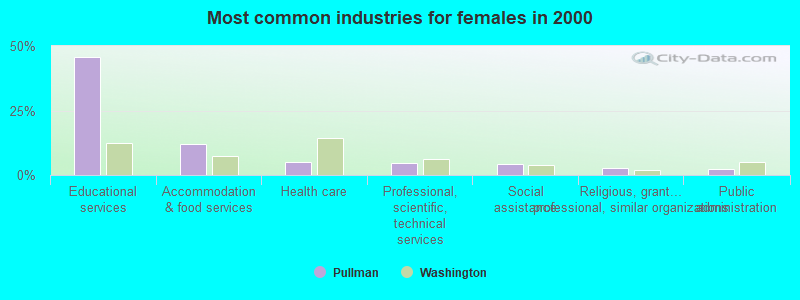
Most common industries in Pullman, WA (%)
Both Males Females
Educational services (47.7%)
Accommodation & food services (11.2%)
Professional, scientific, technical services (4.0%)
Health care (4.0%)
Public administration (3.5%)
Social assistance (2.4%)
Religious, grantmaking, civic, professional, similar organizations (2.4%)
Educational services (49.6%)
Accommodation & food services (10.4%)
Public administration (4.6%)
Professional, scientific, technical services (3.5%)
Health care (2.7%)
Construction (2.6%)
Arts, entertainment, recreation (2.5%)
Educational services (45.8%)
Accommodation & food services (12.0%)
Health care (5.2%)
Professional, scientific, technical services (4.5%)
Social assistance (4.3%)
Religious, grantmaking, civic, professional, similar organizations (2.5%)
Public administration (2.4%)
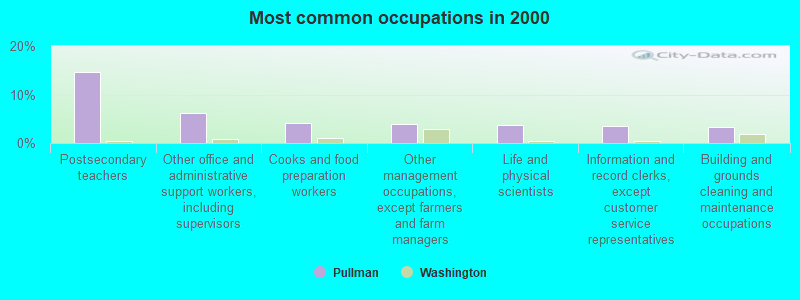
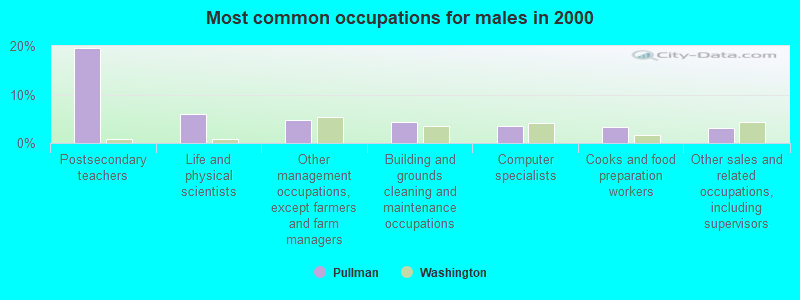
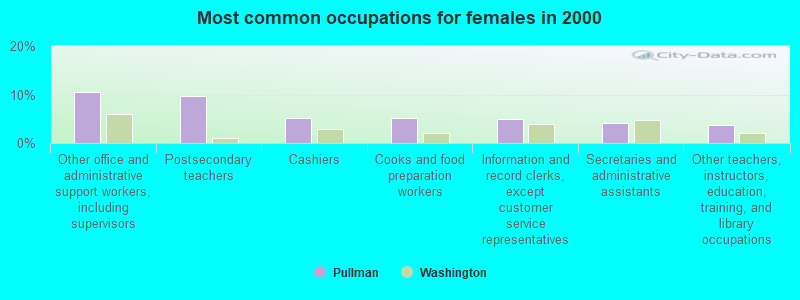
Most common occupations in Pullman, WA (%)
Both Males Females
Postsecondary teachers (14.6%)
Other office and administrative support workers, including supervisors (6.3%)
Cooks and food preparation workers (4.2%)
Other management occupations, except farmers and farm managers (3.9%)
Life and physical scientists (3.8%)
Information and record clerks, except customer service representatives (3.6%)
Building and grounds cleaning and maintenance occupations (3.3%)
Postsecondary teachers (19.6%)
Life and physical scientists (6.0%)
Other management occupations, except farmers and farm managers (4.7%)
Building and grounds cleaning and maintenance occupations (4.4%)
Computer specialists (3.5%)
Cooks and food preparation workers (3.2%)
Other sales and related occupations, including supervisors (3.1%)
Other office and administrative support workers, including supervisors (10.6%)
Postsecondary teachers (9.6%)
Cashiers (5.2%)
Cooks and food preparation workers (5.2%)
Information and record clerks, except customer service representatives (5.0%)
Secretaries and administrative assistants (4.2%)
Other teachers, instructors, education, training, and library occupations (3.8%)
Air pollution and air quality trends(lower is better)
AQI PM2.5
Earthquake activity:
Pullman-area historical earthquake activity is significantly above Washington state average. It is 1083% greater than the overall U.S. average. On 10/28/1983 at 14:06:06, a magnitude 7.3 (6.2 MB, 7.3 MS, 7.0 MW, Class: Major, Intensity: VIII - XII) earthquake occurred 246.0 miles away from Pullman center, causing 2 deaths ( 2 shaking deaths) and 3 injuries, causing $15,000,000 total damage On 8/18/1959 at 06:37:13, a magnitude 7.7 (7.7 UK) earthquake occurred 348.8 miles away from Pullman center, causing $26,000,000 total damage On 4/13/1949 at 19:55:42, a magnitude 7.0 (7.0 UK) earthquake occurred 253.9 miles away from Pullman center, causing $80,000,000 total damage On 3/31/2020 at 23:52:30, a magnitude 6.5 (6.5 MW, Depth: 7.5 mi, Class: Strong, Intensity: VII - IX) earthquake occurred 185.7 miles away from the city center On 2/28/2001 at 18:54:32, a magnitude 6.8 (6.5 MB, 6.6 MS, 6.8 MW) earthquake occurred 256.7 miles away from the city center, causing $2,000,000,000 total damage and $305,000,000 insured lossesOn 2/28/2001 at 18:54:32, a magnitude 6.8 (6.8 MD, Depth: 32.2 mi) earthquake occurred 263.8 miles away from the city center Magnitude types: body-wave magnitude (MB), duration magnitude (MD), surface-wave magnitude (MS), moment magnitude (MW) Natural disasters: The number of natural disasters in Whitman County (14) is near the US average (15).Major Disasters (Presidential) Declared: 12Emergencies Declared: 2Floods: 8, Storms: 5, Mudslides: 3, Heavy Rains: 2, Snows: 2, Winter Storms: 2, Drought: 1, Fire: 1, Hurricane: 1, Landslide: 1, Volcanic Eruption: 1, Wind: 1, Other: 1 (Note: some incidents may be assigned to more than one category). Hospitals and medical centers in Pullman: HOME HEALTH AND HOSPICE OF SE WASHINGTON (WEST 106 MAIN ST) PULLMAN REGIONAL HOSPITAL (Government - Hospital District or Authority, 835 S BISHOP BLVD) AVALON CARE CENTER - PULLMAN (NORTHWEST 1310 DEANE)
Airports located in Pullman: Amtrak station: PULLMAN (1002 NYE ST.) - Bus Station
.
Services: enclosed waiting area, public restrooms, public payphones, free short-term parking, call for taxi service.
College/University in Pullman: Washington State University Full-time enrollment: 25,055; Location: French Administration Building; Public; Website: wsu.edu/; Offers Doctor's degree )
Other colleges/universities with over 2000 students near Pullman:
University of Idaho (about 8 miles; Moscow, ID ; Full-time enrollment: 10,416)
Lewis-Clark State College (about 24 miles; Lewiston, ID ; FT enrollment: 3,199)
Eastern Washington University (about 57 miles; Cheney, WA ; FT enrollment: 11,643)
Gonzaga University (about 66 miles; Spokane, WA ; FT enrollment: 6,780)
Spokane Community College (about 66 miles; Spokane, WA ; FT enrollment: 6,482)
Spokane Falls Community College (about 67 miles; Spokane, WA ; FT enrollment: 6,052)
North Idaho College (about 68 miles; Coeur d'Alene, ID ; FT enrollment: 4,684)
Public high school in Pullman:
Private high schools in Pullman: PULLMAN CHRISTIAN SCHOOL Students: 52, Location: 345 SW KIMBALL DR, Grades: KG-12)
ROYAL GARRISON SCHOOL Students: 20, Location: NW 115 STATE ST, Grades: KG-10)
Public elementary/middle schools in Pullman:
See full list of schools located in Pullman Library in Pullman: PULLMAN (NEILL) PUBLIC LIBRARY Operating income: $1,138,100; Location: 210 N GRAND AVE; 65,943 books ; 4,879 audio materials ; 7,634 video materials ; 8 local licensed databases ; 11 state licensed databases ; 216 print serial subscriptions ; 3 electronic serial subscriptions )
User-submitted facts and corrections:
University of Idaho is about 12 miles from Pullman, not 35 miles. \"New St. Andrews College\" is also about 12 miles away, in Moscow
Notable locations in Pullman: (A) , Pullman Fire Department Station 32 (B) , Pullman Fire Department Station 31 (C) . Display/hide their locations on the map
Shopping Center: (1) . Display/hide its location on the map
Cemetery: (1) . Display/hide its location on the map
Creeks: (A) , Missouri Flat Creek (B) , Sunshine Creek (C) . Display/hide their locations on the map
Park in Pullman: (1) . Display/hide its location on the map
Tourist attractions: (1) , Palouse Discovery Science Center (Cultural Attractions- Events- & Facilities; 2371 Northeast Hopkins Court) (2) . Display/hide their approximate locations on the map
Hotels: (1) , Manor Lodge Motel (455 Southeast Paradise Street) (2) , Holiday Inn Express Hotel & Suites (S.E. 1090 Bishop Road) (3) , Holiday Inn Express (S.E. 1190 Bishop Blvd) (4) , College Hill Guest Cottage (610 NE Michigan Street) (5) , Quality Inn Paradise Creek (1400 Southeast Bishop Boulevard) (6) . Display/hide their approximate locations on the map
Birthplace of: James Mattis - Marine Corps general, Dana Simpson - Cartoonist, Ali Farokhmanesh - Basketball player, Jeff Isom - Former baseball pitcher, Lew Frederick - Politician, Michael Baumgartner - Member of the Washington State Senate, Sean White - Baseball player, Tamara Grigsby - Politician, Ben Haynes - College basketball player (Oral Roberts Golden Eagles), Brian Quinnett - Basketball player.
Whitman County has a predicted average indoor radon screening level between 2 and 4 pCi/L (pico curies per liter) - Moderate Potential Drinking water stations with addresses in Pullman and their reported violations in the past:
EVANGELICAL FREE CHURCH (Population served: 404, Groundwater):
Past monitoring violations:
3 routine major monitoring violations
Average household size: This city:
2.2 peopleWashington:
2.5 people
Percentage of family households: This city:
35.3%Whole state:
64.4%
Percentage of households with unmarried partners: This city:
6.3%Whole state:
7.7%
Likely homosexual households (counted as self-reported same-sex unmarried-partner households)
Lesbian couples: 0.3% of all households Gay men: 0.2% of all households
People in group quarters in Pullman in 2010:
5,738 people in college/university student housing
21 people in group homes intended for adults
18 people in nursing facilities/skilled-nursing facilities
9 people in other noninstitutional facilities
2 people in workers' group living quarters and job corps centers
People in group quarters in Pullman in 2000:
4,806 people in college dormitories (includes college quarters off campus)
51 people in other nonhousehold living situations
36 people in nursing homes
34 people in other group homes
15 people in other workers' dormitories
3 people in homes for the mentally ill
3 people in other noninstitutional group quarters
2 people in agriculture workers' dormitories on farms
Arena or stadium:
Beasley Coliseum. Washington State University.
Banks with branches in Pullman (2011 data):
U.S. Bank National Association: Washington State University Pullman at Compton Union Bldg, 1500 Ne Terrell Mall, branch established on 2008/08/11; Pullman Branch at 301 East Main Street, branch established on 1964/03/02. Info updated 2012/01/30: Bank assets: $330,470.8 mil, Deposits: $236,091.5 mil, headquarters in Cincinnati, OH, positive income , 3121 total offices , Holding Company: U.S. Bancorp
AmericanWest Bank: Pullman South Grand Financial Center at 1300 South Grand, branch established on 1973/09/13; Pullman Financial Center at 300 East Main, branch established on 1997/05/19. Info updated 2011/12/12: Bank assets: $2,274.6 mil, Deposits: $1,889.1 mil, headquarters in Spokane, WA, positive income , Commercial Lending Specialization, 76 total offices , Holding Company: Skbhc Holdings Llc
JPMorgan Chase Bank, National Association: Pullman Branch at 205 North Grand Avenue, branch established on 1964/11/18. Info updated 2011/11/10: Bank assets: $1,811,678.0 mil, Deposits: $1,190,738.0 mil, headquarters in Columbus, OH, positive income , International Specialization, 5577 total offices , Holding Company: Jpmorgan Chase & Co.
Bank of America, National Association: Pullman Branch at 425 East Main Street, branch established on 1940/11/01. Info updated 2009/11/18: Bank assets: $1,451,969.3 mil, Deposits: $1,077,176.8 mil, headquarters in Charlotte, NC, positive income , 5782 total offices , Holding Company: Bank Of America Corporation
Washington Trust Bank: Pullman Branch at 597 Se Bishop Blvd.,, branch established on 2011/11/02. Info updated 2009/02/17: Bank assets: $4,172.4 mil, Deposits: $3,522.4 mil, headquarters in Spokane, WA, positive income , Commercial Lending Specialization, 41 total offices , Holding Company: W.T.b. Financial Corporation
Columbia State Bank: Pullman Branch at 795 Southeast Bishop Boulevard, branch established on 1999/03/01. Info updated 2011/08/09: Bank assets: $4,785.2 mil, Deposits: $3,892.8 mil, headquarters in Tacoma, WA, positive income , Commercial Lending Specialization, 104 total offices , Holding Company: Columbia Banking System, Inc.
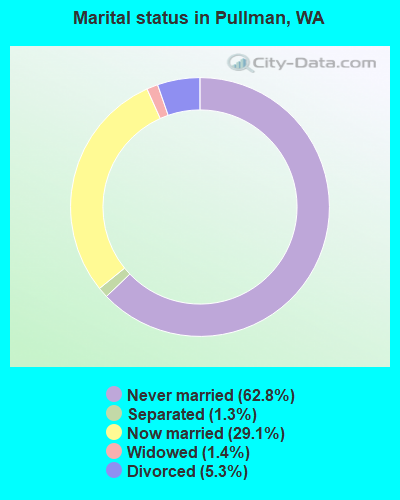
For population 15 years and over in Pullman:
Never married: 62.8%Now married: 29.1%Separated: 1.3%Widowed: 1.4%Divorced: 5.3% For population 25 years and over in Pullman:
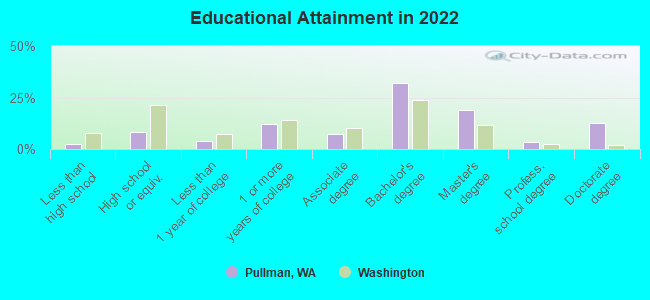
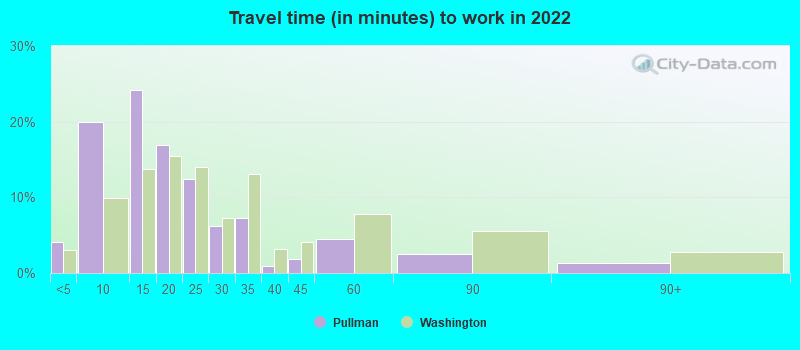
High school or higher: 97.8%Bachelor's degree or higher: 64.8%Graduate or professional degree: 32.9%Unemployed: 12.3%Mean travel time to work (commute): 11.1 minutes
Education Gini index (Inequality in education) Here:
10.3Washington average:
11.6
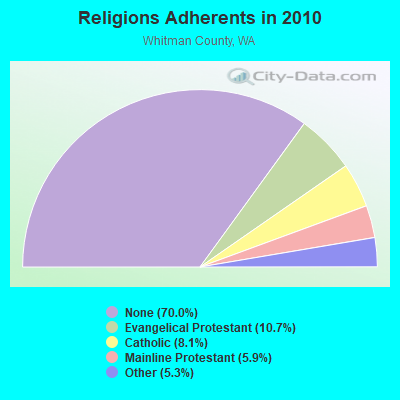
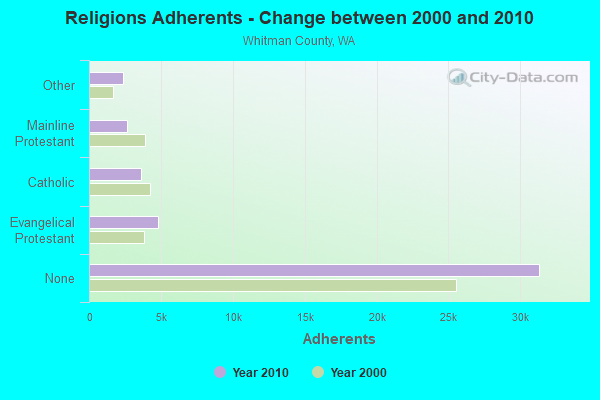
Religion statistics for Pullman, WA (based on Whitman County data)
Religion Adherents Congregations Evangelical Protestant 4,782 35 Catholic 3,628 9 Mainline Protestant 2,644 20 Other 2,388 10 None 31,334 -
Source: Clifford Grammich, Kirk Hadaway, Richard Houseal, Dale E.Jones, Alexei Krindatch, Richie Stanley and Richard H.Taylor. 2012. 2010 U.S.Religion Census: Religious Congregations & Membership Study. Association of Statisticians of American Religious Bodies. Jones, Dale E., et al. 2002. Congregations and Membership in the United States 2000. Nashville, TN: Glenmary Research Center. Graphs represent county-level data
Food Environment Statistics: Number of grocery stores : 12This county :
2.94 / 10,000 pop.Washington :
2.06 / 10,000 pop.
Number of convenience stores (no gas) : 3Here :
0.74 / 10,000 pop.State :
1.18 / 10,000 pop.
Number of convenience stores (with gas) : 8This county :
1.96 / 10,000 pop.Washington :
2.67 / 10,000 pop.
Number of full-service restaurants : 32Whitman County :
7.85 / 10,000 pop.Washington :
8.26 / 10,000 pop.
Adult diabetes rate : This county :
5.4%Washington :
7.7%
Adult obesity rate : Whitman County :
24.1%State :
25.7%
Low-income preschool obesity rate : Whitman County :
8.1%Washington :
13.9%
Health and Nutrition: Healthy diet rate : This city:
51.4%Washington:
49.9%
Average overall health of teeth and gums : Pullman:
55.4%Washington:
47.2%
People feeling badly about themselves : This city:
17.4%Washington:
20.9%
People not drinking alcohol at all : This city:
9.0%Washington:
10.5%
Average hours sleeping at night : Pullman:
6.9Washington:
6.8
Overweight people : Pullman:
23.2%Washington:
32.8%
General health condition : Average condition of hearing : More about Health and Nutrition of Pullman, WA Residents
Local government employment and payroll (March 2022)
Function
Full-time employees
Monthly full-time payroll
Average yearly full-time wage
Part-time employees
Monthly part-time payroll
Firefighters
43 $357,060 $99,645 18 $16,544 Police Protection - Officers
34 $310,714 $109,664 0 $0 Other Government Administration
29 $146,174 $60,486 0 $0 Transit
19 $105,927 $66,901 20 $83,548 Parks and Recreation
18 $81,910 $54,607 59 $35,639 Streets and Highways
17 $97,434 $68,777 0 $0 Financial Administration
15 $92,545 $74,036 1 $112 Other and Unallocable
12 $63,070 $63,070 0 $0 Local Libraries
9 $51,002 $68,003 15 $24,451 Police - Other
9 $52,554 $70,072 0 $0 Water Supply
9 $51,085 $68,113 2 $2,642 Sewerage
9 $25,404 $33,872 2 $4,440 Airports
5 $32,760 $78,624 6 $5,035 Fire - Other
2 $22,440 $134,640 0 $0 Housing and Community Development (Local)
1 $7,680 $92,160 0 $0
Totals for Government
231 $1,497,757 $77,806 123 $172,411
Pullman government finances - Expenditure in 2018 (per resident):
Construction - Regular Highways: $2,152,000 ($66.20)
Parks and Recreation: $36,000 ($1.11)Miscellaneous Commercial Activities - Other: $21,000 ($0.65)Current Operations - Police Protection: $6,028,000 ($185.43)
Sewerage: $4,207,000 ($129.41)Transit Utilities: $4,131,000 ($127.08)Local Fire Protection: $3,877,000 ($119.26)Parks and Recreation: $3,349,000 ($103.02)Water Utilities: $3,202,000 ($98.50)Health - Other: $2,187,000 ($67.28)Regular Highways: $1,953,000 ($60.08)Libraries: $1,393,000 ($42.85)Central Staff Services: $791,000 ($24.33)Protective Inspection and Regulation - Other: $750,000 ($23.07)Air Transportation: $722,000 ($22.21)General - Other: $688,000 ($21.16)Financial Administration: $627,000 ($19.29)Natural Resources - Other: $241,000 ($7.41)Miscellaneous Commercial Activities - Other: $113,000 ($3.48)Judicial and Legal Services: $84,000 ($2.58)Housing and Community Development: $34,000 ($1.05)Correctional Institutions: $3,000 ($0.09)General - Interest on Debt: $199,000 ($6.12)
Intergovernmental to Local - Other - Police Protection: $347,000 ($10.67)
Other - Air Transportation: $300,000 ($9.23)Other - General - Other: $231,000 ($7.11)Other - Central Staff Services: $71,000 ($2.18)Other - Health - Other: $9,000 ($0.28)Other - Parks and Recreation: $8,000 ($0.25)Other Capital Outlay - Sewerage: $1,880,000 ($57.83)
Air Transportation: $1,498,000 ($46.08)General - Other: $1,319,000 ($40.57)Water Utilities: $315,000 ($9.69)Natural Resources - Other: $104,000 ($3.20)Local Fire Protection: $69,000 ($2.12)Parks and Recreation: $55,000 ($1.69)Police Protection: $34,000 ($1.05)Libraries: $5,000 ($0.15)Total Salaries and Wages: $16,010,000 ($492.49)
Water Utilities - Interest on Debt: $84,000 ($2.58)
Pullman government finances - Revenue in 2018 (per resident):
Charges - Sewerage: $7,278,000 ($223.88)
Other: $2,600,000 ($79.98)Parks and Recreation: $1,459,000 ($44.88)Air Transportation: $911,000 ($28.02)Regular Highways: $100,000 ($3.08)Miscellaneous Commercial Activities: $34,000 ($1.05)Federal Intergovernmental - Air Transportation: $39,456,000 ($1213.73)
Other: $19,000 ($0.58)Local Intergovernmental - Other: $187,000 ($5.75)
Miscellaneous - Donations From Private Sources: $2,104,000 ($64.72)
Rents: $233,000 ($7.17)General Revenue - Other: $125,000 ($3.85)Fines and Forfeits: $70,000 ($2.15)Interest Earnings: $0 ($0.00)Revenue - Water Utilities: $5,622,000 ($172.94)
Transit Utilities: $2,341,000 ($72.01)State Intergovernmental - Other: $3,943,000 ($121.29)
Highways: $1,370,000 ($42.14)General Local Government Support: $435,000 ($13.38)Health and Hospitals: $16,000 ($0.49)Tax - Property: $7,629,000 ($234.68)
General Sales and Gross Receipts: $5,791,000 ($178.14)Public Utilities Sales: $2,911,000 ($89.55)Occupation and Business License - Other: $2,441,000 ($75.09)Other License: $685,000 ($21.07)Other Selective Sales: $669,000 ($20.58)Amusements Sales: $620,000 ($19.07)Documentary and Stock Transfer: $416,000 ($12.80)
Pullman government finances - Debt in 2018 (per resident):
Long Term Debt - Beginning Outstanding - Unspecified Public Purpose: $9,364,000 ($288.05)
Outstanding Unspecified Public Purpose: $8,093,000 ($248.95)Retired Unspecified Public Purpose: $1,271,000 ($39.10)
Pullman government finances - Cash and Securities in 2018 (per resident):
Other Funds - Cash and Securities: $20,000 ($0.62)
Businesses in Pullman, WA
Name Count Name Count
Ace Hardware 1 Nike 1 Arby's 1 Panda Express 1 Baskin-Robbins 1 Pizza Hut 1 Blockbuster 1 Quality 1 Budget Car Rental 1 Quiznos 1 Chevrolet 1 RadioShack 1 Dairy Queen 1 Rite Aid 1 Dennys 1 Safeway 1 FedEx 3 Sprint Nextel 1 Ford 1 Starbucks 2 GNC 1 T-Mobile 1 H&R Block 1 Toyota 1 Holiday Inn 1 U-Haul 1 Jack In The Box 1 UPS 3 Little Caesars Pizza 1 Vons 1 MasterBrand Cabinets 1 Walmart 1 McDonald's 2 YMCA 1
Strongest AM radio stations in Pullman:
KQQQ (1150 AM; 25 kW; PULLMAN, WA; Owner: RADIO PALOUSE, INC.)
KWSU (1250 AM; 5 kW; PULLMAN, WA; Owner: WASHINGTON STATE UNIVERSITY)
KMAX (840 AM; 10 kW; COLFAX, WA; Owner: PALOUSE COUNTRY, INC.)
KRPL (1400 AM; 1 kW; MOSCOW, ID; Owner: KRPL, INCORPORATED)
KGA (1510 AM; 50 kW; SPOKANE, WA; Owner: CITADEL BROADCASTING COMPANY)
KOZE (950 AM; 5 kW; LEWISTON, ID; Owner: 4-K RADIO, INC.)
KRLC (1350 AM; 5 kW; CLARKSTON LEWISTON,, WA; Owner: IDA-VEND COMPANY, INC.)
KXLY (920 AM; 20 kW; SPOKANE, WA; Owner: SPOKANE RADIO, INC.)
KTBI (810 AM; daytime; 50 kW; EPHRATA, WA; Owner: TACOMA BROADCASTERS, INCORPORATED)
KCLK (1430 AM; 5 kW; ASOTIN, WA; Owner: CLARKSTON BROADCASTERS, INC.)
KMJY (700 AM; 10 kW; NEWPORT, WA; Owner: JAMES E. AND HELEN G. STARGEL)
KCLX (1450 AM; 1 kW; COLFAX, WA; Owner: PALOUSE COUNTRY, INC.)
KERR (750 AM; 50 kW; POLSON, MT; Owner: ANDERSON RADIO BROADCASTING, INC.)
Strongest FM radio stations in Pullman:
KZUU (90.7 FM; PULLMAN, WA; Owner: WASHINGTON STATE UNIV.)
KRAO-FM (102.5 FM; COLFAX, WA; Owner: PALOUSE COUNTRY, INC.)
KHTR (104.3 FM; PULLMAN, WA; Owner: RADIO PALOUSE, INC.)
KRLF (88.5 FM; PULLMAN, WA; Owner: LIVING FAITH F/SHIP EDUC. MINISTRIES)
KZZL-FM (99.5 FM; PULLMAN, WA; Owner: PALOUSE COUNTRY, INC.)
KZFN (106.1 FM; MOSCOW, ID; Owner: KRPL, INC.)
KRFA-FM (91.7 FM; MOSCOW, ID; Owner: WASHINGTON STATE UNIVERSITY)
KCLK-FM (94.1 FM; CLARKSTON, WA; Owner: CLARKSTON BROADCASTERS, INC.)
KMOK (106.9 FM; LEWISTON, ID; Owner: IDA-VEND COMPANY, INC.)
KVAB (102.9 FM; CLARKSTON, WA; Owner: CLARKSTON BROADCASTERS, INC.)
KNWV (90.5 FM; CLARKSTON, WA; Owner: WASHINGTON STATE UNIVERSITY)
KVTY (105.1 FM; LEWISTON, ID; Owner: IDAVEND CO. INC.)
KOZE-FM (96.5 FM; LEWISTON, ID; Owner: 4-K RADIO, INC.)
KATW (101.5 FM; LEWISTON, ID; Owner: PACIFIC EMPIRE COMMUNICATIONS CORP.)
KDRK-FM (93.7 FM; SPOKANE, WA; Owner: CITADEL BROADCASTING COMPANY)
KIXZ-FM (96.1 FM; OPPORTUNITY, WA; Owner: CAPSTAR TX LIMITED PARTNERSHIP)
KPBX-FM (91.1 FM; SPOKANE, WA; Owner: SPOKANE PUBLIC RADIO, INC.)
KMBI-FM (107.9 FM; SPOKANE, WA; Owner: THE MOODY BIBLE INSTITUTE OF CHICAGO)
KCDA (103.1 FM; POST FALLS, ID; Owner: CAPSTAR TX LIMITED PARTNERSHIP)
KNWO (90.1 FM; COTTONWOOD, ID; Owner: WASHINGTON STATE UNIVERSITY)
TV broadcast stations around Pullman:
KUID-TV (Channel 12; MOSCOW, ID; Owner: STATE BOARD OF EDUCATION, STATE OF IDAHO)
KWSU-TV (Channel 10; PULLMAN, WA; Owner: WASHINGTON STATE UNIVERSITY)
KLEW-TV (Channel 3; LEWISTON, ID; Owner: FISHER BROADCASTING - WASHINGTON TV, L.L.C.)
K40EE (Channel 40; PULLMAN, WA; Owner: SPOKANE TELEVISION, INC.)
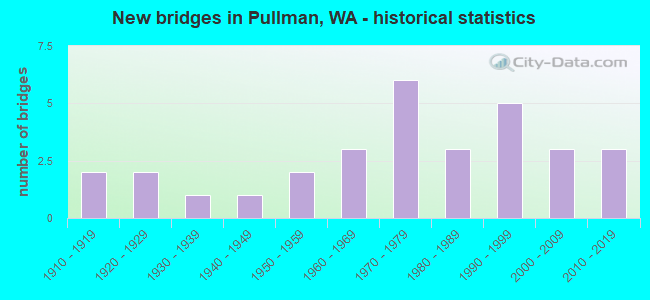
National Bridge Inventory (NBI) Statistics 31 Number of bridges194ft / 59.4m Total length $41,454,000 Total costs130,850 Total average daily traffic5,412 Total average daily truck traffic177,499 Total future (year 2036) average daily traffic
New bridges - historical statistics
2 1910-1919 2 1920-1929 1 1930-1939 1 1940-1949 2 1950-1959 3 1960-1969 6 1970-1979 3 1980-1989 5 1990-1999 3 2000-2009 3 2010-2019
See full National Bridge Inventory statistics for Pullman, WA
Most common first names in Pullman, WA among deceased individuals Name Count Lived (average)
John 94 75.9 years Mary 88 79.7 years Robert 76 74.5 years William 72 75.1 years James 68 78.7 years Dorothy 54 79.4 years Margaret 48 83.2 years Charles 44 76.2 years George 40 76.9 years Ruth 40 79.5 years
Most common last names in Pullman, WA among deceased individuals Last name Count Lived (average)
Johnson 38 79.3 years Smith 36 79.8 years Hatley 32 77.2 years Anderson 26 77.5 years Brown 22 83.4 years Campbell 22 83.6 years Davis 22 83.5 years Miller 21 75.9 years Clark 20 82.4 years Williams 20 72.8 years
Pullman compared to Washington state average:
Median household income below state average. Median age significantly below state average. Renting percentage above state average. Length of stay since moving in above state average. Number of rooms per house below state average. Number of college students significantly above state average. Percentage of population with a bachelor's degree or higher significantly above state average.
#8 on the list of "Top 101 cities where the highest percentage of males (15+ years) which never married (with at least 10,000 males in this group)"
#22 on the list of "Top 101 cities with largest percentage of females in industries: educational services (population 5,000+)"
#23 on the list of "Top 101 cities with the lowest percentage of family households, population 10,000+"
#24 on the list of "Top 101 cities with largest percentage of males in industries: educational services (population 5,000+)"
#26 on the list of "Top 101 cities with the least people living the same house as 1 year ago (population 5,000+))"
#35 on the list of "Top 101 cities with largest percentage of males in occupations: education, training, and library occupations (population 5,000+)"
#48 on the list of "Top 101 cities with the largest household incomes disparities (population 5,000+)"
#51 on the list of "Top 101 cities with the most people walking to work (population 5,000+)"
#59 on the list of "Top 101 cities where the highest percentage of males (15+ years) which never married (with at least 1,000 males in this group)"
#62 on the list of "Top 101 cities where the highest percentage of females (15+ years) which never married (with at least 1,000 females in this group)"
#63 on the list of "Top 101 cities with the lowest percentage of family households, population 1,000+"
#63 on the list of "Top 101 cities with the most people having Doctorate degrees (population 500+)"
#64 on the list of "Top 101 cities with the most recent year of entry for the foreign-born population (2,000+ people)+"
#83 on the list of "Top 101 cities with the most people having Master's or Doctorate degrees (population 5,000+)"
#86 on the list of "Top 101 cities with the smallest percentage of divorced people (15+ years)(population 5,000+)"
#90 on the list of "Top 100 cities with highest percentage of renters (pop. 5,000+)"
#94 on the list of "Top 101 cities with largest percentage of females in occupations: education, training, and library occupations (population 5,000+)"
#97 on the list of "Top 101 cities with the least people driving a car to work alone (population 5,000+)"
#99 on the list of "Top 100 cities with highest ratio of median house value to median household income (pop. 5,000+)"
#30 on the list of "Top 101 counties with the highest percentage of residents relocating to other counties in 2011"
#61 on the list of "Top 101 counties with the highest percentage of residents relocating from other counties between 2010 and 2011"
#84 on the list of "Top 101 counties with the highest percentage of residents relocating to foreign countries in 2011"
Top Patent Applicants
Edmund O. Schweitzer, Iii (41)
David E. Whitehead (30)
Armando Guzman-Casillas (27)
Shulin Chen (16)
Shankar V. Achanta (16)
Mangapathirao Venkata Mynam (13)
Gregary C. Zweigle (13)
Ryan Bradetich (13)
David J. Dolezilek (12)
Marcos A. Donolo (11)
Total of 492 patent applications in 2008-2024.


 Recent articles from our blog. Our writers, many of them Ph.D. graduates or candidates, create easy-to-read articles on a wide variety of topics.

 , pop. 89,755).
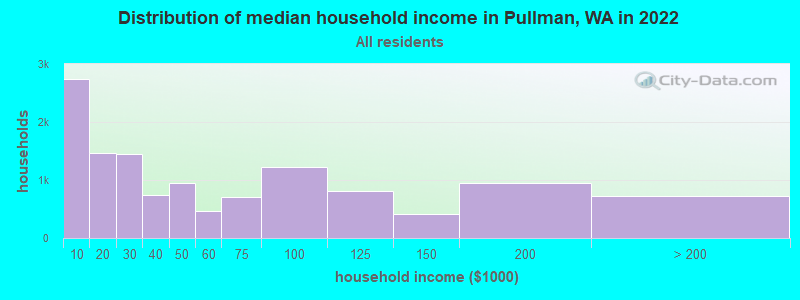


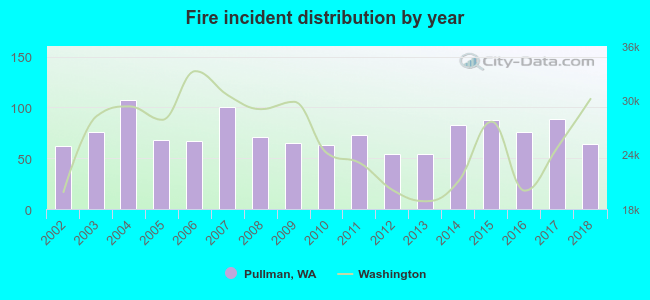 Based on the data from the years 2002 - 2018 the average number of fire incidents per year is 74. The highest number of reported fire incidents - 107 took place in 2004, and the least - 54 in 2012. The data has an increasing trend.
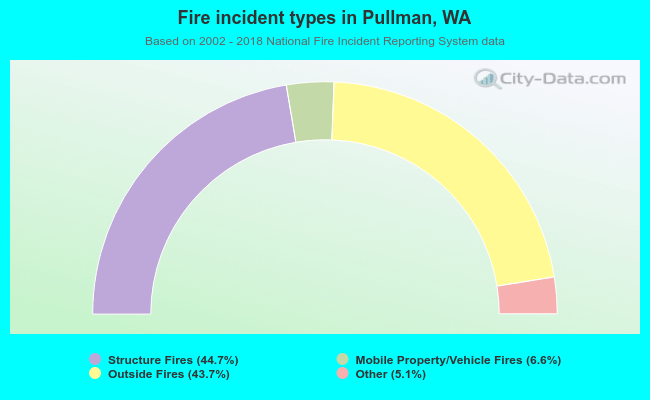 When looking into fire subcategories, the most reports belonged to: Structure Fires (44.7%), and Outside Fires (43.7%).