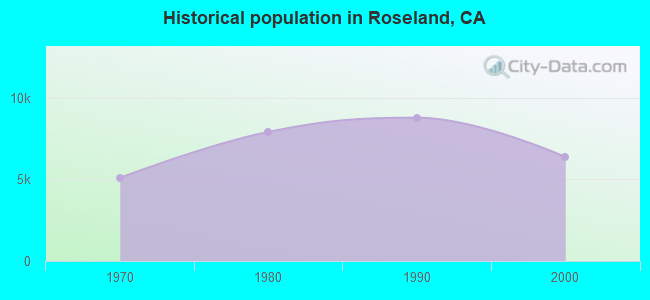
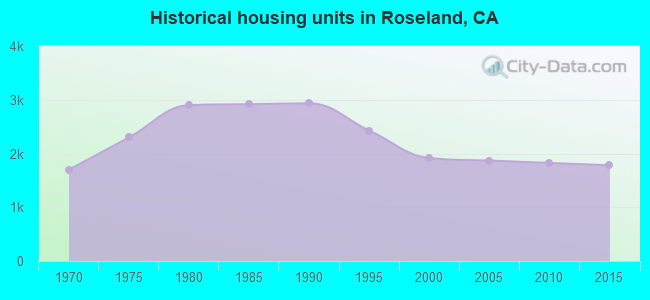
Roseland, California
Submit your own pictures of this place and show them to the world
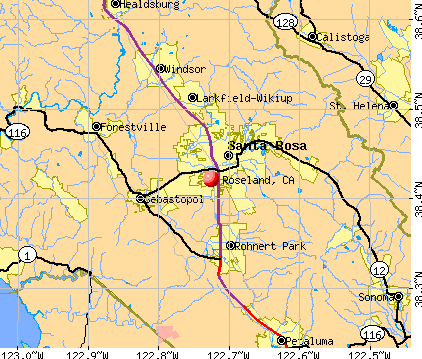
- OSM Map
- General Map
- Google Map
- MSN Map
Population change since 2000: -0.7%
| Males: 3,362 | |
| Females: 2,963 |
| Median resident age: | 34.7 years |
| California median age: | 37.9 years |
Zip codes: 95407.
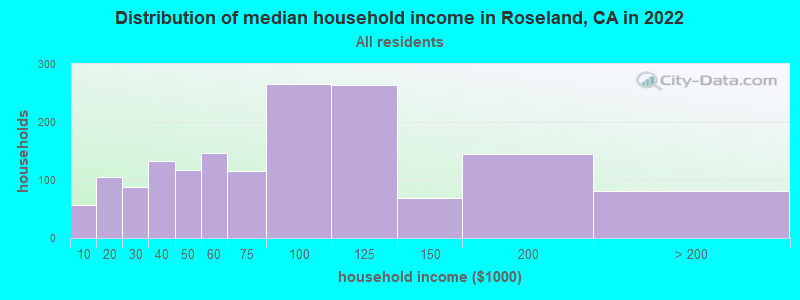
| Roseland: | $83,839 |
| CA: | $91,551 |
Estimated per capita income in 2022: $30,328 (it was $14,577 in 2000)
Roseland CDP income, earnings, and wages data
Estimated median house or condo value in 2022: $531,734 (it was $182,900 in 2000)
| Roseland: | $531,734 |
| CA: | $715,900 |
Mean prices in 2022: all housing units: $971,202; detached houses: over $1,000,000; townhouses or other attached units: $701,850; in 2-unit structures: $931,567; in 3-to-4-unit structures: $469,463; in 5-or-more-unit structures: $470,417; mobile homes: $233,424; occupied boats, rvs, vans, etc.: $75,587
Median gross rent in 2022: $1,991.
(12.0% for White Non-Hispanic residents, 4.9% for Hispanic or Latino residents, 28.0% for American Indian residents, 5.9% for other race residents, 55.0% for two or more races residents)
Detailed information about poverty and poor residents in Roseland, CA


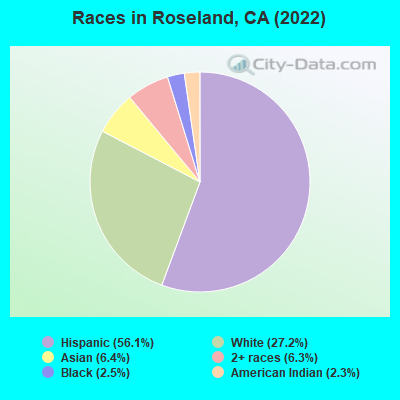
- 3,28656.1%Hispanic
- 1,59227.2%White alone
- 3726.4%Asian alone
- 3676.3%Two or more races
- 1452.5%Black alone
- 1372.3%American Indian alone
 Recent articles from our blog. Our writers, many of them Ph.D. graduates or candidates, create easy-to-read articles on a wide variety of topics.

 | Is Santa Rosa a good place to live? (4 replies) |
| Things You Should Know Before Moving to Sonoma County (49 replies) |
| Was West Windsor, Sonoma County dangerous at one point? (2 replies) |
| Moving to Santa Rosa, CA (31 replies) |
| Looking at Roseland, (2 replies) |
| Considering Oakmont Village in Santa Rosa.............. (9 replies) |
Latest news from Roseland, CA collected exclusively by city-data.com from local newspapers, TV, and radio stations
Ancestries: Ethiopian (2.8%), Italian (2.1%), American (2.0%), Irish (1.6%), German (1.5%), Portuguese (1.2%).
Current Local Time: PST time zone
Elevation: 135 feet
Land area: 1.06 square miles.
Population density: 5,991 people per square mile (average).
1,880 residents are foreign born (25.9% Latin America, 4.8% Asia).
| This place: | 32.4% |
| California: | 100.0% |
Median real estate property taxes paid for housing units with mortgages in 2022: $5,252 (0.8%)
Median real estate property taxes paid for housing units with no mortgage in 2022: $4,535 (0.7%)
Nearest city with pop. 50,000+: Santa Rosa, CA  (2.2 miles , pop. 147,595).
Nearest city with pop. 200,000+: West Contra Costa, CA (39.1 miles , pop. 236,008).
Nearest city with pop. 1,000,000+: Los Angeles, CA (385.6 miles , pop. 3,694,820).
Nearest cities:
), ), ), )Latitude: 38.42 N, Longitude: 122.73 W
Daytime population change due to commuting: -2,059 (-35.4%)
Workers who live and work in this place: 201 (6.5%)
Area code commonly used in this area: 707
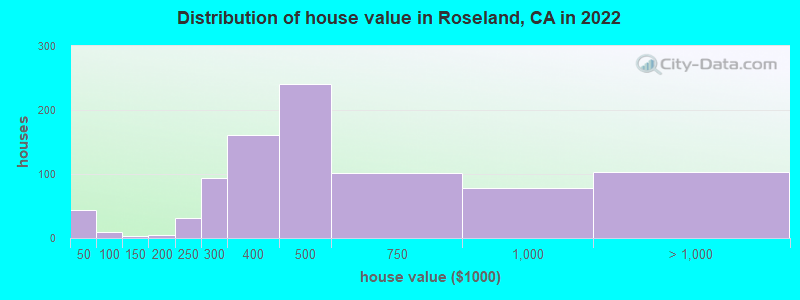
Property values in Roseland, CA
| Here: | 3.8% |
| California: | 5.1% |
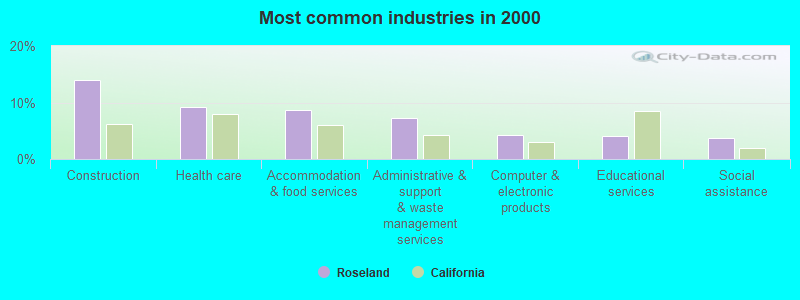
- Construction (14.0%)
- Health care (9.3%)
- Accommodation & food services (8.6%)
- Administrative & support & waste management services (7.2%)
- Computer & electronic products (4.2%)
- Educational services (4.1%)
- Social assistance (3.7%)
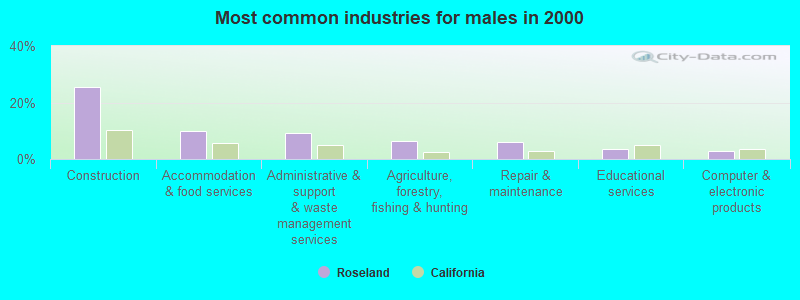
- Construction (25.4%)
- Accommodation & food services (9.8%)
- Administrative & support & waste management services (9.3%)
- Agriculture, forestry, fishing & hunting (6.3%)
- Repair & maintenance (6.2%)
- Educational services (3.6%)
- Computer & electronic products (2.8%)
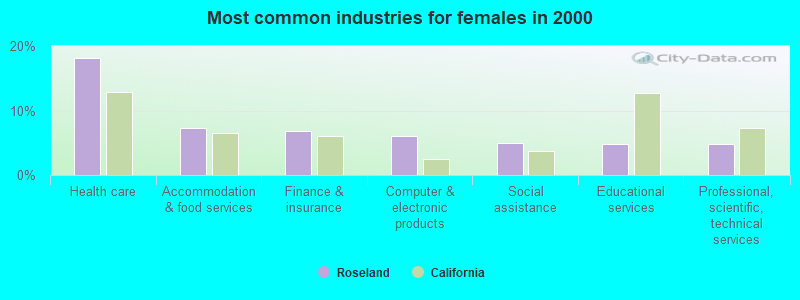
- Health care (18.1%)
- Accommodation & food services (7.2%)
- Finance & insurance (6.9%)
- Computer & electronic products (6.0%)
- Social assistance (5.0%)
- Educational services (4.8%)
- Professional, scientific, technical services (4.8%)
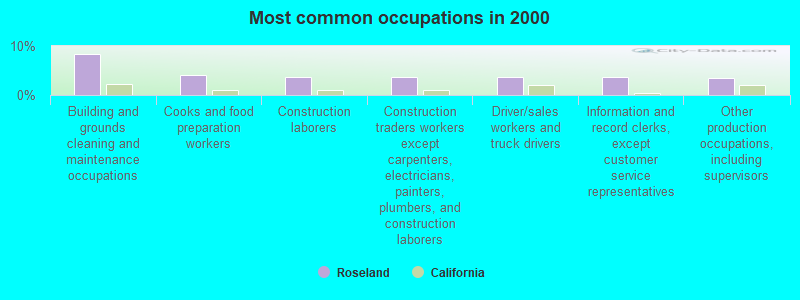
- Building and grounds cleaning and maintenance occupations (8.4%)
- Cooks and food preparation workers (4.1%)
- Construction laborers (3.7%)
- Construction traders workers except carpenters, electricians, painters, plumbers, and construction laborers (3.7%)
- Driver/sales workers and truck drivers (3.7%)
- Information and record clerks, except customer service representatives (3.7%)
- Other production occupations, including supervisors (3.5%)
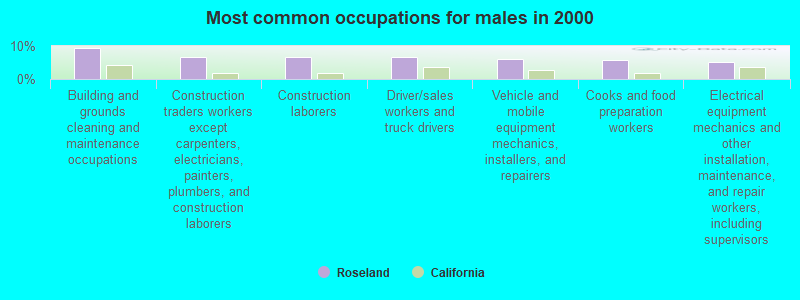
- Building and grounds cleaning and maintenance occupations (9.5%)
- Construction traders workers except carpenters, electricians, painters, plumbers, and construction laborers (6.8%)
- Construction laborers (6.8%)
- Driver/sales workers and truck drivers (6.7%)
- Vehicle and mobile equipment mechanics, installers, and repairers (6.0%)
- Cooks and food preparation workers (5.8%)
- Electrical equipment mechanics and other installation, maintenance, and repair workers, including supervisors (5.3%)
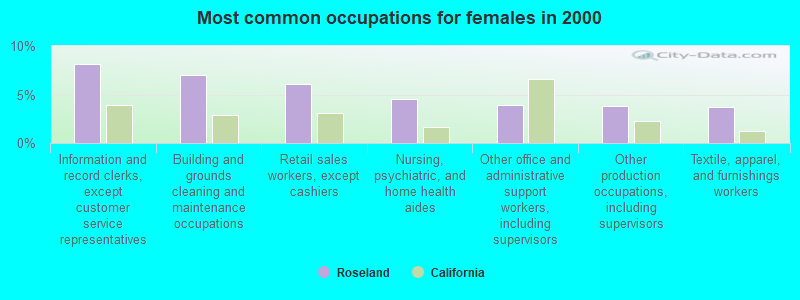
- Information and record clerks, except customer service representatives (8.2%)
- Building and grounds cleaning and maintenance occupations (7.1%)
- Retail sales workers, except cashiers (6.1%)
- Nursing, psychiatric, and home health aides (4.5%)
- Other office and administrative support workers, including supervisors (3.9%)
- Other production occupations, including supervisors (3.8%)
- Textile, apparel, and furnishings workers (3.7%)
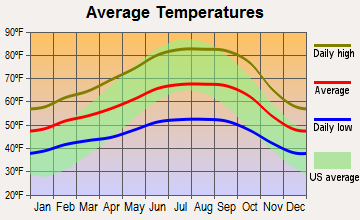
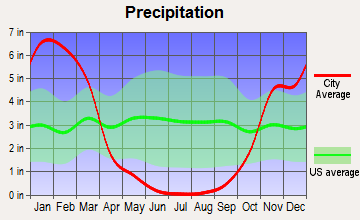
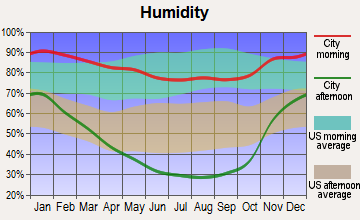
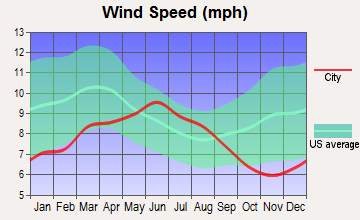
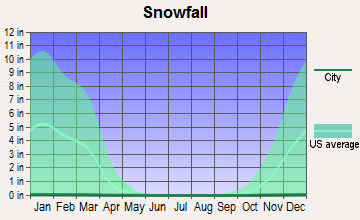
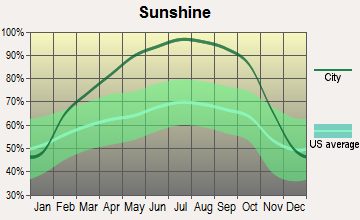
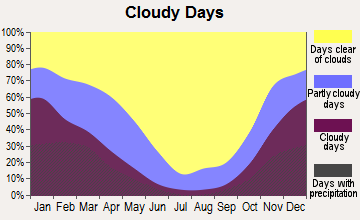
Average climate in Roseland, California
Based on data reported by over 4,000 weather stations
(lower is better)
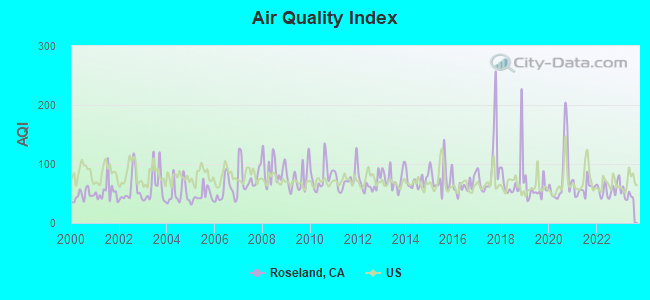
Air Quality Index (AQI) level in 2023 was 47.4. This is significantly better than average.
| City: | 47.4 |
| U.S.: | 72.6 |
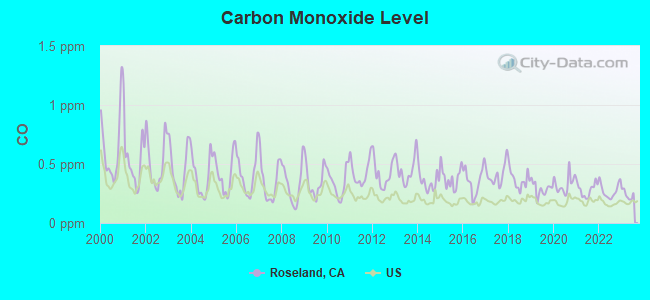
Carbon Monoxide (CO) [ppm] level in 2023 was 0.241. This is about average. Closest monitor was 1.4 miles away from the city center.
| City: | 0.241 |
| U.S.: | 0.251 |
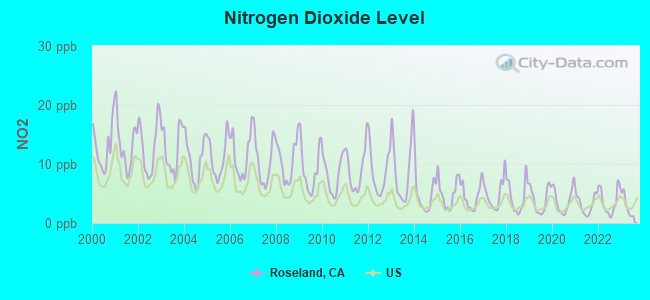
Nitrogen Dioxide (NO2) [ppb] level in 2023 was 2.89. This is significantly better than average. Closest monitor was 1.4 miles away from the city center.
| City: | 2.89 |
| U.S.: | 5.11 |
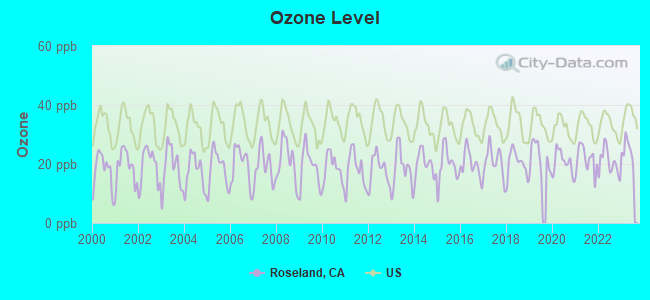
Ozone [ppb] level in 2023 was 24.7. This is better than average. Closest monitor was 1.6 miles away from the city center.
| City: | 24.7 |
| U.S.: | 33.3 |
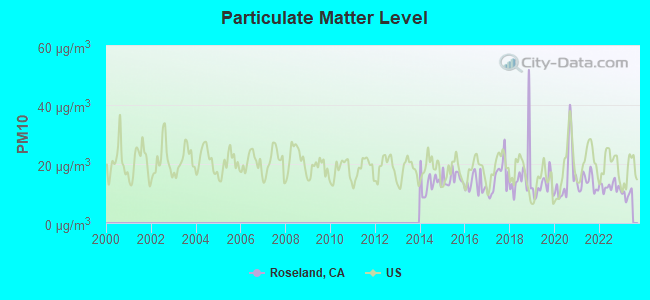
Particulate Matter (PM10) [µg/m3] level in 2022 was 12.3. This is significantly better than average. Closest monitor was 1.7 miles away from the city center.
| City: | 12.3 |
| U.S.: | 19.2 |
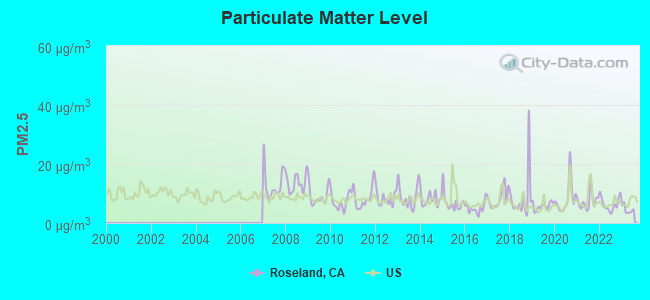
Particulate Matter (PM2.5) [µg/m3] level in 2023 was 4.56. This is significantly better than average. Closest monitor was 1.7 miles away from the city center.
| City: | 4.56 |
| U.S.: | 8.11 |
Earthquake activity:
Roseland-area historical earthquake activity is significantly above California state average. It is 7367% greater than the overall U.S. average.On 4/18/1906 at 13:12:21, a magnitude 7.9 (7.9 UK, Class: Major, Intensity: VIII - XII) earthquake occurred 32.7 miles away from Roseland center, causing $524,000,000 total damage
On 1/31/1922 at 13:17:28, a magnitude 7.6 (7.6 UK) earthquake occurred 218.1 miles away from Roseland center
On 10/18/1989 at 00:04:15, a magnitude 7.1 (6.5 MB, 7.1 MS, 6.9 MW, 7.0 ML) earthquake occurred 104.7 miles away from the city center, causing 62 deaths (62 shaking deaths) and 3757 injuries, causing $1,305,032,704 total damage
On 4/25/1992 at 18:06:04, a magnitude 7.2 (6.3 MB, 7.1 MS, 7.2 MW, 7.1 MW, Depth: 9.4 mi) earthquake occurred 151.5 miles away from Roseland center, causing $75,000,000 total damage
On 11/4/1927 at 13:51:53, a magnitude 7.5 (7.5 UK) earthquake occurred 260.1 miles away from Roseland center
On 1/22/1923 at 09:04:18, a magnitude 7.2 (7.2 UK) earthquake occurred 199.1 miles away from Roseland center
Magnitude types: body-wave magnitude (MB), local magnitude (ML), surface-wave magnitude (MS), moment magnitude (MW)
Natural disasters:
The number of natural disasters in Sonoma County (23) is greater than the US average (15).Major Disasters (Presidential) Declared: 13
Emergencies Declared: 2
Causes of natural disasters: Floods: 15, Storms: 8, Winter Storms: 7, Landslides: 6, Mudslides: 6, Fires: 4, Drought: 1, Freeze: 1, Heavy Rain: 1, Hurricane: 1, Tornado: 1, Other: 1 (Note: some incidents may be assigned to more than one category).
Hospitals and medical centers near Roseland:
- SANTA ROSA CONVALESCENT HOSP (Nursing Home, about 1 miles away; SANTA ROSA, CA)
- SATELLITE DIALYSIS SANTA ROSA (Dialysis Facility, about 2 miles away; SANTA ROSA, CA)
- WELLBOUND OF SANTA ROSA (Dialysis Facility, about 2 miles away; SANTA ROSA, CA)
- CREEKSIDE REHABILITATION AND BEHAVIORAL HEALTH (Nursing Home, about 2 miles away; SANTA ROSA, CA)
- SUTTER VISITING NURSE ASSOCIATION AND HOSPICE (Home Health Center, about 2 miles away; SANTA ROSA, CA)
- GENTIVA HEALTH SERVICES (Home Health Center, about 2 miles away; SANTA ROSA, CA)
- COOPER HOUSE (Hospital, about 2 miles away; SANTA ROSA, CA)
Amtrak stations near Roseland:
- 2 miles: SANTA ROSA (175 RAILROAD ST.) - Bus Station . Services: fully wheelchair accessible, public restrooms, public payphones, full-service food facilities, free short-term parking, call for taxi service.
- 6 miles: ROHNERT PARK (6480 REDWOOD DR.) - Bus Station . Services: fully wheelchair accessible, public restrooms, public payphones, full-service food facilities, free short-term parking, call for taxi service.
- 14 miles: PETALUMA (100 FAIRGROUNDS DR.) - Bus Station . Services: snack bar, free short-term parking, free long-term parking, call for taxi service.
Colleges/universities with over 2000 students nearest to Roseland:
- Santa Rosa Junior College (about 3 miles; Santa Rosa, CA; Full-time enrollment: 13,047)
- Sonoma State University (about 7 miles; Rohnert Park, CA; FT enrollment: 7,796)
- Napa Valley College (about 27 miles; Napa, CA; FT enrollment: 3,780)
- College of Marin (about 34 miles; Kentfield, CA; FT enrollment: 4,489)
- Solano Community College (about 36 miles; Fairfield, CA; FT enrollment: 5,790)
- Contra Costa College (about 38 miles; San Pablo, CA; FT enrollment: 4,249)
- Berkeley City College (about 46 miles; Berkeley, CA; FT enrollment: 3,146)
Points of interest:
Notable location: Santa Rosa Fire Department Station 8 (A). Display/hide its location on the map
| This place: | 3.6 people |
| California: | 2.9 people |
| This place: | 72.6% |
| Whole state: | 68.7% |
| This place: | 12.1% |
| Whole state: | 7.2% |
Likely homosexual households (counted as self-reported same-sex unmarried-partner households)
- Lesbian couples: 0.6% of all households
- Gay men: 0.5% of all households
12 people in other noninstitutional facilities in 2010
People in group quarters in Roseland in 2000:
- 97 people in other noninstitutional group quarters
- 22 people in other group homes
- 20 people in homes for the mentally retarded
- 17 people in homes or halfway houses for drug/alcohol abuse
For population 15 years and over in Roseland:
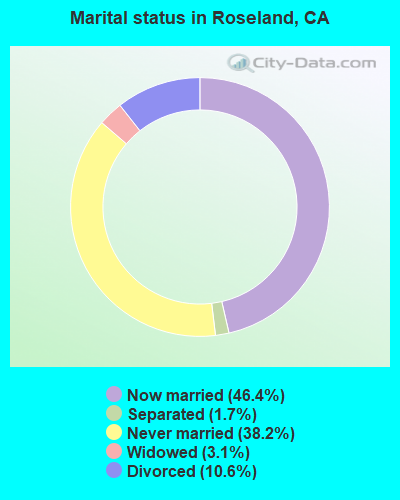
- Never married: 38.2%
- Now married: 46.4%
- Separated: 1.7%
- Widowed: 3.1%
- Divorced: 10.6%
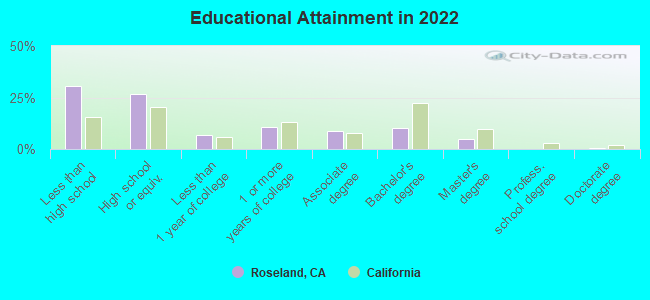
For population 25 years and over in Roseland:
- High school or higher: 66.4%
- Bachelor's degree or higher: 13.9%
- Graduate or professional degree: 4.9%
- Unemployed: 9.9%
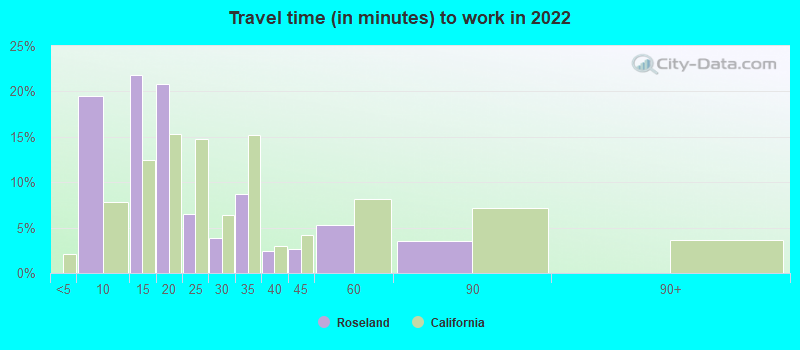
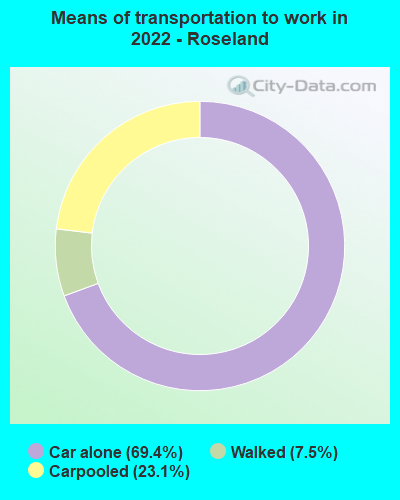
- Mean travel time to work (commute): 20.7 minutes
| Here: | 22.3 |
| California average: | 15.5 |
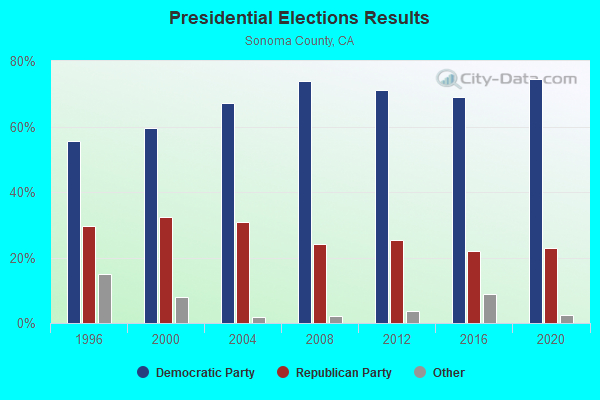

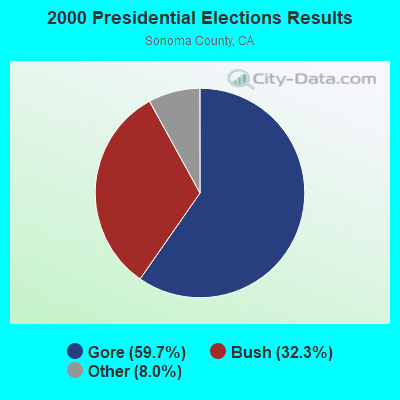
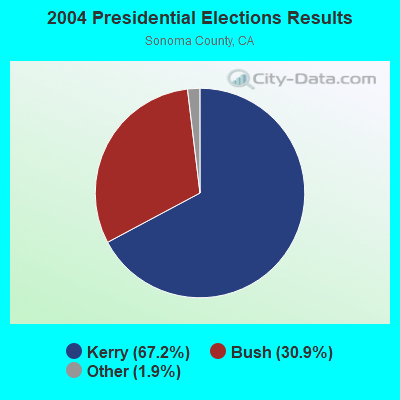

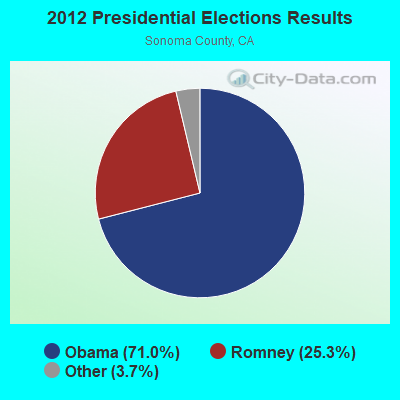
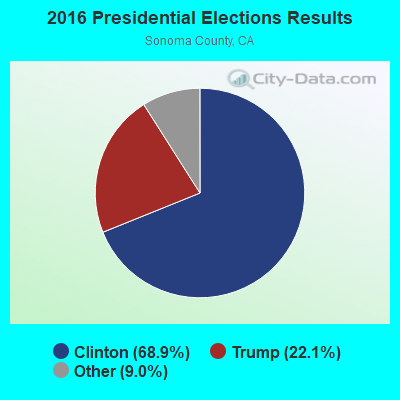
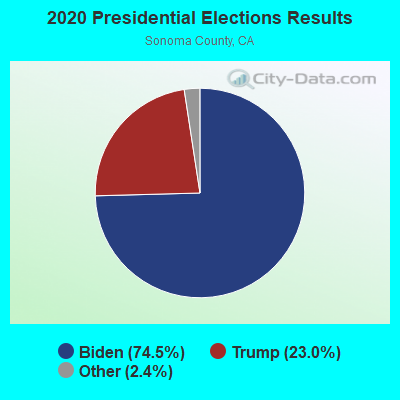
Graphs represent county-level data. Detailed 2008 Election Results
Religion statistics for Roseland, CA (based on Sonoma County data)
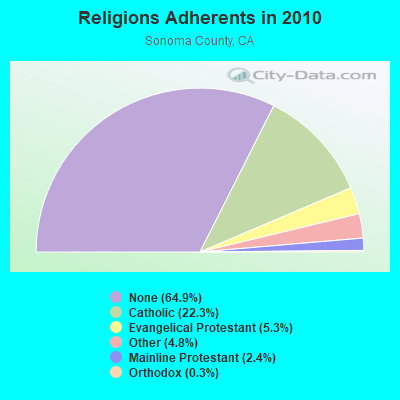
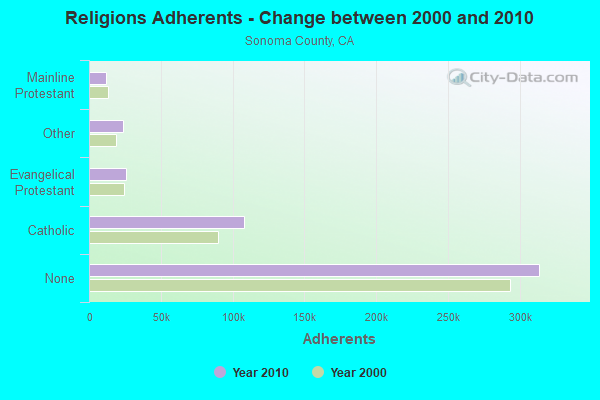
| Religion | Adherents | Congregations |
|---|---|---|
| Catholic | 107,737 | 23 |
| Evangelical Protestant | 25,820 | 159 |
| Other | 23,398 | 76 |
| Mainline Protestant | 11,546 | 49 |
| Orthodox | 1,389 | 7 |
| Black Protestant | 102 | 1 |
| None | 313,886 | - |
Food Environment Statistics:
| Sonoma County: | 2.81 / 10,000 pop. |
| California: | 2.14 / 10,000 pop. |
| This county: | 0.04 / 10,000 pop. |
| California: | 0.04 / 10,000 pop. |
| Here: | 1.02 / 10,000 pop. |
| California: | 0.62 / 10,000 pop. |
| Sonoma County: | 1.99 / 10,000 pop. |
| State: | 1.49 / 10,000 pop. |
| Sonoma County: | 10.12 / 10,000 pop. |
| State: | 7.42 / 10,000 pop. |
| Sonoma County: | 6.3% |
| California: | 7.3% |
| Sonoma County: | 19.8% |
| California: | 21.3% |
| Sonoma County: | 16.2% |
| California: | 17.9% |
Strongest AM radio stations in Roseland:
- KSRO (1350 AM; 5 kW; SANTA ROSA, CA; Owner: MAVERICK MEDIA OF SANTA ROSA LICENSE LLC)
- KCBS (740 AM; 50 kW; SAN FRANCISCO, CA; Owner: INFINITY BROADCASTING OPERATIONS, INC.)
- KRRS (1460 AM; 1 kW; SANTA ROSA, CA; Owner: MOON BROADCASTING CORPORATION)
- KTRB (860 AM; 50 kW; MODESTO, CA; Owner: PAPPAS RADIO OF CALIFORNIA, A CALIFORNIA LIMITED PARTNERSHIP)
- KNBR (680 AM; 50 kW; SAN FRANCISCO, CA; Owner: KNBR LICO, INC.)
- KIQI (1010 AM; 35 kW; SAN FRANCISCO, CA; Owner: RADIO UNICA OF SAN FRANCISCO LICENSE CORP.)
- KTCT (1050 AM; 50 kW; SAN MATEO, CA; Owner: SUSQUEHANNA RADIO CORP.)
- KNEW (910 AM; 20 kW; OAKLAND, CA; Owner: AMFM RADIO LICENSES, L.L.C.)
- KGO (810 AM; 50 kW; SAN FRANCISCO, CA; Owner: KGO-AM RADIO, INC.)
- KFAX (1100 AM; 50 kW; SAN FRANCISCO, CA; Owner: GOLDEN GATE BROADCASTING CO, INC.)
- KDYA (1190 AM; 10 kW; VALLEJO, CA; Owner: BAYBRIDGE COMMUNICATIONS, L.L.C.)
- KYCY (1550 AM; 50 kW; SAN FRANCISCO, CA; Owner: INFINITY BROADCASTING OPERATIONS, INC.)
- KHTK (1140 AM; 50 kW; SACRAMENTO, CA; Owner: INFINITY RADIO SUBSIDIARY OPERATIONS INC.)
Strongest FM radio stations in Roseland:
- KJZY (93.7 FM; SEBASTOPOL, CA; Owner: REDWOOD EMPIRE STEREOCASTERS)
- KRPQ (104.9 FM; ROHNERT PARK, CA; Owner: RESULTS RADIO OF SONOMA LP)
- K221DQ (92.1 FM; PETALUMA, CA; Owner: EDUCATIONAL MEDIA FOUNDATION)
- KZST-FM2 (100.1 FM; ROHNERT PARK PETALUM, CA; Owner: REDWOOD EMPIRE STEREOCASTERS)
- KJZY-FM1 (93.7 FM; ROHNERT PARK, CA; Owner: REDWOOD EMPIRE STEREOCASTERS)
- K202CT (88.3 FM; SANTA ROSA, CA; Owner: KQED, INC.)
- KXFX-FM1 (101.7 FM; PETALUMA, CA; Owner: MAVERICK MEDIA OF SANTA ROSA LICENSE LLC)
- KNDL (89.9 FM; ANGWIN, CA; Owner: HOWELL MOUNTAIN BROADCASTING COMPANY)
- KZST (100.1 FM; SANTA ROSA, CA; Owner: REDWOOD EMPIRE STEREOCASTERS)
- KLVR (91.9 FM; SANTA ROSA, CA; Owner: EDUCATIONAL MEDIA FOUNDATION)
- KXFX (101.7 FM; SANTA ROSA, CA; Owner: MAVERICK MEDIA OF SANTA ROSA LICENSE LLC)
- KXTS (100.9 FM; CALISTOGA, CA; Owner: SINCLAIR TELECABLE, INC.)
- KBBF (89.1 FM; SANTA ROSA, CA; Owner: BILINGUAL B/CING. FOUNDATION, INC.)
- KRPQ-FM1 (104.9 FM; BENNETT VALLEY, CA; Owner: RESULTS RADIO OF SONOMA, LP)
- KVRV (97.7 FM; MONTE RIO, CA; Owner: MAVERICK MEDIA OF SANTA ROSA LICENSE LLC)
- KMHX (104.1 FM; WINDSOR, CA; Owner: RESULTS RADIO OF SONOMA, L.P.)
- KSXY (98.7 FM; MIDDLETOWN, CA; Owner: COMMONWEALTH BROADCASTING, LLC)
- KRCB-FM (91.1 FM; SANTA ROSA, CA; Owner: RURAL CALIFORNIA BROADCASTING CORP.)
- KFGY (92.9 FM; HEALDSBURG, CA; Owner: MAVERICK MEDIA OF SANTA ROSA LICENSE LLC)
- K215CQ (90.9 FM; SANTA ROSA, CA; Owner: RURAL CALIFORNIA BROADCASTING CORP)
TV broadcast stations around Roseland:
- K30DO (Channel 30; SANTA ROSA, CA; Owner: YOUNG BROADCASTING OF SAN FRANCISCO, INC.)
- KQED (Channel 9; SAN FRANCISCO, CA; Owner: KQED, INC.)
- KRCB (Channel 22; COTATI, CA; Owner: RURAL CALIFORNIA BROADCASTING CORP.)
2005 - 2017 National Fire Incident Reporting System (NFIRS) incidents
- Fire incident types reported to NFIRS in Roseland, CA
- 11244.1%Structure Fires
- 9738.2%Outside Fires
- 3614.2%Mobile Property/Vehicle Fires
- 93.5%Other
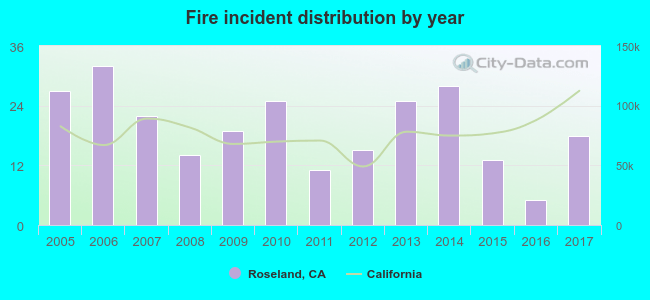 Based on the data from the years 2005 - 2017 the average number of fire incidents per year is 20. The highest number of fires - 32 took place in 2006, and the least - 5 in 2016. The data has a dropping trend.
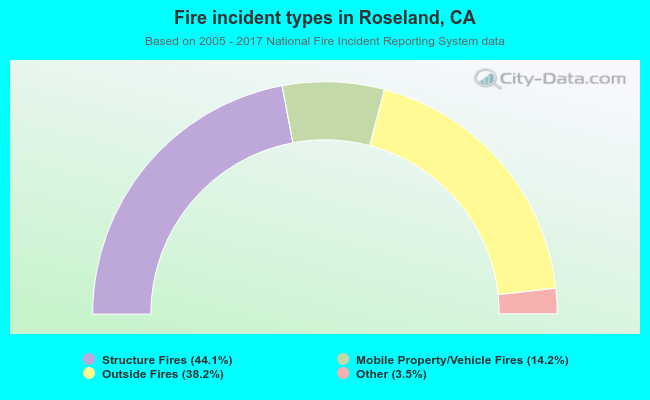 When looking into fire subcategories, the most reports belonged to: Structure Fires (44.1%), and Outside Fires (38.2%).
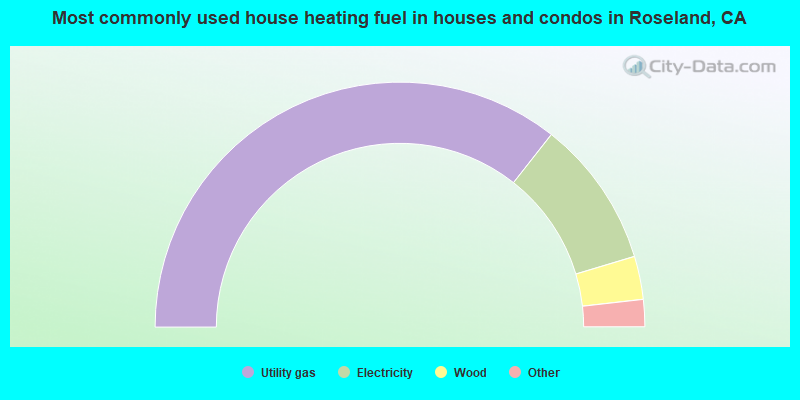
- 71.3%Utility gas
- 19.5%Electricity
- 5.7%Wood
- 2.5%Solar energy
- 1.0%No fuel used
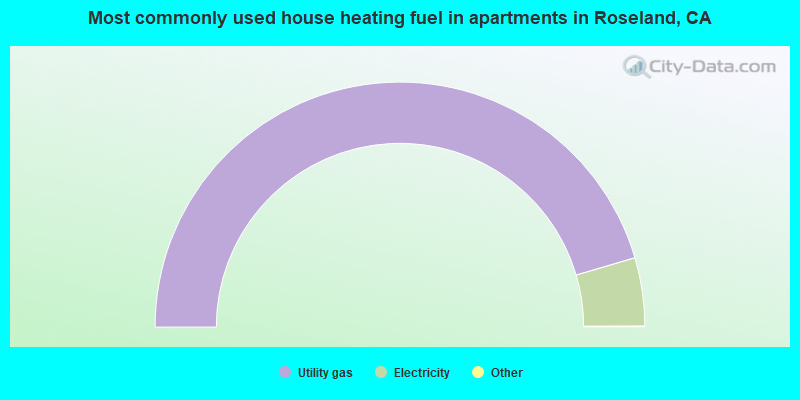
- 91.0%Utility gas
- 9.0%Electricity
Roseland compared to California state average:
- Black race population percentage below state average.
- Length of stay since moving in significantly above state average.
- Percentage of population with a bachelor's degree or higher below state average.
Roseland on our top lists:
- #39 on the list of "Top 101 cities with the largest percentage of unmarried partner households (population 5,000+)"
- #54 on the list of "Top 101 cities with largest percentage of females in occupations: transportation occupations (population 5,000+)"
- #93 on the list of "Top 101 cities with largest percentage of females in industries: transportation and warehousing (population 5,000+)"
- #5 on the list of "Top 101 counties with the lowest Ozone (1-hour) air pollution readings in 2012 (ppm)"
- #10 on the list of "Top 101 counties with the lowest Particulate Matter (PM10) Annual air pollution readings in 2012 (µg/m3)"
- #20 on the list of "Top 101 counties with the lowest number of infant deaths per 1000 residents 2007-2013 (pop. 50,000+)"
- #24 on the list of "Top 101 counties with highest percentage of residents voting for 3rd party candidates in the 2012 Presidential Election (pop. 50,000+)"
- #29 on the list of "Top 101 counties with the highest Nitrogen Dioxide air pollution readings in 2012 (ppm)"