Shippensburg, Pennsylvania Submit your own pictures of this borough and show them to the world
OSM Map
General Map
Google Map
MSN Map
OSM Map
General Map
Google Map
MSN Map
OSM Map
General Map
Google Map
MSN Map
OSM Map
General Map
Google Map
MSN Map
Please wait while loading the map...
Population in 2022: 5,529 (100% urban, 0% rural). Population change since 2000: -1.0%Males: 2,835 Females: 2,694
March 2022 cost of living index in Shippensburg: 95.7 (near average, U.S. average is 100) Percentage of residents living in poverty in 2022: 13.0%for White Non-Hispanic residents , 2.0% for Black residents )
Profiles of local businesses
Business Search - 14 Million verified businesses
Data:
Median household income ($)
Median household income (% change since 2000)
Household income diversity
Ratio of average income to average house value (%)
Ratio of average income to average rent
Median household income ($) - White
Median household income ($) - Black or African American
Median household income ($) - Asian
Median household income ($) - Hispanic or Latino
Median household income ($) - American Indian and Alaska Native
Median household income ($) - Multirace
Median household income ($) - Other Race
Median household income for houses/condos with a mortgage ($)
Median household income for apartments without a mortgage ($)
Races - White alone (%)
Races - White alone (% change since 2000)
Races - Black alone (%)
Races - Black alone (% change since 2000)
Races - American Indian alone (%)
Races - American Indian alone (% change since 2000)
Races - Asian alone (%)
Races - Asian alone (% change since 2000)
Races - Hispanic (%)
Races - Hispanic (% change since 2000)
Races - Native Hawaiian and Other Pacific Islander alone (%)
Races - Native Hawaiian and Other Pacific Islander alone (% change since 2000)
Races - Two or more races (%)
Races - Two or more races (% change since 2000)
Races - Other race alone (%)
Races - Other race alone (% change since 2000)
Racial diversity
Unemployment (%)
Unemployment (% change since 2000)
Unemployment (%) - White
Unemployment (%) - Black or African American
Unemployment (%) - Asian
Unemployment (%) - Hispanic or Latino
Unemployment (%) - American Indian and Alaska Native
Unemployment (%) - Multirace
Unemployment (%) - Other Race
Population density (people per square mile)
Population - Males (%)
Population - Females (%)
Population - Males (%) - White
Population - Males (%) - Black or African American
Population - Males (%) - Asian
Population - Males (%) - Hispanic or Latino
Population - Males (%) - American Indian and Alaska Native
Population - Males (%) - Multirace
Population - Males (%) - Other Race
Population - Females (%) - White
Population - Females (%) - Black or African American
Population - Females (%) - Asian
Population - Females (%) - Hispanic or Latino
Population - Females (%) - American Indian and Alaska Native
Population - Females (%) - Multirace
Population - Females (%) - Other Race
Coronavirus confirmed cases (Apr 27, 2024)
Deaths caused by coronavirus (Apr 27, 2024)
Coronavirus confirmed cases (per 100k population) (Apr 27, 2024)
Deaths caused by coronavirus (per 100k population) (Apr 27, 2024)
Daily increase in number of cases (Apr 27, 2024)
Weekly increase in number of cases (Apr 27, 2024)
Cases doubled (in days) (Apr 27, 2024)
Hospitalized patients (Apr 18, 2022)
Negative test results (Apr 18, 2022)
Total test results (Apr 18, 2022)
COVID Vaccine doses distributed (per 100k population) (Sep 19, 2023)
COVID Vaccine doses administered (per 100k population) (Sep 19, 2023)
COVID Vaccine doses distributed (Sep 19, 2023)
COVID Vaccine doses administered (Sep 19, 2023)
Likely homosexual households (%)
Likely homosexual households (% change since 2000)
Likely homosexual households - Lesbian couples (%)
Likely homosexual households - Lesbian couples (% change since 2000)
Likely homosexual households - Gay men (%)
Likely homosexual households - Gay men (% change since 2000)
Cost of living index
Median gross rent ($)
Median contract rent ($)
Median monthly housing costs ($)
Median house or condo value ($)
Median house or condo value ($ change since 2000)
Mean house or condo value by units in structure - 1, detached ($)
Mean house or condo value by units in structure - 1, attached ($)
Mean house or condo value by units in structure - 2 ($)
Mean house or condo value by units in structure by units in structure - 3 or 4 ($)
Mean house or condo value by units in structure - 5 or more ($)
Mean house or condo value by units in structure - Boat, RV, van, etc. ($)
Mean house or condo value by units in structure - Mobile home ($)
Median house or condo value ($) - White
Median house or condo value ($) - Black or African American
Median house or condo value ($) - Asian
Median house or condo value ($) - Hispanic or Latino
Median house or condo value ($) - American Indian and Alaska Native
Median house or condo value ($) - Multirace
Median house or condo value ($) - Other Race
Median resident age
Resident age diversity
Median resident age - Males
Median resident age - Females
Median resident age - White
Median resident age - Black or African American
Median resident age - Asian
Median resident age - Hispanic or Latino
Median resident age - American Indian and Alaska Native
Median resident age - Multirace
Median resident age - Other Race
Median resident age - Males - White
Median resident age - Males - Black or African American
Median resident age - Males - Asian
Median resident age - Males - Hispanic or Latino
Median resident age - Males - American Indian and Alaska Native
Median resident age - Males - Multirace
Median resident age - Males - Other Race
Median resident age - Females - White
Median resident age - Females - Black or African American
Median resident age - Females - Asian
Median resident age - Females - Hispanic or Latino
Median resident age - Females - American Indian and Alaska Native
Median resident age - Females - Multirace
Median resident age - Females - Other Race
Commute - mean travel time to work (minutes)
Travel time to work - Less than 5 minutes (%)
Travel time to work - Less than 5 minutes (% change since 2000)
Travel time to work - 5 to 9 minutes (%)
Travel time to work - 5 to 9 minutes (% change since 2000)
Travel time to work - 10 to 19 minutes (%)
Travel time to work - 10 to 19 minutes (% change since 2000)
Travel time to work - 20 to 29 minutes (%)
Travel time to work - 20 to 29 minutes (% change since 2000)
Travel time to work - 30 to 39 minutes (%)
Travel time to work - 30 to 39 minutes (% change since 2000)
Travel time to work - 40 to 59 minutes (%)
Travel time to work - 40 to 59 minutes (% change since 2000)
Travel time to work - 60 to 89 minutes (%)
Travel time to work - 60 to 89 minutes (% change since 2000)
Travel time to work - 90 or more minutes (%)
Travel time to work - 90 or more minutes (% change since 2000)
Marital status - Never married (%)
Marital status - Now married (%)
Marital status - Separated (%)
Marital status - Widowed (%)
Marital status - Divorced (%)
Median family income ($)
Median family income (% change since 2000)
Median non-family income ($)
Median non-family income (% change since 2000)
Median per capita income ($)
Median per capita income (% change since 2000)
Median family income ($) - White
Median family income ($) - Black or African American
Median family income ($) - Asian
Median family income ($) - Hispanic or Latino
Median family income ($) - American Indian and Alaska Native
Median family income ($) - Multirace
Median family income ($) - Other Race
Median year house/condo built
Median year apartment built
Year house built - Built 2005 or later (%)
Year house built - Built 2000 to 2004 (%)
Year house built - Built 1990 to 1999 (%)
Year house built - Built 1980 to 1989 (%)
Year house built - Built 1970 to 1979 (%)
Year house built - Built 1960 to 1969 (%)
Year house built - Built 1950 to 1959 (%)
Year house built - Built 1940 to 1949 (%)
Year house built - Built 1939 or earlier (%)
Average household size
Household density (households per square mile)
Average household size - White
Average household size - Black or African American
Average household size - Asian
Average household size - Hispanic or Latino
Average household size - American Indian and Alaska Native
Average household size - Multirace
Average household size - Other Race
Occupied housing units (%)
Vacant housing units (%)
Owner occupied housing units (%)
Renter occupied housing units (%)
Vacancy status - For rent (%)
Vacancy status - For sale only (%)
Vacancy status - Rented or sold, not occupied (%)
Vacancy status - For seasonal, recreational, or occasional use (%)
Vacancy status - For migrant workers (%)
Vacancy status - Other vacant (%)
Residents with income below the poverty level (%)
Residents with income below 50% of the poverty level (%)
Children below poverty level (%)
Poor families by family type - Married-couple family (%)
Poor families by family type - Male, no wife present (%)
Poor families by family type - Female, no husband present (%)
Poverty status for native-born residents (%)
Poverty status for foreign-born residents (%)
Poverty among high school graduates not in families (%)
Poverty among people who did not graduate high school not in families (%)
Residents with income below the poverty level (%) - White
Residents with income below the poverty level (%) - Black or African American
Residents with income below the poverty level (%) - Asian
Residents with income below the poverty level (%) - Hispanic or Latino
Residents with income below the poverty level (%) - American Indian and Alaska Native
Residents with income below the poverty level (%) - Multirace
Residents with income below the poverty level (%) - Other Race
Air pollution - Air Quality Index (AQI)
Air pollution - CO
Air pollution - NO2
Air pollution - SO2
Air pollution - Ozone
Air pollution - PM10
Air pollution - PM25
Air pollution - Pb
Crime - Murders per 100,000 population
Crime - Rapes per 100,000 population
Crime - Robberies per 100,000 population
Crime - Assaults per 100,000 population
Crime - Burglaries per 100,000 population
Crime - Thefts per 100,000 population
Crime - Auto thefts per 100,000 population
Crime - Arson per 100,000 population
Crime - City-data.com crime index
Crime - Violent crime index
Crime - Property crime index
Crime - Murders per 100,000 population (5 year average)
Crime - Rapes per 100,000 population (5 year average)
Crime - Robberies per 100,000 population (5 year average)
Crime - Assaults per 100,000 population (5 year average)
Crime - Burglaries per 100,000 population (5 year average)
Crime - Thefts per 100,000 population (5 year average)
Crime - Auto thefts per 100,000 population (5 year average)
Crime - Arson per 100,000 population (5 year average)
Crime - City-data.com crime index (5 year average)
Crime - Violent crime index (5 year average)
Crime - Property crime index (5 year average)
1996 Presidential Elections Results (%) - Democratic Party (Clinton)
1996 Presidential Elections Results (%) - Republican Party (Dole)
1996 Presidential Elections Results (%) - Other
2000 Presidential Elections Results (%) - Democratic Party (Gore)
2000 Presidential Elections Results (%) - Republican Party (Bush)
2000 Presidential Elections Results (%) - Other
2004 Presidential Elections Results (%) - Democratic Party (Kerry)
2004 Presidential Elections Results (%) - Republican Party (Bush)
2004 Presidential Elections Results (%) - Other
2008 Presidential Elections Results (%) - Democratic Party (Obama)
2008 Presidential Elections Results (%) - Republican Party (McCain)
2008 Presidential Elections Results (%) - Other
2012 Presidential Elections Results (%) - Democratic Party (Obama)
2012 Presidential Elections Results (%) - Republican Party (Romney)
2012 Presidential Elections Results (%) - Other
2016 Presidential Elections Results (%) - Democratic Party (Clinton)
2016 Presidential Elections Results (%) - Republican Party (Trump)
2016 Presidential Elections Results (%) - Other
2020 Presidential Elections Results (%) - Democratic Party (Biden)
2020 Presidential Elections Results (%) - Republican Party (Trump)
2020 Presidential Elections Results (%) - Other
Ancestries Reported - Arab (%)
Ancestries Reported - Czech (%)
Ancestries Reported - Danish (%)
Ancestries Reported - Dutch (%)
Ancestries Reported - English (%)
Ancestries Reported - French (%)
Ancestries Reported - French Canadian (%)
Ancestries Reported - German (%)
Ancestries Reported - Greek (%)
Ancestries Reported - Hungarian (%)
Ancestries Reported - Irish (%)
Ancestries Reported - Italian (%)
Ancestries Reported - Lithuanian (%)
Ancestries Reported - Norwegian (%)
Ancestries Reported - Polish (%)
Ancestries Reported - Portuguese (%)
Ancestries Reported - Russian (%)
Ancestries Reported - Scotch-Irish (%)
Ancestries Reported - Scottish (%)
Ancestries Reported - Slovak (%)
Ancestries Reported - Subsaharan African (%)
Ancestries Reported - Swedish (%)
Ancestries Reported - Swiss (%)
Ancestries Reported - Ukrainian (%)
Ancestries Reported - United States (%)
Ancestries Reported - Welsh (%)
Ancestries Reported - West Indian (%)
Ancestries Reported - Other (%)
Educational Attainment - No schooling completed (%)
Educational Attainment - Less than high school (%)
Educational Attainment - High school or equivalent (%)
Educational Attainment - Less than 1 year of college (%)
Educational Attainment - 1 or more years of college (%)
Educational Attainment - Associate degree (%)
Educational Attainment - Bachelor's degree (%)
Educational Attainment - Master's degree (%)
Educational Attainment - Professional school degree (%)
Educational Attainment - Doctorate degree (%)
School Enrollment - Nursery, preschool (%)
School Enrollment - Kindergarten (%)
School Enrollment - Grade 1 to 4 (%)
School Enrollment - Grade 5 to 8 (%)
School Enrollment - Grade 9 to 12 (%)
School Enrollment - College undergrad (%)
School Enrollment - Graduate or professional (%)
School Enrollment - Not enrolled in school (%)
School enrollment - Public schools (%)
School enrollment - Private schools (%)
School enrollment - Not enrolled (%)
Median number of rooms in houses and condos
Median number of rooms in apartments
Housing units lacking complete plumbing facilities (%)
Housing units lacking complete kitchen facilities (%)
Density of houses
Urban houses (%)
Rural houses (%)
Households with people 60 years and over (%)
Households with people 65 years and over (%)
Households with people 75 years and over (%)
Households with one or more nonrelatives (%)
Households with no nonrelatives (%)
Population in households (%)
Family households (%)
Nonfamily households (%)
Population in families (%)
Family households with own children (%)
Median number of bedrooms in owner occupied houses
Mean number of bedrooms in owner occupied houses
Median number of bedrooms in renter occupied houses
Mean number of bedrooms in renter occupied houses
Median number of vehichles in owner occupied houses
Mean number of vehichles in owner occupied houses
Median number of vehichles in renter occupied houses
Mean number of vehichles in renter occupied houses
Mortgage status - with mortgage (%)
Mortgage status - with second mortgage (%)
Mortgage status - with home equity loan (%)
Mortgage status - with both second mortgage and home equity loan (%)
Mortgage status - without a mortgage (%)
Average family size
Average family size - White
Average family size - Black or African American
Average family size - Asian
Average family size - Hispanic or Latino
Average family size - American Indian and Alaska Native
Average family size - Multirace
Average family size - Other Race
Geographical mobility - Same house 1 year ago (%)
Geographical mobility - Moved within same county (%)
Geographical mobility - Moved from different county within same state (%)
Geographical mobility - Moved from different state (%)
Geographical mobility - Moved from abroad (%)
Place of birth - Born in state of residence (%)
Place of birth - Born in other state (%)
Place of birth - Native, outside of US (%)
Place of birth - Foreign born (%)
Housing units in structures - 1, detached (%)
Housing units in structures - 1, attached (%)
Housing units in structures - 2 (%)
Housing units in structures - 3 or 4 (%)
Housing units in structures - 5 to 9 (%)
Housing units in structures - 10 to 19 (%)
Housing units in structures - 20 to 49 (%)
Housing units in structures - 50 or more (%)
Housing units in structures - Mobile home (%)
Housing units in structures - Boat, RV, van, etc. (%)
House/condo owner moved in on average (years ago)
Renter moved in on average (years ago)
Year householder moved into unit - Moved in 1999 to March 2000 (%)
Year householder moved into unit - Moved in 1995 to 1998 (%)
Year householder moved into unit - Moved in 1990 to 1994 (%)
Year householder moved into unit - Moved in 1980 to 1989 (%)
Year householder moved into unit - Moved in 1970 to 1979 (%)
Year householder moved into unit - Moved in 1969 or earlier (%)
Means of transportation to work - Drove car alone (%)
Means of transportation to work - Carpooled (%)
Means of transportation to work - Public transportation (%)
Means of transportation to work - Bus or trolley bus (%)
Means of transportation to work - Streetcar or trolley car (%)
Means of transportation to work - Subway or elevated (%)
Means of transportation to work - Railroad (%)
Means of transportation to work - Ferryboat (%)
Means of transportation to work - Taxicab (%)
Means of transportation to work - Motorcycle (%)
Means of transportation to work - Bicycle (%)
Means of transportation to work - Walked (%)
Means of transportation to work - Other means (%)
Working at home (%)
Industry diversity
Most Common Industries - Agriculture, forestry, fishing and hunting, and mining (%)
Most Common Industries - Agriculture, forestry, fishing and hunting (%)
Most Common Industries - Mining, quarrying, and oil and gas extraction (%)
Most Common Industries - Construction (%)
Most Common Industries - Manufacturing (%)
Most Common Industries - Wholesale trade (%)
Most Common Industries - Retail trade (%)
Most Common Industries - Transportation and warehousing, and utilities (%)
Most Common Industries - Transportation and warehousing (%)
Most Common Industries - Utilities (%)
Most Common Industries - Information (%)
Most Common Industries - Finance and insurance, and real estate and rental and leasing (%)
Most Common Industries - Finance and insurance (%)
Most Common Industries - Real estate and rental and leasing (%)
Most Common Industries - Professional, scientific, and management, and administrative and waste management services (%)
Most Common Industries - Professional, scientific, and technical services (%)
Most Common Industries - Management of companies and enterprises (%)
Most Common Industries - Administrative and support and waste management services (%)
Most Common Industries - Educational services, and health care and social assistance (%)
Most Common Industries - Educational services (%)
Most Common Industries - Health care and social assistance (%)
Most Common Industries - Arts, entertainment, and recreation, and accommodation and food services (%)
Most Common Industries - Arts, entertainment, and recreation (%)
Most Common Industries - Accommodation and food services (%)
Most Common Industries - Other services, except public administration (%)
Most Common Industries - Public administration (%)
Occupation diversity
Most Common Occupations - Management, business, science, and arts occupations (%)
Most Common Occupations - Management, business, and financial occupations (%)
Most Common Occupations - Management occupations (%)
Most Common Occupations - Business and financial operations occupations (%)
Most Common Occupations - Computer, engineering, and science occupations (%)
Most Common Occupations - Computer and mathematical occupations (%)
Most Common Occupations - Architecture and engineering occupations (%)
Most Common Occupations - Life, physical, and social science occupations (%)
Most Common Occupations - Education, legal, community service, arts, and media occupations (%)
Most Common Occupations - Community and social service occupations (%)
Most Common Occupations - Legal occupations (%)
Most Common Occupations - Education, training, and library occupations (%)
Most Common Occupations - Arts, design, entertainment, sports, and media occupations (%)
Most Common Occupations - Healthcare practitioners and technical occupations (%)
Most Common Occupations - Health diagnosing and treating practitioners and other technical occupations (%)
Most Common Occupations - Health technologists and technicians (%)
Most Common Occupations - Service occupations (%)
Most Common Occupations - Healthcare support occupations (%)
Most Common Occupations - Protective service occupations (%)
Most Common Occupations - Fire fighting and prevention, and other protective service workers including supervisors (%)
Most Common Occupations - Law enforcement workers including supervisors (%)
Most Common Occupations - Food preparation and serving related occupations (%)
Most Common Occupations - Building and grounds cleaning and maintenance occupations (%)
Most Common Occupations - Personal care and service occupations (%)
Most Common Occupations - Sales and office occupations (%)
Most Common Occupations - Sales and related occupations (%)
Most Common Occupations - Office and administrative support occupations (%)
Most Common Occupations - Natural resources, construction, and maintenance occupations (%)
Most Common Occupations - Farming, fishing, and forestry occupations (%)
Most Common Occupations - Construction and extraction occupations (%)
Most Common Occupations - Installation, maintenance, and repair occupations (%)
Most Common Occupations - Production, transportation, and material moving occupations (%)
Most Common Occupations - Production occupations (%)
Most Common Occupations - Transportation occupations (%)
Most Common Occupations - Material moving occupations (%)
People in Group quarters - Institutionalized population (%)
People in Group quarters - Correctional institutions (%)
People in Group quarters - Federal prisons and detention centers (%)
People in Group quarters - Halfway houses (%)
People in Group quarters - Local jails and other confinement facilities (including police lockups) (%)
People in Group quarters - Military disciplinary barracks (%)
People in Group quarters - State prisons (%)
People in Group quarters - Other types of correctional institutions (%)
People in Group quarters - Nursing homes (%)
People in Group quarters - Hospitals/wards, hospices, and schools for the handicapped (%)
People in Group quarters - Hospitals/wards and hospices for chronically ill (%)
People in Group quarters - Hospices or homes for chronically ill (%)
People in Group quarters - Military hospitals or wards for chronically ill (%)
People in Group quarters - Other hospitals or wards for chronically ill (%)
People in Group quarters - Hospitals or wards for drug/alcohol abuse (%)
People in Group quarters - Mental (Psychiatric) hospitals or wards (%)
People in Group quarters - Schools, hospitals, or wards for the mentally retarded (%)
People in Group quarters - Schools, hospitals, or wards for the physically handicapped (%)
People in Group quarters - Institutions for the deaf (%)
People in Group quarters - Institutions for the blind (%)
People in Group quarters - Orthopedic wards and institutions for the physically handicapped (%)
People in Group quarters - Wards in general hospitals for patients who have no usual home elsewhere (%)
People in Group quarters - Wards in military hospitals for patients who have no usual home elsewhere (%)
People in Group quarters - Juvenile institutions (%)
People in Group quarters - Long-term care (%)
People in Group quarters - Homes for abused, dependent, and neglected children (%)
People in Group quarters - Residential treatment centers for emotionally disturbed children (%)
People in Group quarters - Training schools for juvenile delinquents (%)
People in Group quarters - Short-term care, detention or diagnostic centers for delinquent children (%)
People in Group quarters - Type of juvenile institution unknown (%)
People in Group quarters - Noninstitutionalized population (%)
People in Group quarters - College dormitories (includes college quarters off campus) (%)
People in Group quarters - Military quarters (%)
People in Group quarters - On base (%)
People in Group quarters - Barracks, unaccompanied personnel housing (UPH), (Enlisted/Officer), ;and similar group living quarters for military personnel (%)
People in Group quarters - Transient quarters for temporary residents (%)
People in Group quarters - Military ships (%)
People in Group quarters - Group homes (%)
People in Group quarters - Homes or halfway houses for drug/alcohol abuse (%)
People in Group quarters - Homes for the mentally ill (%)
People in Group quarters - Homes for the mentally retarded (%)
People in Group quarters - Homes for the physically handicapped (%)
People in Group quarters - Other group homes (%)
People in Group quarters - Religious group quarters (%)
People in Group quarters - Dormitories (%)
People in Group quarters - Agriculture workers' dormitories on farms (%)
People in Group quarters - Job Corps and vocational training facilities (%)
People in Group quarters - Other workers' dormitories (%)
People in Group quarters - Crews of maritime vessels (%)
People in Group quarters - Other nonhousehold living situations (%)
People in Group quarters - Other noninstitutional group quarters (%)
Residents speaking English at home (%)
Residents speaking English at home - Born in the United States (%)
Residents speaking English at home - Native, born elsewhere (%)
Residents speaking English at home - Foreign born (%)
Residents speaking Spanish at home (%)
Residents speaking Spanish at home - Born in the United States (%)
Residents speaking Spanish at home - Native, born elsewhere (%)
Residents speaking Spanish at home - Foreign born (%)
Residents speaking other language at home (%)
Residents speaking other language at home - Born in the United States (%)
Residents speaking other language at home - Native, born elsewhere (%)
Residents speaking other language at home - Foreign born (%)
Class of Workers - Employee of private company (%)
Class of Workers - Self-employed in own incorporated business (%)
Class of Workers - Private not-for-profit wage and salary workers (%)
Class of Workers - Local government workers (%)
Class of Workers - State government workers (%)
Class of Workers - Federal government workers (%)
Class of Workers - Self-employed workers in own not incorporated business and Unpaid family workers (%)
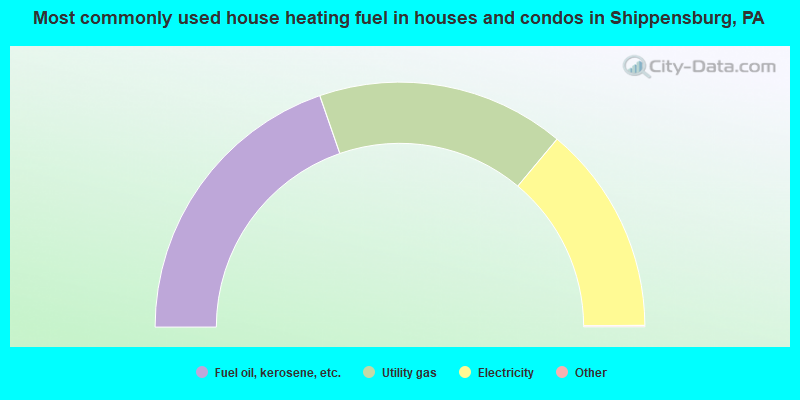
House heating fuel used in houses and condos - Utility gas (%)
House heating fuel used in houses and condos - Bottled, tank, or LP gas (%)
House heating fuel used in houses and condos - Electricity (%)
House heating fuel used in houses and condos - Fuel oil, kerosene, etc. (%)
House heating fuel used in houses and condos - Coal or coke (%)
House heating fuel used in houses and condos - Wood (%)
House heating fuel used in houses and condos - Solar energy (%)
House heating fuel used in houses and condos - Other fuel (%)
House heating fuel used in houses and condos - No fuel used (%)
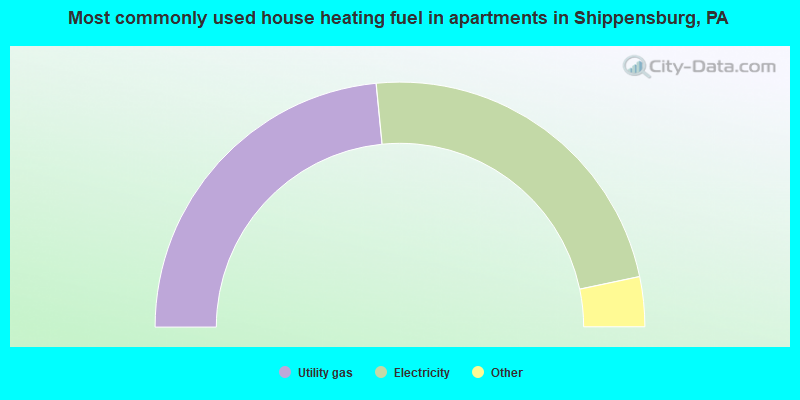
House heating fuel used in apartments - Utility gas (%)
House heating fuel used in apartments - Bottled, tank, or LP gas (%)
House heating fuel used in apartments - Electricity (%)
House heating fuel used in apartments - Fuel oil, kerosene, etc. (%)
House heating fuel used in apartments - Coal or coke (%)
House heating fuel used in apartments - Wood (%)
House heating fuel used in apartments - Solar energy (%)
House heating fuel used in apartments - Other fuel (%)
House heating fuel used in apartments - No fuel used (%)
Armed forces status - In Armed Forces (%)
Armed forces status - Civilian (%)
Armed forces status - Civilian - Veteran (%)
Armed forces status - Civilian - Nonveteran (%)
Fatal accidents locations in years 2005-2021
Fatal accidents locations in 2005
Fatal accidents locations in 2006
Fatal accidents locations in 2007
Fatal accidents locations in 2008
Fatal accidents locations in 2009
Fatal accidents locations in 2010
Fatal accidents locations in 2011
Fatal accidents locations in 2012
Fatal accidents locations in 2013
Fatal accidents locations in 2014
Fatal accidents locations in 2015
Fatal accidents locations in 2016
Fatal accidents locations in 2017
Fatal accidents locations in 2018
Fatal accidents locations in 2019
Fatal accidents locations in 2020
Fatal accidents locations in 2021
Alcohol use - People drinking some alcohol every month (%)
Alcohol use - People not drinking at all (%)
Alcohol use - Average days/month drinking alcohol
Alcohol use - Average drinks/week
Alcohol use - Average days/year people drink much
Audiometry - Average condition of hearing (%)
Audiometry - People that can hear a whisper from across a quiet room (%)
Audiometry - People that can hear normal voice from across a quiet room (%)
Audiometry - Ears ringing, roaring, buzzing (%)
Audiometry - Had a job exposure to loud noise (%)
Audiometry - Had off-work exposure to loud noise (%)
Blood Pressure & Cholesterol - Has high blood pressure (%)
Blood Pressure & Cholesterol - Checking blood pressure at home (%)
Blood Pressure & Cholesterol - Frequently checking blood cholesterol (%)
Blood Pressure & Cholesterol - Has high cholesterol level (%)
Consumer Behavior - Money monthly spent on food at supermarket/grocery store
Consumer Behavior - Money monthly spent on food at other stores
Consumer Behavior - Money monthly spent on eating out
Consumer Behavior - Money monthly spent on carryout/delivered foods
Consumer Behavior - Income spent on food at supermarket/grocery store (%)
Consumer Behavior - Income spent on food at other stores (%)
Consumer Behavior - Income spent on eating out (%)
Consumer Behavior - Income spent on carryout/delivered foods (%)
Current Health Status - General health condition (%)
Current Health Status - Blood donors (%)
Current Health Status - Has blood ever tested for HIV virus (%)
Current Health Status - Left-handed people (%)
Dermatology - People using sunscreen (%)
Diabetes - Diabetics (%)
Diabetes - Had a blood test for high blood sugar (%)
Diabetes - People taking insulin (%)
Diet Behavior & Nutrition - Diet health (%)
Diet Behavior & Nutrition - Milk product consumption (# of products/month)
Diet Behavior & Nutrition - Meals not home prepared (#/week)
Diet Behavior & Nutrition - Meals from fast food or pizza place (#/week)
Diet Behavior & Nutrition - Ready-to-eat foods (#/month)
Diet Behavior & Nutrition - Frozen meals/pizza (#/month)
Drug Use - People that ever used marijuana or hashish (%)
Drug Use - Ever used hard drugs (%)
Drug Use - Ever used any form of cocaine (%)
Drug Use - Ever used heroin (%)
Drug Use - Ever used methamphetamine (%)
Health Insurance - People covered by health insurance (%)
Kidney Conditions-Urology - Avg. # of times urinating at night
Medical Conditions - People with asthma (%)
Medical Conditions - People with anemia (%)
Medical Conditions - People with psoriasis (%)
Medical Conditions - People with overweight (%)
Medical Conditions - Elderly people having difficulties in thinking or remembering (%)
Medical Conditions - People who ever received blood transfusion (%)
Medical Conditions - People having trouble seeing even with glass/contacts (%)
Medical Conditions - People with arthritis (%)
Medical Conditions - People with gout (%)
Medical Conditions - People with congestive heart failure (%)
Medical Conditions - People with coronary heart disease (%)
Medical Conditions - People with angina pectoris (%)
Medical Conditions - People who ever had heart attack (%)
Medical Conditions - People who ever had stroke (%)
Medical Conditions - People with emphysema (%)
Medical Conditions - People with thyroid problem (%)
Medical Conditions - People with chronic bronchitis (%)
Medical Conditions - People with any liver condition (%)
Medical Conditions - People who ever had cancer or malignancy (%)
Mental Health - People who have little interest in doing things (%)
Mental Health - People feeling down, depressed, or hopeless (%)
Mental Health - People who have trouble sleeping or sleeping too much (%)
Mental Health - People feeling tired or having little energy (%)
Mental Health - People with poor appetite or overeating (%)
Mental Health - People feeling bad about themself (%)
Mental Health - People who have trouble concentrating on things (%)
Mental Health - People moving or speaking slowly or too fast (%)
Mental Health - People having thoughts they would be better off dead (%)
Oral Health - Average years since last visit a dentist
Oral Health - People embarrassed because of mouth (%)
Oral Health - People with gum disease (%)
Oral Health - General health of teeth and gums (%)
Oral Health - Average days a week using dental floss/device
Oral Health - Average days a week using mouthwash for dental problem
Oral Health - Average number of teeth
Pesticide Use - Households using pesticides to control insects (%)
Pesticide Use - Households using pesticides to kill weeds (%)
Physical Activity - People doing vigorous-intensity work activities (%)
Physical Activity - People doing moderate-intensity work activities (%)
Physical Activity - People walking or bicycling (%)
Physical Activity - People doing vigorous-intensity recreational activities (%)
Physical Activity - People doing moderate-intensity recreational activities (%)
Physical Activity - Average hours a day doing sedentary activities
Physical Activity - Average hours a day watching TV or videos
Physical Activity - Average hours a day using computer
Physical Functioning - People having limitations keeping them from working (%)
Physical Functioning - People limited in amount of work they can do (%)
Physical Functioning - People that need special equipment to walk (%)
Physical Functioning - People experiencing confusion/memory problems (%)
Physical Functioning - People requiring special healthcare equipment (%)
Prescription Medications - Average number of prescription medicines taking
Preventive Aspirin Use - Adults 40+ taking low-dose aspirin (%)
Reproductive Health - Vaginal deliveries (%)
Reproductive Health - Cesarean deliveries (%)
Reproductive Health - Deliveries resulted in a live birth (%)
Reproductive Health - Pregnancies resulted in a delivery (%)
Reproductive Health - Women breastfeeding newborns (%)
Reproductive Health - Women that had a hysterectomy (%)
Reproductive Health - Women that had both ovaries removed (%)
Reproductive Health - Women that have ever taken birth control pills (%)
Reproductive Health - Women taking birth control pills (%)
Reproductive Health - Women that have ever used Depo-Provera or injectables (%)
Reproductive Health - Women that have ever used female hormones (%)
Sexual Behavior - People 18+ that ever had sex (vaginal, anal, or oral) (%)
Sexual Behavior - Males 18+ that ever had vaginal sex with a woman (%)
Sexual Behavior - Males 18+ that ever performed oral sex on a woman (%)
Sexual Behavior - Males 18+ that ever had anal sex with a woman (%)
Sexual Behavior - Males 18+ that ever had any sex with a man (%)
Sexual Behavior - Females 18+ that ever had vaginal sex with a man (%)
Sexual Behavior - Females 18+ that ever performed oral sex on a man (%)
Sexual Behavior - Females 18+ that ever had anal sex with a man (%)
Sexual Behavior - Females 18+ that ever had any kind of sex with a woman (%)
Sexual Behavior - Average age people first had sex
Sexual Behavior - Average number of female sex partners in lifetime (males 18+)
Sexual Behavior - Average number of female vaginal sex partners in lifetime (males 18+)
Sexual Behavior - Average age people first performed oral sex on a woman (18+)
Sexual Behavior - Average number of woman performed oral sex on in lifetime (18+)
Sexual Behavior - Average number of male sex partners in lifetime (males 18+)
Sexual Behavior - Average number of male anal sex partners in lifetime (males 18+)
Sexual Behavior - Average age people first performed oral sex on a man (18+)
Sexual Behavior - Average number of male oral sex partners in lifetime (18+)
Sexual Behavior - People using protection when performing oral sex (%)
Sexual Behavior - Average number of times people have vaginal or anal sex a year
Sexual Behavior - People having sex without condom (%)
Sexual Behavior - Average number of male sex partners in lifetime (females 18+)
Sexual Behavior - Average number of male vaginal sex partners in lifetime (females 18+)
Sexual Behavior - Average number of female sex partners in lifetime (females 18+)
Sexual Behavior - Circumcised males 18+ (%)
Sleep Disorders - Average hours sleeping at night
Sleep Disorders - People that has trouble sleeping (%)
Smoking-Cigarette Use - People smoking cigarettes (%)
Taste & Smell - People 40+ having problems with smell (%)
Taste & Smell - People 40+ having problems with taste (%)
Taste & Smell - People 40+ that ever had wisdom teeth removed (%)
Taste & Smell - People 40+ that ever had tonsils teeth removed (%)
Taste & Smell - People 40+ that ever had a loss of consciousness because of a head injury (%)
Taste & Smell - People 40+ that ever had a broken nose or other serious injury to face or skull (%)
Taste & Smell - People 40+ that ever had two or more sinus infections (%)
Weight - Average height (inches)
Weight - Average weight (pounds)
Weight - Average BMI
Weight - People that are obese (%)
Weight - People that ever were obese (%)
Weight - People trying to lose weight (%)
Officers per 1,000 residents here:
1.58Pennsylvania average:
2.55
Latest news from Shippensburg, PA collected exclusively by city-data.com from local newspapers, TV, and radio stations
Ancestries: German (35.4%), American (18.1%), Norwegian (3.8%), Haitian (3.4%), English (3.4%), Irish (2.7%).
Current Local Time:
Incorporated on 02/26/1817
Land area: 2.02 square miles.
Population density: 2,744 people per square mile (average).
200 residents are foreign born (1.7% Latin America , 1.4% Asia ).
This borough:
3.4%Pennsylvania:
7.3%
Median real estate property taxes paid for housing units with mortgages in 2022: $1,652 (1.0%)Median real estate property taxes paid for housing units with no mortgage in 2022: $3,889 (2.4%)
Nearest city with pop. 50,000+: Frederick, MD
Nearest city with pop. 200,000+: Baltimore, MD
Nearest city with pop. 1,000,000+: Philadelphia, PA
Nearest cities:
Latitude: 40.05 N, Longitude: 77.52 W
Daytime population change due to commuting: +532 (+9.1%)Workers who live and work in this borough: 464 (16.5%)
Unemployment in December 2023: Here:
2.2%Pennsylvania:
2.9%
Population change in the 1990s: +81 (+1.5%).
Most common industries in Shippensburg, PA (%)
Both Males Females
Educational services (17.2%)
Accommodation & food services (9.8%)
Health care (9.1%)
Public administration (6.7%)
Construction (4.7%)
Food & beverage stores (4.4%)
Religious, grantmaking, civic, professional, similar organizations (3.3%)
Educational services (11.1%)
Accommodation & food services (9.8%)
Public administration (8.4%)
Construction (8.2%)
Food (6.0%)
Machinery (4.8%)
Food & beverage stores (4.6%)
Educational services (23.9%)
Health care (16.3%)
Accommodation & food services (9.9%)
Religious, grantmaking, civic, professional, similar organizations (4.9%)
Public administration (4.8%)
Health & personal care, except drug, stores (4.3%)
Food & beverage stores (4.1%)
Most common occupations in Shippensburg, PA (%)
Both Males Females
Retail sales workers, except cashiers (6.1%)
Building and grounds cleaning and maintenance occupations (4.9%)
Material recording, scheduling, dispatching, and distributing workers (4.7%)
Laborers and material movers, hand (4.4%)
Waiters and waitresses (4.2%)
Counselors, social workers, and other community and social service specialists (3.9%)
Cooks and food preparation workers (3.6%)
Material recording, scheduling, dispatching, and distributing workers (6.7%)
Laborers and material movers, hand (6.2%)
Cooks and food preparation workers (5.6%)
Building and grounds cleaning and maintenance occupations (5.4%)
Retail sales workers, except cashiers (4.5%)
Electrical equipment mechanics and other installation, maintenance, and repair workers, including supervisors (4.2%)
Counselors, social workers, and other community and social service specialists (3.6%)
Retail sales workers, except cashiers (7.9%)
Waiters and waitresses (7.8%)
Secretaries and administrative assistants (6.7%)
Cashiers (5.8%)
Building and grounds cleaning and maintenance occupations (4.4%)
Counselors, social workers, and other community and social service specialists (4.2%)
Food and beverage serving workers, except waiters and waitresses (3.5%)
Tornado activity:
Shippensburg-area historical tornado activity is near Pennsylvania state average. It is 12% smaller than the overall U.S. average.
On 4/16/1961, a category F3 (max. wind speeds 158-206 mph) tornado 0.2 miles away from the Shippensburg borough center caused between $50,000 and $500,000 in damages.
On 6/7/1980, a category F3 tornado 27.9 miles away from the borough center caused between $50,000 and $500,000 in damages.
Earthquake activity:
Shippensburg-area historical earthquake activity is significantly above Pennsylvania state average. It is 57% smaller than the overall U.S. average. On 8/23/2011 at 17:51:04, a magnitude 5.8 (5.8 MW, Depth: 3.7 mi, Class: Moderate, Intensity: VI - VII) earthquake occurred 149.7 miles away from Shippensburg center On 9/25/1998 at 19:52:52, a magnitude 5.2 (4.8 MB, 4.3 MS, 5.2 LG, 4.5 MW, Depth: 3.1 mi) earthquake occurred 180.5 miles away from the city center On 1/16/1994 at 01:49:16, a magnitude 4.6 (4.6 MB, 4.6 LG, Depth: 3.1 mi, Class: Light, Intensity: IV - V) earthquake occurred 80.9 miles away from Shippensburg center On 1/31/1986 at 16:46:43, a magnitude 5.0 (5.0 MB) earthquake occurred 218.5 miles away from the city center On 1/16/1994 at 00:42:43, a magnitude 4.2 (4.2 MB, 4.0 LG, Depth: 3.1 mi) earthquake occurred 82.4 miles away from Shippensburg center On 8/25/2011 at 05:07:52, a magnitude 4.5 (4.5 ML, Depth: 4.2 mi) earthquake occurred 147.4 miles away from Shippensburg center Magnitude types: regional Lg-wave magnitude (LG), body-wave magnitude (MB), local magnitude (ML), surface-wave magnitude (MS), moment magnitude (MW) Natural disasters: The number of natural disasters in Cumberland County (17) is near the US average (15).Major Disasters (Presidential) Declared: 13Emergencies Declared: 4Winter Storms: 4, Floods: 3, Hurricanes: 3, Snowstorms: 3, Storms: 3, Tropical Storms: 3, Blizzard: 1, Heavy Rain: 1, Snowfall: 1, Tropical Depression: 1, Other: 1 (Note: some incidents may be assigned to more than one category). Main business address for: ORRSTOWN FINANCIAL SERVICES INC STATE COMMERCIAL BANKS ).
Hospitals and medical centers in Shippensburg: SHIPPENSBURG HEALTH CARE CENTE (121 WALNUT BOTTOM ROAD)
Other hospitals and medical centers near Shippensburg: LUTHERAN HOME CARE SERVICES (Home Health Center, about 8 miles away; CHAMBERSBURG, PA)
MENNO-HAVEN, INC. (Nursing Home, about 9 miles away; CHAMBERSBURG, PA)
SWAIM HEALTH CENTER (Nursing Home, about 9 miles away; NEWVILLE, PA)
PENN HALL AT MENNO-HAVEN (Nursing Home, about 10 miles away; CHAMBERSBURG, PA)
FRESENIUS MEDICAL CARE CHAMBERSBURG (Dialysis Facility, about 10 miles away; CHAMBERSBURG, PA)
BEVERLY HEALTHCARE - FAYETTE (Nursing Home, about 10 miles away; FAYETTEVILLE, PA)
GUILFORD CONVALESARIUM (Nursing Home, about 10 miles away; FAYETTEVILLE, PA)
College/University in Shippensburg: Shippensburg University of Pennsylvania Full-time enrollment: 7,051; Location: 1871 Old Main Drive; Public; Website: www.ship.edu/; Offers Master's degree )
Other colleges/universities with over 2000 students near Shippensburg:
Dickinson College (about 21 miles; Carlisle, PA ; Full-time enrollment: 2,505)
Gettysburg College (about 22 miles; Gettysburg, PA ; FT enrollment: 2,772)
Mount St Mary's University (about 28 miles; Emmitsburg, MD ; FT enrollment: 2,313)
Messiah College (about 30 miles; Mechanicsburg, PA ; FT enrollment: 3,035)
Hagerstown Community College (about 30 miles; Hagerstown, MD ; FT enrollment: 3,220)
Harrisburg Area Community College-Harrisburg (about 38 miles; Harrisburg, PA ; FT enrollment: 13,276)
Frederick Community College (about 42 miles; Frederick, MD ; FT enrollment: 3,798)
Public high school in Shippensburg:
Private high school in Shippensburg: ANCHOR CHRISTIAN SCHOOL Students: 75, Location: 744 PINOLA RD, Grades: 1-12)
Public elementary/middle schools in Shippensburg:
Private elementary/middle schools in Shippensburg: OAK GROVE PAROCHIAL SCHOOL Students: 26, Location: 100 GEPHART RD, Grades: 1-8)
LIVING FAITH SCHOOL Students: 23, Location: 297 GOODHART RD, Grades: 1-8)
CHESTNUT GROVE SCHOOL (PAROCHIAL) Students: 20, Location: 120 CHESTNUT GROVE RD, Grades: 1-8)
QUARRY HILL SCHOOL Students: 19, Location: 100 MCCULLOUGH RD, Grades: UG-8)
SOUTH MOUNTAIN PAROCHIAL SCHOOL Students: 19, Location: 111 MOUNTAIN VIEW RD, Grades: 1-8)
See full list of schools located in Shippensburg Library in Shippensburg: SHIPPENSBURG PUBLIC LIBRARY Operating income: $420,440; Location: 73 W KING ST; 62,595 books ; 2,800 audio materials ; 3,455 video materials ; 9 local licensed databases ; 41 state licensed databases ; 2 other licensed databases ; 210 print serial subscriptions )
Notable locations in Shippensburg: (A) , Vigilant Hose Company 1 Station 52 (B) , Cumberland Valley Hose Company 2 Station 53 (C) . Display/hide their locations on the map
Main business address in Shippensburg: (A) . Display/hide its location on the map
Cemeteries: (1) , Spring Hill Cemetery (2) . Display/hide their locations on the map
Hotels:
Birthplace of: John Hamilton (actor) - Actor, Daniel Duncan (Ohio politician) - Politico, George Noftsker - Baseball player, Harold Mowery - Politician.
Cumberland County has a predicted average indoor radon screening level greater than 4 pCi/L (pico curies per liter) - Highest Potential Drinking water stations with addresses in Shippensburg and their reported violations in the past:
OBAIDULLAH MART (Population served: 400, Groundwater):
Past monitoring violations:
One routine major monitoring violation
5 regular monitoring violations
Population served: 150, Groundwater):
Past monitoring violations:
4 routine major monitoring violations
4 regular monitoring violations
Population served: 150, Groundwater):
Past monitoring violations:
5 routine major monitoring violations
8 regular monitoring violations
Population served: 125, Groundwater):
Past monitoring violations:
One routine major monitoring violation
Population served: 100, Groundwater):
Past health violations:
Failure to Filter (SWTR) - Between DEC-16-2010 and DEC-31-2015. Follow-up actions: St Formal NOV issued (FEB-09-2011), St BCA signed (FEB-09-2011), St Compliance achieved (MAR-07-2011)
Past monitoring violations:
Monitoring of Treatment (SWTR-Unfilt/GWR) - In FEB-2012, Contaminant: GROUNDWATER RULE. Follow-up actions: St Compliance achieved (MAR-21-2012)
Population served: 25, Groundwater):
Past monitoring violations:
One routine major monitoring violation
Drinking water stations with addresses in Shippensburg that have no violations reported:
SOUTHAMPTON TWP BLDG & PARK (Population served: 270, Primary Water Source Type: Groundwater)
Average household size: This borough:
2.2 peoplePennsylvania:
2.5 people
Percentage of family households: This borough:
45.7%Whole state:
65.0%
Percentage of households with unmarried partners: This borough:
8.8%Whole state:
6.6%
Likely homosexual households (counted as self-reported same-sex unmarried-partner households)
Lesbian couples: 0.2% of all households Gay men: 0.2% of all households
15 people in college/university student housing in 2010people in group homes intended for adults in 2010people in nursing homes in 2000
Banks with branches in Shippensburg (2011 data):
Orrstown Bank: at 77 East King Street, branch established on 1919/05/01; Lurgan Branch at 121 Lurgan Avenue, branch established on 1981/02/17. Info updated 2007/06/29: Bank assets: $1,449.8 mil, Deposits: $1,220.6 mil, local headquarters , negative income in the last year , Commercial Lending Specialization, 22 total offices , Holding Company: Orrstown Financial Services, Inc.
Manufacturers and Traders Trust Company: King Street Branch at 35-39 East King Street, branch established on 1903/08/26; Walnut Bottom Branch at 28 Walnut Bottom Road, branch established on 1976/12/09. Info updated 2011/08/08: Bank assets: $76,887.1 mil, Deposits: $60,064.2 mil, headquarters in Buffalo, NY, positive income , Commercial Lending Specialization, 808 total offices , Holding Company: M&T Bank Corporation
Farmers and Merchants Trust Company of Chambersburg: Shippensburg Branch at 13 Shippensburg Shopping Center, branch established on 1996/10/28. Info updated 2009/01/14: Bank assets: $986.3 mil, Deposits: $789.0 mil, headquarters in Chambersburg, PA, positive income , Commercial Lending Specialization, 28 total offices , Holding Company: Franklin Financial Services Corporation
Sovereign Bank, National Association: Shippensburg Branch at 397 H Baltimore Road, branch established on 2003/10/06. Info updated 2012/01/31: Bank assets: $78,146.9 mil, Deposits: $48,042.9 mil, headquarters in Wilmington, DE, positive income , Commercial Lending Specialization, 718 total offices , Holding Company: Banco Santander, S.A.
Citizens Bank of Pennsylvania: Shippensburg West Branch at 153 West Orange Street, branch established on 1970/09/10. Info updated 2010/09/24: Bank assets: $32,316.9 mil, Deposits: $25,297.1 mil, headquarters in Philadelphia, PA, positive income , 396 total offices , Holding Company: Uk Financial Investments Limited
Woodforest National Bank: Shippensburg Walmart Branch at 100 South Conestoga Drive, branch established on 2007/09/08. Info updated 2011/05/10: Bank assets: $3,488.9 mil, Deposits: $3,097.6 mil, headquarters in Houston, TX, positive income , Commercial Lending Specialization, 766 total offices , Holding Company: Woodforest Financial Group Employee Stock Ownership Plan (With 401(K) Provisions)
For population 15 years and over in Shippensburg:
Never married: 46.5%Now married: 34.0%Separated: 2.0%Widowed: 6.8%Divorced: 10.6% For population 25 years and over in Shippensburg:
High school or higher: 90.9%Bachelor's degree or higher: 33.1%Graduate or professional degree: 14.2%Unemployed: 3.0%Mean travel time to work (commute): 23.9 minutes
Education Gini index (Inequality in education) Here:
11.6Pennsylvania average:
11.4
Religion statistics for Shippensburg, PA (based on Cumberland County data)
Religion Adherents Congregations Mainline Protestant 44,228 106 Catholic 36,186 8 Evangelical Protestant 30,598 148 Other 11,324 17 Orthodox 1,241 4 Black Protestant 605 5 None 111,224 -
Source: Clifford Grammich, Kirk Hadaway, Richard Houseal, Dale E.Jones, Alexei Krindatch, Richie Stanley and Richard H.Taylor. 2012. 2010 U.S.Religion Census: Religious Congregations & Membership Study. Association of Statisticians of American Religious Bodies. Jones, Dale E., et al. 2002. Congregations and Membership in the United States 2000. Nashville, TN: Glenmary Research Center. Graphs represent county-level data
Food Environment Statistics: Number of grocery stores : 41This county :
1.80 / 10,000 pop.Pennsylvania :
2.04 / 10,000 pop.
Number of supercenters and club stores : 3This county :
0.13 / 10,000 pop.Pennsylvania :
0.09 / 10,000 pop.
Number of convenience stores (no gas) : 12Here :
0.53 / 10,000 pop.Pennsylvania :
0.88 / 10,000 pop.
Number of convenience stores (with gas) : 60This county :
2.64 / 10,000 pop.Pennsylvania :
2.52 / 10,000 pop.
Number of full-service restaurants : 176This county :
7.75 / 10,000 pop.State :
7.12 / 10,000 pop.
Adult diabetes rate : Cumberland County :
10.1%Pennsylvania :
9.1%
Adult obesity rate : Cumberland County :
25.6%Pennsylvania :
27.2%
Low-income preschool obesity rate : This county :
12.8%Pennsylvania :
11.5%
Health and Nutrition: Healthy diet rate : This city:
48.6%Pennsylvania:
50.2%
Average overall health of teeth and gums : Shippensburg:
45.7%Pennsylvania:
47.1%
People feeling badly about themselves : Shippensburg:
21.4%Pennsylvania:
20.8%
People not drinking alcohol at all : Shippensburg:
13.5%Pennsylvania:
10.9%
Average hours sleeping at night : Shippensburg:
6.9Pennsylvania:
6.8
Overweight people : Shippensburg:
28.9%Pennsylvania:
34.3%
General health condition : Shippensburg:
56.1%Pennsylvania:
56.2%
Average condition of hearing : This city:
79.2%Pennsylvania:
78.3%
More about Health and Nutrition of Shippensburg, PA Residents
Local government employment and payroll (March 2022)
Function
Full-time employees
Monthly full-time payroll
Average yearly full-time wage
Part-time employees
Monthly part-time payroll
Water Supply
13 $55,853 $51,557 0 $0 Police Protection - Officers
9 $72,835 $97,113 5 $5,132 Sewerage
8 $44,316 $66,474 0 $0 Solid Waste Management
5 $19,537 $46,889 1 $467 Other and Unallocable
2 $11,414 $68,484 0 $0 Other Government Administration
2 $14,743 $88,458 0 $0 Parks and Recreation
2 $8,521 $51,126 0 $0 Streets and Highways
2 $9,209 $55,254 0 $0 Police - Other
1 $4,076 $48,912 2 $1,265 Financial Administration
1 $5,496 $65,952 2 $3,706
Totals for Government
45 $246,000 $65,600 10 $10,570
Shippensburg government finances - Expenditure in 2017 (per resident):
Construction - Sewerage: $2,075,000 ($375.29)
Regular Highways: $128,000 ($23.15)Current Operations - Sewerage: $1,440,000 ($260.44)
Police Protection: $1,426,000 ($257.91)Solid Waste Management: $595,000 ($107.61)Central Staff Services: $554,000 ($100.20)Regular Highways: $541,000 ($97.85)General - Other: $287,000 ($51.91)Housing and Community Development: $250,000 ($45.22)Local Fire Protection: $145,000 ($26.23)Parks and Recreation: $140,000 ($25.32)General Public Buildings: $70,000 ($12.66)Judicial and Legal Services: $41,000 ($7.42)Financial Administration: $21,000 ($3.80)Parking Facilities: $13,000 ($2.35)General - Interest on Debt: $60,000 ($10.85)
Other Capital Outlay - Sewerage: $314,000 ($56.79)
Solid Waste Management: $205,000 ($37.08)Police Protection: $44,000 ($7.96)Local Fire Protection: $14,000 ($2.53)Total Salaries and Wages: $2,167,000 ($391.93)
Shippensburg government finances - Revenue in 2017 (per resident):
Charges - Sewerage: $2,052,000 ($371.13)
Solid Waste Management: $894,000 ($161.69)Other: $92,000 ($16.64)Parking Facilities: $33,000 ($5.97)Parks and Recreation: $8,000 ($1.45)Federal Intergovernmental - Other: $20,000 ($3.62)
Housing and Community Development: $20,000 ($3.62)Local Intergovernmental - Other: $300,000 ($54.26)
Miscellaneous - General Revenue - Other: $1,661,000 ($300.42)
Fines and Forfeits: $62,000 ($11.21)Donations From Private Sources: $34,000 ($6.15)Interest Earnings: $14,000 ($2.53)State Intergovernmental - Other: $458,000 ($82.84)
Highways: $149,000 ($26.95)General Local Government Support: $4,000 ($0.72)Tax - Property: $1,063,000 ($192.26)
Individual Income: $466,000 ($84.28)Occupation and Business License - Other: $132,000 ($23.87)Documentary and Stock Transfer: $75,000 ($13.56)Public Utility License: $74,000 ($13.38)
Shippensburg government finances - Debt in 2017 (per resident):
Long Term Debt - Issue, Unspecified Public Purpose: $815,000 ($147.40)
Outstanding Unspecified Public Purpose: $577,000 ($104.36)Retired Unspecified Public Purpose: $238,000 ($43.05)
Shippensburg government finances - Cash and Securities in 2017 (per resident):
Other Funds - Cash and Securities: $27,229,000 ($4924.76)
7.10% of this county's 2021 resident taxpayers lived in other counties in 2020 ($59,936 average adjusted gross income )
Here:
7.10%Pennsylvania average:
5.27%
0.04% of residents moved from foreign countries ($587 average AGI )Cumberland County:
0.04%Pennsylvania average:
0.01%
Top counties from which taxpayers relocated into this county between 2020 and 2021:
6.20% of this county's 2020 resident taxpayers moved to other counties in 2021 ($69,359 average adjusted gross income )
Here:
6.20%Pennsylvania average:
5.44%
0.05% of residents moved to foreign countries ($979 average AGI )Cumberland County:
0.05%Pennsylvania average:
0.01%
Top counties to which taxpayers relocated from this county between 2020 and 2021:
Businesses in Shippensburg, PA
Name Count Name Count
Advance Auto Parts 1 Lowe's 1 AutoZone 1 MasterBrand Cabinets 1 Best Western 1 McDonald's 1 Blockbuster 1 Nike 1 Burger King 1 Papa John's Pizza 1 CVS 1 Pizza Hut 1 Chevrolet 1 Quiznos 1 Domino's Pizza 1 Rite Aid 1 FedEx 2 Rodeway Inn 1 Ford 1 Starbucks 1 GameStop 1 Subway 2 Giant 1 T-Mobile 1 H&R Block 1 Taco Bell 1 KFC 1 True Value 1 Kincaid 1 U-Haul 1 Kmart 1 UPS 3 Kroger 1 Walmart 1 Little Caesars Pizza 1 Wendy's 1
Strongest AM radio stations in Shippensburg:
WEEO (1480 AM; 0 kW; SHIPPENSBURG, PA; Owner: CARY H. SIMPSON)
WCBG (1590 AM; 5 kW; CHAMBERSBURG, PA; Owner: M. BELMONT VERSTANDIG, INC.)
WCBM (680 AM; 50 kW; BALTIMORE, MD; Owner: WCBM MARYLAND, INC.)
WBAL (1090 AM; 50 kW; BALTIMORE, MD; Owner: HEARST RADIO, INC.)
WHYL (960 AM; 5 kW; CARLISLE, PA; Owner: CITADEL BROADCASTING COMPANY)
WMET (1150 AM; 50 kW; GAITHERSBURG, MD; Owner: BELTWAY ACQUISITION CORPORATION)
WGOP (700 AM; daytime; 25 kW; WALKERSVILLE, MD; Owner: BIRACH BROADCASTING CORPORATION)
WCHA (800 AM; 1 kW; CHAMBERSBURG, PA; Owner: DAME BROADCASTING, LLC)
WTEM (980 AM; 50 kW; WASHINGTON, DC; Owner: AMFM RADIO LICENSES, L.L.C.)
WWLG (1370 AM; 50 kW; BALTIMORE, MD; Owner: M-10 BROADCASTING, INC.)
WHP (580 AM; 5 kW; HARRISBURG, PA; Owner: CLEAR CHANNEL BROADCASTING LICENSES, INC.)
WTOP (1500 AM; 50 kW; WASHINGTON, DC; Owner: BONNEVILLE HOLDING COMPANY)
WVCH (740 AM; 50 kW; CHESTER, PA; Owner: WVCH COMMUNICATIONS, INC.)
Strongest FM radio stations in Shippensburg:
WEEO-FM (103.7 FM; MCCONNELLSBURG, PA; Owner: ALLEGHENY MOUNTAIN NETWORK)
WAYZ-FM (104.7 FM; HAGERSTOWN, MD; Owner: HJV LIMITED PARTNERSHIP)
WETH (89.1 FM; HAGERSTOWN, MD; Owner: GREATER WASHINGTON EDUCATIONAL TELECOMMUNICATIONS ASSN.)
WIKZ (95.1 FM; CHAMBERSBURG, PA; Owner: DAME BROADCASTING, LLC)
WXMJ (99.5 FM; MOUNT UNION, PA; Owner: MEGAHERTZ LICENSES, LLC)
WJUN-FM (92.5 FM; MEXICO, PA; Owner: STARVIEW MEDIA, INC.)
W219BE (91.7 FM; WAYNESBORO, PA; Owner: MARANATHA BIBLE INSTITUTE, NDBA)
WQJU (107.1 FM; MIFFLINTOWN, PA; Owner: CENTRAL PA CHRISTIAN INSTITUTE, INC.)
WJRC (90.9 FM; LEWISTOWN, PA; Owner: SALT AND LIGHT MEDIA MINISTRIES, INC)
WLAK (103.5 FM; HUNTINGDON, PA; Owner: FIRST MEDIA RADIO, LLC)
WITF-FM (89.5 FM; HARRISBURG, PA; Owner: WITF, INC.)
WFRE (99.9 FM; FREDERICK, MD; Owner: CAPSTAR TX LIMITED PARTNERSHIP)
WYCR (98.5 FM; YORK-HANOVER, PA; Owner: RADIO HANOVER, INC.)
W219BX (91.7 FM; FREDERICK, MD; Owner: CEDAR RIDGE CHILDREN'S HOME & SCHOOL, INC)
WQCM (94.3 FM; GREENCASTLE, PA; Owner: DAME BROADCASTING, LLC)
WGTY (107.7 FM; GETTYSBURG, PA; Owner: TIMES AND NEWS PUBLISHING COMPANY)
WLZS (106.1 FM; BEAVER SPRINGS, PA; Owner: STARVIEW MEDIA, INC)
WROZ (101.3 FM; LANCASTER, PA; Owner: HALL COMMUNICATIONS, INC.)
WCRH (90.5 FM; WILLIAMSPORT, MD; Owner: CEDAR RIDGE CHILDREN'S HOME & SCHOOL, INC)
WSRT (92.1 FM; MERCERSBURG, PA; Owner: M. BELMONT VERSTANDIG, INC.)
TV broadcast stations around Shippensburg:
W38AN (Channel 38; CHAMBERSBURG, PA; Owner: WITF, INC.)
National Bridge Inventory (NBI) Statistics 35 Number of bridges141ft / 42.5m Total length $3,484,000 Total costs473,479 Total average daily traffic145,658 Total average daily truck traffic
New bridges - historical statistics
1 1910-1919 1 1930-1939 1 1940-1949 1 1950-1959 26 1960-1969 3 1970-1979 1 1980-1989 1 1990-1999
See full National Bridge Inventory statistics for Shippensburg, PA
Home Mortgage Disclosure Act Aggregated Statistics For Year 2009(Based on 1 full tract) A) FHA, FSA/RHS & VA B) Conventional C) Refinancings D) Home Improvement Loans E) Loans on Dwellings For 5+ Families F) Non-occupant Loans on G) Loans On Manufactured Number Average Value Number Average Value Number Average Value Number Average Value Number Average Value Number Average Value Number Average Value
LOANS ORIGINATED 17 $146,080 17 $153,678 47 $125,471 6 $89,837 2 $123,830 17 $122,143 0 $0 APPLICATIONS APPROVED, NOT ACCEPTED 1 $195,210 3 $122,370 3 $124,313 0 $0 0 $0 0 $0 1 $27,190 APPLICATIONS DENIED 3 $200,390 3 $115,897 13 $135,221 5 $9,712 1 $242,800 2 $61,670 0 $0 APPLICATIONS WITHDRAWN 4 $134,510 1 $97,120 8 $140,945 0 $0 0 $0 1 $97,120 0 $0 FILES CLOSED FOR INCOMPLETENESS 1 $171,900 0 $0 2 $154,420 0 $0 0 $0 1 $176,760 0 $0
Aggregated Statistics For Year 2008(Based on 1 full tract) A) FHA, FSA/RHS & VA B) Conventional C) Refinancings D) Home Improvement Loans E) Loans on Dwellings For 5+ Families F) Non-occupant Loans on G) Loans On Manufactured Number Average Value Number Average Value Number Average Value Number Average Value Number Average Value Number Average Value Number Average Value
LOANS ORIGINATED 14 $151,299 31 $156,551 29 $130,007 11 $38,318 2 $182,100 26 $158,455 1 $13,600 APPLICATIONS APPROVED, NOT ACCEPTED 1 $113,630 4 $94,450 5 $87,214 3 $25,573 0 $0 2 $120,915 1 $22,340 APPLICATIONS DENIED 2 $129,170 13 $92,862 25 $112,076 7 $47,866 0 $0 10 $142,572 7 $43,843 APPLICATIONS WITHDRAWN 1 $155,390 5 $113,048 8 $150,658 0 $0 0 $0 3 $123,667 0 $0 FILES CLOSED FOR INCOMPLETENESS 1 $98,090 1 $83,520 4 $139,368 0 $0 0 $0 1 $83,520 0 $0
Aggregated Statistics For Year 2007(Based on 1 full tract) A) FHA, FSA/RHS & VA B) Conventional C) Refinancings D) Home Improvement Loans E) Loans on Dwellings For 5+ Families F) Non-occupant Loans on G) Loans On Manufactured Number Average Value Number Average Value Number Average Value Number Average Value Number Average Value Number Average Value Number Average Value
LOANS ORIGINATED 2 $154,905 48 $131,658 46 $98,725 14 $47,589 3 $167,047 31 $111,531 2 $15,540 APPLICATIONS APPROVED, NOT ACCEPTED 0 $0 11 $90,763 7 $139,991 5 $53,610 0 $0 0 $0 3 $38,200 APPLICATIONS DENIED 0 $0 13 $131,187 30 $154,032 11 $46,176 0 $0 8 $105,375 5 $51,086 APPLICATIONS WITHDRAWN 0 $0 2 $171,900 8 $159,276 0 $0 0 $0 0 $0 0 $0 FILES CLOSED FOR INCOMPLETENESS 1 $178,700 1 $201,040 2 $155,390 1 $48,560 0 $0 0 $0 0 $0
Aggregated Statistics For Year 2006(Based on 1 full tract) A) FHA, FSA/RHS & VA B) Conventional C) Refinancings D) Home Improvement Loans E) Loans on Dwellings For 5+ Families F) Non-occupant Loans on G) Loans On Manufactured Number Average Value Number Average Value Number Average Value Number Average Value Number Average Value Number Average Value Number Average Value
LOANS ORIGINATED 8 $140,218 84 $103,942 34 $105,089 11 $49,796 1 $223,380 31 $91,669 0 $0 APPLICATIONS APPROVED, NOT ACCEPTED 1 $183,560 6 $68,147 7 $94,067 0 $0 0 $0 1 $105,860 0 $0 APPLICATIONS DENIED 0 $0 8 $116,422 29 $108,205 9 $43,057 0 $0 1 $64,100 1 $38,850 APPLICATIONS WITHDRAWN 0 $0 4 $46,618 18 $127,443 0 $0 0 $0 1 $82,550 0 $0 FILES CLOSED FOR INCOMPLETENESS 0 $0 3 $36,907 6 $78,182 0 $0 0 $0 0 $0 0 $0
Aggregated Statistics For Year 2005(Based on 1 full tract) A) FHA, FSA/RHS & VA B) Conventional C) Refinancings D) Home Improvement Loans E) Loans on Dwellings For 5+ Families F) Non-occupant Loans on G) Loans On Manufactured Number Average Value Number Average Value Number Average Value Number Average Value Number Average Value Number Average Value Number Average Value
LOANS ORIGINATED 3 $102,947 86 $102,846 47 $85,920 19 $41,659 3 $261,577 32 $101,308 2 $99,550 APPLICATIONS APPROVED, NOT ACCEPTED 1 $122,370 6 $82,552 16 $88,501 2 $50,015 0 $0 2 $75,755 3 $61,510 APPLICATIONS DENIED 0 $0 17 $54,501 38 $99,804 8 $31,929 0 $0 4 $24,522 6 $33,992 APPLICATIONS WITHDRAWN 0 $0 7 $68,261 21 $103,641 2 $58,270 0 $0 2 $114,115 3 $32,373 FILES CLOSED FOR INCOMPLETENESS 0 $0 0 $0 2 $138,395 1 $19,420 0 $0 0 $0 0 $0
Aggregated Statistics For Year 2004(Based on 1 full tract) A) FHA, FSA/RHS & VA B) Conventional C) Refinancings D) Home Improvement Loans E) Loans on Dwellings For 5+ Families F) Non-occupant Loans on G) Loans On Manufactured Number Average Value Number Average Value Number Average Value Number Average Value Number Average Value Number Average Value Number Average Value
LOANS ORIGINATED 5 $106,832 79 $87,445 52 $92,918 10 $49,240 2 $132,085 35 $79,611 2 $60,215 APPLICATIONS APPROVED, NOT ACCEPTED 0 $0 10 $102,947 15 $79,768 3 $31,080 0 $0 3 $124,313 2 $47,105 APPLICATIONS DENIED 0 $0 9 $85,358 39 $104,043 18 $33,614 0 $0 9 $105,213 1 $82,550 APPLICATIONS WITHDRAWN 1 $116,540 8 $113,266 17 $99,576 2 $30,105 0 $0 4 $120,672 0 $0 FILES CLOSED FOR INCOMPLETENESS 0 $0 1 $67,980 10 $106,735 1 $18,450 0 $0 0 $0 0 $0
Aggregated Statistics For Year 2003(Based on 1 full tract) A) FHA, FSA/RHS & VA B) Conventional C) Refinancings D) Home Improvement Loans F) Non-occupant Loans on Number Average Value Number Average Value Number Average Value Number Average Value Number Average Value
LOANS ORIGINATED 4 $68,470 55 $103,353 105 $92,652 9 $29,783 29 $131,146 APPLICATIONS APPROVED, NOT ACCEPTED 0 $0 4 $107,802 13 $98,988 0 $0 1 $134,030 APPLICATIONS DENIED 0 $0 11 $67,895 36 $109,179 5 $48,172 8 $60,700 APPLICATIONS WITHDRAWN 1 $61,190 9 $87,840 21 $95,964 0 $0 4 $81,822 FILES CLOSED FOR INCOMPLETENESS 0 $0 2 $88,380 2 $105,860 1 $14,570 1 $101,980
Aggregated Statistics For Year 2002(Based on 1 full tract) A) FHA, FSA/RHS & VA B) Conventional C) Refinancings D) Home Improvement Loans F) Non-occupant Loans on Number Average Value Number Average Value Number Average Value Number Average Value Number Average Value
LOANS ORIGINATED 5 $74,006 55 $75,612 78 $303,824 11 $17,394 40 $76,798 APPLICATIONS APPROVED, NOT ACCEPTED 0 $0 9 $72,409 16 $95,663 0 $0 2 $135,970 APPLICATIONS DENIED 0 $0 9 $46,726 35 $75,532 8 $12,748 5 $37,876 APPLICATIONS WITHDRAWN 0 $0 2 $55,845 17 $111,345 0 $0 3 $187,440 FILES CLOSED FOR INCOMPLETENESS 0 $0 2 $87,895 11 $108,863 0 $0 2 $43,220
Aggregated Statistics For Year 2001(Based on 1 full tract) A) FHA, FSA/RHS & VA B) Conventional C) Refinancings D) Home Improvement Loans F) Non-occupant Loans on Number Average Value Number Average Value Number Average Value Number Average Value Number Average Value
LOANS ORIGINATED 6 $92,588 49 $71,988 65 $84,763 12 $18,615 27 $66,365 APPLICATIONS APPROVED, NOT ACCEPTED 0 $0 7 $28,303 9 $66,150 3 $9,713 4 $46,618 APPLICATIONS DENIED 0 $0 19 $56,738 28 $74,574 8 $15,782 0 $0 APPLICATIONS WITHDRAWN 0 $0 3 $48,237 17 $59,301 4 $11,170 0 $0 FILES CLOSED FOR INCOMPLETENESS 0 $0 1 $155,390 4 $67,498 0 $0 0 $0
Aggregated Statistics For Year 2000(Based on 1 full tract) A) FHA, FSA/RHS & VA B) Conventional C) Refinancings D) Home Improvement Loans F) Non-occupant Loans on Number Average Value Number Average Value Number Average Value Number Average Value Number Average Value
LOANS ORIGINATED 13 $92,264 48 $71,383 26 $78,817 16 $31,321 25 $58,660 APPLICATIONS APPROVED, NOT ACCEPTED 0 $0 5 $39,042 6 $51,797 0 $0 0 $0 APPLICATIONS DENIED 1 $79,640 45 $40,143 24 $72,233 3 $18,130 6 $61,185 APPLICATIONS WITHDRAWN 0 $0 2 $97,120 8 $75,632 2 $3,885 0 $0 FILES CLOSED FOR INCOMPLETENESS 0 $0 1 $218,520 6 $90,322 0 $0 0 $0
Aggregated Statistics For Year 1999(Based on 1 full tract) A) FHA, FSA/RHS & VA B) Conventional C) Refinancings D) Home Improvement Loans F) Non-occupant Loans on Number Average Value Number Average Value Number Average Value Number Average Value Number Average Value
LOANS ORIGINATED 6 $102,390 28 $53,858 40 $62,948 5 $12,892 12 $54,532 APPLICATIONS APPROVED, NOT ACCEPTED 0 $0 0 $0 9 $90,508 0 $0 2 $93,765 APPLICATIONS DENIED 3 $56,650 5 $47,662 20 $71,250 3 $5,533 4 $77,402 APPLICATIONS WITHDRAWN 0 $0 3 $68,370 11 $56,648 0 $0 0 $0 FILES CLOSED FOR INCOMPLETENESS 0 $0 0 $0 5 $83,410 0 $0 1 $101,580
Detailed HMDA statistics for the following Tracts:
0132.00
Private Mortgage Insurance Companies Aggregated Statistics For Year 2009(Based on 1 full tract) A) Conventional B) Refinancings C) Non-occupant Loans on Number Average Value Number Average Value Number Average Value
LOANS ORIGINATED 3 $98,740 1 $75,750 0 $0 APPLICATIONS APPROVED, NOT ACCEPTED 2 $110,715 0 $0 1 $141,800 APPLICATIONS DENIED 0 $0 0 $0 0 $0 APPLICATIONS WITHDRAWN 0 $0 0 $0 0 $0 FILES CLOSED FOR INCOMPLETENESS 0 $0 0 $0 0 $0
Aggregated Statistics For Year 2008(Based on 1 full tract) A) Conventional B) Refinancings C) Non-occupant Loans on Number Average Value Number Average Value Number Average Value
LOANS ORIGINATED 5 $135,774 1 $111,690 1 $139,850 APPLICATIONS APPROVED, NOT ACCEPTED 3 $115,897 0 $0 1 $47,590 APPLICATIONS DENIED 1 $141,800 0 $0 1 $141,800 APPLICATIONS WITHDRAWN 1 $105,860 0 $0 0 $0 FILES CLOSED FOR INCOMPLETENESS 0 $0 0 $0 0 $0
Aggregated Statistics For Year 2007(Based on 1 full tract) A) Conventional B) Refinancings C) Non-occupant Loans on Number Average Value Number Average Value Number Average Value
LOANS ORIGINATED 10 $147,525 1 $147,620 1 $87,410 APPLICATIONS APPROVED, NOT ACCEPTED 0 $0 0 $0 0 $0 APPLICATIONS DENIED 0 $0 0 $0 0 $0 APPLICATIONS WITHDRAWN 0 $0 0 $0 0 $0 FILES CLOSED FOR INCOMPLETENESS 0 $0 0 $0 0 $0
Aggregated Statistics For Year 2006(Based on 1 full tract) A) Conventional B) Refinancings C) Non-occupant Loans on Number Average Value Number Average Value Number Average Value
LOANS ORIGINATED 13 $112,958 3 $100,033 2 $80,125 APPLICATIONS APPROVED, NOT ACCEPTED 0 $0 1 $125,280 0 $0 APPLICATIONS DENIED 0 $0 0 $0 0 $0 APPLICATIONS WITHDRAWN 0 $0 0 $0 0 $0 FILES CLOSED FOR INCOMPLETENESS 0 $0 0 $0 0 $0
Aggregated Statistics For Year 2005(Based on 1 full tract) A) Conventional B) Refinancings C) Non-occupant Loans on Number Average Value Number Average Value Number Average Value
LOANS ORIGINATED 17 $98,434 1 $101,980 4 $71,140 APPLICATIONS APPROVED, NOT ACCEPTED 1 $121,400 2 $163,160 0 $0 APPLICATIONS DENIED 1 $117,520 0 $0 0 $0 APPLICATIONS WITHDRAWN 1 $108,770 0 $0 0 $0 FILES CLOSED FOR INCOMPLETENESS 0 $0 0 $0 0 $0
Aggregated Statistics For Year 2004(Based on 1 full tract) A) Conventional B) Refinancings C) Non-occupant Loans on Number Average Value Number Average Value Number Average Value
LOANS ORIGINATED 21 $81,905 4 $87,650 6 $62,805 APPLICATIONS APPROVED, NOT ACCEPTED 1 $90,320 1 $158,310 0 $0 APPLICATIONS DENIED 0 $0 1 $72,840 1 $72,840 APPLICATIONS WITHDRAWN 2 $84,980 1 $131,110 0 $0 FILES CLOSED FOR INCOMPLETENESS 0 $0 0 $0 0 $0
Aggregated Statistics For Year 2003(Based on 1 full tract) A) Conventional B) Refinancings C) Non-occupant Loans on Number Average Value Number Average Value Number Average Value
LOANS ORIGINATED 17 $77,582 6 $95,987 6 $79,315 APPLICATIONS APPROVED, NOT ACCEPTED 2 $55,360 3 $135,967 1 $71,870 APPLICATIONS DENIED 1 $63,130 0 $0 0 $0 APPLICATIONS WITHDRAWN 1 $65,070 2 $101,005 0 $0 FILES CLOSED FOR INCOMPLETENESS 0 $0 0 $0 0 $0
Aggregated Statistics For Year 2002(Based on 1 full tract) A) Conventional B) Refinancings C) Non-occupant Loans on Number Average Value Number Average Value Number Average Value
LOANS ORIGINATED 12 $85,385 9 $96,149 6 $61,833 APPLICATIONS APPROVED, NOT ACCEPTED 4 $94,692 5 $112,660 1 $42,730 APPLICATIONS DENIED 0 $0 1 $97,120 1 $97,120 APPLICATIONS WITHDRAWN 1 $71,870 1 $157,330 1 $71,870 FILES CLOSED FOR INCOMPLETENESS 0 $0 0 $0 0 $0
Aggregated Statistics For Year 2001(Based on 1 full tract) A) Conventional B) Refinancings C) Non-occupant Loans on Number Average Value Number Average Value Number Average Value
LOANS ORIGINATED 11 $85,554 7 $71,036 5 $62,934 APPLICATIONS APPROVED, NOT ACCEPTED 0 $0 1 $76,720 0 $0 APPLICATIONS DENIED 0 $0 0 $0 0 $0 APPLICATIONS WITHDRAWN 1 $35,930 0 $0 1 $35,930 FILES CLOSED FOR INCOMPLETENESS 0 $0 0 $0 0 $0
Aggregated Statistics For Year 2000(Based on 1 full tract) A) Conventional B) Refinancings Number Average Value Number Average Value
LOANS ORIGINATED 13 $57,973 3 $95,500 APPLICATIONS APPROVED, NOT ACCEPTED 1 $59,240 1 $109,750 APPLICATIONS DENIED 0 $0 2 $63,130 APPLICATIONS WITHDRAWN 0 $0 0 $0 FILES CLOSED FOR INCOMPLETENESS 0 $0 0 $0
Aggregated Statistics For Year 1999(Based on 1 full tract) A) Conventional B) Refinancings Number Average Value Number Average Value
LOANS ORIGINATED 9 $70,973 3 $73,577 APPLICATIONS APPROVED, NOT ACCEPTED 0 $0 0 $0 APPLICATIONS DENIED 0 $0 1 $125,990 APPLICATIONS WITHDRAWN 0 $0 0 $0 FILES CLOSED FOR INCOMPLETENESS 0 $0 0 $0
Detailed PMIC statistics for the following Tracts:
0132.00
Fire-safe hotels and motels in Shippensburg, Pennsylvania:
Best Western Shippensburg Hotel, 125 Walnut Btm Rd, Shippensburg, Pennsylvania 17257 Phone: (717) 532-5200, Fax: (717) 532-7148
Quality Inn & Suites Shippen Place Hotel, 32 E King St, Shippensburg, Pennsylvania 17257 Phone: (717) 532-4141
Holiday Inn Express & Suites Shippensburg PA, 120 Walnut Bottom Dr, Shippensburg, Pennsylvania 17257 Phone: (717) 532-1100, Fax: (717) 532-1101
Courtyard by Marriott Shippensburg, 503 Newburg Rd, Shippensburg, Pennsylvania 17257 Phone: (717) 477-0680
All 4 fire-safe hotels and motels in Shippensburg, Pennsylvania
Most common first names in Shippensburg, PA among deceased individuals Name Count Lived (average)
John 138 74.2 years Mary 132 80.9 years William 120 72.7 years Robert 89 71.1 years Helen 84 79.2 years Charles 73 70.4 years James 71 74.1 years Margaret 69 77.8 years George 63 76.8 years Harry 62 74.0 years
Most common last names in Shippensburg, PA among deceased individuals Last name Count Lived (average)
Martin 52 74.3 years Smith 43 73.4 years Myers 33 75.5 years Varner 32 73.5 years Miller 31 71.7 years Holtry 28 76.7 years Johnson 27 68.0 years Reed 26 75.2 years Rotz 24 76.3 years Rosenberry 24 76.0 years
Shippensburg compared to Pennsylvania state average:
Median house value below state average. Unemployed percentage significantly below state average. Black race population percentage significantly below state average. Hispanic race population percentage significantly below state average. Median age significantly below state average. Foreign-born population percentage below state average. Renting percentage above state average. Number of rooms per house below state average. Shippensburg on our top lists :
#19 on the list of "Top 101 cities with the largest city-data.com crime index increase from 2011 to 2012 (population 5,000+)"
#68 on the list of "Top 101 cities with largest percentage of females in industries: retail trade (population 5,000+)"
#15 on the list of "Top 101 counties with the largest number of people without health insurance coverage in 2000 (pop. 50,000+)"
#28 on the list of "Top 101 counties with the largest increase in the number of births per 1000 residents 2000-2006 to 2007-2013 (pop 50,000+)"
#36 on the list of "Top 101 counties with the highest Particulate Matter (PM2.5 ) Annual air pollution readings in 2012 (µg/m3 )"
#81 on the list of "Top 101 counties with the lowest number of births per 1000 residents 2007-2013"
#97 on the list of "Top 101 counties with the most Mainline Protestant adherents"
Top Patent Applicants
Sanjeev T. Kuriakose (4)
David E. Beecher (4)
Dale W. Starry, Jr. (4)
Sanjeev Kuriakose (3)
Charles Robert Maybury, Jr. (3)
James A. Alger (2)
Justin Zupanc (2)
Lloyd G. Bier (2)
Bradley J. Wagner (2)
Jeffrey A. Kaminski (2)
Total of 43 patent applications in 2008-2024.

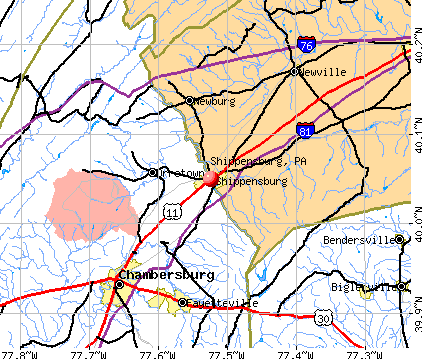


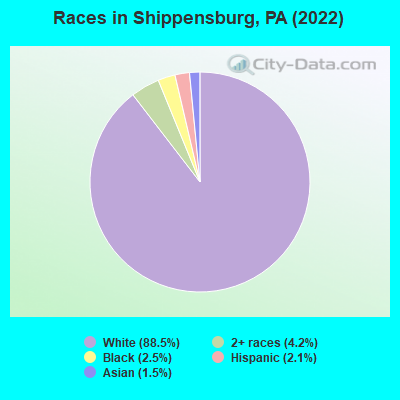
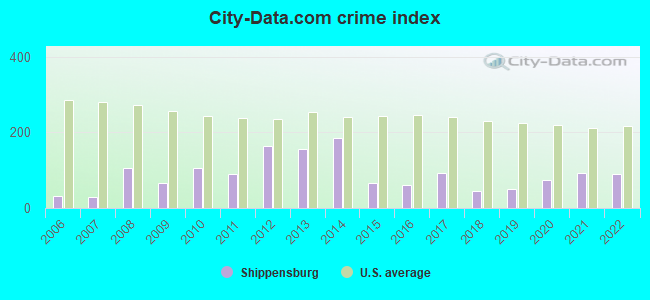
 Recent articles from our blog. Our writers, many of them Ph.D. graduates or candidates, create easy-to-read articles on a wide variety of topics.

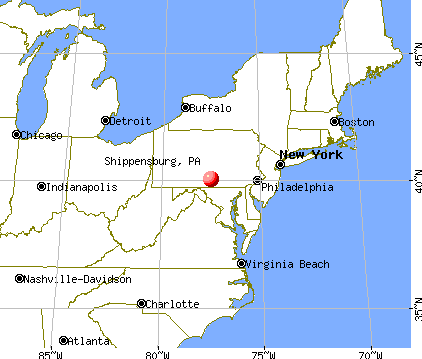
 (43.5 miles
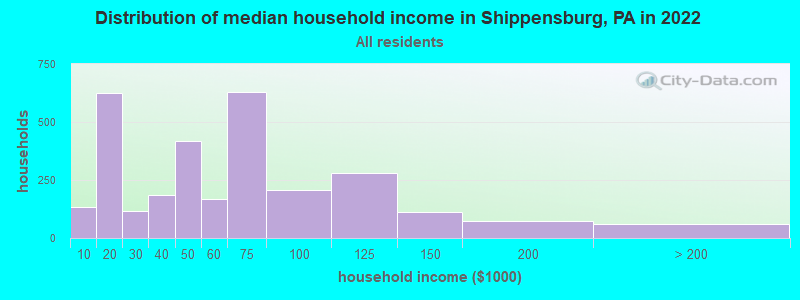
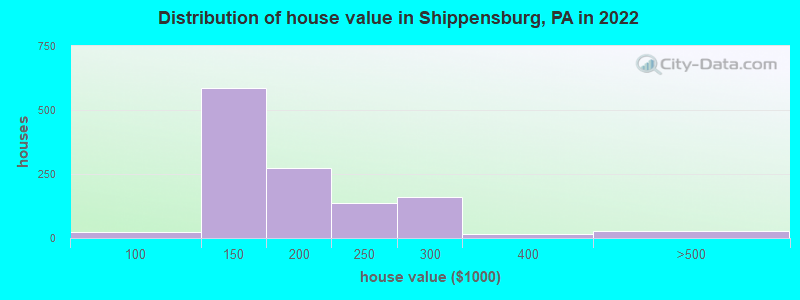
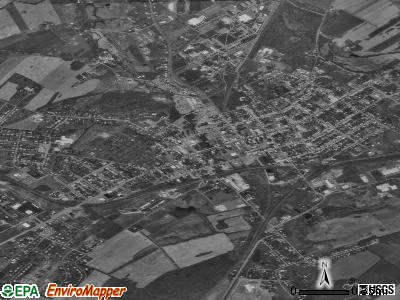
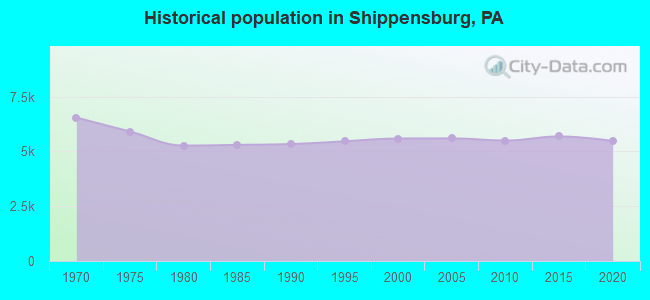
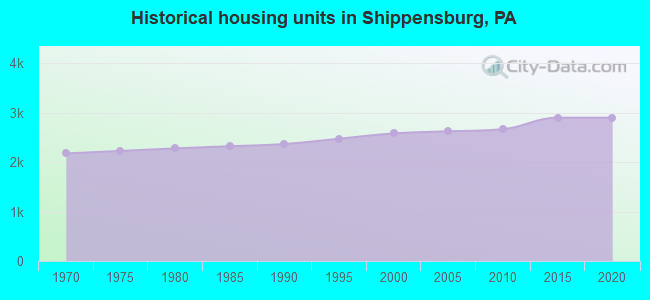
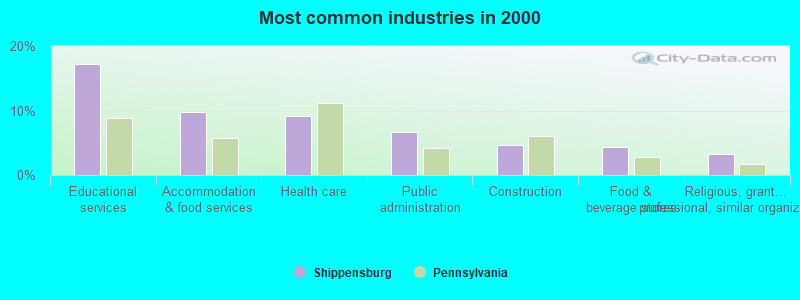
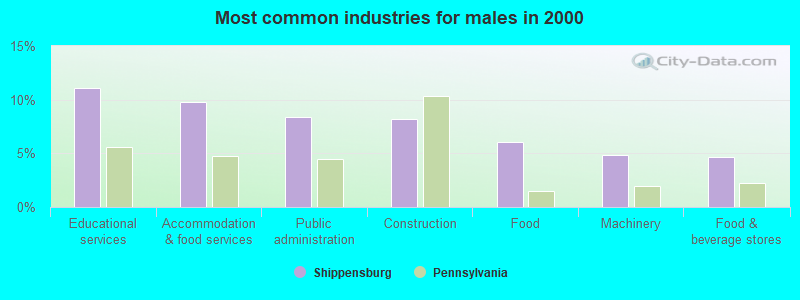
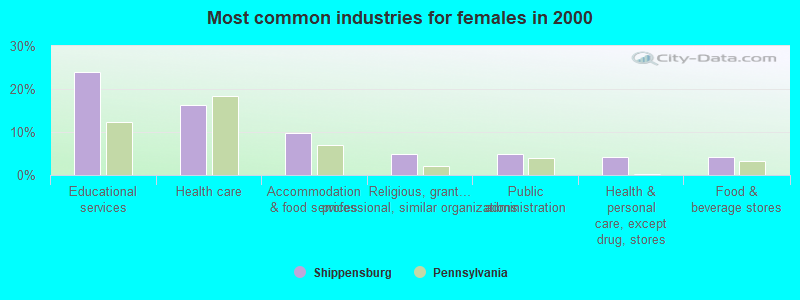
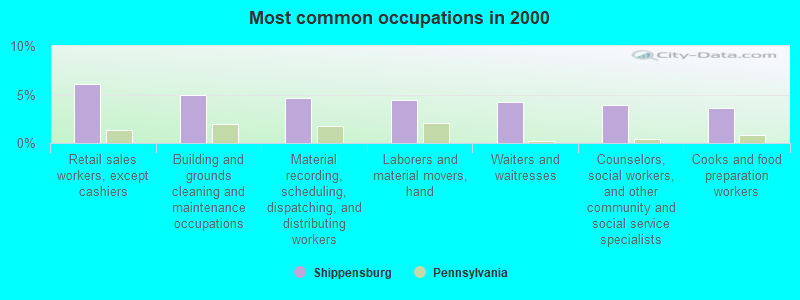
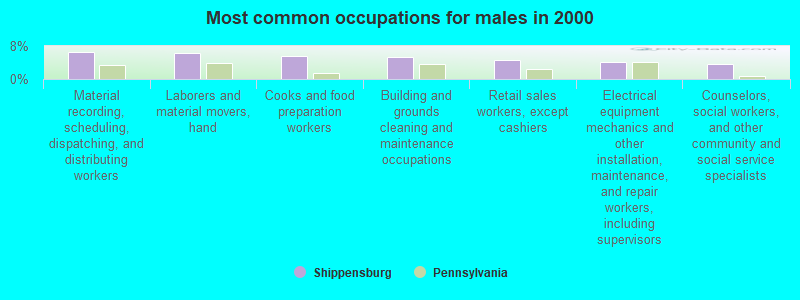
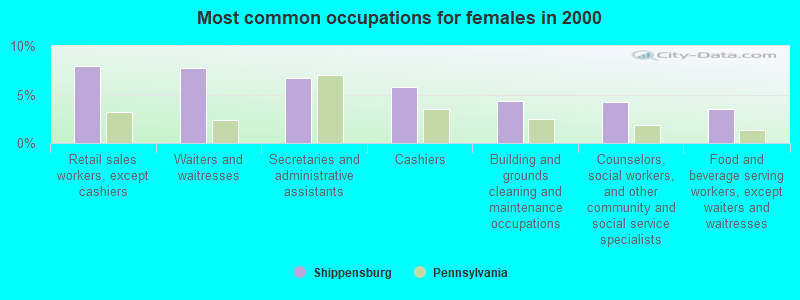
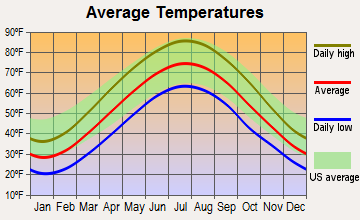
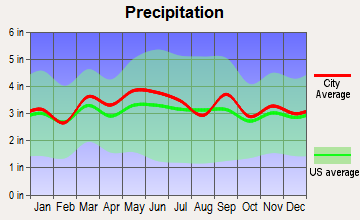
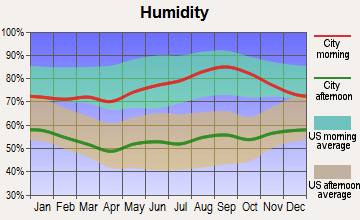
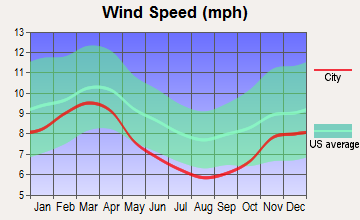
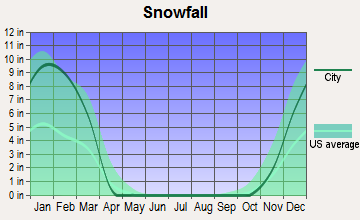
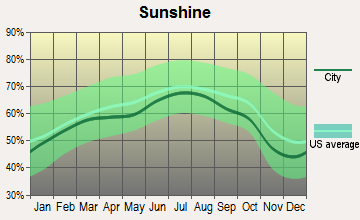
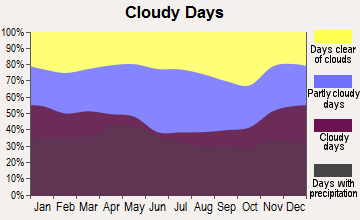


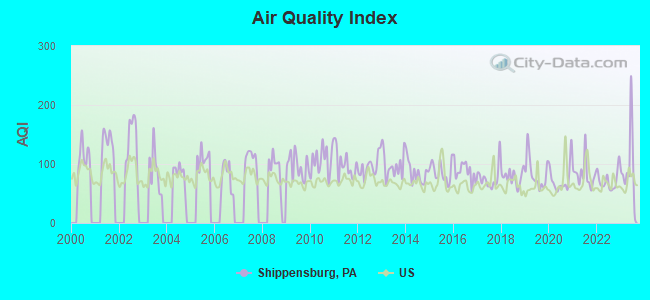
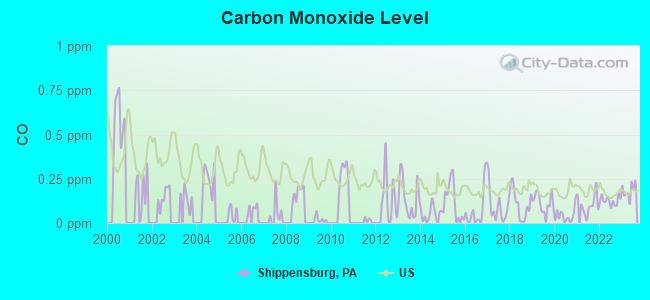
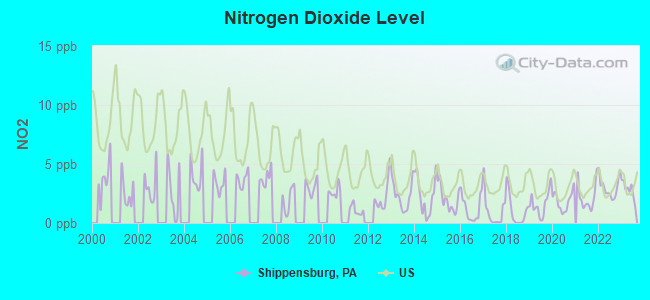
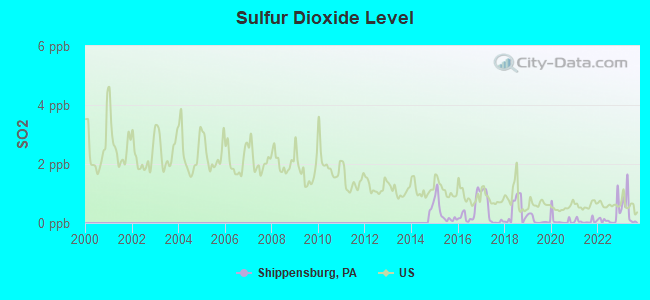
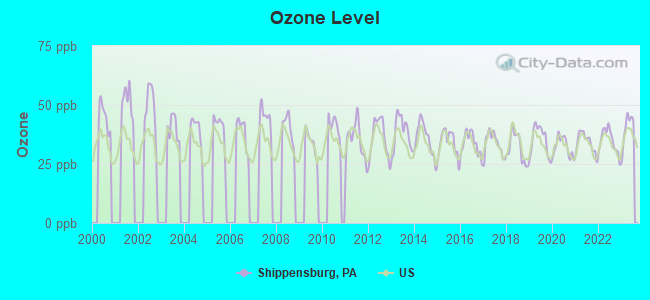
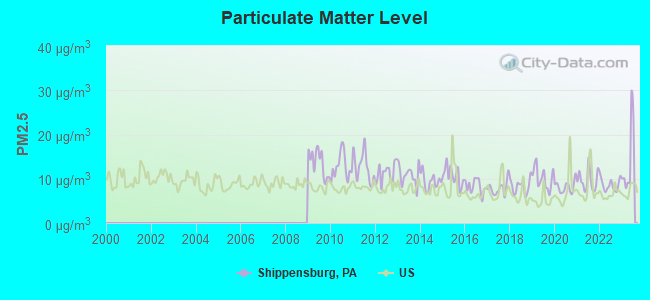

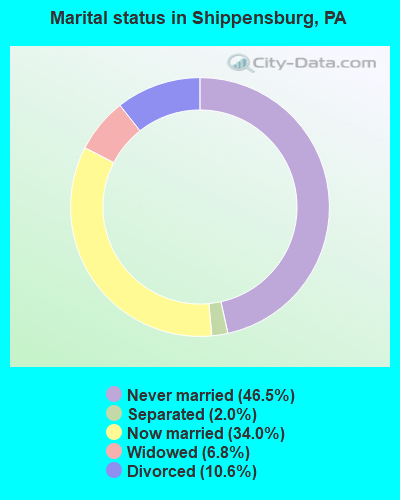
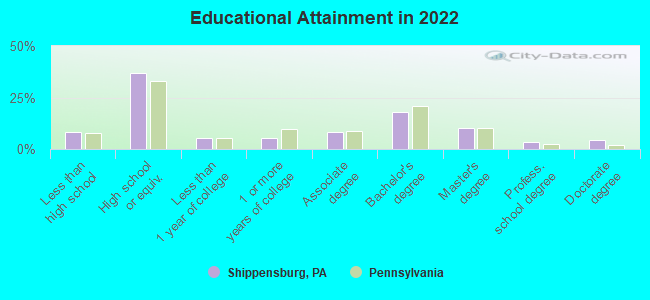
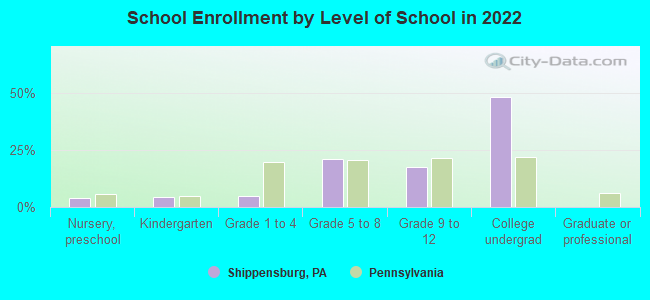
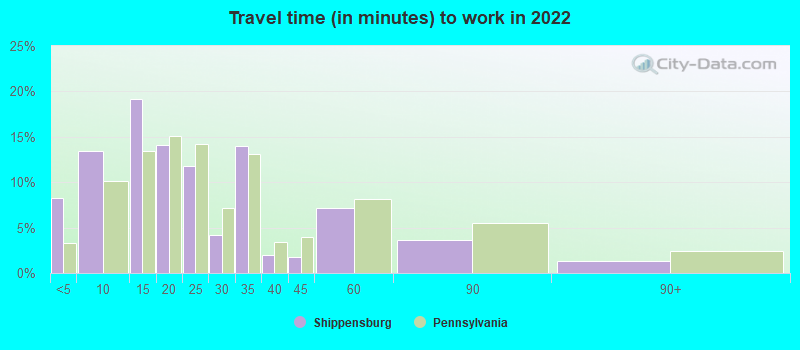
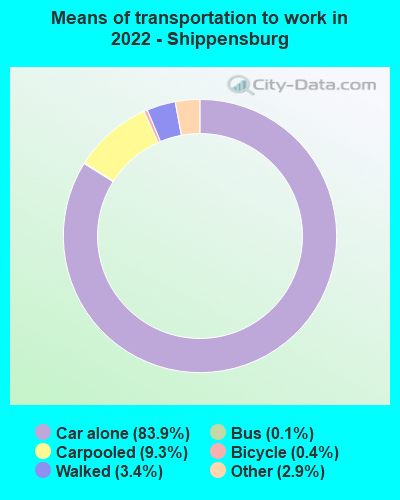
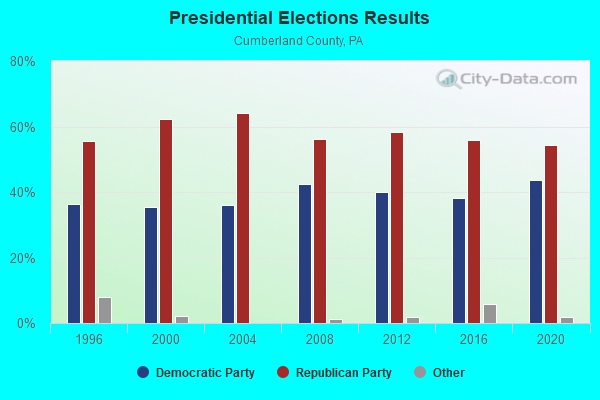
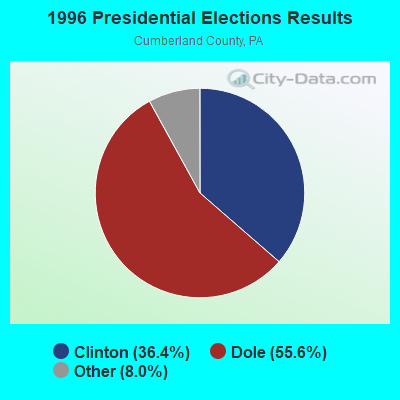

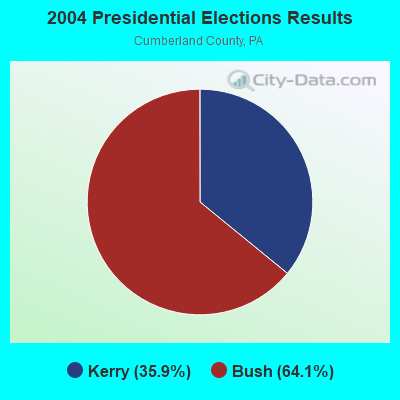
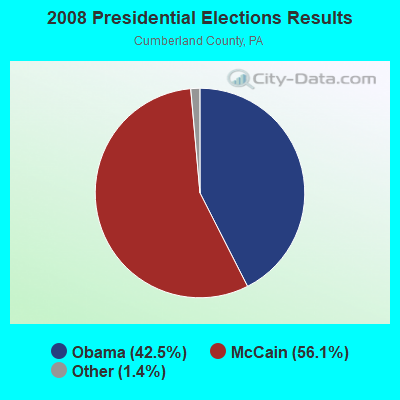
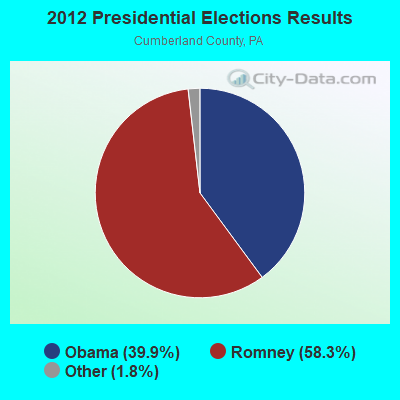
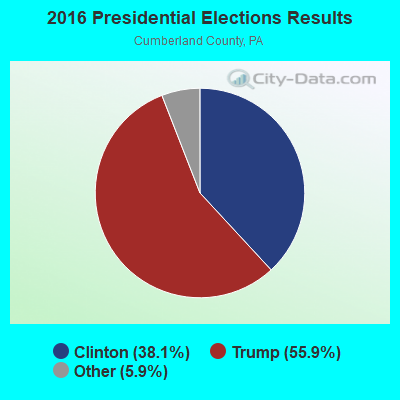
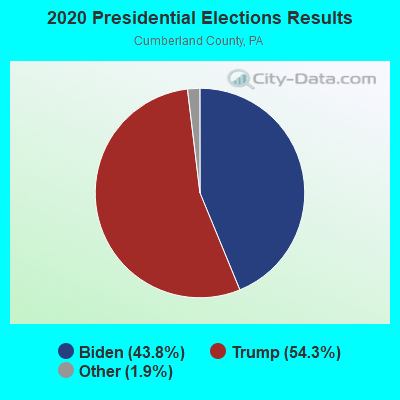
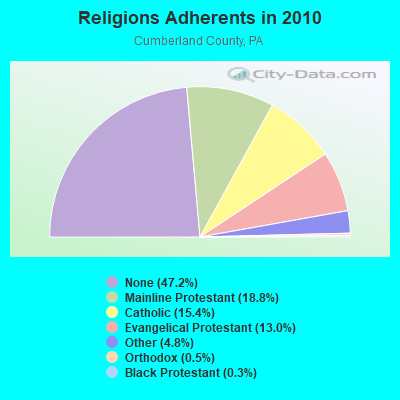
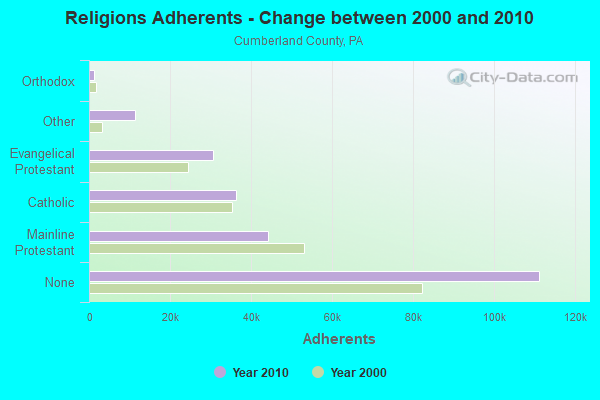
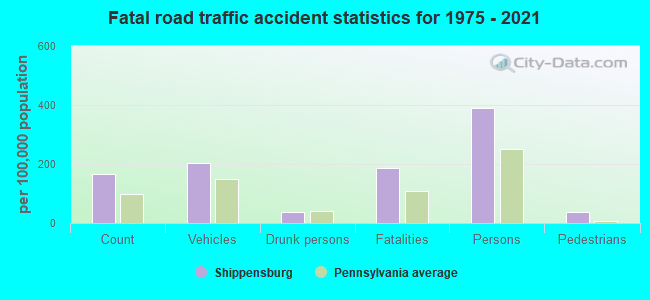
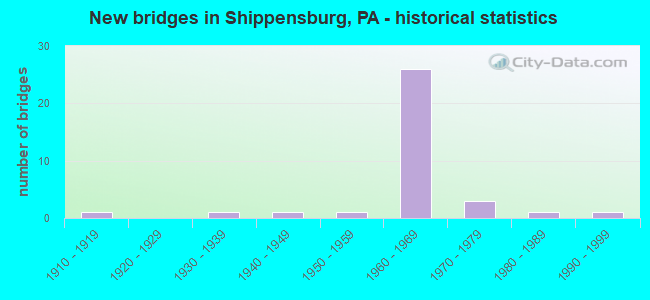
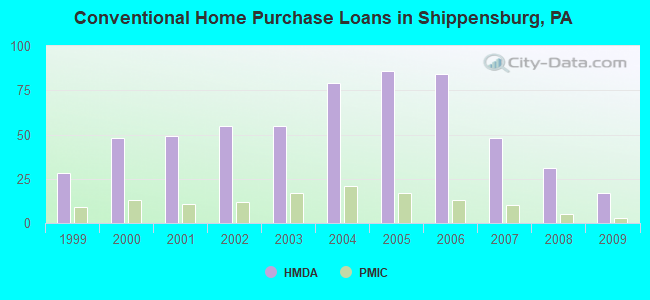
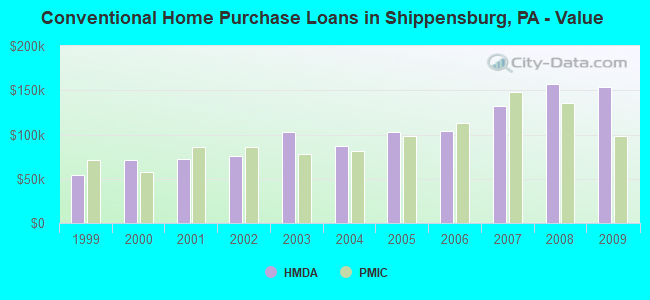
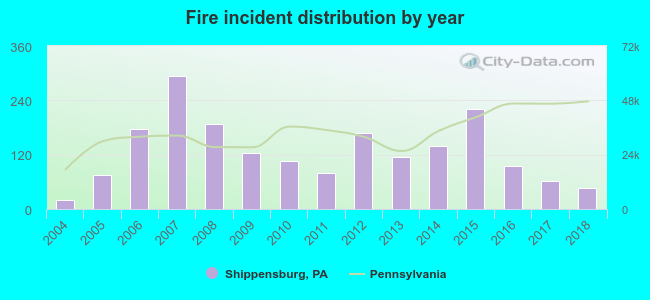 According to the data from the years 2004 - 2018 the average number of fire incidents per year is 127. The highest number of fire incidents - 294 took place in 2007, and the least - 20 in 2004. The data has an increasing trend.
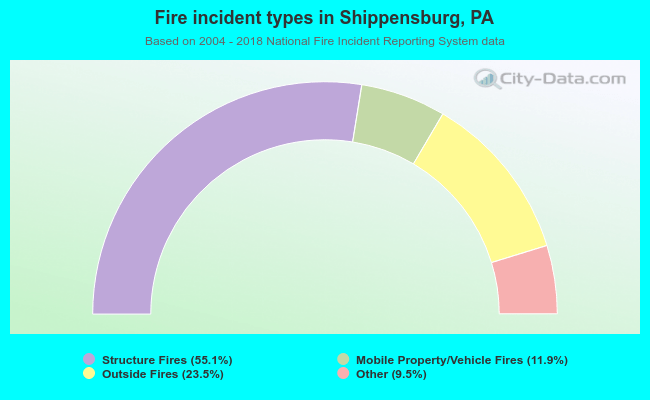 When looking into fire subcategories, the most reports belonged to: Structure Fires (55.1%), and Outside Fires (23.5%).