St. George, Utah Submit your own pictures of this city and show them to the world
OSM Map
General Map
Google Map
MSN Map
OSM Map
General Map
Google Map
MSN Map
OSM Map
General Map
Google Map
MSN Map
OSM Map
General Map
Google Map
MSN Map
Please wait while loading the map...
Population in 2022: 102,519 (92% urban, 8% rural). Population change since 2000: +106.4%Males: 51,121 Females: 51,398
March 2022 cost of living index in St. George: 91.0 (less than average, U.S. average is 100) Percentage of residents living in poverty in 2022: 11.2%for White Non-Hispanic residents , 32.4% for Black residents , 17.2% for Hispanic or Latino residents , 18.4% for American Indian residents , 7.7% for Native Hawaiian and other Pacific Islander residents , 23.1% for other race residents , 18.2% for two or more races residents )
Profiles of local businesses
Business Search - 14 Million verified businesses
Data:
Median household income ($)
Median household income (% change since 2000)
Household income diversity
Ratio of average income to average house value (%)
Ratio of average income to average rent
Median household income ($) - White
Median household income ($) - Black or African American
Median household income ($) - Asian
Median household income ($) - Hispanic or Latino
Median household income ($) - American Indian and Alaska Native
Median household income ($) - Multirace
Median household income ($) - Other Race
Median household income for houses/condos with a mortgage ($)
Median household income for apartments without a mortgage ($)
Races - White alone (%)
Races - White alone (% change since 2000)
Races - Black alone (%)
Races - Black alone (% change since 2000)
Races - American Indian alone (%)
Races - American Indian alone (% change since 2000)
Races - Asian alone (%)
Races - Asian alone (% change since 2000)
Races - Hispanic (%)
Races - Hispanic (% change since 2000)
Races - Native Hawaiian and Other Pacific Islander alone (%)
Races - Native Hawaiian and Other Pacific Islander alone (% change since 2000)
Races - Two or more races (%)
Races - Two or more races (% change since 2000)
Races - Other race alone (%)
Races - Other race alone (% change since 2000)
Racial diversity
Unemployment (%)
Unemployment (% change since 2000)
Unemployment (%) - White
Unemployment (%) - Black or African American
Unemployment (%) - Asian
Unemployment (%) - Hispanic or Latino
Unemployment (%) - American Indian and Alaska Native
Unemployment (%) - Multirace
Unemployment (%) - Other Race
Population density (people per square mile)
Population - Males (%)
Population - Females (%)
Population - Males (%) - White
Population - Males (%) - Black or African American
Population - Males (%) - Asian
Population - Males (%) - Hispanic or Latino
Population - Males (%) - American Indian and Alaska Native
Population - Males (%) - Multirace
Population - Males (%) - Other Race
Population - Females (%) - White
Population - Females (%) - Black or African American
Population - Females (%) - Asian
Population - Females (%) - Hispanic or Latino
Population - Females (%) - American Indian and Alaska Native
Population - Females (%) - Multirace
Population - Females (%) - Other Race
Coronavirus confirmed cases (Apr 27, 2024)
Deaths caused by coronavirus (Apr 27, 2024)
Coronavirus confirmed cases (per 100k population) (Apr 27, 2024)
Deaths caused by coronavirus (per 100k population) (Apr 27, 2024)
Daily increase in number of cases (Apr 27, 2024)
Weekly increase in number of cases (Apr 27, 2024)
Cases doubled (in days) (Apr 27, 2024)
Hospitalized patients (Apr 18, 2022)
Negative test results (Apr 18, 2022)
Total test results (Apr 18, 2022)
COVID Vaccine doses distributed (per 100k population) (Sep 19, 2023)
COVID Vaccine doses administered (per 100k population) (Sep 19, 2023)
COVID Vaccine doses distributed (Sep 19, 2023)
COVID Vaccine doses administered (Sep 19, 2023)
Likely homosexual households (%)
Likely homosexual households (% change since 2000)
Likely homosexual households - Lesbian couples (%)
Likely homosexual households - Lesbian couples (% change since 2000)
Likely homosexual households - Gay men (%)
Likely homosexual households - Gay men (% change since 2000)
Cost of living index
Median gross rent ($)
Median contract rent ($)
Median monthly housing costs ($)
Median house or condo value ($)
Median house or condo value ($ change since 2000)
Mean house or condo value by units in structure - 1, detached ($)
Mean house or condo value by units in structure - 1, attached ($)
Mean house or condo value by units in structure - 2 ($)
Mean house or condo value by units in structure by units in structure - 3 or 4 ($)
Mean house or condo value by units in structure - 5 or more ($)
Mean house or condo value by units in structure - Boat, RV, van, etc. ($)
Mean house or condo value by units in structure - Mobile home ($)
Median house or condo value ($) - White
Median house or condo value ($) - Black or African American
Median house or condo value ($) - Asian
Median house or condo value ($) - Hispanic or Latino
Median house or condo value ($) - American Indian and Alaska Native
Median house or condo value ($) - Multirace
Median house or condo value ($) - Other Race
Median resident age
Resident age diversity
Median resident age - Males
Median resident age - Females
Median resident age - White
Median resident age - Black or African American
Median resident age - Asian
Median resident age - Hispanic or Latino
Median resident age - American Indian and Alaska Native
Median resident age - Multirace
Median resident age - Other Race
Median resident age - Males - White
Median resident age - Males - Black or African American
Median resident age - Males - Asian
Median resident age - Males - Hispanic or Latino
Median resident age - Males - American Indian and Alaska Native
Median resident age - Males - Multirace
Median resident age - Males - Other Race
Median resident age - Females - White
Median resident age - Females - Black or African American
Median resident age - Females - Asian
Median resident age - Females - Hispanic or Latino
Median resident age - Females - American Indian and Alaska Native
Median resident age - Females - Multirace
Median resident age - Females - Other Race
Commute - mean travel time to work (minutes)
Travel time to work - Less than 5 minutes (%)
Travel time to work - Less than 5 minutes (% change since 2000)
Travel time to work - 5 to 9 minutes (%)
Travel time to work - 5 to 9 minutes (% change since 2000)
Travel time to work - 10 to 19 minutes (%)
Travel time to work - 10 to 19 minutes (% change since 2000)
Travel time to work - 20 to 29 minutes (%)
Travel time to work - 20 to 29 minutes (% change since 2000)
Travel time to work - 30 to 39 minutes (%)
Travel time to work - 30 to 39 minutes (% change since 2000)
Travel time to work - 40 to 59 minutes (%)
Travel time to work - 40 to 59 minutes (% change since 2000)
Travel time to work - 60 to 89 minutes (%)
Travel time to work - 60 to 89 minutes (% change since 2000)
Travel time to work - 90 or more minutes (%)
Travel time to work - 90 or more minutes (% change since 2000)
Marital status - Never married (%)
Marital status - Now married (%)
Marital status - Separated (%)
Marital status - Widowed (%)
Marital status - Divorced (%)
Median family income ($)
Median family income (% change since 2000)
Median non-family income ($)
Median non-family income (% change since 2000)
Median per capita income ($)
Median per capita income (% change since 2000)
Median family income ($) - White
Median family income ($) - Black or African American
Median family income ($) - Asian
Median family income ($) - Hispanic or Latino
Median family income ($) - American Indian and Alaska Native
Median family income ($) - Multirace
Median family income ($) - Other Race
Median year house/condo built
Median year apartment built
Year house built - Built 2005 or later (%)
Year house built - Built 2000 to 2004 (%)
Year house built - Built 1990 to 1999 (%)
Year house built - Built 1980 to 1989 (%)
Year house built - Built 1970 to 1979 (%)
Year house built - Built 1960 to 1969 (%)
Year house built - Built 1950 to 1959 (%)
Year house built - Built 1940 to 1949 (%)
Year house built - Built 1939 or earlier (%)
Average household size
Household density (households per square mile)
Average household size - White
Average household size - Black or African American
Average household size - Asian
Average household size - Hispanic or Latino
Average household size - American Indian and Alaska Native
Average household size - Multirace
Average household size - Other Race
Occupied housing units (%)
Vacant housing units (%)
Owner occupied housing units (%)
Renter occupied housing units (%)
Vacancy status - For rent (%)
Vacancy status - For sale only (%)
Vacancy status - Rented or sold, not occupied (%)
Vacancy status - For seasonal, recreational, or occasional use (%)
Vacancy status - For migrant workers (%)
Vacancy status - Other vacant (%)
Residents with income below the poverty level (%)
Residents with income below 50% of the poverty level (%)
Children below poverty level (%)
Poor families by family type - Married-couple family (%)
Poor families by family type - Male, no wife present (%)
Poor families by family type - Female, no husband present (%)
Poverty status for native-born residents (%)
Poverty status for foreign-born residents (%)
Poverty among high school graduates not in families (%)
Poverty among people who did not graduate high school not in families (%)
Residents with income below the poverty level (%) - White
Residents with income below the poverty level (%) - Black or African American
Residents with income below the poverty level (%) - Asian
Residents with income below the poverty level (%) - Hispanic or Latino
Residents with income below the poverty level (%) - American Indian and Alaska Native
Residents with income below the poverty level (%) - Multirace
Residents with income below the poverty level (%) - Other Race
Air pollution - Air Quality Index (AQI)
Air pollution - CO
Air pollution - NO2
Air pollution - SO2
Air pollution - Ozone
Air pollution - PM10
Air pollution - PM25
Air pollution - Pb
Crime - Murders per 100,000 population
Crime - Rapes per 100,000 population
Crime - Robberies per 100,000 population
Crime - Assaults per 100,000 population
Crime - Burglaries per 100,000 population
Crime - Thefts per 100,000 population
Crime - Auto thefts per 100,000 population
Crime - Arson per 100,000 population
Crime - City-data.com crime index
Crime - Violent crime index
Crime - Property crime index
Crime - Murders per 100,000 population (5 year average)
Crime - Rapes per 100,000 population (5 year average)
Crime - Robberies per 100,000 population (5 year average)
Crime - Assaults per 100,000 population (5 year average)
Crime - Burglaries per 100,000 population (5 year average)
Crime - Thefts per 100,000 population (5 year average)
Crime - Auto thefts per 100,000 population (5 year average)
Crime - Arson per 100,000 population (5 year average)
Crime - City-data.com crime index (5 year average)
Crime - Violent crime index (5 year average)
Crime - Property crime index (5 year average)
1996 Presidential Elections Results (%) - Democratic Party (Clinton)
1996 Presidential Elections Results (%) - Republican Party (Dole)
1996 Presidential Elections Results (%) - Other
2000 Presidential Elections Results (%) - Democratic Party (Gore)
2000 Presidential Elections Results (%) - Republican Party (Bush)
2000 Presidential Elections Results (%) - Other
2004 Presidential Elections Results (%) - Democratic Party (Kerry)
2004 Presidential Elections Results (%) - Republican Party (Bush)
2004 Presidential Elections Results (%) - Other
2008 Presidential Elections Results (%) - Democratic Party (Obama)
2008 Presidential Elections Results (%) - Republican Party (McCain)
2008 Presidential Elections Results (%) - Other
2012 Presidential Elections Results (%) - Democratic Party (Obama)
2012 Presidential Elections Results (%) - Republican Party (Romney)
2012 Presidential Elections Results (%) - Other
2016 Presidential Elections Results (%) - Democratic Party (Clinton)
2016 Presidential Elections Results (%) - Republican Party (Trump)
2016 Presidential Elections Results (%) - Other
2020 Presidential Elections Results (%) - Democratic Party (Biden)
2020 Presidential Elections Results (%) - Republican Party (Trump)
2020 Presidential Elections Results (%) - Other
Ancestries Reported - Arab (%)
Ancestries Reported - Czech (%)
Ancestries Reported - Danish (%)
Ancestries Reported - Dutch (%)
Ancestries Reported - English (%)
Ancestries Reported - French (%)
Ancestries Reported - French Canadian (%)
Ancestries Reported - German (%)
Ancestries Reported - Greek (%)
Ancestries Reported - Hungarian (%)
Ancestries Reported - Irish (%)
Ancestries Reported - Italian (%)
Ancestries Reported - Lithuanian (%)
Ancestries Reported - Norwegian (%)
Ancestries Reported - Polish (%)
Ancestries Reported - Portuguese (%)
Ancestries Reported - Russian (%)
Ancestries Reported - Scotch-Irish (%)
Ancestries Reported - Scottish (%)
Ancestries Reported - Slovak (%)
Ancestries Reported - Subsaharan African (%)
Ancestries Reported - Swedish (%)
Ancestries Reported - Swiss (%)
Ancestries Reported - Ukrainian (%)
Ancestries Reported - United States (%)
Ancestries Reported - Welsh (%)
Ancestries Reported - West Indian (%)
Ancestries Reported - Other (%)
Educational Attainment - No schooling completed (%)
Educational Attainment - Less than high school (%)
Educational Attainment - High school or equivalent (%)
Educational Attainment - Less than 1 year of college (%)
Educational Attainment - 1 or more years of college (%)
Educational Attainment - Associate degree (%)
Educational Attainment - Bachelor's degree (%)
Educational Attainment - Master's degree (%)
Educational Attainment - Professional school degree (%)
Educational Attainment - Doctorate degree (%)
School Enrollment - Nursery, preschool (%)
School Enrollment - Kindergarten (%)
School Enrollment - Grade 1 to 4 (%)
School Enrollment - Grade 5 to 8 (%)
School Enrollment - Grade 9 to 12 (%)
School Enrollment - College undergrad (%)
School Enrollment - Graduate or professional (%)
School Enrollment - Not enrolled in school (%)
School enrollment - Public schools (%)
School enrollment - Private schools (%)
School enrollment - Not enrolled (%)
Median number of rooms in houses and condos
Median number of rooms in apartments
Housing units lacking complete plumbing facilities (%)
Housing units lacking complete kitchen facilities (%)
Density of houses
Urban houses (%)
Rural houses (%)
Households with people 60 years and over (%)
Households with people 65 years and over (%)
Households with people 75 years and over (%)
Households with one or more nonrelatives (%)
Households with no nonrelatives (%)
Population in households (%)
Family households (%)
Nonfamily households (%)
Population in families (%)
Family households with own children (%)
Median number of bedrooms in owner occupied houses
Mean number of bedrooms in owner occupied houses
Median number of bedrooms in renter occupied houses
Mean number of bedrooms in renter occupied houses
Median number of vehichles in owner occupied houses
Mean number of vehichles in owner occupied houses
Median number of vehichles in renter occupied houses
Mean number of vehichles in renter occupied houses
Mortgage status - with mortgage (%)
Mortgage status - with second mortgage (%)
Mortgage status - with home equity loan (%)
Mortgage status - with both second mortgage and home equity loan (%)
Mortgage status - without a mortgage (%)
Average family size
Average family size - White
Average family size - Black or African American
Average family size - Asian
Average family size - Hispanic or Latino
Average family size - American Indian and Alaska Native
Average family size - Multirace
Average family size - Other Race
Geographical mobility - Same house 1 year ago (%)
Geographical mobility - Moved within same county (%)
Geographical mobility - Moved from different county within same state (%)
Geographical mobility - Moved from different state (%)
Geographical mobility - Moved from abroad (%)
Place of birth - Born in state of residence (%)
Place of birth - Born in other state (%)
Place of birth - Native, outside of US (%)
Place of birth - Foreign born (%)
Housing units in structures - 1, detached (%)
Housing units in structures - 1, attached (%)
Housing units in structures - 2 (%)
Housing units in structures - 3 or 4 (%)
Housing units in structures - 5 to 9 (%)
Housing units in structures - 10 to 19 (%)
Housing units in structures - 20 to 49 (%)
Housing units in structures - 50 or more (%)
Housing units in structures - Mobile home (%)
Housing units in structures - Boat, RV, van, etc. (%)
House/condo owner moved in on average (years ago)
Renter moved in on average (years ago)
Year householder moved into unit - Moved in 1999 to March 2000 (%)
Year householder moved into unit - Moved in 1995 to 1998 (%)
Year householder moved into unit - Moved in 1990 to 1994 (%)
Year householder moved into unit - Moved in 1980 to 1989 (%)
Year householder moved into unit - Moved in 1970 to 1979 (%)
Year householder moved into unit - Moved in 1969 or earlier (%)
Means of transportation to work - Drove car alone (%)
Means of transportation to work - Carpooled (%)
Means of transportation to work - Public transportation (%)
Means of transportation to work - Bus or trolley bus (%)
Means of transportation to work - Streetcar or trolley car (%)
Means of transportation to work - Subway or elevated (%)
Means of transportation to work - Railroad (%)
Means of transportation to work - Ferryboat (%)
Means of transportation to work - Taxicab (%)
Means of transportation to work - Motorcycle (%)
Means of transportation to work - Bicycle (%)
Means of transportation to work - Walked (%)
Means of transportation to work - Other means (%)
Working at home (%)
Industry diversity
Most Common Industries - Agriculture, forestry, fishing and hunting, and mining (%)
Most Common Industries - Agriculture, forestry, fishing and hunting (%)
Most Common Industries - Mining, quarrying, and oil and gas extraction (%)
Most Common Industries - Construction (%)
Most Common Industries - Manufacturing (%)
Most Common Industries - Wholesale trade (%)
Most Common Industries - Retail trade (%)
Most Common Industries - Transportation and warehousing, and utilities (%)
Most Common Industries - Transportation and warehousing (%)
Most Common Industries - Utilities (%)
Most Common Industries - Information (%)
Most Common Industries - Finance and insurance, and real estate and rental and leasing (%)
Most Common Industries - Finance and insurance (%)
Most Common Industries - Real estate and rental and leasing (%)
Most Common Industries - Professional, scientific, and management, and administrative and waste management services (%)
Most Common Industries - Professional, scientific, and technical services (%)
Most Common Industries - Management of companies and enterprises (%)
Most Common Industries - Administrative and support and waste management services (%)
Most Common Industries - Educational services, and health care and social assistance (%)
Most Common Industries - Educational services (%)
Most Common Industries - Health care and social assistance (%)
Most Common Industries - Arts, entertainment, and recreation, and accommodation and food services (%)
Most Common Industries - Arts, entertainment, and recreation (%)
Most Common Industries - Accommodation and food services (%)
Most Common Industries - Other services, except public administration (%)
Most Common Industries - Public administration (%)
Occupation diversity
Most Common Occupations - Management, business, science, and arts occupations (%)
Most Common Occupations - Management, business, and financial occupations (%)
Most Common Occupations - Management occupations (%)
Most Common Occupations - Business and financial operations occupations (%)
Most Common Occupations - Computer, engineering, and science occupations (%)
Most Common Occupations - Computer and mathematical occupations (%)
Most Common Occupations - Architecture and engineering occupations (%)
Most Common Occupations - Life, physical, and social science occupations (%)
Most Common Occupations - Education, legal, community service, arts, and media occupations (%)
Most Common Occupations - Community and social service occupations (%)
Most Common Occupations - Legal occupations (%)
Most Common Occupations - Education, training, and library occupations (%)
Most Common Occupations - Arts, design, entertainment, sports, and media occupations (%)
Most Common Occupations - Healthcare practitioners and technical occupations (%)
Most Common Occupations - Health diagnosing and treating practitioners and other technical occupations (%)
Most Common Occupations - Health technologists and technicians (%)
Most Common Occupations - Service occupations (%)
Most Common Occupations - Healthcare support occupations (%)
Most Common Occupations - Protective service occupations (%)
Most Common Occupations - Fire fighting and prevention, and other protective service workers including supervisors (%)
Most Common Occupations - Law enforcement workers including supervisors (%)
Most Common Occupations - Food preparation and serving related occupations (%)
Most Common Occupations - Building and grounds cleaning and maintenance occupations (%)
Most Common Occupations - Personal care and service occupations (%)
Most Common Occupations - Sales and office occupations (%)
Most Common Occupations - Sales and related occupations (%)
Most Common Occupations - Office and administrative support occupations (%)
Most Common Occupations - Natural resources, construction, and maintenance occupations (%)
Most Common Occupations - Farming, fishing, and forestry occupations (%)
Most Common Occupations - Construction and extraction occupations (%)
Most Common Occupations - Installation, maintenance, and repair occupations (%)
Most Common Occupations - Production, transportation, and material moving occupations (%)
Most Common Occupations - Production occupations (%)
Most Common Occupations - Transportation occupations (%)
Most Common Occupations - Material moving occupations (%)
People in Group quarters - Institutionalized population (%)
People in Group quarters - Correctional institutions (%)
People in Group quarters - Federal prisons and detention centers (%)
People in Group quarters - Halfway houses (%)
People in Group quarters - Local jails and other confinement facilities (including police lockups) (%)
People in Group quarters - Military disciplinary barracks (%)
People in Group quarters - State prisons (%)
People in Group quarters - Other types of correctional institutions (%)
People in Group quarters - Nursing homes (%)
People in Group quarters - Hospitals/wards, hospices, and schools for the handicapped (%)
People in Group quarters - Hospitals/wards and hospices for chronically ill (%)
People in Group quarters - Hospices or homes for chronically ill (%)
People in Group quarters - Military hospitals or wards for chronically ill (%)
People in Group quarters - Other hospitals or wards for chronically ill (%)
People in Group quarters - Hospitals or wards for drug/alcohol abuse (%)
People in Group quarters - Mental (Psychiatric) hospitals or wards (%)
People in Group quarters - Schools, hospitals, or wards for the mentally retarded (%)
People in Group quarters - Schools, hospitals, or wards for the physically handicapped (%)
People in Group quarters - Institutions for the deaf (%)
People in Group quarters - Institutions for the blind (%)
People in Group quarters - Orthopedic wards and institutions for the physically handicapped (%)
People in Group quarters - Wards in general hospitals for patients who have no usual home elsewhere (%)
People in Group quarters - Wards in military hospitals for patients who have no usual home elsewhere (%)
People in Group quarters - Juvenile institutions (%)
People in Group quarters - Long-term care (%)
People in Group quarters - Homes for abused, dependent, and neglected children (%)
People in Group quarters - Residential treatment centers for emotionally disturbed children (%)
People in Group quarters - Training schools for juvenile delinquents (%)
People in Group quarters - Short-term care, detention or diagnostic centers for delinquent children (%)
People in Group quarters - Type of juvenile institution unknown (%)
People in Group quarters - Noninstitutionalized population (%)
People in Group quarters - College dormitories (includes college quarters off campus) (%)
People in Group quarters - Military quarters (%)
People in Group quarters - On base (%)
People in Group quarters - Barracks, unaccompanied personnel housing (UPH), (Enlisted/Officer), ;and similar group living quarters for military personnel (%)
People in Group quarters - Transient quarters for temporary residents (%)
People in Group quarters - Military ships (%)
People in Group quarters - Group homes (%)
People in Group quarters - Homes or halfway houses for drug/alcohol abuse (%)
People in Group quarters - Homes for the mentally ill (%)
People in Group quarters - Homes for the mentally retarded (%)
People in Group quarters - Homes for the physically handicapped (%)
People in Group quarters - Other group homes (%)
People in Group quarters - Religious group quarters (%)
People in Group quarters - Dormitories (%)
People in Group quarters - Agriculture workers' dormitories on farms (%)
People in Group quarters - Job Corps and vocational training facilities (%)
People in Group quarters - Other workers' dormitories (%)
People in Group quarters - Crews of maritime vessels (%)
People in Group quarters - Other nonhousehold living situations (%)
People in Group quarters - Other noninstitutional group quarters (%)
Residents speaking English at home (%)
Residents speaking English at home - Born in the United States (%)
Residents speaking English at home - Native, born elsewhere (%)
Residents speaking English at home - Foreign born (%)
Residents speaking Spanish at home (%)
Residents speaking Spanish at home - Born in the United States (%)
Residents speaking Spanish at home - Native, born elsewhere (%)
Residents speaking Spanish at home - Foreign born (%)
Residents speaking other language at home (%)
Residents speaking other language at home - Born in the United States (%)
Residents speaking other language at home - Native, born elsewhere (%)
Residents speaking other language at home - Foreign born (%)
Class of Workers - Employee of private company (%)
Class of Workers - Self-employed in own incorporated business (%)
Class of Workers - Private not-for-profit wage and salary workers (%)
Class of Workers - Local government workers (%)
Class of Workers - State government workers (%)
Class of Workers - Federal government workers (%)
Class of Workers - Self-employed workers in own not incorporated business and Unpaid family workers (%)
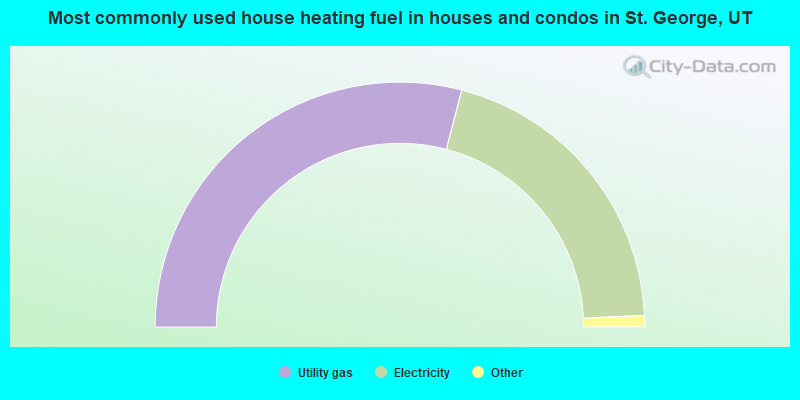
House heating fuel used in houses and condos - Utility gas (%)
House heating fuel used in houses and condos - Bottled, tank, or LP gas (%)
House heating fuel used in houses and condos - Electricity (%)
House heating fuel used in houses and condos - Fuel oil, kerosene, etc. (%)
House heating fuel used in houses and condos - Coal or coke (%)
House heating fuel used in houses and condos - Wood (%)
House heating fuel used in houses and condos - Solar energy (%)
House heating fuel used in houses and condos - Other fuel (%)
House heating fuel used in houses and condos - No fuel used (%)
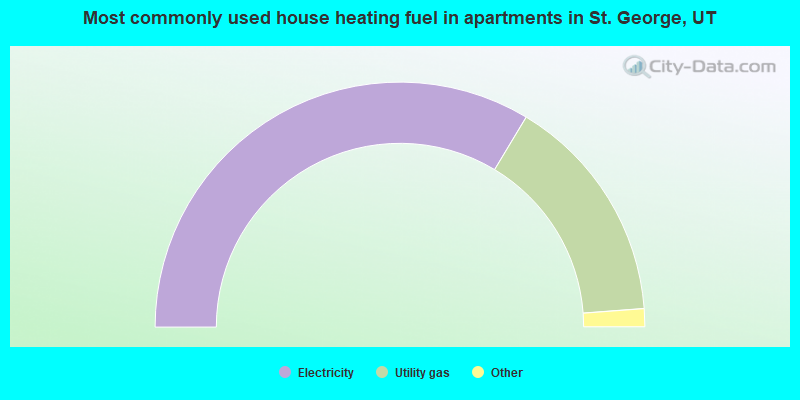
House heating fuel used in apartments - Utility gas (%)
House heating fuel used in apartments - Bottled, tank, or LP gas (%)
House heating fuel used in apartments - Electricity (%)
House heating fuel used in apartments - Fuel oil, kerosene, etc. (%)
House heating fuel used in apartments - Coal or coke (%)
House heating fuel used in apartments - Wood (%)
House heating fuel used in apartments - Solar energy (%)
House heating fuel used in apartments - Other fuel (%)
House heating fuel used in apartments - No fuel used (%)
Armed forces status - In Armed Forces (%)
Armed forces status - Civilian (%)
Armed forces status - Civilian - Veteran (%)
Armed forces status - Civilian - Nonveteran (%)
Fatal accidents locations in years 2005-2021
Fatal accidents locations in 2005
Fatal accidents locations in 2006
Fatal accidents locations in 2007
Fatal accidents locations in 2008
Fatal accidents locations in 2009
Fatal accidents locations in 2010
Fatal accidents locations in 2011
Fatal accidents locations in 2012
Fatal accidents locations in 2013
Fatal accidents locations in 2014
Fatal accidents locations in 2015
Fatal accidents locations in 2016
Fatal accidents locations in 2017
Fatal accidents locations in 2018
Fatal accidents locations in 2019
Fatal accidents locations in 2020
Fatal accidents locations in 2021
Alcohol use - People drinking some alcohol every month (%)
Alcohol use - People not drinking at all (%)
Alcohol use - Average days/month drinking alcohol
Alcohol use - Average drinks/week
Alcohol use - Average days/year people drink much
Audiometry - Average condition of hearing (%)
Audiometry - People that can hear a whisper from across a quiet room (%)
Audiometry - People that can hear normal voice from across a quiet room (%)
Audiometry - Ears ringing, roaring, buzzing (%)
Audiometry - Had a job exposure to loud noise (%)
Audiometry - Had off-work exposure to loud noise (%)
Blood Pressure & Cholesterol - Has high blood pressure (%)
Blood Pressure & Cholesterol - Checking blood pressure at home (%)
Blood Pressure & Cholesterol - Frequently checking blood cholesterol (%)
Blood Pressure & Cholesterol - Has high cholesterol level (%)
Consumer Behavior - Money monthly spent on food at supermarket/grocery store
Consumer Behavior - Money monthly spent on food at other stores
Consumer Behavior - Money monthly spent on eating out
Consumer Behavior - Money monthly spent on carryout/delivered foods
Consumer Behavior - Income spent on food at supermarket/grocery store (%)
Consumer Behavior - Income spent on food at other stores (%)
Consumer Behavior - Income spent on eating out (%)
Consumer Behavior - Income spent on carryout/delivered foods (%)
Current Health Status - General health condition (%)
Current Health Status - Blood donors (%)
Current Health Status - Has blood ever tested for HIV virus (%)
Current Health Status - Left-handed people (%)
Dermatology - People using sunscreen (%)
Diabetes - Diabetics (%)
Diabetes - Had a blood test for high blood sugar (%)
Diabetes - People taking insulin (%)
Diet Behavior & Nutrition - Diet health (%)
Diet Behavior & Nutrition - Milk product consumption (# of products/month)
Diet Behavior & Nutrition - Meals not home prepared (#/week)
Diet Behavior & Nutrition - Meals from fast food or pizza place (#/week)
Diet Behavior & Nutrition - Ready-to-eat foods (#/month)
Diet Behavior & Nutrition - Frozen meals/pizza (#/month)
Drug Use - People that ever used marijuana or hashish (%)
Drug Use - Ever used hard drugs (%)
Drug Use - Ever used any form of cocaine (%)
Drug Use - Ever used heroin (%)
Drug Use - Ever used methamphetamine (%)
Health Insurance - People covered by health insurance (%)
Kidney Conditions-Urology - Avg. # of times urinating at night
Medical Conditions - People with asthma (%)
Medical Conditions - People with anemia (%)
Medical Conditions - People with psoriasis (%)
Medical Conditions - People with overweight (%)
Medical Conditions - Elderly people having difficulties in thinking or remembering (%)
Medical Conditions - People who ever received blood transfusion (%)
Medical Conditions - People having trouble seeing even with glass/contacts (%)
Medical Conditions - People with arthritis (%)
Medical Conditions - People with gout (%)
Medical Conditions - People with congestive heart failure (%)
Medical Conditions - People with coronary heart disease (%)
Medical Conditions - People with angina pectoris (%)
Medical Conditions - People who ever had heart attack (%)
Medical Conditions - People who ever had stroke (%)
Medical Conditions - People with emphysema (%)
Medical Conditions - People with thyroid problem (%)
Medical Conditions - People with chronic bronchitis (%)
Medical Conditions - People with any liver condition (%)
Medical Conditions - People who ever had cancer or malignancy (%)
Mental Health - People who have little interest in doing things (%)
Mental Health - People feeling down, depressed, or hopeless (%)
Mental Health - People who have trouble sleeping or sleeping too much (%)
Mental Health - People feeling tired or having little energy (%)
Mental Health - People with poor appetite or overeating (%)
Mental Health - People feeling bad about themself (%)
Mental Health - People who have trouble concentrating on things (%)
Mental Health - People moving or speaking slowly or too fast (%)
Mental Health - People having thoughts they would be better off dead (%)
Oral Health - Average years since last visit a dentist
Oral Health - People embarrassed because of mouth (%)
Oral Health - People with gum disease (%)
Oral Health - General health of teeth and gums (%)
Oral Health - Average days a week using dental floss/device
Oral Health - Average days a week using mouthwash for dental problem
Oral Health - Average number of teeth
Pesticide Use - Households using pesticides to control insects (%)
Pesticide Use - Households using pesticides to kill weeds (%)
Physical Activity - People doing vigorous-intensity work activities (%)
Physical Activity - People doing moderate-intensity work activities (%)
Physical Activity - People walking or bicycling (%)
Physical Activity - People doing vigorous-intensity recreational activities (%)
Physical Activity - People doing moderate-intensity recreational activities (%)
Physical Activity - Average hours a day doing sedentary activities
Physical Activity - Average hours a day watching TV or videos
Physical Activity - Average hours a day using computer
Physical Functioning - People having limitations keeping them from working (%)
Physical Functioning - People limited in amount of work they can do (%)
Physical Functioning - People that need special equipment to walk (%)
Physical Functioning - People experiencing confusion/memory problems (%)
Physical Functioning - People requiring special healthcare equipment (%)
Prescription Medications - Average number of prescription medicines taking
Preventive Aspirin Use - Adults 40+ taking low-dose aspirin (%)
Reproductive Health - Vaginal deliveries (%)
Reproductive Health - Cesarean deliveries (%)
Reproductive Health - Deliveries resulted in a live birth (%)
Reproductive Health - Pregnancies resulted in a delivery (%)
Reproductive Health - Women breastfeeding newborns (%)
Reproductive Health - Women that had a hysterectomy (%)
Reproductive Health - Women that had both ovaries removed (%)
Reproductive Health - Women that have ever taken birth control pills (%)
Reproductive Health - Women taking birth control pills (%)
Reproductive Health - Women that have ever used Depo-Provera or injectables (%)
Reproductive Health - Women that have ever used female hormones (%)
Sexual Behavior - People 18+ that ever had sex (vaginal, anal, or oral) (%)
Sexual Behavior - Males 18+ that ever had vaginal sex with a woman (%)
Sexual Behavior - Males 18+ that ever performed oral sex on a woman (%)
Sexual Behavior - Males 18+ that ever had anal sex with a woman (%)
Sexual Behavior - Males 18+ that ever had any sex with a man (%)
Sexual Behavior - Females 18+ that ever had vaginal sex with a man (%)
Sexual Behavior - Females 18+ that ever performed oral sex on a man (%)
Sexual Behavior - Females 18+ that ever had anal sex with a man (%)
Sexual Behavior - Females 18+ that ever had any kind of sex with a woman (%)
Sexual Behavior - Average age people first had sex
Sexual Behavior - Average number of female sex partners in lifetime (males 18+)
Sexual Behavior - Average number of female vaginal sex partners in lifetime (males 18+)
Sexual Behavior - Average age people first performed oral sex on a woman (18+)
Sexual Behavior - Average number of woman performed oral sex on in lifetime (18+)
Sexual Behavior - Average number of male sex partners in lifetime (males 18+)
Sexual Behavior - Average number of male anal sex partners in lifetime (males 18+)
Sexual Behavior - Average age people first performed oral sex on a man (18+)
Sexual Behavior - Average number of male oral sex partners in lifetime (18+)
Sexual Behavior - People using protection when performing oral sex (%)
Sexual Behavior - Average number of times people have vaginal or anal sex a year
Sexual Behavior - People having sex without condom (%)
Sexual Behavior - Average number of male sex partners in lifetime (females 18+)
Sexual Behavior - Average number of male vaginal sex partners in lifetime (females 18+)
Sexual Behavior - Average number of female sex partners in lifetime (females 18+)
Sexual Behavior - Circumcised males 18+ (%)
Sleep Disorders - Average hours sleeping at night
Sleep Disorders - People that has trouble sleeping (%)
Smoking-Cigarette Use - People smoking cigarettes (%)
Taste & Smell - People 40+ having problems with smell (%)
Taste & Smell - People 40+ having problems with taste (%)
Taste & Smell - People 40+ that ever had wisdom teeth removed (%)
Taste & Smell - People 40+ that ever had tonsils teeth removed (%)
Taste & Smell - People 40+ that ever had a loss of consciousness because of a head injury (%)
Taste & Smell - People 40+ that ever had a broken nose or other serious injury to face or skull (%)
Taste & Smell - People 40+ that ever had two or more sinus infections (%)
Weight - Average height (inches)
Weight - Average weight (pounds)
Weight - Average BMI
Weight - People that are obese (%)
Weight - People that ever were obese (%)
Weight - People trying to lose weight (%)
According to our research of Utah and other state lists, there were 168 registered sex offenders living in St. George, Utah as of April 26, 2024 . The ratio of all residents to sex offenders in St. George is 490 to 1.The ratio of registered sex offenders to all residents in this city is lower than the state average.
The City-Data.com crime index weighs serious crimes and violent crimes more heavily. Higher means more crime, U.S. average is 246.1. It adjusts for the number of visitors and daily workers commuting into cities.
- means the value is smaller than the state average.
- means the value is about the same as the state average.
- means the value is bigger than the state average.
- means the value is much bigger than the state average.
Crime rate in St. George detailed stats: murders, rapes, robberies, assaults, burglaries, thefts, arson Officers per 1,000 residents here:
1.27Utah average:
1.67
Latest news from St. George, UT collected exclusively by city-data.com from local newspapers, TV, and radio stations
Ancestries: English (23.5%), American (9.8%), European (6.9%), German (5.2%), Irish (3.1%), Scottish (2.8%).
Current Local Time:
Land area: 64.4 square miles.
Population density: 1,592 people per square mile (low).
7,159 residents are foreign born (4.7% Latin America , 0.8% Asia ).
Median real estate property taxes paid for housing units with mortgages in 2022: $1,984 (0.4%)Median real estate property taxes paid for housing units with no mortgage in 2022: $1,925 (0.4%)
Nearest city with pop. 50,000+: Sunrise Manor, NV
Nearest city with pop. 200,000+: Las Vegas, NV
Nearest city with pop. 1,000,000+: Phoenix, AZ
Nearest cities:
Latitude: 37.10 N, Longitude: 113.58 W
Daytime population change due to commuting: +17,550 (+17.1%)Workers who live and work in this city: 37,791 (85.4%)
Area code commonly used in this area: 435
St. George tourist attractions:
Single-family new house construction building permits:
2022: 1082 buildings , average cost: $145,2002021: 1470 buildings , average cost: $164,0002020: 1381 buildings , average cost: $152,3002019: 1088 buildings , average cost: $162,4002018: 987 buildings , average cost: $158,8002017: 943 buildings , average cost: $158,8002016: 796 buildings , average cost: $163,3002015: 736 buildings , average cost: $165,9002014: 753 buildings , average cost: $153,8002013: 781 buildings , average cost: $160,5002012: 577 buildings , average cost: $159,4002011: 339 buildings , average cost: $155,7002010: 270 buildings , average cost: $148,6002009: 230 buildings , average cost: $130,8002008: 296 buildings , average cost: $149,6002007: 749 buildings , average cost: $151,7002006: 924 buildings , average cost: $190,6002005: 1618 buildings , average cost: $160,4002004: 1622 buildings , average cost: $146,4002003: 1309 buildings , average cost: $137,6002002: 1006 buildings , average cost: $118,9002001: 799 buildings , average cost: $121,0002000: 623 buildings , average cost: $125,3001999: 626 buildings , average cost: $118,3001998: 715 buildings , average cost: $111,0001997: 554 buildings , average cost: $110,500Unemployment in December 2023:
Population change in the 1990s: +20,555 (+70.6%).
Most common occupations in St. George, UT (%)
Both Males Females
Retail sales workers, except cashiers (5.0%)
Other sales and related occupations, including supervisors (4.9%)
Other management occupations, except farmers and farm managers (4.8%)
Building and grounds cleaning and maintenance occupations (4.6%)
Driver/sales workers and truck drivers (3.6%)
Secretaries and administrative assistants (3.5%)
Construction traders workers except carpenters, electricians, painters, plumbers, and construction laborers (3.2%)
Driver/sales workers and truck drivers (6.1%)
Other management occupations, except farmers and farm managers (5.7%)
Construction traders workers except carpenters, electricians, painters, plumbers, and construction laborers (5.6%)
Building and grounds cleaning and maintenance occupations (5.0%)
Retail sales workers, except cashiers (4.8%)
Other sales and related occupations, including supervisors (4.7%)
Other production occupations, including supervisors (3.9%)
Secretaries and administrative assistants (7.6%)
Information and record clerks, except customer service representatives (5.8%)
Retail sales workers, except cashiers (5.4%)
Other sales and related occupations, including supervisors (5.1%)
Other office and administrative support workers, including supervisors (4.8%)
Cashiers (4.7%)
Waiters and waitresses (4.6%)
Earthquake activity:
St. George-area historical earthquake activity is significantly above Utah state average. It is 4207% greater than the overall U.S. average. On 6/28/1992 at 11:57:34, a magnitude 7.6 (6.2 MB, 7.6 MS, 7.3 MW, Depth: 0.7 mi, Class: Major, Intensity: VIII - XII) earthquake occurred 261.0 miles away from St. George center, causing 3 deaths ( 1 shaking deaths, 2 other deaths) and 400 injuries, causing $100,000,000 total damage and $40,000,000 insured lossesOn 10/16/1999 at 09:46:44, a magnitude 7.4 (6.3 MB, 7.4 MS, 7.2 MW, 7.3 ML) earthquake occurred 239.8 miles away from the city center On 7/21/1952 at 11:52:14, a magnitude 7.7 (7.7 UK) earthquake occurred 336.0 miles away from the city center, causing $50,000,000 total damage On 10/3/1915 at 06:52:48, a magnitude 7.6 (7.6 UK) earthquake occurred 316.4 miles away from St. George center On 12/21/1932 at 06:10:09, a magnitude 7.2 (7.2 UK) earthquake occurred 264.9 miles away from St. George center On 5/19/1940 at 04:36:40, a magnitude 7.2 (7.2 UK) earthquake occurred 293.5 miles away from the city center, causing $33,000,000 total damage Magnitude types: body-wave magnitude (MB), local magnitude (ML), surface-wave magnitude (MS), moment magnitude (MW) Natural disasters: The number of natural disasters in Washington County (10) is smaller than the US average (15).Major Disasters (Presidential) Declared: 4Emergencies Declared: 2Fires: 3, Floods: 3, Storms: 2, Drought: 1, Flash Flood: 1, Hurricane: 1, Winter Storm: 1, Other: 1 (Note: some incidents may be assigned to more than one category). Hospitals and medical centers near St. George: SOUTHERN UTAH HOME CARE (Home Health Center, about 1 miles away; ST GEORGE, UT)
LIBERTY DIALYSIS - ST GEORGE (Dialysis Facility, about 1 miles away; SAINT GEORGE, UT)
SOUTHERN HOSPITALITY LIVING CENTER (Nursing Home, about 1 miles away; ST GEORGE, UT)
COLOR COUNTRY CARE CTR (Nursing Home, about 2 miles away; SAINT GEORGE, UT)
HERITAGE COLOR COUNTRY CARE CNTR (Nursing Home, about 2 miles away; ST GEORGE, UT)
DIXIE DIALYSIS CENTER (Dialysis Facility, about 2 miles away; SAINT GEORGE, UT)
UTAH'S HOSPICE SPECIALISTS (Hospital, about 2 miles away; ST GEORGE, UT)
Colleges/Universities in St. George: Stevens-Henager College-St George Full-time enrollment: 175; Location: 720 South River Road; Private, not-for-profit; Website: www.stevenshenager.edu/locations/st-george)
Taylor Andrews Academy-St George Full-time enrollment: 163; Location: 42 South River Road, Suite 2; Private, for-profit; Website: www.taylorandrew.com)
Colleges/universities with over 2000 students nearest to St. George:
Dixie State University (about 1 miles; Saint George, UT ; Full-time enrollment: 6,485)
Southern Utah University (about 49 miles; Cedar City, UT ; FT enrollment: 6,522)
Nevada State College (about 108 miles; Henderson, NV ; FT enrollment: 2,346)
University of Nevada-Las Vegas (about 111 miles; Las Vegas, NV ; FT enrollment: 21,153)
College of Southern Nevada (about 113 miles; Las Vegas, NV ; FT enrollment: 18,996)
Mohave Community College (about 129 miles; Kingman, AZ ; FT enrollment: 3,309)
Northern Arizona University (about 171 miles; Flagstaff, AZ ; FT enrollment: 22,494)
Biggest public high schools in St. George: WASHINGTON COUNTY ONLINE SCHOOL Students: 1,058, Location: 121 W TABERNACLE, Grades: KG-9)DIXIE HIGH Students: 1,009, Location: 350 E 700 S, Grades: 10-12)SNOW CANYON HIGH Students: 1,008, Location: 1385 N LAVA FLOW DR, Grades: 10-12)PINE VIEW HIGH Students: 956, Location: 2850 E 750 N, Grades: 10-12)SNOW CANYON MIDDLE Students: 858, Location: 1215 N LAVA FLOW DR, Grades: 8-9)PINE VIEW MIDDLE Students: 713, Location: 2145 E 130 N, Grades: 8-9)DIXIE MIDDLE Students: 710, Location: 825 S 100 E, Grades: 8-9)MILLCREEK HIGH Students: 222, Location: 2410 E RIVERSIDE DR, Grades: 7-12)SUCCESS DSU Location: 225 SOUTH 700 EAST, Grades: 10-12, Charter school )
POST HS SELF-CONT Location: 121 W TABERNACLE, Grades: KG-12)
Private high schools in St. George: RED ROCK CANYON SCHOOL Students: 85, Location: 747 E SAINT GEORGE BLVD, Grades: 6-12)
CINNAMON HILLS YOUTH CRISIS CENTER Students: 76, Location: 770 E SAINT GEORGE BLVD, Grades: 8-12)
ABUNDANT LIFE ACADEMY Students: 44, Location: 948 N 1300 W, Grades: 7-12)
WESTSIDE CHRISTIAN SCHOOL Students: 17, Location: 2299 W 2000 N, Grades: KG-12)
Biggest public elementary/middle schools in St. George: CRIMSON VIEW SCHOOL Students: 1,405, Location: 2835 EAST 2000 SOUTH, Grades: KG-5)LITTLE VALLEY SCHOOL Students: 670, Location: 2330 E HORSEMAN PARK DR (3000, Grades: KG-5)SANDSTONE SCHOOL Students: 583, Location: 850 N 2450 E, Grades: KG-5)BLOOMINGTON SCHOOL Students: 572, Location: 425 MAN OF WAR RD, Grades: KG-5)BLOOMINGTON HILLS SCHOOL Students: 569, Location: 919 E BRIGHAM RD, Grades: KG-5)SUNSET SCHOOL Students: 532, Location: 495 N WESTRIDGE DR, Grades: KG-5)DIXIE SUN SCHOOL Students: 523, Location: 1795 W 1230 N, Grades: KG-5)EAST SCHOOL Students: 484, Location: 453 S 600 E, Grades: KG-5)PANORAMA SCHOOL Students: 464, Location: 301 N 2200 E, Grades: KG-5)DIAMOND VALLEY SCHOOL Students: 283, Location: 1411 W DIAMOND VALLEY DR, Grades: KG-5)Private elementary/middle schools in St. George: VALOR HALL Students: 135, Location: 631 S 1100 E, Grades: KG-8)
TRINITY LUTHERAN SCHOOL Students: 38, Location: 2260 RED CLIFFS DR, Grades: PK-8)
See full list of schools located in St. George Library in St. George: WASHINGTON COUNTY LIBRARY Operating income: $2,894,709; Location: 88 WEST 100 SOUTH; 211,446 books ; 21,369 audio materials ; 15,018 video materials ; 4 local licensed databases ; 39 state licensed databases ; 442 print serial subscriptions )
Notable locations in St. George: (A) , Red Hills Shopping Plaza (B) , East City Center (C) , Saint George RV Campground (D) , Toniquint (E) , Saint George Fire Department Station 4 (F) , Saint George Municipal Airport Lifeflight (G) , Dixie Ambulance Service (H) , Saint George Fire Department Station 1 (I) , Saint George Fire Department Station 2 (J) , Saint George Fire Department Station 5 (K) , Saint George Fire Department Station 3 (L) , Saint George Fire Department Station 6 (M) , Saint George Fire Department Station 7 (N) . Display/hide their locations on the map
Shopping Centers: (1) , Kemp Korner Shopping Center (2) . Display/hide their locations on the map
Churches in St. George include: (A) , First Southern Baptist Church (B) , Saint George Catholic Church (C) , Trinity Lutheran Church of Southern Utah (D) , The Church of Jesus Christ of Latter Day Saints (E) . Display/hide their locations on the map
Cemetery: (1) . Display/hide its location on the map
Reservoir: (A) . Display/hide its location on the map
Rivers and creeks: (A) , City Creek (B) . Display/hide their locations on the map
Parks in St. George include: (1) , Temple View RV Resort (2) , Hillside Palms RV Park (3) , Brigham Young Winter Home (4) , Twin Lakes RV Park (5) . Display/hide their locations on the map
Birthplace of: Bruce Hurst - Baseball player, Amanda Righetti - Film actor, Andy Stokes - 2005 NFL player (Arizona Cardinals, born : Jun 2, 1981), Bruce C. Hafen - Mormon missionary, Lorna Kesterson - Mayor, Steven E. Snow - Mormon missionary, Bert H. Miller - Politician, Donald L. Staheli - Chief executive, Jay Don Blake - PGA Tour Golf player (born : 10/28/58), Lowell M. Snow - Mormon missionary.
Washington County has a predicted average indoor radon screening level between 2 and 4 pCi/L (pico curies per liter) - Moderate Potential Drinking water stations with addresses in St. George and their reported violations in the past:
OK MOBILE HOME PARK (Address: re: OK MOBILE HOME PARK Serves NV, Population served: 90, Groundwater):
Past monitoring violations:
Follow-up Or Routine LCR Tap M/R - In OCT-01-2000, Contaminant: Lead and Copper Rule. Follow-up actions: St Compliance achieved (JUN-06-2005)
One regular monitoring violation
Average household size: This city:
2.8 peopleUtah:
3.1 people
Percentage of family households: This city:
73.2%Whole state:
75.2%
Percentage of households with unmarried partners: This city:
4.0%Whole state:
4.6%
Likely homosexual households (counted as self-reported same-sex unmarried-partner households)
Lesbian couples: 0.3% of all households Gay men: 0.2% of all households
People in group quarters in St. George in 2010:
312 people in residential treatment centers for juveniles (non-correctional)
303 people in nursing facilities/skilled-nursing facilities
294 people in college/university student housing
56 people in emergency and transitional shelters (with sleeping facilities) for people experiencing homelessness
24 people in correctional residential facilities
20 people in other noninstitutional facilities
18 people in residential treatment centers for adults
11 people in group homes intended for adults
9 people in group homes for juveniles (non-correctional)
6 people in workers' group living quarters and job corps centers
People in group quarters in St. George in 2000:
372 people in nursing homes
297 people in other noninstitutional group quarters
136 people in college dormitories (includes college quarters off campus)
19 people in homes for the mentally retarded
18 people in short-term care, detention or diagnostic centers for delinquent children
9 people in mental (psychiatric) hospitals or wards
8 people in other group homes
Arena or stadium:
Burns Arena. Dixie State College of Utah.
Banks with branches in St. George (2011 data):
Wells Fargo Bank, National Association: Phoenix Plaza Branch at 929 West Sunset Boulevard, branch established on 1989/03/16; Dixie Branch at One South Main Street, branch established on 1970/06/15. Info updated 2011/04/05: Bank assets: $1,161,490.0 mil, Deposits: $905,653.0 mil, headquarters in Sioux Falls, SD, positive income , 6395 total offices , Holding Company: Wells Fargo & Company
Zions First National Bank: St. George Branch at 40 East Saint George Boulevard, branch established on 1906/04/06; Dixie Seasonal Branch at 225 South 700 East, branch established on 1994/09/15. Info updated 2006/11/03: Bank assets: $17,531.3 mil, Deposits: $14,905.3 mil, headquarters in Salt Lake City, UT, positive income , Commercial Lending Specialization, 151 total offices , Holding Company: Zions Bancorporation
State Bank of Southern Utah: St. George Branch at 395 East St. George Boulevard, branch established on 1993/07/19. Info updated 2006/11/03: Bank assets: $674.3 mil, Deposits: $573.2 mil, headquarters in Cedar City, UT, positive income , Commercial Lending Specialization, 13 total offices , Holding Company: Southern Utah Bancorporation
AmericanWest Bank: St. George Branch at 308 West Tabernacle, branch established on 1995/06/06. Info updated 2011/12/12: Bank assets: $2,274.6 mil, Deposits: $1,889.1 mil, headquarters in Spokane, WA, positive income , Commercial Lending Specialization, 76 total offices , Holding Company: Skbhc Holdings Llc
For population 15 years and over in St. George:
Never married: 25.7%Now married: 58.7%Separated: 1.0%Widowed: 5.6%Divorced: 9.0% For population 25 years and over in St. George:
High school or higher: 93.7%Bachelor's degree or higher: 38.9%Graduate or professional degree: 14.1%Unemployed: 6.1%Mean travel time to work (commute): 13.9 minutes
Education Gini index (Inequality in education) Here:
11.1Utah average:
10.9
Religion statistics for St. George, UT (based on Washington County data)
Religion Adherents Congregations Other 94,366 243 Catholic 5,845 1 Evangelical Protestant 2,345 25 Mainline Protestant 1,291 5 Black Protestant 658 2 None 33,610 -
Source: Clifford Grammich, Kirk Hadaway, Richard Houseal, Dale E.Jones, Alexei Krindatch, Richie Stanley and Richard H.Taylor. 2012. 2010 U.S.Religion Census: Religious Congregations & Membership Study. Association of Statisticians of American Religious Bodies. Jones, Dale E., et al. 2002. Congregations and Membership in the United States 2000. Nashville, TN: Glenmary Research Center. Graphs represent county-level data
Food Environment Statistics: Number of grocery stores : 14Washington County :
1.05 / 10,000 pop.Utah :
1.37 / 10,000 pop.
Number of supercenters and club stores : 3Washington County :
0.22 / 10,000 pop.Utah :
0.18 / 10,000 pop.
Number of convenience stores (no gas) : 4Here :
0.30 / 10,000 pop.Utah :
0.41 / 10,000 pop.
Number of convenience stores (with gas) : 40This county :
3.00 / 10,000 pop.State :
2.82 / 10,000 pop.
Number of full-service restaurants : 73This county :
5.47 / 10,000 pop.Utah :
5.09 / 10,000 pop.
Adult diabetes rate : Washington County :
7.4%Utah :
6.3%
Adult obesity rate : Washington County :
22.6%State :
23.6%
Health and Nutrition: Healthy diet rate : This city:
50.2%Utah:
48.9%
Average overall health of teeth and gums : St. George:
47.0%Utah:
47.0%
People feeling badly about themselves : This city:
20.1%Utah:
21.0%
People not drinking alcohol at all : This city:
11.6%State:
10.3%
Average hours sleeping at night : Overweight people : St. George:
33.5%Utah:
31.9%
General health condition : St. George:
56.0%Utah:
57.4%
Average condition of hearing : More about Health and Nutrition of St. George, UT Residents
St. George government finances - Expenditure in 2021 (per resident):
Construction - General - Other: $15,531,000 ($151.49)
Parks and Recreation: $4,462,000 ($43.52)Air Transportation: $1,653,000 ($16.12)Central Staff Services: $574,000 ($5.60)General Public Buildings: $33,000 ($0.32)Police Protection: $18,000 ($0.18)Local Fire Protection: $14,000 ($0.14)Sewerage: $10,000 ($0.10)Water Utilities: $6,000 ($0.06)Miscellaneous Commercial Activities - Other: $4,000 ($0.04)Current Operations - Electric Utilities: $57,541,000 ($561.27)
Parks and Recreation: $17,365,000 ($169.38)Water Utilities: $17,193,000 ($167.71)General - Other: $15,673,000 ($152.88)Police Protection: $15,134,000 ($147.62)Solid Waste Management: $5,951,000 ($58.05)Local Fire Protection: $5,332,000 ($52.01)Sewerage: $5,139,000 ($50.13)Housing and Community Development: $3,721,000 ($36.30)Regular Highways: $3,511,000 ($34.25)Central Staff Services: $2,381,000 ($23.22)Transit Utilities: $2,315,000 ($22.58)Financial Administration: $2,127,000 ($20.75)Judicial and Legal Services: $1,578,000 ($15.39)General Public Buildings: $1,198,000 ($11.69)Air Transportation: $1,128,000 ($11.00)Health - Other: $944,000 ($9.21)Miscellaneous Commercial Activities - Other: $437,000 ($4.26)Natural Resources - Other: $94,000 ($0.92)Correctional Institutions: $33,000 ($0.32)Electric Utilities - Interest on Debt: $1,736,000 ($16.93)
General - Interest on Debt: $2,216,000 ($21.62)
Other Capital Outlay - Housing and Community Development: $2,701,000 ($26.35)
Central Staff Services: $1,356,000 ($13.23)General - Other: $1,070,000 ($10.44)Local Fire Protection: $698,000 ($6.81)Regular Highways: $443,000 ($4.32)Police Protection: $264,000 ($2.58)Parks and Recreation: $162,000 ($1.58)Transit Utilities: $159,000 ($1.55)Water Utilities: $80,000 ($0.78)Air Transportation: $57,000 ($0.56)Electric Utilities: $37,000 ($0.36)Sewerage: $15,000 ($0.15)Miscellaneous Commercial Activities - Other: $5,000 ($0.05)Total Salaries and Wages: $47,385,000 ($462.21)
Water Utilities - Interest on Debt: $50,000 ($0.49)
St. George government finances - Revenue in 2021 (per resident):
Charges - Sewerage: $18,587,000 ($181.30)
Other: $13,801,000 ($134.62)Parks and Recreation: $12,566,000 ($122.57)Solid Waste Management: $5,997,000 ($58.50)Air Transportation: $2,323,000 ($22.66)Miscellaneous Commercial Activities: $670,000 ($6.54)Regular Highways: $111,000 ($1.08)Federal Intergovernmental - General Local Government Support: $3,340,000 ($32.58)
Transit Utilities: $2,080,000 ($20.29)Other: $1,235,000 ($12.05)Miscellaneous - Sale of Property: $8,604,000 ($83.93)
General Revenue - Other: $7,448,000 ($72.65)Interest Earnings: $1,104,000 ($10.77)Fines and Forfeits: $981,000 ($9.57)Donations From Private Sources: $824,000 ($8.04)Rents: $590,000 ($5.76)Revenue - Electric Utilities: $70,550,000 ($688.17)
Water Utilities: $32,694,000 ($318.91)Transit Utilities: $471,000 ($4.59)State Intergovernmental - Other: $5,254,000 ($51.25)
Highways: $4,124,000 ($40.23)General Local Government Support: $1,220,000 ($11.90)Tax - General Sales and Gross Receipts: $35,553,000 ($346.79)
Property: $14,250,000 ($139.00)Other Selective Sales: $13,670,000 ($133.34)Public Utilities Sales: $7,705,000 ($75.16)Other License: $3,055,000 ($29.80)Occupation and Business License - Other: $863,000 ($8.42)
St. George government finances - Debt in 2021 (per resident):
Long Term Debt - Beginning Outstanding - Unspecified Public Purpose: $109,308,000 ($1066.22)
Outstanding Unspecified Public Purpose: $98,641,000 ($962.17)Retired Unspecified Public Purpose: $10,675,000 ($104.13)Beginning Outstanding - Public Debt for Private Purpose: $10,210,000 ($99.59)Outstanding Nonguaranteed - Industrial Revenue: $8,065,000 ($78.67)Retired Nonguaranteed - Public Debt for Private Purpose: $2,145,000 ($20.92)Issue, Unspecified Public Purpose: $8,000 ($0.08)
St. George government finances - Cash and Securities in 2021 (per resident):
Bond Funds - Cash and Securities: $67,165,000 ($655.15)
Other Funds - Cash and Securities: $101,694,000 ($991.95)
Sinking Funds - Cash and Securities: $8,351,000 ($81.46)
Businesses in St. George, UT
Name Count Name Count
AT&T 1 Knights Inn 1 Aeropostale 1 Lane Bryant 1 American Eagle Outfitters 1 Little Caesars Pizza 1 Arby's 2 Marriott 3 Barnes & Noble 1 Maurices 1 Bath & Body Works 1 Mazda 1 Big O Tires 2 Motherhood Maternity 1 Cold Stone Creamery 1 Nike 4 Coldwater Creek 1 Outback 1 Costco 1 Outback Steakhouse 1 Cracker Barrel 1 Pac Sun 1 Deb 1 Papa John's Pizza 1 DressBarn 1 Rue21 1 Dressbarn 1 Skechers USA 1 Foot Locker 1 Starbucks 3 GNC 2 Subway 2 Gymboree 1 Super 8 1 Holiday Inn 1 T.J.Maxx 1 Howard Johnson 1 Toyota 1 IZOD 1 Village Inn 1 Justice 1
Strongest AM radio stations in St. George:
KDXU (890 AM; 10 kW; ST. GEORGE, UT; Owner: WESTERN BROADCASTING, LS, LLC)
KUNF (1210 AM; 10 kW; WASHINGTON, UT; Owner: MARATHON MEDIA GROUP, L.L.C.)
KZNU (1450 AM; 10 kW; ST. GEORGE, UT; Owner: AM RADIO 1450, INC.)
KXNT (840 AM; 50 kW; NORTH LAS VEGAS, NV; Owner: INFINITY RADIO OPERATIONS INC.)
KDWN (720 AM; 50 kW; LAS VEGAS, NV; Owner: RADIO NEVADA CORP.)
KNNZ (940 AM; 10 kW; CEDAR CITY, UT; Owner: MB MEDIA GROUP, INC.)
KSUB (590 AM; 5 kW; CEDAR CITY, UT; Owner: MB MEDIA GROUP, INC.)
KMIA (710 AM; 50 kW; BLACK CANYON CITY, AZ; Owner: ENTRAVISION HOLDINGS, LLC)
KTNN (660 AM; 50 kW; WINDOW ROCK, AZ; Owner: THE NAVAJO NATION)
KLSQ (870 AM; 10 kW; WHITNEY, NV; Owner: KLSQ-AM LICENSE CORPORATION)
KALL (700 AM; 50 kW; NORTH SALT LAKE CITY, UT; Owner: CITICASTERS LICENSES, L.P.)
KSFN (1140 AM; 10 kW; NORTH LAS VEGAS, NV; Owner: INFINITY RADIO OPERATIONS INC.)
KLAC (570 AM; 50 kW; LOS ANGELES, CA; Owner: AMFM RADIO LICENSES, L.L.C.)
Strongest FM radio stations in St. George:
K300AC (107.9 FM; WASHINGTON, ETC., UT; Owner: UNIVERSITY OF UTAH)
K232CY (94.3 FM; ST. GEORGE, UT; Owner: CARL L. RIECK)
KZHK (95.9 FM; ST. GEORGE, UT; Owner: MARVIN KENT FRANDSEN)
K244DU (96.7 FM; ST. GEORGE, UT; Owner: MONTY C. STRATTON)
KONY (99.9 FM; ST. GEORGE, UT; Owner: FM RADIO 99.9, INC.)
KSNN (93.5 FM; ST. GEORGE, UT; Owner: WESTERN BROADCASTING, LS, LLC)
K204BY (88.7 FM; ST. GEORGE, UT; Owner: AMERICAN FAMILY ASSOCIATION)
K252DK (98.3 FM; ST. GEORGE, UT; Owner: MARATHON MEDIA GROUP, L.L.C.)
KMXM (107.1 FM; COLORADO CITY, AZ; Owner: MB MEDIA GROUP, INC.)
KREC (98.1 FM; BRIAN HEAD, UT; Owner: MARATHON MEDIA GROUP, L.L.C.)
K211BJ (90.1 FM; TOQUERVILLE, UT; Owner: UNIVERSITY OF UTAH)
KXFF (92.5 FM; CEDAR CITY, UT; Owner: MB MEDIA GROUP, INC.)
K209AO (89.7 FM; ST. GEORGE, ETC., UT; Owner: FAITH COMMUNICATIONS CORPORATION)
K213AM (90.5 FM; ST. GEORGE, UT; Owner: UNIVERSITY OF UTAH)
K215CF (90.9 FM; ST. GEORGE, UT; Owner: UTAH STATE UNIV., AGRI & APP SCIENCE)
K272AQ (102.3 FM; ST. GEORGE, UT; Owner: B. RAY CARPENTER)
K276DJ (103.1 FM; ST. GEORGE, UT; Owner: JEFFERY M. JENNINGS)
KOEZ-LP (105.1 FM; ST. GEORGE, UT; Owner: LATINOS UNIDOS BROADCASTING)
KWBR-LP (105.7 FM; ST. GEORGE, UT; Owner: ASSOCIATION OF COMMUNITY RESOURCES AND NEWS (A.C.O.R.N.))
KLNR (91.7 FM; PANACA, NV; Owner: NEVADA PUBLIC RADIO CORPORATION)
TV broadcast stations around St. George:
K11JE (Channel 11; ST. GEORGE, UT; Owner: WASHINGTON COUNTY TELEVISION DEPARTMENT)
K32FQ (Channel 32; ST. GEORGE, ETC., UT; Owner: UNIVERSITY OF UTAH)
K34FS (Channel 34; ST. GEORGE, ETC., UT; Owner: UNIVERSITY OF UTAH)
K59AG (Channel 59; BLOOMINGTON, UT; Owner: BRIGHAM YOUNG UNIVERSITY)
K46GE (Channel 46; ST. GEORGE, UT; Owner: WASHINGTON COUNTY TELEVISION DEPARTMENT)
K20GJ (Channel 20; BLOOMINGTON, UT; Owner: BONNEVILLE HOLDING COMPANY)
K63AD (Channel 63; BLOOMINGTON, UT; Owner: WASHINGTON COUNTY TELEVISION DEPT.)
K69CT (Channel 69; ST. GEORGE, UT; Owner: CLEAR CHANNEL BROADCASTING LICENSES, INC.)
KUWB-LP (Channel 65; BLOOMINGTON, UT; Owner: ACME TELEVISION LICENSES OF UTAH, LLC)
KDLQ-LP (Channel 55; ST. GEORGE, ETC., UT; Owner: MB MEDIA GROUP, INC.)
KCSG1 (Channel 4; ST. GEORGE, UT; Owner: DANIEL MATHESON & STEPHEN WADE d/b as BROADCAST WEST)
K16DS (Channel 16; ST. GEORGE, UT; Owner: DANIEL MATHESON AND STEPHEN WADE d/b as BROADCAST WEST)
KDLU-LP (Channel 26; ST. GEORGE, UT; Owner: MB MEDIA GROUP, INC.)
K02AV (Channel 2; ST. GEORGE, UT; Owner: WASHINGTON COUNTY TELEVISION DEPARTMENT)
K24CY (Channel 24; ST. GEORGE, UT; Owner: LARRY H. MILLER COMMUNICATIONS CORP.)
K08BN (Channel 8; ST. GEORGE, UT; Owner: WASHINGTON COUNTY TELEVISION DEPARTMENT)
KUSG (Channel 12; ST. GEORGE, UT; Owner: KUTV HOLDINGS, INC.)
National Bridge Inventory (NBI) Statistics 78 Number of bridges833ft / 254m Total length1,256,356 Total average daily traffic244,619 Total average daily truck traffic
New bridges - historical statistics
1 1950-1959 2 1960-1969 17 1970-1979 4 1980-1989 10 1990-1999 11 2000-2009 33 2010-2019
See full National Bridge Inventory statistics for St. George, UT
FCC Registered Cell Phone Towers: 2 (
See the full list of FCC Registered Cell Phone Towers in St. George )
FCC Registered Antenna Towers: 123 (
See the full list of FCC Registered Antenna Towers )
FCC Registered Broadcast Land Mobile Towers: 37 (
See the full list of FCC Registered Broadcast Land Mobile Towers in St. George, UT )
FCC Registered Microwave Towers: 77 (
See the full list of FCC Registered Microwave Towers in this town )
FCC Registered Paging Towers: 5 (
See the full list of FCC Registered Paging Towers )
FCC Registered Maritime Coast & Aviation Ground Towers: 5 (
See the full list of FCC Registered Maritime Coast & Aviation Ground Towers )
FCC Registered Amateur Radio Licenses: 97 (
See the full list of FCC Registered Amateur Radio Licenses in St. George )
FAA Registered Aircraft: 1
Aircraft: BOMBARDIER INC CL-600-2B19 (Category: Land, Engines: 2, Seats: 55, Weight: 20,000+ Pounds), Engine: GE CF34 SERIES (9140 Pounds of Thrust) (Turbo-fan)N-Number: 854AS, N854AS, N-854AS, Serial Number: 7382, Year manufactured: 2000, Airworthiness Date: 06/20/2000, Certificate Issue Date: 12/12/2017Registrant (Corporation): Skywest Airlines Inc, 444 S River Rd, St. George, UT 84790
Home Mortgage Disclosure Act Aggregated Statistics For Year 2009(Based on 4 full and 6 partial tracts) A) FHA, FSA/RHS & VA B) Conventional C) Refinancings D) Home Improvement Loans E) Loans on Dwellings For 5+ Families F) Non-occupant Loans on G) Loans On Manufactured Number Average Value Number Average Value Number Average Value Number Average Value Number Average Value Number Average Value Number Average Value
LOANS ORIGINATED 312 $170,243 439 $193,868 1,437 $194,769 34 $140,309 1 $382,530 381 $177,920 13 $88,501 APPLICATIONS APPROVED, NOT ACCEPTED 31 $175,454 41 $227,138 196 $207,019 8 $75,119 1 $220,000 43 $222,148 4 $83,922 APPLICATIONS DENIED 69 $172,491 79 $233,829 553 $236,474 17 $97,363 1 $370,000 122 $200,185 12 $70,580 APPLICATIONS WITHDRAWN 56 $161,369 62 $204,573 307 $223,057 13 $103,511 0 $0 46 $213,836 3 $87,487 FILES CLOSED FOR INCOMPLETENESS 2 $95,000 7 $228,217 54 $208,403 3 $58,013 0 $0 8 $155,021 0 $0
Aggregated Statistics For Year 2008(Based on 4 full and 6 partial tracts) A) FHA, FSA/RHS & VA B) Conventional C) Refinancings D) Home Improvement Loans E) Loans on Dwellings For 5+ Families F) Non-occupant Loans on G) Loans On Manufactured Number Average Value Number Average Value Number Average Value Number Average Value Number Average Value Number Average Value Number Average Value
LOANS ORIGINATED 205 $195,338 538 $219,521 860 $213,656 43 $126,028 1 $600,000 313 $205,134 12 $91,567 APPLICATIONS APPROVED, NOT ACCEPTED 19 $227,871 84 $286,362 262 $239,155 8 $121,960 0 $0 58 $252,836 3 $56,663 APPLICATIONS DENIED 43 $169,729 135 $393,272 618 $291,236 54 $156,526 2 $170,355 135 $341,137 13 $79,698 APPLICATIONS WITHDRAWN 45 $200,034 64 $363,845 235 $265,257 17 $233,509 0 $0 50 $316,879 5 $65,392 FILES CLOSED FOR INCOMPLETENESS 1 $249,970 15 $411,304 41 $293,668 11 $168,190 0 $0 9 $355,307 1 $274,090
Aggregated Statistics For Year 2007(Based on 4 full and 6 partial tracts) A) FHA, FSA/RHS & VA B) Conventional C) Refinancings D) Home Improvement Loans E) Loans on Dwellings For 5+ Families F) Non-occupant Loans on G) Loans On Manufactured Number Average Value Number Average Value Number Average Value Number Average Value Number Average Value Number Average Value Number Average Value
LOANS ORIGINATED 61 $185,550 1,104 $231,501 1,229 $240,187 110 $115,982 5 $3,363,744 578 $247,338 22 $79,714 APPLICATIONS APPROVED, NOT ACCEPTED 2 $156,185 146 $290,145 310 $249,780 26 $88,868 0 $0 84 $274,418 6 $80,272 APPLICATIONS DENIED 14 $224,019 417 $384,183 741 $307,656 88 $109,228 0 $0 242 $360,714 25 $77,938 APPLICATIONS WITHDRAWN 7 $176,507 132 $311,417 270 $277,712 17 $108,719 0 $0 78 $327,752 6 $83,572 FILES CLOSED FOR INCOMPLETENESS 2 $146,570 48 $384,445 87 $274,988 4 $281,090 0 $0 23 $346,447 0 $0
Aggregated Statistics For Year 2006(Based on 4 full and 6 partial tracts) A) FHA, FSA/RHS & VA B) Conventional C) Refinancings D) Home Improvement Loans E) Loans on Dwellings For 5+ Families F) Non-occupant Loans on G) Loans On Manufactured Number Average Value Number Average Value Number Average Value Number Average Value Number Average Value Number Average Value Number Average Value
LOANS ORIGINATED 40 $171,709 2,032 $198,655 1,664 $217,939 155 $120,149 2 $859,570 863 $208,462 30 $97,869 APPLICATIONS APPROVED, NOT ACCEPTED 2 $103,845 287 $187,626 316 $220,589 21 $108,437 0 $0 106 $208,004 12 $82,108 APPLICATIONS DENIED 12 $137,480 692 $194,838 591 $222,476 76 $138,120 0 $0 220 $230,487 22 $85,246 APPLICATIONS WITHDRAWN 9 $182,212 296 $198,282 345 $219,815 18 $75,659 1 $86,000 96 $215,988 5 $98,164 FILES CLOSED FOR INCOMPLETENESS 0 $0 92 $167,234 103 $242,248 7 $108,117 0 $0 25 $178,306 0 $0
Aggregated Statistics For Year 2005(Based on 4 full and 6 partial tracts) A) FHA, FSA/RHS & VA B) Conventional C) Refinancings D) Home Improvement Loans E) Loans on Dwellings For 5+ Families F) Non-occupant Loans on G) Loans On Manufactured Number Average Value Number Average Value Number Average Value Number Average Value Number Average Value Number Average Value Number Average Value
LOANS ORIGINATED 75 $134,552 2,762 $163,909 1,840 $174,350 111 $127,866 6 $1,122,923 1,252 $153,663 41 $87,523 APPLICATIONS APPROVED, NOT ACCEPTED 2 $108,770 297 $154,923 272 $151,285 24 $136,742 0 $0 95 $159,532 4 $48,445 APPLICATIONS DENIED 19 $122,689 627 $153,640 578 $176,090 84 $72,628 0 $0 229 $154,758 24 $71,222 APPLICATIONS WITHDRAWN 13 $127,068 426 $166,372 402 $183,575 37 $132,217 0 $0 164 $157,787 10 $75,902 FILES CLOSED FOR INCOMPLETENESS 2 $108,605 73 $162,817 106 $153,135 11 $87,503 0 $0 26 $131,579 0 $0
Aggregated Statistics For Year 2004(Based on 4 full and 6 partial tracts) A) FHA, FSA/RHS & VA B) Conventional C) Refinancings D) Home Improvement Loans E) Loans on Dwellings For 5+ Families F) Non-occupant Loans on G) Loans On Manufactured Number Average Value Number Average Value Number Average Value Number Average Value Number Average Value Number Average Value Number Average Value
LOANS ORIGINATED 168 $121,965 2,131 $139,994 1,330 $151,905 62 $75,031 7 $1,723,309 802 $125,821 29 $68,024 APPLICATIONS APPROVED, NOT ACCEPTED 3 $114,220 240 $130,495 218 $150,741 9 $63,171 0 $0 72 $127,178 3 $52,163 APPLICATIONS DENIED 31 $117,136 373 $126,147 458 $150,326 75 $36,279 2 $265,000 118 $122,163 29 $66,410 APPLICATIONS WITHDRAWN 15 $115,411 233 $144,837 253 $155,895 15 $77,232 2 $544,030 88 $126,907 2 $84,950 FILES CLOSED FOR INCOMPLETENESS 3 $195,117 52 $125,062 94 $174,302 7 $37,794 0 $0 17 $136,168 1 $65,000
Detailed mortgage data for all 10 tracts in St. George, UT
Private Mortgage Insurance Companies Aggregated Statistics For Year 2009(Based on 4 full and 6 partial tracts) A) Conventional B) Refinancings C) Non-occupant Loans on D) Loans On Manufactured Number Average Value Number Average Value Number Average Value Number Average Value
LOANS ORIGINATED 34 $202,088 22 $250,859 10 $189,031 0 $0 APPLICATIONS APPROVED, NOT ACCEPTED 20 $211,887 21 $269,124 8 $244,160 0 $0 APPLICATIONS DENIED 12 $242,780 6 $209,355 5 $310,438 0 $0 APPLICATIONS WITHDRAWN 3 $246,577 7 $246,883 3 $249,863 1 $95,350 FILES CLOSED FOR INCOMPLETENESS 2 $292,035 0 $0 1 $188,410 0 $0
Aggregated Statistics For Year 2008(Based on 4 full and 6 partial tracts) A) Conventional B) Refinancings C) Non-occupant Loans on D) Loans On Manufactured Number Average Value Number Average Value Number Average Value Number Average Value
LOANS ORIGINATED 152 $233,933 75 $276,311 48 $243,402 1 $95,350 APPLICATIONS APPROVED, NOT ACCEPTED 50 $240,080 60 $288,939 17 $267,480 0 $0 APPLICATIONS DENIED 18 $180,236 7 $272,627 13 $208,774 0 $0 APPLICATIONS WITHDRAWN 2 $126,105 5 $234,788 2 $108,440 0 $0 FILES CLOSED FOR INCOMPLETENESS 4 $196,100 2 $267,895 3 $205,977 0 $0
Aggregated Statistics For Year 2007(Based on 4 full and 6 partial tracts) A) Conventional B) Refinancings C) Non-occupant Loans on Number Average Value Number Average Value Number Average Value
LOANS ORIGINATED 182 $241,814 98 $282,221 55 $271,336 APPLICATIONS APPROVED, NOT ACCEPTED 28 $248,658 22 $350,609 10 $236,425 APPLICATIONS DENIED 10 $498,997 3 $273,710 3 $299,827 APPLICATIONS WITHDRAWN 8 $236,756 8 $298,732 6 $268,688 FILES CLOSED FOR INCOMPLETENESS 0 $0 0 $0 0 $0
Aggregated Statistics For Year 2006(Based on 4 full and 6 partial tracts) A) Conventional B) Refinancings C) Non-occupant Loans on D) Loans On Manufactured Number Average Value Number Average Value Number Average Value Number Average Value
LOANS ORIGINATED 125 $230,138 47 $250,665 33 $239,066 1 $93,870 APPLICATIONS APPROVED, NOT ACCEPTED 43 $242,880 17 $273,781 9 $224,757 2 $86,890 APPLICATIONS DENIED 2 $419,580 1 $237,390 2 $336,180 0 $0 APPLICATIONS WITHDRAWN 8 $317,224 6 $210,875 1 $252,590 0 $0 FILES CLOSED FOR INCOMPLETENESS 1 $214,340 2 $239,535 0 $0 0 $0
Aggregated Statistics For Year 2005(Based on 4 full and 6 partial tracts) A) Conventional B) Refinancings C) Non-occupant Loans on D) Loans On Manufactured Number Average Value Number Average Value Number Average Value Number Average Value
LOANS ORIGINATED 288 $179,503 88 $184,864 119 $163,191 5 $88,068 APPLICATIONS APPROVED, NOT ACCEPTED 59 $177,232 45 $219,908 20 $150,354 0 $0 APPLICATIONS DENIED 5 $236,476 2 $316,715 4 $173,688 0 $0 APPLICATIONS WITHDRAWN 22 $195,892 12 $224,737 9 $167,316 0 $0 FILES CLOSED FOR INCOMPLETENESS 2 $114,455 1 $303,630 1 $149,000 0 $0
Aggregated Statistics For Year 2004(Based on 4 full and 6 partial tracts) A) Conventional B) Refinancings C) Non-occupant Loans on D) Loans On Manufactured Number Average Value Number Average Value Number Average Value Number Average Value
LOANS ORIGINATED 356 $147,272 160 $161,507 115 $139,284 7 $97,771 APPLICATIONS APPROVED, NOT ACCEPTED 80 $162,353 70 $159,964 30 $137,720 0 $0 APPLICATIONS DENIED 8 $127,885 2 $179,540 3 $83,263 0 $0 APPLICATIONS WITHDRAWN 33 $146,918 27 $165,947 12 $134,629 0 $0 FILES CLOSED FOR INCOMPLETENESS 3 $138,643 4 $137,572 2 $106,995 0 $0
St. George compared to Utah state average:
Unemployed percentage below state average. Black race population percentage below state average. Foreign-born population percentage above state average. House age below state average. Percentage of population with a bachelor's degree or higher above state average. St. George on our top lists :
#7 on the list of "Top 101 cities with the smallest percentage of high school students in private schools (3,000+ students)"
#8 on the list of "Top 101 cities with largest percentage of females in occupations: sales and related occupations (population 50,000+)"
#9 on the list of "Top 101 cities with the lowest maximum monthly morning or afternoon humidity (population 50,000+)"
#9 on the list of "Top 101 cities with the lowest average humidity (population 50,000+)"
#15 on the list of "Top 101 cities with largest percentage of females in industries: arts, entertainment, and recreation (population 50,000+)"
#19 on the list of "Top 101 cities with the largest city-data.com crime index decrease from 2002 to 2012 (population 50,000+)"
#20 on the list of "Top 101 cities with largest percentage of males in occupations: health diagnosing and treating practitioners and other technical occupations (population 50,000+)"
#22 on the list of "Top 101 cities with largest percentage of females in occupations: food preparation and serving related occupations (population 50,000+)"
#24 on the list of "Top 101 cities with the lowest number of robberies per 100,000 residents (population 50,000+)"
#25 on the list of "Top 101 cities with the lowest minimum monthly morning or afternoon humidity (population 50,000+)"
#25 on the list of "Top 101 cities with largest percentage of females in industries: accommodation and food services (population 50,000+)"
#26 on the list of "Top 101 cities with the lowest number of days clear of clouds (population 50,000+)"
#26 on the list of "Top 101 cities with the highest number of days clear of clouds (population 50,000+)"
#27 on the list of "Top 101 cities with most building permits per 10,000 residents (population 50,000+)"
#27 on the list of "Top 101 cities with the highest daily high temperatures (population 50,000+)"
#29 on the list of "Top 101 cities with the largest differences between daily high and daily low temperatures (population 50,000+)"
#31 on the list of "Top 101 cities with the highest average sunshine amount (population 50,000+)"
#32 on the list of "Top 101 cities with the lowest average yearly precipitation (population 50,000+)"
#32 on the list of "Top 101 cities with largest percentage of females in industries: retail trade (population 50,000+)"
#34 on the list of "Top 101 cities with largest percentage of females in industries: information (population 50,000+)"
#37 (84780) on the list of "Top 101 zip codes with the largest percentage of English first ancestries (pop 5,000+)"
#45 (84790) on the list of "Top 101 zip codes with the largest percentage of Danish first ancestries (pop 5,000+)"
#53 (84790) on the list of "Top 101 zip codes with the largest charity contributions deductions as a percentage of AGI in 2012 (pop 5,000+)"
#6 on the list of "Top 101 counties with highest percentage of residents voting for Romney (Republican) in the 2012 Presidential Election (pop. 50,000+)"
#17 on the list of "Top 101 counties with the most Other congregations"
#18 on the list of "Top 101 counties with the highest Ozone (1-hour) air pollution readings in 2012 (ppm)"
#19 on the list of "Top 101 counties with the most Other adherents"
#20 on the list of "Top 101 counties with the lowest percentage of residents relocating to foreign countries in 2011 (pop. 50,000+)"
Top Patent Applicants
Michael Brent Ford (18)
Christopher K. Ashworth (13)
Scott E. Bulloch (9)
Patrick L. Cook (9)
Blake Watts (5)
Richard W. Schanz (5)
Clint Gibson (5)
Michael D. Khoury (4)
Christopher Ken Ashworth (4)
Trevor Robert Milton (4)
Total of 211 patent applications in 2008-2024.
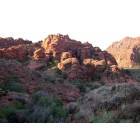
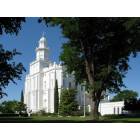
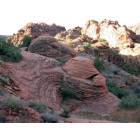
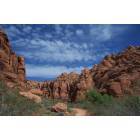
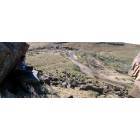
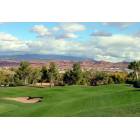
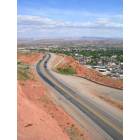
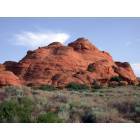
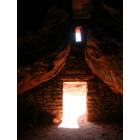
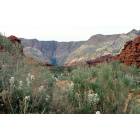
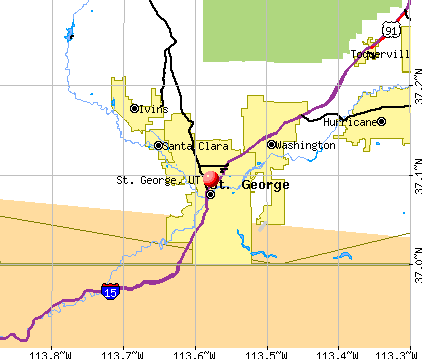


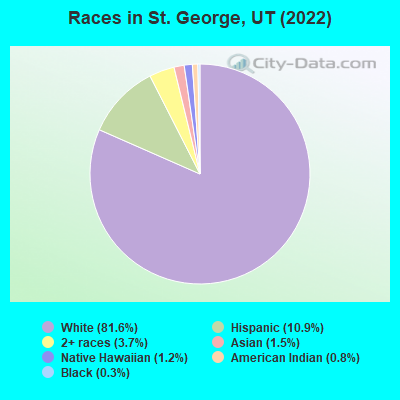
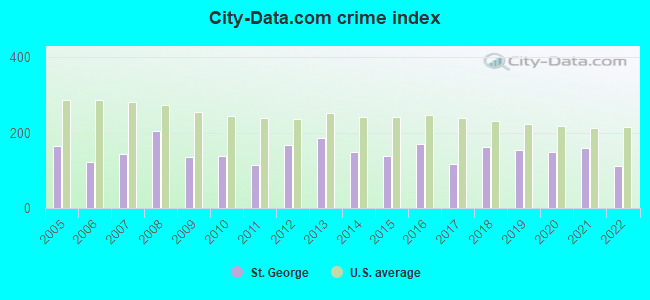
 Recent articles from our blog. Our writers, many of them Ph.D. graduates or candidates, create easy-to-read articles on a wide variety of topics.

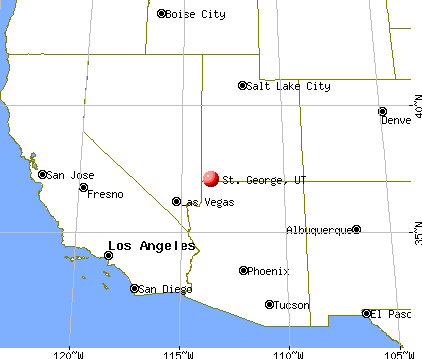
 (104.0 miles
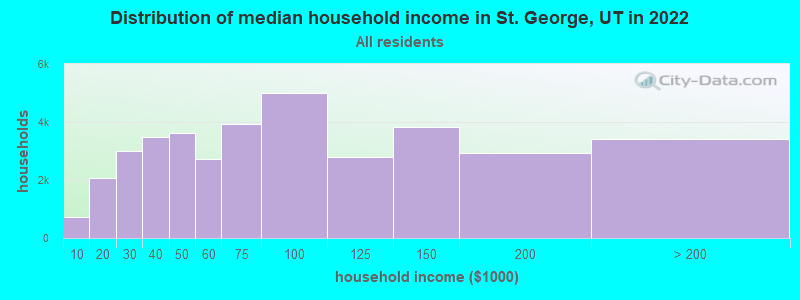
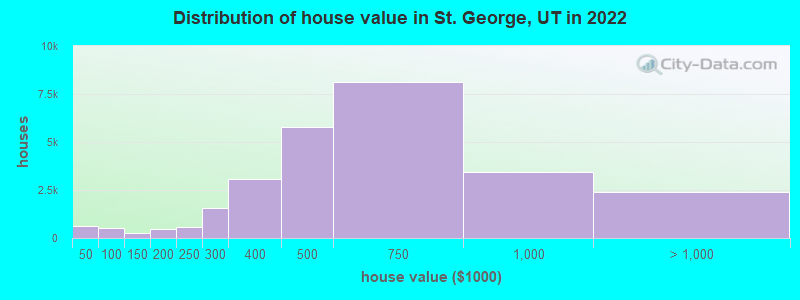
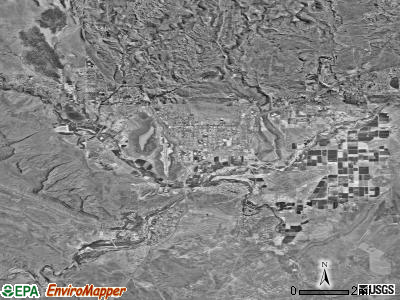
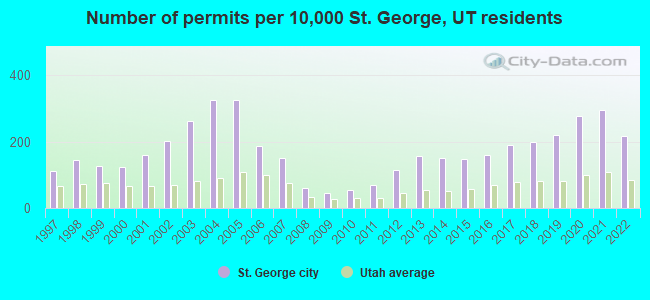
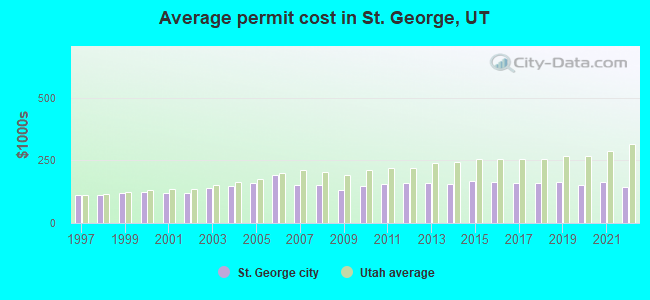
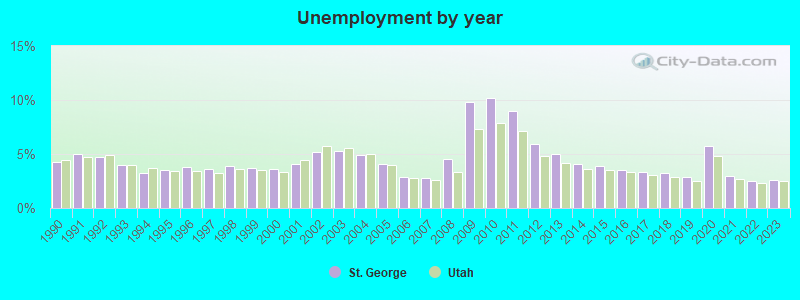
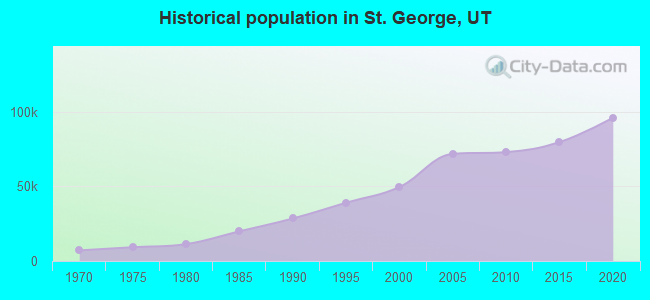
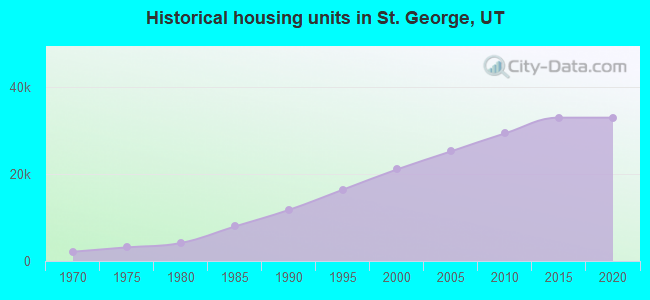
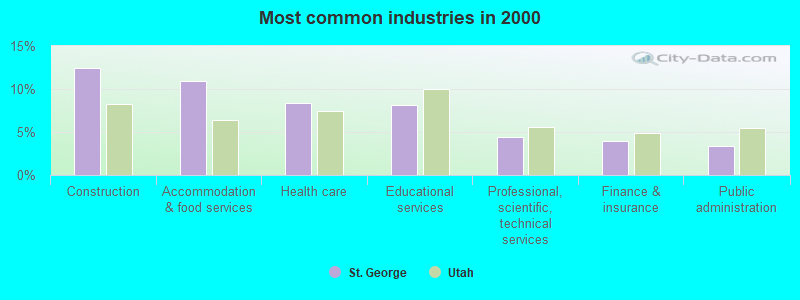
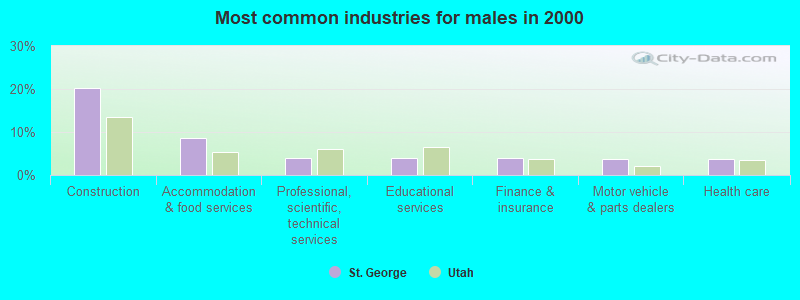
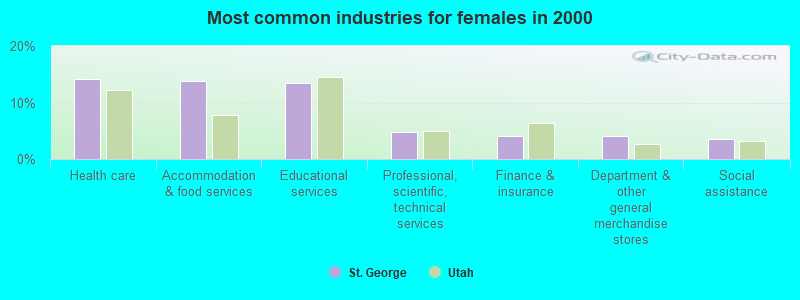
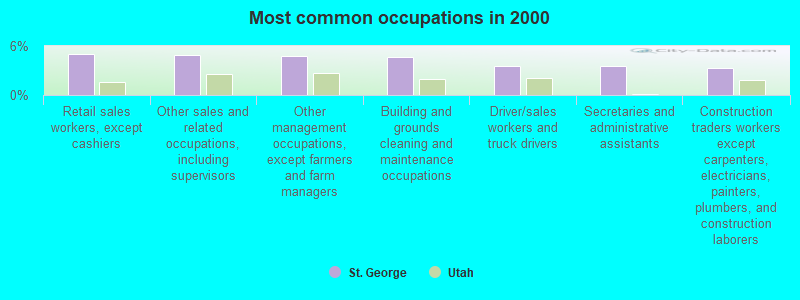
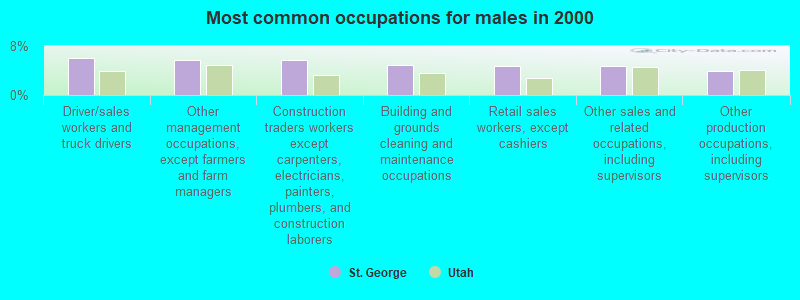
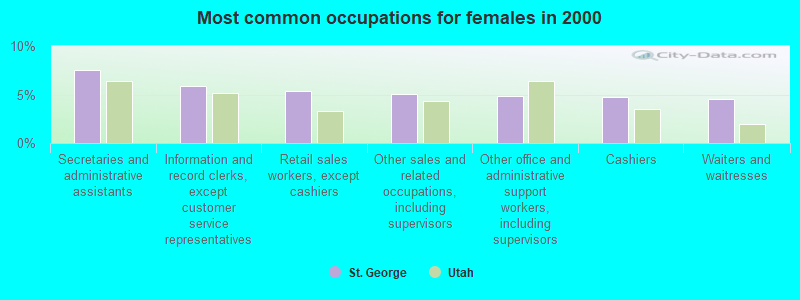
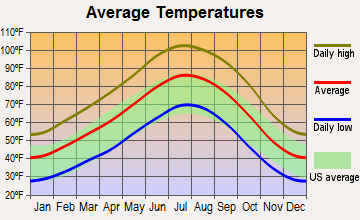


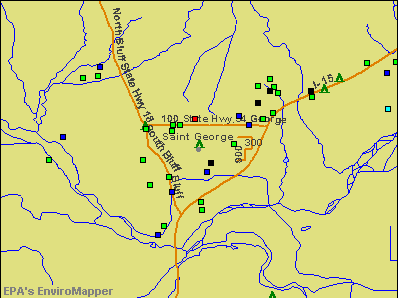

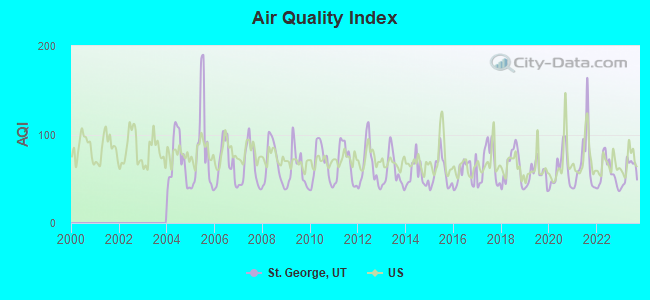
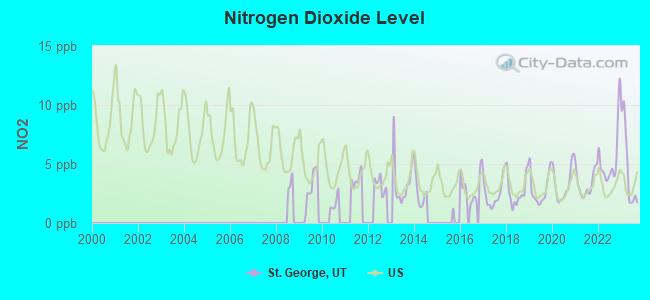
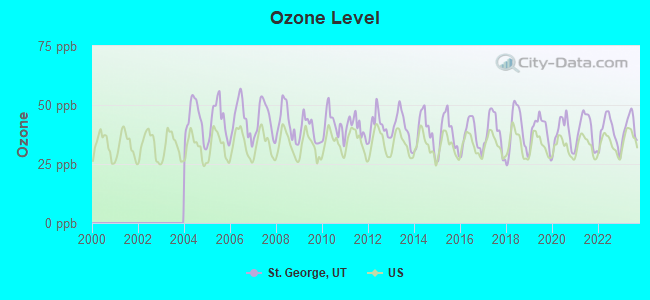
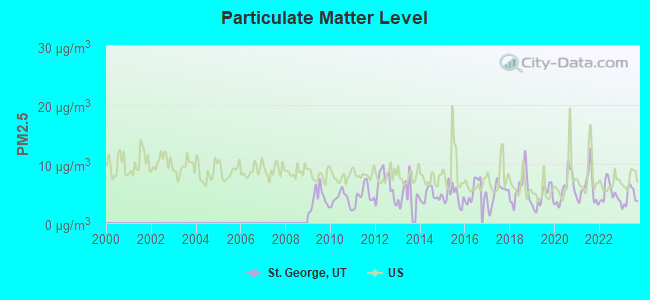
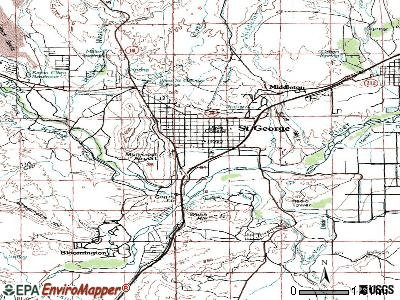
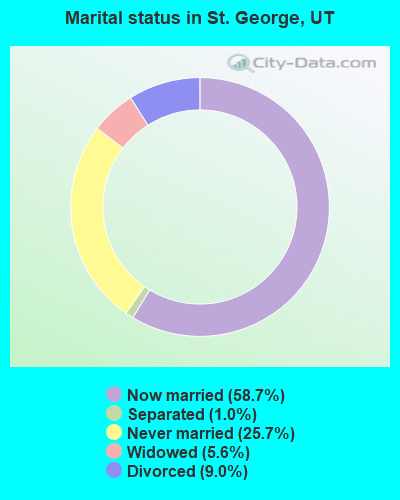
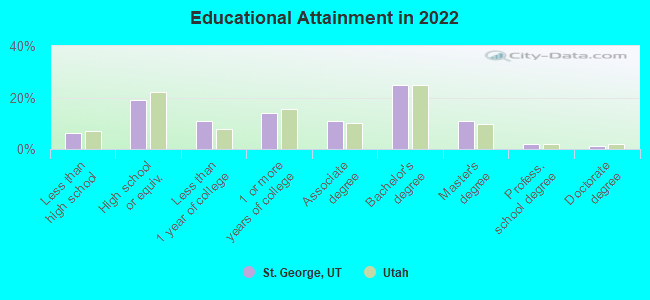
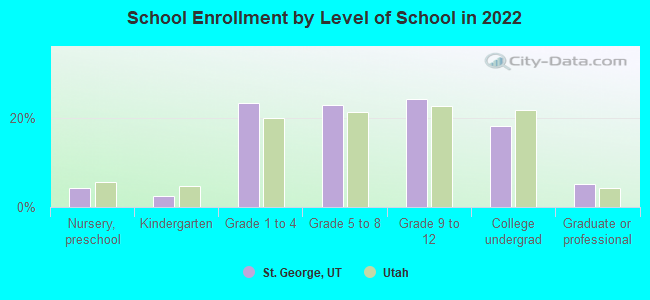
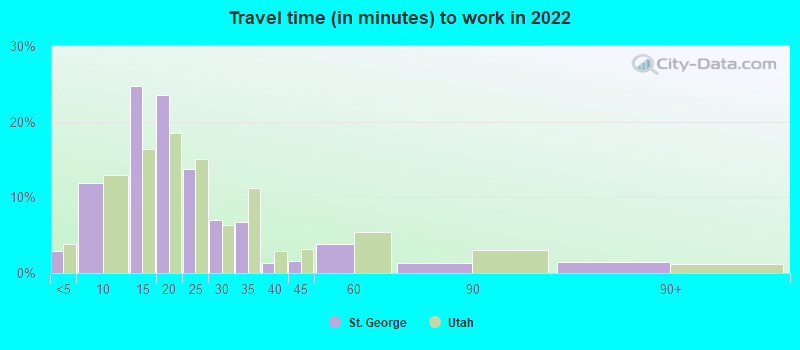
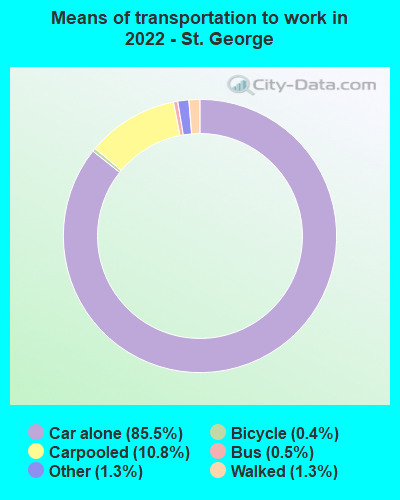
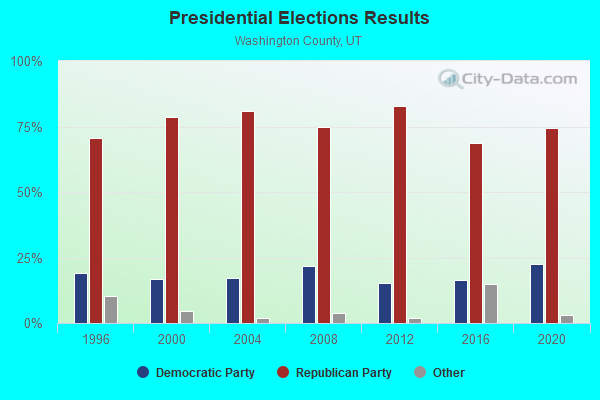
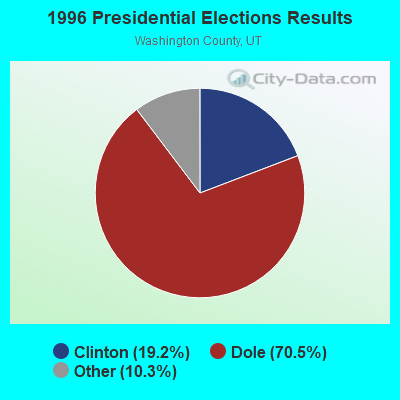
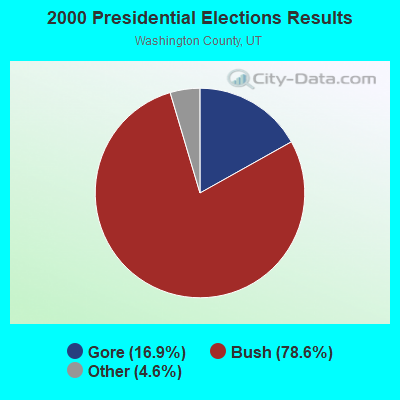
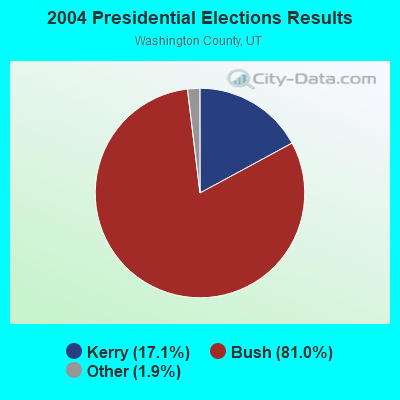

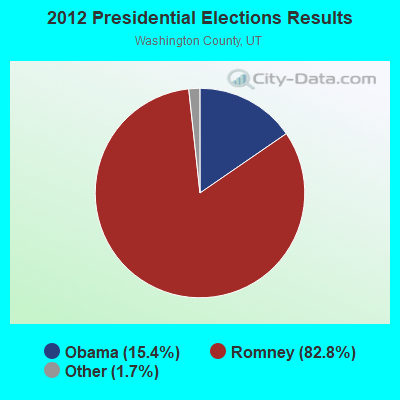
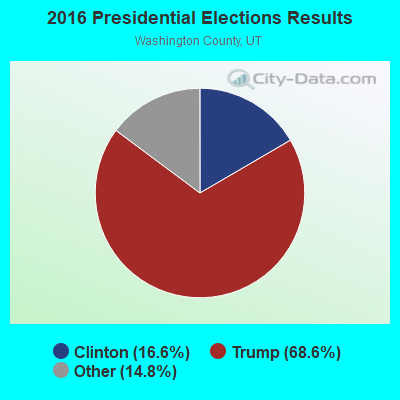
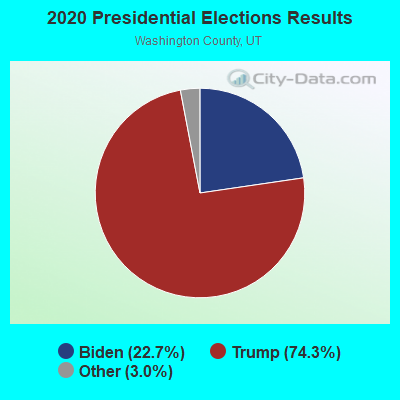
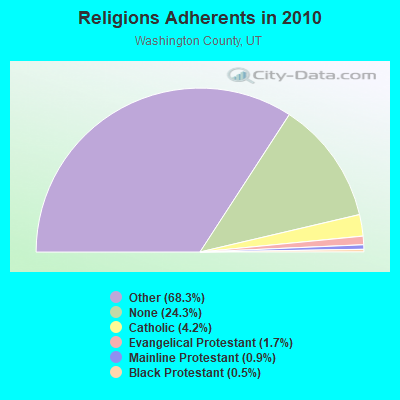
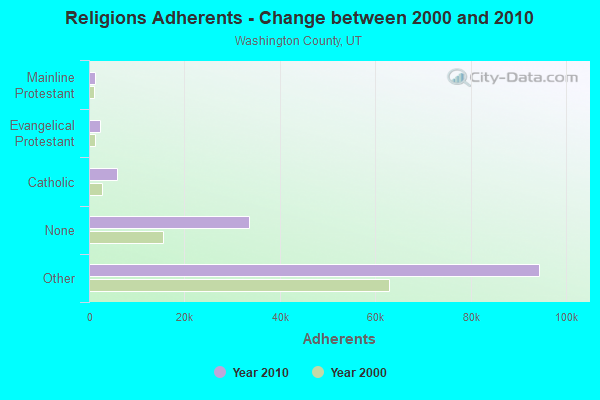
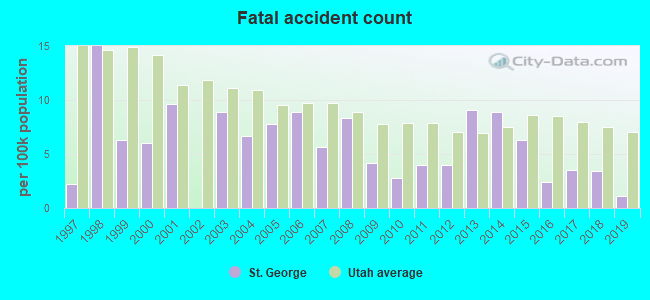
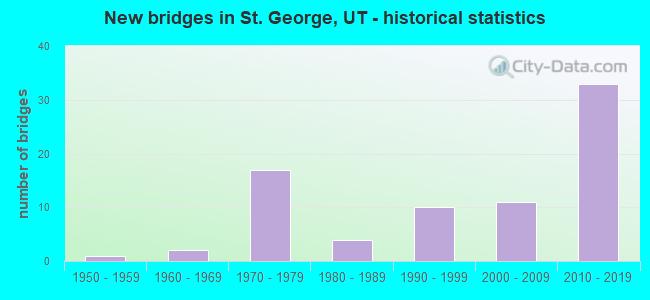
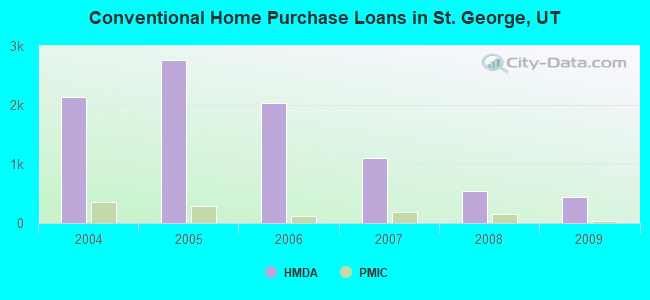
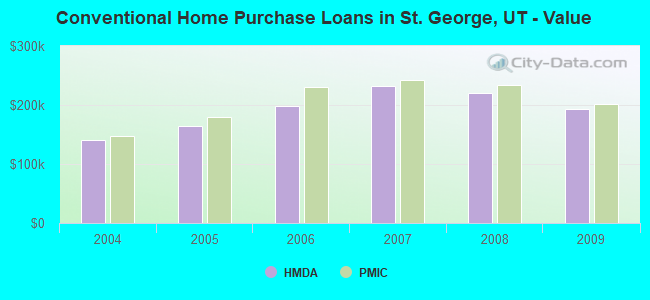
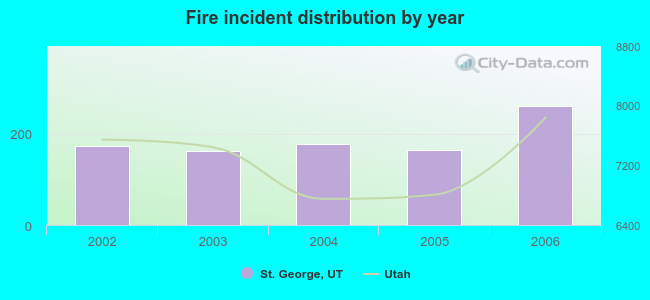 Based on the data from the years 2002 - 2006 the average number of fire incidents per year is 188. The highest number of reported fires - 262 took place in 2006, and the least - 162 in 2003. The data has a rising trend.
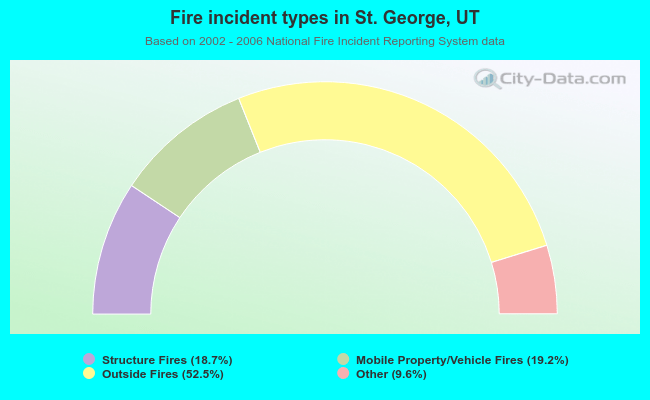 When looking into fire subcategories, the most reports belonged to: Outside Fires (52.5%), and Mobile Property/Vehicle Fires (19.2%).