Tuscumbia, Alabama Submit your own pictures of this city and show them to the world
OSM Map
General Map
Google Map
MSN Map
OSM Map
General Map
Google Map
MSN Map
OSM Map
General Map
Google Map
MSN Map
OSM Map
General Map
Google Map
MSN Map
Please wait while loading the map...
Population in 2022: 9,113 (98% urban, 2% rural). Population change since 2000: +16.0%Males: 4,202 Females: 4,911
March 2022 cost of living index in Tuscumbia: 81.3 (low, U.S. average is 100) Percentage of residents living in poverty in 2022: 19.5%for White Non-Hispanic residents , 47.1% for Black residents , 71.5% for Hispanic or Latino residents , 62.5% for American Indian residents , 100.0% for other race residents , 54.3% for two or more races residents )
Profiles of local businesses
Business Search - 14 Million verified businesses
Data:
Median household income ($)
Median household income (% change since 2000)
Household income diversity
Ratio of average income to average house value (%)
Ratio of average income to average rent
Median household income ($) - White
Median household income ($) - Black or African American
Median household income ($) - Asian
Median household income ($) - Hispanic or Latino
Median household income ($) - American Indian and Alaska Native
Median household income ($) - Multirace
Median household income ($) - Other Race
Median household income for houses/condos with a mortgage ($)
Median household income for apartments without a mortgage ($)
Races - White alone (%)
Races - White alone (% change since 2000)
Races - Black alone (%)
Races - Black alone (% change since 2000)
Races - American Indian alone (%)
Races - American Indian alone (% change since 2000)
Races - Asian alone (%)
Races - Asian alone (% change since 2000)
Races - Hispanic (%)
Races - Hispanic (% change since 2000)
Races - Native Hawaiian and Other Pacific Islander alone (%)
Races - Native Hawaiian and Other Pacific Islander alone (% change since 2000)
Races - Two or more races (%)
Races - Two or more races (% change since 2000)
Races - Other race alone (%)
Races - Other race alone (% change since 2000)
Racial diversity
Unemployment (%)
Unemployment (% change since 2000)
Unemployment (%) - White
Unemployment (%) - Black or African American
Unemployment (%) - Asian
Unemployment (%) - Hispanic or Latino
Unemployment (%) - American Indian and Alaska Native
Unemployment (%) - Multirace
Unemployment (%) - Other Race
Population density (people per square mile)
Population - Males (%)
Population - Females (%)
Population - Males (%) - White
Population - Males (%) - Black or African American
Population - Males (%) - Asian
Population - Males (%) - Hispanic or Latino
Population - Males (%) - American Indian and Alaska Native
Population - Males (%) - Multirace
Population - Males (%) - Other Race
Population - Females (%) - White
Population - Females (%) - Black or African American
Population - Females (%) - Asian
Population - Females (%) - Hispanic or Latino
Population - Females (%) - American Indian and Alaska Native
Population - Females (%) - Multirace
Population - Females (%) - Other Race
Coronavirus confirmed cases (Apr 27, 2024)
Deaths caused by coronavirus (Apr 27, 2024)
Coronavirus confirmed cases (per 100k population) (Apr 27, 2024)
Deaths caused by coronavirus (per 100k population) (Apr 27, 2024)
Daily increase in number of cases (Apr 27, 2024)
Weekly increase in number of cases (Apr 27, 2024)
Cases doubled (in days) (Apr 27, 2024)
Hospitalized patients (Apr 18, 2022)
Negative test results (Apr 18, 2022)
Total test results (Apr 18, 2022)
COVID Vaccine doses distributed (per 100k population) (Sep 19, 2023)
COVID Vaccine doses administered (per 100k population) (Sep 19, 2023)
COVID Vaccine doses distributed (Sep 19, 2023)
COVID Vaccine doses administered (Sep 19, 2023)
Likely homosexual households (%)
Likely homosexual households (% change since 2000)
Likely homosexual households - Lesbian couples (%)
Likely homosexual households - Lesbian couples (% change since 2000)
Likely homosexual households - Gay men (%)
Likely homosexual households - Gay men (% change since 2000)
Cost of living index
Median gross rent ($)
Median contract rent ($)
Median monthly housing costs ($)
Median house or condo value ($)
Median house or condo value ($ change since 2000)
Mean house or condo value by units in structure - 1, detached ($)
Mean house or condo value by units in structure - 1, attached ($)
Mean house or condo value by units in structure - 2 ($)
Mean house or condo value by units in structure by units in structure - 3 or 4 ($)
Mean house or condo value by units in structure - 5 or more ($)
Mean house or condo value by units in structure - Boat, RV, van, etc. ($)
Mean house or condo value by units in structure - Mobile home ($)
Median house or condo value ($) - White
Median house or condo value ($) - Black or African American
Median house or condo value ($) - Asian
Median house or condo value ($) - Hispanic or Latino
Median house or condo value ($) - American Indian and Alaska Native
Median house or condo value ($) - Multirace
Median house or condo value ($) - Other Race
Median resident age
Resident age diversity
Median resident age - Males
Median resident age - Females
Median resident age - White
Median resident age - Black or African American
Median resident age - Asian
Median resident age - Hispanic or Latino
Median resident age - American Indian and Alaska Native
Median resident age - Multirace
Median resident age - Other Race
Median resident age - Males - White
Median resident age - Males - Black or African American
Median resident age - Males - Asian
Median resident age - Males - Hispanic or Latino
Median resident age - Males - American Indian and Alaska Native
Median resident age - Males - Multirace
Median resident age - Males - Other Race
Median resident age - Females - White
Median resident age - Females - Black or African American
Median resident age - Females - Asian
Median resident age - Females - Hispanic or Latino
Median resident age - Females - American Indian and Alaska Native
Median resident age - Females - Multirace
Median resident age - Females - Other Race
Commute - mean travel time to work (minutes)
Travel time to work - Less than 5 minutes (%)
Travel time to work - Less than 5 minutes (% change since 2000)
Travel time to work - 5 to 9 minutes (%)
Travel time to work - 5 to 9 minutes (% change since 2000)
Travel time to work - 10 to 19 minutes (%)
Travel time to work - 10 to 19 minutes (% change since 2000)
Travel time to work - 20 to 29 minutes (%)
Travel time to work - 20 to 29 minutes (% change since 2000)
Travel time to work - 30 to 39 minutes (%)
Travel time to work - 30 to 39 minutes (% change since 2000)
Travel time to work - 40 to 59 minutes (%)
Travel time to work - 40 to 59 minutes (% change since 2000)
Travel time to work - 60 to 89 minutes (%)
Travel time to work - 60 to 89 minutes (% change since 2000)
Travel time to work - 90 or more minutes (%)
Travel time to work - 90 or more minutes (% change since 2000)
Marital status - Never married (%)
Marital status - Now married (%)
Marital status - Separated (%)
Marital status - Widowed (%)
Marital status - Divorced (%)
Median family income ($)
Median family income (% change since 2000)
Median non-family income ($)
Median non-family income (% change since 2000)
Median per capita income ($)
Median per capita income (% change since 2000)
Median family income ($) - White
Median family income ($) - Black or African American
Median family income ($) - Asian
Median family income ($) - Hispanic or Latino
Median family income ($) - American Indian and Alaska Native
Median family income ($) - Multirace
Median family income ($) - Other Race
Median year house/condo built
Median year apartment built
Year house built - Built 2005 or later (%)
Year house built - Built 2000 to 2004 (%)
Year house built - Built 1990 to 1999 (%)
Year house built - Built 1980 to 1989 (%)
Year house built - Built 1970 to 1979 (%)
Year house built - Built 1960 to 1969 (%)
Year house built - Built 1950 to 1959 (%)
Year house built - Built 1940 to 1949 (%)
Year house built - Built 1939 or earlier (%)
Average household size
Household density (households per square mile)
Average household size - White
Average household size - Black or African American
Average household size - Asian
Average household size - Hispanic or Latino
Average household size - American Indian and Alaska Native
Average household size - Multirace
Average household size - Other Race
Occupied housing units (%)
Vacant housing units (%)
Owner occupied housing units (%)
Renter occupied housing units (%)
Vacancy status - For rent (%)
Vacancy status - For sale only (%)
Vacancy status - Rented or sold, not occupied (%)
Vacancy status - For seasonal, recreational, or occasional use (%)
Vacancy status - For migrant workers (%)
Vacancy status - Other vacant (%)
Residents with income below the poverty level (%)
Residents with income below 50% of the poverty level (%)
Children below poverty level (%)
Poor families by family type - Married-couple family (%)
Poor families by family type - Male, no wife present (%)
Poor families by family type - Female, no husband present (%)
Poverty status for native-born residents (%)
Poverty status for foreign-born residents (%)
Poverty among high school graduates not in families (%)
Poverty among people who did not graduate high school not in families (%)
Residents with income below the poverty level (%) - White
Residents with income below the poverty level (%) - Black or African American
Residents with income below the poverty level (%) - Asian
Residents with income below the poverty level (%) - Hispanic or Latino
Residents with income below the poverty level (%) - American Indian and Alaska Native
Residents with income below the poverty level (%) - Multirace
Residents with income below the poverty level (%) - Other Race
Air pollution - Air Quality Index (AQI)
Air pollution - CO
Air pollution - NO2
Air pollution - SO2
Air pollution - Ozone
Air pollution - PM10
Air pollution - PM25
Air pollution - Pb
Crime - Murders per 100,000 population
Crime - Rapes per 100,000 population
Crime - Robberies per 100,000 population
Crime - Assaults per 100,000 population
Crime - Burglaries per 100,000 population
Crime - Thefts per 100,000 population
Crime - Auto thefts per 100,000 population
Crime - Arson per 100,000 population
Crime - City-data.com crime index
Crime - Violent crime index
Crime - Property crime index
Crime - Murders per 100,000 population (5 year average)
Crime - Rapes per 100,000 population (5 year average)
Crime - Robberies per 100,000 population (5 year average)
Crime - Assaults per 100,000 population (5 year average)
Crime - Burglaries per 100,000 population (5 year average)
Crime - Thefts per 100,000 population (5 year average)
Crime - Auto thefts per 100,000 population (5 year average)
Crime - Arson per 100,000 population (5 year average)
Crime - City-data.com crime index (5 year average)
Crime - Violent crime index (5 year average)
Crime - Property crime index (5 year average)
1996 Presidential Elections Results (%) - Democratic Party (Clinton)
1996 Presidential Elections Results (%) - Republican Party (Dole)
1996 Presidential Elections Results (%) - Other
2000 Presidential Elections Results (%) - Democratic Party (Gore)
2000 Presidential Elections Results (%) - Republican Party (Bush)
2000 Presidential Elections Results (%) - Other
2004 Presidential Elections Results (%) - Democratic Party (Kerry)
2004 Presidential Elections Results (%) - Republican Party (Bush)
2004 Presidential Elections Results (%) - Other
2008 Presidential Elections Results (%) - Democratic Party (Obama)
2008 Presidential Elections Results (%) - Republican Party (McCain)
2008 Presidential Elections Results (%) - Other
2012 Presidential Elections Results (%) - Democratic Party (Obama)
2012 Presidential Elections Results (%) - Republican Party (Romney)
2012 Presidential Elections Results (%) - Other
2016 Presidential Elections Results (%) - Democratic Party (Clinton)
2016 Presidential Elections Results (%) - Republican Party (Trump)
2016 Presidential Elections Results (%) - Other
2020 Presidential Elections Results (%) - Democratic Party (Biden)
2020 Presidential Elections Results (%) - Republican Party (Trump)
2020 Presidential Elections Results (%) - Other
Ancestries Reported - Arab (%)
Ancestries Reported - Czech (%)
Ancestries Reported - Danish (%)
Ancestries Reported - Dutch (%)
Ancestries Reported - English (%)
Ancestries Reported - French (%)
Ancestries Reported - French Canadian (%)
Ancestries Reported - German (%)
Ancestries Reported - Greek (%)
Ancestries Reported - Hungarian (%)
Ancestries Reported - Irish (%)
Ancestries Reported - Italian (%)
Ancestries Reported - Lithuanian (%)
Ancestries Reported - Norwegian (%)
Ancestries Reported - Polish (%)
Ancestries Reported - Portuguese (%)
Ancestries Reported - Russian (%)
Ancestries Reported - Scotch-Irish (%)
Ancestries Reported - Scottish (%)
Ancestries Reported - Slovak (%)
Ancestries Reported - Subsaharan African (%)
Ancestries Reported - Swedish (%)
Ancestries Reported - Swiss (%)
Ancestries Reported - Ukrainian (%)
Ancestries Reported - United States (%)
Ancestries Reported - Welsh (%)
Ancestries Reported - West Indian (%)
Ancestries Reported - Other (%)
Educational Attainment - No schooling completed (%)
Educational Attainment - Less than high school (%)
Educational Attainment - High school or equivalent (%)
Educational Attainment - Less than 1 year of college (%)
Educational Attainment - 1 or more years of college (%)
Educational Attainment - Associate degree (%)
Educational Attainment - Bachelor's degree (%)
Educational Attainment - Master's degree (%)
Educational Attainment - Professional school degree (%)
Educational Attainment - Doctorate degree (%)
School Enrollment - Nursery, preschool (%)
School Enrollment - Kindergarten (%)
School Enrollment - Grade 1 to 4 (%)
School Enrollment - Grade 5 to 8 (%)
School Enrollment - Grade 9 to 12 (%)
School Enrollment - College undergrad (%)
School Enrollment - Graduate or professional (%)
School Enrollment - Not enrolled in school (%)
School enrollment - Public schools (%)
School enrollment - Private schools (%)
School enrollment - Not enrolled (%)
Median number of rooms in houses and condos
Median number of rooms in apartments
Housing units lacking complete plumbing facilities (%)
Housing units lacking complete kitchen facilities (%)
Density of houses
Urban houses (%)
Rural houses (%)
Households with people 60 years and over (%)
Households with people 65 years and over (%)
Households with people 75 years and over (%)
Households with one or more nonrelatives (%)
Households with no nonrelatives (%)
Population in households (%)
Family households (%)
Nonfamily households (%)
Population in families (%)
Family households with own children (%)
Median number of bedrooms in owner occupied houses
Mean number of bedrooms in owner occupied houses
Median number of bedrooms in renter occupied houses
Mean number of bedrooms in renter occupied houses
Median number of vehichles in owner occupied houses
Mean number of vehichles in owner occupied houses
Median number of vehichles in renter occupied houses
Mean number of vehichles in renter occupied houses
Mortgage status - with mortgage (%)
Mortgage status - with second mortgage (%)
Mortgage status - with home equity loan (%)
Mortgage status - with both second mortgage and home equity loan (%)
Mortgage status - without a mortgage (%)
Average family size
Average family size - White
Average family size - Black or African American
Average family size - Asian
Average family size - Hispanic or Latino
Average family size - American Indian and Alaska Native
Average family size - Multirace
Average family size - Other Race
Geographical mobility - Same house 1 year ago (%)
Geographical mobility - Moved within same county (%)
Geographical mobility - Moved from different county within same state (%)
Geographical mobility - Moved from different state (%)
Geographical mobility - Moved from abroad (%)
Place of birth - Born in state of residence (%)
Place of birth - Born in other state (%)
Place of birth - Native, outside of US (%)
Place of birth - Foreign born (%)
Housing units in structures - 1, detached (%)
Housing units in structures - 1, attached (%)
Housing units in structures - 2 (%)
Housing units in structures - 3 or 4 (%)
Housing units in structures - 5 to 9 (%)
Housing units in structures - 10 to 19 (%)
Housing units in structures - 20 to 49 (%)
Housing units in structures - 50 or more (%)
Housing units in structures - Mobile home (%)
Housing units in structures - Boat, RV, van, etc. (%)
House/condo owner moved in on average (years ago)
Renter moved in on average (years ago)
Year householder moved into unit - Moved in 1999 to March 2000 (%)
Year householder moved into unit - Moved in 1995 to 1998 (%)
Year householder moved into unit - Moved in 1990 to 1994 (%)
Year householder moved into unit - Moved in 1980 to 1989 (%)
Year householder moved into unit - Moved in 1970 to 1979 (%)
Year householder moved into unit - Moved in 1969 or earlier (%)
Means of transportation to work - Drove car alone (%)
Means of transportation to work - Carpooled (%)
Means of transportation to work - Public transportation (%)
Means of transportation to work - Bus or trolley bus (%)
Means of transportation to work - Streetcar or trolley car (%)
Means of transportation to work - Subway or elevated (%)
Means of transportation to work - Railroad (%)
Means of transportation to work - Ferryboat (%)
Means of transportation to work - Taxicab (%)
Means of transportation to work - Motorcycle (%)
Means of transportation to work - Bicycle (%)
Means of transportation to work - Walked (%)
Means of transportation to work - Other means (%)
Working at home (%)
Industry diversity
Most Common Industries - Agriculture, forestry, fishing and hunting, and mining (%)
Most Common Industries - Agriculture, forestry, fishing and hunting (%)
Most Common Industries - Mining, quarrying, and oil and gas extraction (%)
Most Common Industries - Construction (%)
Most Common Industries - Manufacturing (%)
Most Common Industries - Wholesale trade (%)
Most Common Industries - Retail trade (%)
Most Common Industries - Transportation and warehousing, and utilities (%)
Most Common Industries - Transportation and warehousing (%)
Most Common Industries - Utilities (%)
Most Common Industries - Information (%)
Most Common Industries - Finance and insurance, and real estate and rental and leasing (%)
Most Common Industries - Finance and insurance (%)
Most Common Industries - Real estate and rental and leasing (%)
Most Common Industries - Professional, scientific, and management, and administrative and waste management services (%)
Most Common Industries - Professional, scientific, and technical services (%)
Most Common Industries - Management of companies and enterprises (%)
Most Common Industries - Administrative and support and waste management services (%)
Most Common Industries - Educational services, and health care and social assistance (%)
Most Common Industries - Educational services (%)
Most Common Industries - Health care and social assistance (%)
Most Common Industries - Arts, entertainment, and recreation, and accommodation and food services (%)
Most Common Industries - Arts, entertainment, and recreation (%)
Most Common Industries - Accommodation and food services (%)
Most Common Industries - Other services, except public administration (%)
Most Common Industries - Public administration (%)
Occupation diversity
Most Common Occupations - Management, business, science, and arts occupations (%)
Most Common Occupations - Management, business, and financial occupations (%)
Most Common Occupations - Management occupations (%)
Most Common Occupations - Business and financial operations occupations (%)
Most Common Occupations - Computer, engineering, and science occupations (%)
Most Common Occupations - Computer and mathematical occupations (%)
Most Common Occupations - Architecture and engineering occupations (%)
Most Common Occupations - Life, physical, and social science occupations (%)
Most Common Occupations - Education, legal, community service, arts, and media occupations (%)
Most Common Occupations - Community and social service occupations (%)
Most Common Occupations - Legal occupations (%)
Most Common Occupations - Education, training, and library occupations (%)
Most Common Occupations - Arts, design, entertainment, sports, and media occupations (%)
Most Common Occupations - Healthcare practitioners and technical occupations (%)
Most Common Occupations - Health diagnosing and treating practitioners and other technical occupations (%)
Most Common Occupations - Health technologists and technicians (%)
Most Common Occupations - Service occupations (%)
Most Common Occupations - Healthcare support occupations (%)
Most Common Occupations - Protective service occupations (%)
Most Common Occupations - Fire fighting and prevention, and other protective service workers including supervisors (%)
Most Common Occupations - Law enforcement workers including supervisors (%)
Most Common Occupations - Food preparation and serving related occupations (%)
Most Common Occupations - Building and grounds cleaning and maintenance occupations (%)
Most Common Occupations - Personal care and service occupations (%)
Most Common Occupations - Sales and office occupations (%)
Most Common Occupations - Sales and related occupations (%)
Most Common Occupations - Office and administrative support occupations (%)
Most Common Occupations - Natural resources, construction, and maintenance occupations (%)
Most Common Occupations - Farming, fishing, and forestry occupations (%)
Most Common Occupations - Construction and extraction occupations (%)
Most Common Occupations - Installation, maintenance, and repair occupations (%)
Most Common Occupations - Production, transportation, and material moving occupations (%)
Most Common Occupations - Production occupations (%)
Most Common Occupations - Transportation occupations (%)
Most Common Occupations - Material moving occupations (%)
People in Group quarters - Institutionalized population (%)
People in Group quarters - Correctional institutions (%)
People in Group quarters - Federal prisons and detention centers (%)
People in Group quarters - Halfway houses (%)
People in Group quarters - Local jails and other confinement facilities (including police lockups) (%)
People in Group quarters - Military disciplinary barracks (%)
People in Group quarters - State prisons (%)
People in Group quarters - Other types of correctional institutions (%)
People in Group quarters - Nursing homes (%)
People in Group quarters - Hospitals/wards, hospices, and schools for the handicapped (%)
People in Group quarters - Hospitals/wards and hospices for chronically ill (%)
People in Group quarters - Hospices or homes for chronically ill (%)
People in Group quarters - Military hospitals or wards for chronically ill (%)
People in Group quarters - Other hospitals or wards for chronically ill (%)
People in Group quarters - Hospitals or wards for drug/alcohol abuse (%)
People in Group quarters - Mental (Psychiatric) hospitals or wards (%)
People in Group quarters - Schools, hospitals, or wards for the mentally retarded (%)
People in Group quarters - Schools, hospitals, or wards for the physically handicapped (%)
People in Group quarters - Institutions for the deaf (%)
People in Group quarters - Institutions for the blind (%)
People in Group quarters - Orthopedic wards and institutions for the physically handicapped (%)
People in Group quarters - Wards in general hospitals for patients who have no usual home elsewhere (%)
People in Group quarters - Wards in military hospitals for patients who have no usual home elsewhere (%)
People in Group quarters - Juvenile institutions (%)
People in Group quarters - Long-term care (%)
People in Group quarters - Homes for abused, dependent, and neglected children (%)
People in Group quarters - Residential treatment centers for emotionally disturbed children (%)
People in Group quarters - Training schools for juvenile delinquents (%)
People in Group quarters - Short-term care, detention or diagnostic centers for delinquent children (%)
People in Group quarters - Type of juvenile institution unknown (%)
People in Group quarters - Noninstitutionalized population (%)
People in Group quarters - College dormitories (includes college quarters off campus) (%)
People in Group quarters - Military quarters (%)
People in Group quarters - On base (%)
People in Group quarters - Barracks, unaccompanied personnel housing (UPH), (Enlisted/Officer), ;and similar group living quarters for military personnel (%)
People in Group quarters - Transient quarters for temporary residents (%)
People in Group quarters - Military ships (%)
People in Group quarters - Group homes (%)
People in Group quarters - Homes or halfway houses for drug/alcohol abuse (%)
People in Group quarters - Homes for the mentally ill (%)
People in Group quarters - Homes for the mentally retarded (%)
People in Group quarters - Homes for the physically handicapped (%)
People in Group quarters - Other group homes (%)
People in Group quarters - Religious group quarters (%)
People in Group quarters - Dormitories (%)
People in Group quarters - Agriculture workers' dormitories on farms (%)
People in Group quarters - Job Corps and vocational training facilities (%)
People in Group quarters - Other workers' dormitories (%)
People in Group quarters - Crews of maritime vessels (%)
People in Group quarters - Other nonhousehold living situations (%)
People in Group quarters - Other noninstitutional group quarters (%)
Residents speaking English at home (%)
Residents speaking English at home - Born in the United States (%)
Residents speaking English at home - Native, born elsewhere (%)
Residents speaking English at home - Foreign born (%)
Residents speaking Spanish at home (%)
Residents speaking Spanish at home - Born in the United States (%)
Residents speaking Spanish at home - Native, born elsewhere (%)
Residents speaking Spanish at home - Foreign born (%)
Residents speaking other language at home (%)
Residents speaking other language at home - Born in the United States (%)
Residents speaking other language at home - Native, born elsewhere (%)
Residents speaking other language at home - Foreign born (%)
Class of Workers - Employee of private company (%)
Class of Workers - Self-employed in own incorporated business (%)
Class of Workers - Private not-for-profit wage and salary workers (%)
Class of Workers - Local government workers (%)
Class of Workers - State government workers (%)
Class of Workers - Federal government workers (%)
Class of Workers - Self-employed workers in own not incorporated business and Unpaid family workers (%)
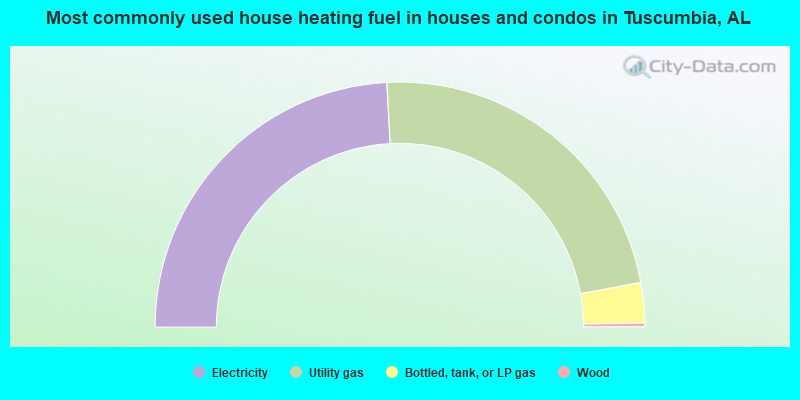
House heating fuel used in houses and condos - Utility gas (%)
House heating fuel used in houses and condos - Bottled, tank, or LP gas (%)
House heating fuel used in houses and condos - Electricity (%)
House heating fuel used in houses and condos - Fuel oil, kerosene, etc. (%)
House heating fuel used in houses and condos - Coal or coke (%)
House heating fuel used in houses and condos - Wood (%)
House heating fuel used in houses and condos - Solar energy (%)
House heating fuel used in houses and condos - Other fuel (%)
House heating fuel used in houses and condos - No fuel used (%)
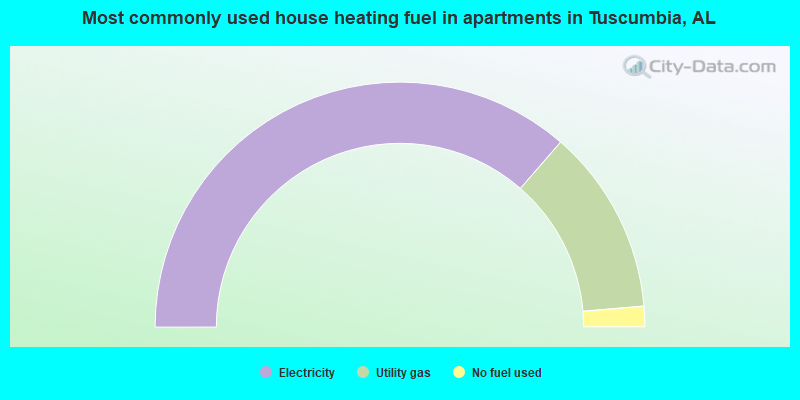
House heating fuel used in apartments - Utility gas (%)
House heating fuel used in apartments - Bottled, tank, or LP gas (%)
House heating fuel used in apartments - Electricity (%)
House heating fuel used in apartments - Fuel oil, kerosene, etc. (%)
House heating fuel used in apartments - Coal or coke (%)
House heating fuel used in apartments - Wood (%)
House heating fuel used in apartments - Solar energy (%)
House heating fuel used in apartments - Other fuel (%)
House heating fuel used in apartments - No fuel used (%)
Armed forces status - In Armed Forces (%)
Armed forces status - Civilian (%)
Armed forces status - Civilian - Veteran (%)
Armed forces status - Civilian - Nonveteran (%)
Fatal accidents locations in years 2005-2021
Fatal accidents locations in 2005
Fatal accidents locations in 2006
Fatal accidents locations in 2007
Fatal accidents locations in 2008
Fatal accidents locations in 2009
Fatal accidents locations in 2010
Fatal accidents locations in 2011
Fatal accidents locations in 2012
Fatal accidents locations in 2013
Fatal accidents locations in 2014
Fatal accidents locations in 2015
Fatal accidents locations in 2016
Fatal accidents locations in 2017
Fatal accidents locations in 2018
Fatal accidents locations in 2019
Fatal accidents locations in 2020
Fatal accidents locations in 2021
Alcohol use - People drinking some alcohol every month (%)
Alcohol use - People not drinking at all (%)
Alcohol use - Average days/month drinking alcohol
Alcohol use - Average drinks/week
Alcohol use - Average days/year people drink much
Audiometry - Average condition of hearing (%)
Audiometry - People that can hear a whisper from across a quiet room (%)
Audiometry - People that can hear normal voice from across a quiet room (%)
Audiometry - Ears ringing, roaring, buzzing (%)
Audiometry - Had a job exposure to loud noise (%)
Audiometry - Had off-work exposure to loud noise (%)
Blood Pressure & Cholesterol - Has high blood pressure (%)
Blood Pressure & Cholesterol - Checking blood pressure at home (%)
Blood Pressure & Cholesterol - Frequently checking blood cholesterol (%)
Blood Pressure & Cholesterol - Has high cholesterol level (%)
Consumer Behavior - Money monthly spent on food at supermarket/grocery store
Consumer Behavior - Money monthly spent on food at other stores
Consumer Behavior - Money monthly spent on eating out
Consumer Behavior - Money monthly spent on carryout/delivered foods
Consumer Behavior - Income spent on food at supermarket/grocery store (%)
Consumer Behavior - Income spent on food at other stores (%)
Consumer Behavior - Income spent on eating out (%)
Consumer Behavior - Income spent on carryout/delivered foods (%)
Current Health Status - General health condition (%)
Current Health Status - Blood donors (%)
Current Health Status - Has blood ever tested for HIV virus (%)
Current Health Status - Left-handed people (%)
Dermatology - People using sunscreen (%)
Diabetes - Diabetics (%)
Diabetes - Had a blood test for high blood sugar (%)
Diabetes - People taking insulin (%)
Diet Behavior & Nutrition - Diet health (%)
Diet Behavior & Nutrition - Milk product consumption (# of products/month)
Diet Behavior & Nutrition - Meals not home prepared (#/week)
Diet Behavior & Nutrition - Meals from fast food or pizza place (#/week)
Diet Behavior & Nutrition - Ready-to-eat foods (#/month)
Diet Behavior & Nutrition - Frozen meals/pizza (#/month)
Drug Use - People that ever used marijuana or hashish (%)
Drug Use - Ever used hard drugs (%)
Drug Use - Ever used any form of cocaine (%)
Drug Use - Ever used heroin (%)
Drug Use - Ever used methamphetamine (%)
Health Insurance - People covered by health insurance (%)
Kidney Conditions-Urology - Avg. # of times urinating at night
Medical Conditions - People with asthma (%)
Medical Conditions - People with anemia (%)
Medical Conditions - People with psoriasis (%)
Medical Conditions - People with overweight (%)
Medical Conditions - Elderly people having difficulties in thinking or remembering (%)
Medical Conditions - People who ever received blood transfusion (%)
Medical Conditions - People having trouble seeing even with glass/contacts (%)
Medical Conditions - People with arthritis (%)
Medical Conditions - People with gout (%)
Medical Conditions - People with congestive heart failure (%)
Medical Conditions - People with coronary heart disease (%)
Medical Conditions - People with angina pectoris (%)
Medical Conditions - People who ever had heart attack (%)
Medical Conditions - People who ever had stroke (%)
Medical Conditions - People with emphysema (%)
Medical Conditions - People with thyroid problem (%)
Medical Conditions - People with chronic bronchitis (%)
Medical Conditions - People with any liver condition (%)
Medical Conditions - People who ever had cancer or malignancy (%)
Mental Health - People who have little interest in doing things (%)
Mental Health - People feeling down, depressed, or hopeless (%)
Mental Health - People who have trouble sleeping or sleeping too much (%)
Mental Health - People feeling tired or having little energy (%)
Mental Health - People with poor appetite or overeating (%)
Mental Health - People feeling bad about themself (%)
Mental Health - People who have trouble concentrating on things (%)
Mental Health - People moving or speaking slowly or too fast (%)
Mental Health - People having thoughts they would be better off dead (%)
Oral Health - Average years since last visit a dentist
Oral Health - People embarrassed because of mouth (%)
Oral Health - People with gum disease (%)
Oral Health - General health of teeth and gums (%)
Oral Health - Average days a week using dental floss/device
Oral Health - Average days a week using mouthwash for dental problem
Oral Health - Average number of teeth
Pesticide Use - Households using pesticides to control insects (%)
Pesticide Use - Households using pesticides to kill weeds (%)
Physical Activity - People doing vigorous-intensity work activities (%)
Physical Activity - People doing moderate-intensity work activities (%)
Physical Activity - People walking or bicycling (%)
Physical Activity - People doing vigorous-intensity recreational activities (%)
Physical Activity - People doing moderate-intensity recreational activities (%)
Physical Activity - Average hours a day doing sedentary activities
Physical Activity - Average hours a day watching TV or videos
Physical Activity - Average hours a day using computer
Physical Functioning - People having limitations keeping them from working (%)
Physical Functioning - People limited in amount of work they can do (%)
Physical Functioning - People that need special equipment to walk (%)
Physical Functioning - People experiencing confusion/memory problems (%)
Physical Functioning - People requiring special healthcare equipment (%)
Prescription Medications - Average number of prescription medicines taking
Preventive Aspirin Use - Adults 40+ taking low-dose aspirin (%)
Reproductive Health - Vaginal deliveries (%)
Reproductive Health - Cesarean deliveries (%)
Reproductive Health - Deliveries resulted in a live birth (%)
Reproductive Health - Pregnancies resulted in a delivery (%)
Reproductive Health - Women breastfeeding newborns (%)
Reproductive Health - Women that had a hysterectomy (%)
Reproductive Health - Women that had both ovaries removed (%)
Reproductive Health - Women that have ever taken birth control pills (%)
Reproductive Health - Women taking birth control pills (%)
Reproductive Health - Women that have ever used Depo-Provera or injectables (%)
Reproductive Health - Women that have ever used female hormones (%)
Sexual Behavior - People 18+ that ever had sex (vaginal, anal, or oral) (%)
Sexual Behavior - Males 18+ that ever had vaginal sex with a woman (%)
Sexual Behavior - Males 18+ that ever performed oral sex on a woman (%)
Sexual Behavior - Males 18+ that ever had anal sex with a woman (%)
Sexual Behavior - Males 18+ that ever had any sex with a man (%)
Sexual Behavior - Females 18+ that ever had vaginal sex with a man (%)
Sexual Behavior - Females 18+ that ever performed oral sex on a man (%)
Sexual Behavior - Females 18+ that ever had anal sex with a man (%)
Sexual Behavior - Females 18+ that ever had any kind of sex with a woman (%)
Sexual Behavior - Average age people first had sex
Sexual Behavior - Average number of female sex partners in lifetime (males 18+)
Sexual Behavior - Average number of female vaginal sex partners in lifetime (males 18+)
Sexual Behavior - Average age people first performed oral sex on a woman (18+)
Sexual Behavior - Average number of woman performed oral sex on in lifetime (18+)
Sexual Behavior - Average number of male sex partners in lifetime (males 18+)
Sexual Behavior - Average number of male anal sex partners in lifetime (males 18+)
Sexual Behavior - Average age people first performed oral sex on a man (18+)
Sexual Behavior - Average number of male oral sex partners in lifetime (18+)
Sexual Behavior - People using protection when performing oral sex (%)
Sexual Behavior - Average number of times people have vaginal or anal sex a year
Sexual Behavior - People having sex without condom (%)
Sexual Behavior - Average number of male sex partners in lifetime (females 18+)
Sexual Behavior - Average number of male vaginal sex partners in lifetime (females 18+)
Sexual Behavior - Average number of female sex partners in lifetime (females 18+)
Sexual Behavior - Circumcised males 18+ (%)
Sleep Disorders - Average hours sleeping at night
Sleep Disorders - People that has trouble sleeping (%)
Smoking-Cigarette Use - People smoking cigarettes (%)
Taste & Smell - People 40+ having problems with smell (%)
Taste & Smell - People 40+ having problems with taste (%)
Taste & Smell - People 40+ that ever had wisdom teeth removed (%)
Taste & Smell - People 40+ that ever had tonsils teeth removed (%)
Taste & Smell - People 40+ that ever had a loss of consciousness because of a head injury (%)
Taste & Smell - People 40+ that ever had a broken nose or other serious injury to face or skull (%)
Taste & Smell - People 40+ that ever had two or more sinus infections (%)
Weight - Average height (inches)
Weight - Average weight (pounds)
Weight - Average BMI
Weight - People that are obese (%)
Weight - People that ever were obese (%)
Weight - People trying to lose weight (%)
6,320 69.4% White alone 2,176 23.9% Black alone 392 4.3% Two or more races 160 1.8% Hispanic 27 0.3% American Indian alone 19 0.2% Asian alone
Officers per 1,000 residents here:
2.49Alabama average:
2.40
Latest news from Tuscumbia, AL collected exclusively by city-data.com from local newspapers, TV, and radio stations
Ancestries: American (31.1%), English (11.9%), Irish (3.5%), Italian (1.3%).
Current Local Time:
Land area: 7.30 square miles.
Population density: 1,249 people per square mile (low).
15 residents are foreign born
This city:
0.2%Alabama:
3.5%
Median real estate property taxes paid for housing units with mortgages in 2022: $810 (0.4%)Median real estate property taxes paid for housing units with no mortgage in 2022: $600 (0.5%)
Nearest city with pop. 50,000+: Decatur, AL
Nearest city with pop. 200,000+: Birmingham, AL
Nearest city with pop. 1,000,000+: Chicago, IL
Nearest cities:
Latitude: 34.73 N, Longitude: 87.70 W
Daytime population change due to commuting: -504 (-5.5%)Workers who live and work in this city: 724 (19.3%)
Area code commonly used in this area: 256
Tuscumbia tourist attractions:
Single-family new house construction building permits:
2022: 28 buildings , average cost: $137,3002021: 34 buildings , average cost: $137,3002020: 30 buildings , average cost: $137,3002019: 24 buildings , average cost: $137,3002018: 24 buildings , average cost: $137,3002017: 21 buildings , average cost: $137,3002016: 18 buildings , average cost: $137,3002015: 16 buildings , average cost: $137,3002014: 13 buildings , average cost: $137,3002013: 12 buildings , average cost: $137,3002012: 12 buildings , average cost: $137,3002011: 10 buildings , average cost: $137,3002010: 11 buildings , average cost: $137,3002009: 11 buildings , average cost: $137,3002008: 29 buildings , average cost: $137,2002007: 20 buildings , average cost: $129,8002006: 71 buildings , average cost: $75,7002005: 36 buildings , average cost: $111,1002004: 35 buildings , average cost: $100,4002003: 20 buildings , average cost: $102,2002002: 18 buildings , average cost: $102,2002001: 15 buildings , average cost: $102,2002000: 15 buildings , average cost: $102,2001999: 27 buildings , average cost: $80,3001998: 23 buildings , average cost: $59,0001997: 8 buildings , average cost: $74,900Unemployment in December 2023:
Most common occupations in Tuscumbia, AL (%)
Both Males Females
Other production occupations, including supervisors (6.1%)
Cashiers (4.5%)
Metal workers and plastic workers (4.1%)
Building and grounds cleaning and maintenance occupations (3.8%)
Other management occupations, except farmers and farm managers (3.6%)
Other office and administrative support workers, including supervisors (3.6%)
Retail sales workers, except cashiers (3.2%)
Other production occupations, including supervisors (8.9%)
Metal workers and plastic workers (6.4%)
Electrical equipment mechanics and other installation, maintenance, and repair workers, including supervisors (5.2%)
Building and grounds cleaning and maintenance occupations (4.5%)
Other management occupations, except farmers and farm managers (4.3%)
Driver/sales workers and truck drivers (4.1%)
Vehicle and mobile equipment mechanics, installers, and repairers (3.6%)
Cashiers (8.3%)
Other office and administrative support workers, including supervisors (7.3%)
Information and record clerks, except customer service representatives (6.0%)
Preschool, kindergarten, elementary, and middle school teachers (5.0%)
Secretaries and administrative assistants (5.0%)
Bookkeeping, accounting, and auditing clerks (4.2%)
Registered nurses (4.0%)
Air pollution and air quality trends(lower is better)
AQI NO2 SO2 Ozone
Tornado activity:
Tuscumbia-area historical tornado activity is slightly above Alabama state average. It is 123% greater than the overall U.S. average.
On 4/3/1974, a category F5 (max. wind speeds 261-318 mph) tornado 22.1 miles away from the Tuscumbia city center killed 28 people and injured 267 people .
On 4/3/1974, a category F5 tornado 37.2 miles away from the city center killed 16 people and injured 190 people .
Earthquake activity:
Tuscumbia-area historical earthquake activity is significantly above Alabama state average. It is 219% greater than the overall U.S. average. On 1/18/1999 at 07:00:53, a magnitude 4.8 (4.8 MB, 4.0 LG, Depth: 0.6 mi, Class: Light, Intensity: IV - V) earthquake occurred 95.2 miles away from Tuscumbia center On 4/29/2003 at 08:59:39, a magnitude 4.9 (4.4 MB, 4.6 MW, 4.9 LG) earthquake occurred 119.2 miles away from Tuscumbia center On 3/25/1976 at 00:41:20, a magnitude 5.0 (4.9 MB, 5.0 LG, Class: Moderate, Intensity: VI - VII) earthquake occurred 161.0 miles away from the city center On 6/24/1975 at 11:11:36, a magnitude 4.5 (4.5 MB) earthquake occurred 70.4 miles away from Tuscumbia center On 5/4/1991 at 01:18:54, a magnitude 5.0 (4.4 MB, 4.6 LG, 5.0 LG, Depth: 3.1 mi) earthquake occurred 174.0 miles away from the city center On 4/18/2008 at 09:36:59, a magnitude 5.4 (5.1 MB, 4.8 MS, 5.4 MW, 5.2 MW) earthquake occurred 257.6 miles away from Tuscumbia center Magnitude types: regional Lg-wave magnitude (LG), body-wave magnitude (MB), surface-wave magnitude (MS), moment magnitude (MW) Natural disasters: The number of natural disasters in Colbert County (19) is greater than the US average (15).Major Disasters (Presidential) Declared: 11Emergencies Declared: 5Floods: 9, Storms: 9, Tornadoes: 7, Hurricanes: 4, Winds: 4, Freezes: 2, Winter Storms: 2, Drought: 1, Ice Storm: 1, Snowfall: 1, Other: 1 (Note: some incidents may be assigned to more than one category). Hospitals and medical centers in Tuscumbia: COTTAGE OF THE SHOALS CARE AND REHABILITATION CENTER (500 JOHN ALDRIDGE DRIVE)
KELLER LANDING CARE AND REHABILITATION CENTER (813 KELLER LANE)
Other hospitals and medical centers near Tuscumbia: NORTHWEST ALABAMA REGIONAL HOME CARE AGENCY (Home Health Center, about 2 miles away; SHEFFIELD, AL)
HELEN KELLER MEMORIAL HOSPITAL (about 2 miles away; SHEFFIELD, AL)
SHEFFIELD DIALYSIS (Dialysis Facility, about 2 miles away; SHEFFIELD, AL)
SHOALS HOSPITAL (about 2 miles away; MUSCLE SHOALS, AL)
CYPRESS COVE CARE AND REHABILITATION CENTER (Nursing Home, about 4 miles away; MUSCLE SHOALS, AL)
WIREGRASS HOSPICE, FLORENCE (Hospital, about 5 miles away; FLORENCE, AL)
ELIZA COFFEE MEMORIAL HOSPITAL (about 5 miles away; FLORENCE, AL)
Colleges/universities with over 2000 students nearest to Tuscumbia:
Northwest-Shoals Community College (about 2 miles; Muscle Shoals, AL ; Full-time enrollment: 2,702)
University of North Alabama (about 6 miles; Florence, AL ; FT enrollment: 5,886)
Athens State University (about 43 miles; Athens, AL ; FT enrollment: 2,771)
John C Calhoun State Community College (about 44 miles; Tanner, AL ; FT enrollment: 7,911)
Northeast Mississippi Community College (about 50 miles; Booneville, MS ; FT enrollment: 3,024)
Itawamba Community College (about 52 miles; Fulton, MS ; FT enrollment: 5,489)
University of Alabama in Huntsville (about 61 miles; Huntsville, AL ; FT enrollment: 6,006)
Public high schools in Tuscumbia: COLBERT HEIGHTS HIGH SCH Students: 481, Location: 6825 WOODMONT DR, Grades: 7-12)DESHLER HIGH SCH Students: 463, Location: 200 N COMMONS EAST, Grades: 9-12)DESHLER CAREER TECHNICAL CENTER Location: 200 N COMMONS EAST, Grades: 9-12)
DESHLER ALT SCH Location: 200 NORTH COMMONS EAST, Grades: 4-12)
Private high school in Tuscumbia: COVENANT CHRISTIAN SCHOOL Students: 198, Location: 1900 COVENANT DR, Grades: PK-12)
Public elementary/middle schools in Tuscumbia: COLBERT HEIGHTS ELEM SCH Students: 489, Location: 1551 SUNSET DR, Grades: KG-6)DESHLER MIDDLE SCH Students: 356, Location: 598 N HIGH ST, Grades: 6-8)G W TRENHOLM PRIMARY SCH Students: 343, Location: 601 JOE WHEELER HWY, Grades: KG-2)R E THOMPSON INTERMEDIATE SCH Students: 342, Location: 829 FRANKFORT RD, Grades: 3-5)NEW BETHEL ELEM SCH Students: 166, Location: 900 NEW BETHEL SCHOOL RD, Grades: KG-6)See full list of schools located in Tuscumbia Library in Tuscumbia: TUSCUMBIA - HELEN KELLER PUBLIC LIBRARY Operating income: $135,711; Location: 511 NORTH MAIN STREET; 24,964 books ; 30,828 e-books ; 1,261 audio materials ; 1,741 video materials ; 81 state licensed databases ; 42 print serial subscriptions )
User-submitted facts and corrections:
Your info for the radio stations is out of date.
Heritage Christian University, 3625 Helton Drive, Florence, Alabama 35630
Notable locations in Tuscumbia: (A) , Tennessee Valley Country Club and Golf Course (B) , Helen Keller Home (C) , Tuscumbia Fire Department (D) . Display/hide their locations on the map
Churches in Tuscumbia include: (A) , Lesley Christian Methodist Episcopal Temple (B) , Calvary Baptist Church (C) , Church of Christ (D) , Church of God (E) , First Baptist Church (F) , First Methodist Church (G) , First Presbyterian Church (H) , Full Gospel Tabernacle (I) . Display/hide their locations on the map
Cemetery: (1) . Display/hide its location on the map
Streams, rivers, and creeks: (A) . Display/hide its location on the map
Parks in Tuscumbia include: (1) , Colbert County Courthouse Square Historic District (2) , Tuscumbia Historic District (3) , The Commons (4) , Spring Park (5) , Avalon Park (6) , Ivy Green (7) . Display/hide their locations on the map
Tourist attractions:
Hotels:
Birthplace of: Helen Keller - (1880-1968), Blind-deaf writer, Mitch McConnell - Kentucky politician, Heinie Manush - Baseball player and coach, James Deshler - Confederate Brigadier General during the Civil War, Wilson D. Watson - Marine Corps Medal of Honor recipient, Beverly Barton - Author, Frank Manush - Baseball player, Jimmy Orr - Football player, Margaret Pellegrini - Film actor, William H. Steele (judge) - Judge.
Colbert County has a predicted average indoor radon screening level greater than 4 pCi/L (pico curies per liter) - Highest Potential Drinking water stations with addresses in Tuscumbia and their reported violations in the past:
TUSCUMBIA WATER WORKS (Population served: 13,338, Surface water):
Past health violations:
MCL, Monthly (TCR) - In JUL-2006, Contaminant: Coliform
Address: 2750 HWY 20 Population served: 10,731, Surface water):
Past monitoring violations:
Failure Submit Treatment Requirement Rpt - In APR-01-2009, Contaminant: LT2ESWTR. Follow-up actions: St Public Notif requested (APR-10-2009), St Violation/Reminder Notice (APR-10-2009), St Public Notif received (MAY-21-2009), St Compliance achieved (MAY-01-2010)
Address: 890 LAGRANGE ROAD Population served: 5,013, Purch surface water):
Past health violations:
MCL, Average - Between JUL-2008 and SEP-2008, Contaminant: TTHM. Follow-up actions: St Public Notif requested (OCT-24-2008), St Violation/Reminder Notice (OCT-24-2008), St AO (w/o penalty) issued (NOV-14-2008), St Public Notif received (DEC-04-2008), St Compliance achieved (OCT-09-2009)
MCL, Average - Between APR-2008 and JUN-2008, Contaminant: TTHM. Follow-up actions: St Public Notif requested (JUL-22-2008), St Violation/Reminder Notice (JUL-22-2008), St Public Notif received (AUG-18-2008), St AO (w/o penalty) issued (NOV-14-2008), St Compliance achieved (OCT-09-2009)
MCL, Average - Between JAN-2008 and MAR-2008, Contaminant: TTHM. Follow-up actions: St Public Notif requested (MAY-06-2008), St Violation/Reminder Notice (MAY-06-2008), St Public Notif received (JUN-12-2008), St AO (w/o penalty) issued (NOV-14-2008), St Compliance achieved (OCT-09-2009)
MCL, Average - Between OCT-2007 and DEC-2007, Contaminant: TTHM. Follow-up actions: St Public Notif requested (JAN-22-2008), St Violation/Reminder Notice (JAN-22-2008), St Public Notif received (FEB-20-2008), St AO (w/o penalty) issued (NOV-14-2008), St Compliance achieved (OCT-09-2009)
Address: 200 NEW BETHEL ROAD Population served: 4,035, Purch surface water):
Past health violations:
MCL, Monthly (TCR) - In MAY-2012, Contaminant: Coliform. Follow-up actions: St Public Notif requested (JUN-06-2012), St Violation/Reminder Notice (JUN-06-2012), St Public Notif received (JUL-03-2012), St Compliance achieved (JUL-20-2012)
Past monitoring violations:
Monitoring and Reporting (DBP) - Between JAN-17-2013 and APR-08-2013, Contaminant: TTHM. Follow-up actions: St Public Notif requested (AUG-13-2012), St Violation/Reminder Notice (AUG-13-2012), St Public Notif received (JUL-12-2013), St Compliance achieved (AUG-14-2013)
Monitoring and Reporting (DBP) - Between JAN-17-2013 and APR-08-2013, Contaminant: Total Haloacetic Acids (HAA5). Follow-up actions: St Public Notif requested (AUG-13-2012), St Violation/Reminder Notice (AUG-13-2012), St Public Notif received (JUL-12-2013), St Compliance achieved (AUG-14-2013)
Monitoring and Reporting (DBP) - Between OCT-11-2012 and JAN-16-2013, Contaminant: TTHM. Follow-up actions: St Public Notif requested (AUG-13-2012), St Violation/Reminder Notice (AUG-13-2012), St Compliance achieved (MAY-16-2013), St Public Notif received (JUL-12-2013)
Monitoring and Reporting (DBP) - Between OCT-11-2012 and JAN-16-2013, Contaminant: Total Haloacetic Acids (HAA5). Follow-up actions: St Public Notif requested (AUG-13-2012), St Violation/Reminder Notice (AUG-13-2012), St Compliance achieved (MAY-16-2013), St Public Notif received (JUL-12-2013)
Monitoring and Reporting (DBP) - Between JUL-16-2012 and OCT-10-2012, Contaminant: Total Haloacetic Acids (HAA5). Follow-up actions: St Public Notif requested (AUG-13-2012), St Violation/Reminder Notice (AUG-13-2012), St Compliance achieved (FEB-22-2013), St Public Notif received (JUL-12-2013)
One regular monitoring violation
3 other older monitoring violations
Average household size: This city:
2.2 peopleAlabama:
2.5 people
Percentage of family households: This city:
61.4%Whole state:
67.8%
Percentage of households with unmarried partners: This city:
4.5%Whole state:
4.7%
Likely homosexual households (counted as self-reported same-sex unmarried-partner households)
Lesbian couples: 0.4% of all households Gay men: 0.3% of all households
166 people in nursing facilities/skilled-nursing facilities in 2010people in local jails and other municipal confinement facilities in 2010people in nursing homes in 2000people in local jails and other confinement facilities (including police lockups) in 2000
Banks with branches in Tuscumbia (2011 data):
Bank Independent: Tuscumbia Branch at 119 North Main Street, branch established on 1975/03/10. Info updated 2011/02/24: Bank assets: $1,041.1 mil, Deposits: $871.4 mil, headquarters in Sheffield, AL, positive income , Commercial Lending Specialization, 28 total offices , Holding Company: Bancindependent Incorporated
First Metro Bank: Main Street Branch at 301 North Main Street, branch established on 1990/08/06. Info updated 2011/02/24: Bank assets: $471.4 mil, Deposits: $418.8 mil, headquarters in Muscle Shoals, AL, positive income , Commercial Lending Specialization, 8 total offices , Holding Company: First Metro Bancorp
For population 15 years and over in Tuscumbia:
Never married: 27.9%Now married: 44.0%Separated: 0.6%Widowed: 9.5%Divorced: 18.0% For population 25 years and over in Tuscumbia:
High school or higher: 87.0%Bachelor's degree or higher: 16.6%Graduate or professional degree: 5.8%Unemployed: 5.0%Mean travel time to work (commute): 20.0 minutes
Education Gini index (Inequality in education) Here:
10.2Alabama average:
11.5
Religion statistics for Tuscumbia, AL (based on Colbert County data)
Religion Adherents Congregations Evangelical Protestant 29,759 103 Mainline Protestant 3,368 17 Black Protestant 3,256 18 Catholic 1,415 1 Other 7 1 None 16,623 -
Source: Clifford Grammich, Kirk Hadaway, Richard Houseal, Dale E.Jones, Alexei Krindatch, Richie Stanley and Richard H.Taylor. 2012. 2010 U.S.Religion Census: Religious Congregations & Membership Study. Association of Statisticians of American Religious Bodies. Jones, Dale E., et al. 2002. Congregations and Membership in the United States 2000. Nashville, TN: Glenmary Research Center. Graphs represent county-level data
Food Environment Statistics: Number of grocery stores : 10This county :
1.83 / 10,000 pop.State :
1.89 / 10,000 pop.
Number of supercenters and club stores : 1Here :
0.18 / 10,000 pop.Alabama :
0.20 / 10,000 pop.
Number of convenience stores (no gas) : 9Colbert County :
1.65 / 10,000 pop.Alabama :
0.65 / 10,000 pop.
Number of convenience stores (with gas) : 32This county :
5.87 / 10,000 pop.Alabama :
6.32 / 10,000 pop.
Number of full-service restaurants : 34Colbert County :
6.24 / 10,000 pop.Alabama :
5.75 / 10,000 pop.
Adult obesity rate : Colbert County :
35.7%Alabama :
31.7%
Low-income preschool obesity rate : Colbert County :
14.7%State :
13.5%
Health and Nutrition: Healthy diet rate : This city:
47.4%State:
49.0%
Average overall health of teeth and gums : Tuscumbia:
41.4%Alabama:
45.7%
People feeling badly about themselves : Tuscumbia:
22.4%Alabama:
20.7%
People not drinking alcohol at all : Average hours sleeping at night : Overweight people : This city:
34.4%State:
34.4%
General health condition : Tuscumbia:
51.3%Alabama:
55.2%
Average condition of hearing : This city:
75.8%State:
79.3%
More about Health and Nutrition of Tuscumbia, AL Residents
Local government employment and payroll (March 2022)
Function
Full-time employees
Monthly full-time payroll
Average yearly full-time wage
Part-time employees
Monthly part-time payroll
Parks and Recreation
15 $43,881 $35,105 7 $8,932 Firefighters
14 $53,329 $45,711 4 $5,624 Streets and Highways
11 $27,178 $29,649 1 $2,469 Solid Waste Management
8 $21,977 $32,966 0 $0 Police Protection - Officers
7 $26,052 $44,661 8 $9,807 Financial Administration
5 $31,310 $75,144 0 $0 Police - Other
4 $10,396 $31,188 1 $872 Correction
3 $6,716 $26,864 0 $0 Other and Unallocable
2 $6,521 $39,126 1 $221 Judicial and Legal
2 $6,840 $41,040 1 $1,366 Local Libraries
2 $6,368 $38,208 1 $1,185 Other Government Administration
0 $0 6 $6,643
Totals for Government
73 $240,568 $39,545 30 $37,120
Tuscumbia government finances - Expenditure in 2021 (per resident):
Construction - General - Other: $4,124,000 ($452.54)
Current Operations - General - Other: $1,540,000 ($168.99)
Police Protection: $1,396,000 ($153.19)Solid Waste Management: $830,000 ($91.08)Parks and Recreation: $809,000 ($88.77)Local Fire Protection: $807,000 ($88.55)Regular Highways: $675,000 ($74.07)Financial Administration: $248,000 ($27.21)Judicial and Legal Services: $182,000 ($19.97)Libraries: $176,000 ($19.31)Transit Utilities: $157,000 ($17.23)Central Staff Services: $105,000 ($11.52)Miscellaneous Commercial Activities - Other: $98,000 ($10.75)General Public Buildings: $87,000 ($9.55)General - Interest on Debt: $229,000 ($25.13)
Other Capital Outlay - General - Other: $104,000 ($11.41)
Tuscumbia government finances - Revenue in 2021 (per resident):
Charges - Solid Waste Management: $1,026,000 ($112.59)
Parks and Recreation: $234,000 ($25.68)Other: $72,000 ($7.90)Miscellaneous - General Revenue - Other: $304,000 ($33.36)
Fines and Forfeits: $56,000 ($6.15)Interest Earnings: $5,000 ($0.55)State Intergovernmental - Other: $3,184,000 ($349.39)
General Local Government Support: $1,259,000 ($138.15)Tax - Other Selective Sales: $3,404,000 ($373.53)
Property: $1,139,000 ($124.99)Other License: $557,000 ($61.12)Motor Fuels Sales: $198,000 ($21.73)Alcoholic Beverage Sales: $114,000 ($12.51)Other: $100,000 ($10.97)Public Utilities Sales: $88,000 ($9.66)Tobacco Products Sales: $74,000 ($8.12)
Tuscumbia government finances - Debt in 2021 (per resident):
Long Term Debt - Beginning Outstanding - Unspecified Public Purpose: $5,671,000 ($622.30)
Outstanding Unspecified Public Purpose: $5,033,000 ($552.29)Retired Unspecified Public Purpose: $638,000 ($70.01)
Tuscumbia government finances - Cash and Securities in 2021 (per resident):
Other Funds - Cash and Securities: $1,164,000 ($127.73)
Sinking Funds - Cash and Securities: $344,000 ($37.75)
Businesses in Tuscumbia, AL
Name Count Name Count
AutoZone 1 McDonald's 1 Burger King 1 Microtel 1 Chevrolet 1 Penske 1 Curves 1 Toyota 1 FedEx 2 UPS 1 Hardee's 1 Waffle House 1
Strongest AM radio stations in Tuscumbia:
WVNA (1590 AM; 5 kW; TUSCUMBIA, AL; Owner: CLEAR CHANNEL BROADCASTING LICENSES, INC.)
WLAY (1450 AM; 1 kW; MUSCLE SHOALS, AL; Owner: CLEAR CHANNEL BROADCASTING LICENSES, INC.)
WZZA (1410 AM; 0 kW; TUSCUMBIA, AL; Owner: MUSCLE SHOALS BROADCASTING, INC.)
WBTG (1290 AM; 1 kW; SHEFFIELD, AL)
WBCF (1240 AM; 1 kW; FLORENCE, AL; Owner: BENNY CARLE BROADCASTING, INC.)
WSBM (1340 AM; 1 kW; FLORENCE, AL; Owner: BIG RIVER B/CING. CORP.)
WZNN (620 AM; 5 kW; LEXINGTON, AL; Owner: MANUEL HUERTA)
WLOR (1550 AM; 50 kW; HUNTSVILLE, AL; Owner: BCA RADIO, LLC)
WSM (650 AM; 50 kW; NASHVILLE, TN; Owner: GAYLORD ENTERTAINMENT COMPANY)
WJOX (690 AM; 50 kW; BIRMINGHAM, AL; Owner: CITADEL BROADCASTING COMPANY)
WDJC (850 AM; 50 kW; BIRMINGHAM, AL; Owner: KIMTRON, INC.)
WVNN (770 AM; 10 kW; ATHENS, AL; Owner: ATHENS BROADCASTING COMPANY, INC.)
WCPC (940 AM; 50 kW; HOUSTON, MS; Owner: WCPC BROADCASTING CO., INC.)
Strongest FM radio stations in Tuscumbia:
WLAY-FM (100.3 FM; TUSCUMBIA, AL; Owner: CLEAR CHANNEL BROADCASTING LICENSES, INC.)
WQLT-FM (107.3 FM; FLORENCE, AL; Owner: BIG RIVER BROADCASTING CORPORATION)
WFIX (91.3 FM; FLORENCE, AL; Owner: TRI-STATE INSPIRATIONAL B/C CORP.)
WXFL (96.1 FM; FLORENCE, AL; Owner: BIG RIVER BROADCASTING CORP.)
WVNA-FM (105.5 FM; MUSCLE SHOALS, AL; Owner: CLEAR CHANNEL BROADCASTING LICENSES, INC.)
WBTG-FM (106.3 FM; SHEFFIELD, AL; Owner: SLATTON & ASSOCS. BROADCASTERS, INC.)
WMXV (103.5 FM; RUSSELLVILLE, AL; Owner: CLEAR CHANNEL BROADCASTING LICENSES, INC.)
W254AA (98.7 FM; COLBERT HEIGHTS, AL; Owner: WILLIAM P. ROGERS)
W274AA (102.7 FM; MUSCLE SHOALS, AL; Owner: WILLIAM P. ROGERS)
WQPR (88.7 FM; MUSCLE SHOALS, AL; Owner: THE BD OF TRUSTEES UNIV. OF ALABAMA)
WAKD (89.9 FM; SHEFFIELD, AL; Owner: AMERICAN FAMILY ASSOCIATION)
W280DA (103.9 FM; FLORENCE, AL; Owner: BIBLE BROADCASTING NETWORK, INC.)
W258AE (99.5 FM; FLORENCE, AL; Owner: WAY-FM MEDIA GROUP, INC.)
W202BY (88.3 FM; KILLEN, AL; Owner: WAY-FM MEDIA GROUP, INC.)
WYTK (93.9 FM; ROGERSVILLE, AL; Owner: SHOALS BROADCASTING CORPORATION)
WMSR-FM (94.9 FM; COLLINWOOD, TN; Owner: OHIO BROADCAST ASSOCIATES)
WJOR-FM (101.5 FM; ST. JOSEPH, TN; Owner: CLEAR CHANNEL BROADCASTING LICENSES, INC.)
W232AH (94.3 FM; FLORENCE, AL; Owner: SLATTON & ASSOCIATES B/CSTERS INC.)
W225AB (92.9 FM; FLORENCE, AL; Owner: WILLIAM P. ROGERS)
W253AH (98.5 FM; FLORENCE, AL; Owner: BIG RIVER BROADCASTING CORP.)
TV broadcast stations around Tuscumbia:
W57BV (Channel 57; FLORENCE, AL; Owner: TRINITY BROADCASTING NETWORK)
WHDF (Channel 15; FLORENCE, AL; Owner: VALLEY TELEVISION, LLC)
WBCF-LP (Channel 3; FLORENCE, AL; Owner: BENNY CARLE BROADCASTING, INC.)
WXFL-LP (Channel 5; FLORENCE, ETC., AL; Owner: BENNY CARLE BROADCASTING, INC.)
WYLE (Channel 26; FLORENCE, AL; Owner: ETC COMMUNICATIONS INC.)
WFIQ (Channel 36; FLORENCE, AL; Owner: ALABAMA EDUCATIONAL TELEVISION COMMISSION)
W46CF (Channel 46; TUSCUMBIA, AL; Owner: UNITY BROADCASTING, INC.)
W59CF (Channel 59; RUSSELLVILLE, AL; Owner: UNITY BROADCASTING, INC.)
Medal of Honor Recipients
Medal of Honor Recipient born in Tuscumbia: Wilson Douglas Watson.
National Bridge Inventory (NBI) Statistics 28 Number of bridges440ft / 134m Total length $41,840,000 Total costs132,722 Total average daily traffic18,505 Total average daily truck traffic
New bridges - historical statistics
2 1930-1939 2 1940-1949 9 1950-1959 4 1960-1969 1 1970-1979 2 1980-1989 5 1990-1999 2 2000-2009 1 2010-2019
See full National Bridge Inventory statistics for Tuscumbia, AL
Home Mortgage Disclosure Act Aggregated Statistics For Year 2009(Based on 2 partial tracts) A) FHA, FSA/RHS & VA B) Conventional C) Refinancings D) Home Improvement Loans E) Loans on Dwellings For 5+ Families F) Non-occupant Loans on G) Loans On Manufactured Number Average Value Number Average Value Number Average Value Number Average Value Number Average Value Number Average Value Number Average Value
LOANS ORIGINATED 16 $106,308 26 $89,045 93 $100,483 10 $28,843 2 $1,280,960 19 $79,763 2 $27,870 APPLICATIONS APPROVED, NOT ACCEPTED 1 $54,990 0 $0 5 $87,604 0 $0 0 $0 0 $0 0 $0 APPLICATIONS DENIED 1 $146,330 4 $44,688 41 $98,578 4 $23,428 1 $45,950 2 $49,920 1 $45,960 APPLICATIONS WITHDRAWN 2 $104,980 1 $68,470 20 $105,065 0 $0 0 $0 0 $0 0 $0 FILES CLOSED FOR INCOMPLETENESS 1 $48,210 1 $50,470 4 $137,630 0 $0 0 $0 0 $0 0 $0
Aggregated Statistics For Year 2008(Based on 2 partial tracts) A) FHA, FSA/RHS & VA B) Conventional C) Refinancings D) Home Improvement Loans F) Non-occupant Loans on G) Loans On Manufactured Number Average Value Number Average Value Number Average Value Number Average Value Number Average Value Number Average Value
LOANS ORIGINATED 17 $96,506 33 $105,010 76 $81,222 15 $43,271 24 $60,313 1 $30,870 APPLICATIONS APPROVED, NOT ACCEPTED 0 $0 5 $83,254 7 $114,199 2 $15,475 2 $43,375 1 $87,850 APPLICATIONS DENIED 7 $93,291 11 $79,819 38 $91,978 6 $13,450 1 $49,710 3 $43,960 APPLICATIONS WITHDRAWN 2 $113,695 2 $92,010 15 $89,074 2 $49,950 0 $0 0 $0 FILES CLOSED FOR INCOMPLETENESS 2 $48,465 1 $67,540 2 $125,050 0 $0 0 $0 0 $0
Aggregated Statistics For Year 2007(Based on 2 partial tracts) A) FHA, FSA/RHS & VA B) Conventional C) Refinancings D) Home Improvement Loans F) Non-occupant Loans on G) Loans On Manufactured Number Average Value Number Average Value Number Average Value Number Average Value Number Average Value Number Average Value
LOANS ORIGINATED 5 $85,402 62 $89,148 68 $74,721 18 $35,961 23 $53,794 1 $22,040 APPLICATIONS APPROVED, NOT ACCEPTED 0 $0 5 $48,328 8 $93,301 0 $0 2 $85,865 0 $0 APPLICATIONS DENIED 2 $65,170 17 $68,674 41 $89,289 16 $27,751 1 $139,760 4 $35,085 APPLICATIONS WITHDRAWN 0 $0 2 $81,855 13 $76,095 2 $85,925 0 $0 0 $0 FILES CLOSED FOR INCOMPLETENESS 0 $0 2 $61,770 7 $75,539 1 $158,050 0 $0 0 $0
Aggregated Statistics For Year 2006(Based on 2 partial tracts) A) FHA, FSA/RHS & VA B) Conventional C) Refinancings D) Home Improvement Loans F) Non-occupant Loans on G) Loans On Manufactured Number Average Value Number Average Value Number Average Value Number Average Value Number Average Value Number Average Value
LOANS ORIGINATED 4 $85,622 85 $81,621 76 $81,355 17 $28,543 21 $67,680 1 $43,150 APPLICATIONS APPROVED, NOT ACCEPTED 0 $0 4 $69,158 11 $93,222 2 $8,650 1 $157,110 0 $0 APPLICATIONS DENIED 1 $109,000 15 $63,699 47 $85,324 19 $40,941 2 $88,315 5 $39,772 APPLICATIONS WITHDRAWN 0 $0 4 $91,190 21 $80,914 4 $61,760 2 $100,940 0 $0 FILES CLOSED FOR INCOMPLETENESS 0 $0 5 $65,260 9 $84,489 0 $0 0 $0 0 $0
Aggregated Statistics For Year 2005(Based on 2 partial tracts) A) FHA, FSA/RHS & VA B) Conventional C) Refinancings D) Home Improvement Loans E) Loans on Dwellings For 5+ Families F) Non-occupant Loans on G) Loans On Manufactured Number Average Value Number Average Value Number Average Value Number Average Value Number Average Value Number Average Value Number Average Value
LOANS ORIGINATED 5 $67,998 80 $70,074 89 $87,228 20 $27,665 1 $1,253,490 21 $58,640 2 $19,465 APPLICATIONS APPROVED, NOT ACCEPTED 0 $0 5 $87,922 18 $77,334 1 $42,280 0 $0 1 $65,920 0 $0 APPLICATIONS DENIED 2 $110,575 10 $78,717 67 $79,230 11 $40,235 0 $0 2 $37,585 1 $25,790 APPLICATIONS WITHDRAWN 0 $0 6 $84,688 23 $83,749 2 $43,455 0 $0 2 $29,585 0 $0 FILES CLOSED FOR INCOMPLETENESS 0 $0 5 $60,440 24 $92,796 1 $11,300 0 $0 2 $55,370 0 $0
Aggregated Statistics For Year 2004(Based on 2 partial tracts) A) FHA, FSA/RHS & VA B) Conventional C) Refinancings D) Home Improvement Loans F) Non-occupant Loans on G) Loans On Manufactured Number Average Value Number Average Value Number Average Value Number Average Value Number Average Value Number Average Value
LOANS ORIGINATED 3 $131,480 63 $67,599 84 $75,817 15 $40,909 20 $52,326 3 $50,340 APPLICATIONS APPROVED, NOT ACCEPTED 1 $122,030 9 $70,787 28 $64,513 0 $0 0 $0 0 $0 APPLICATIONS DENIED 1 $44,090 15 $62,490 60 $75,782 6 $31,785 4 $35,448 1 $47,370 APPLICATIONS WITHDRAWN 0 $0 5 $56,776 13 $82,772 0 $0 1 $50,650 0 $0 FILES CLOSED FOR INCOMPLETENESS 1 $29,380 2 $32,390 30 $81,093 0 $0 2 $49,275 0 $0
Aggregated Statistics For Year 2003(Based on 2 partial tracts) A) FHA, FSA/RHS & VA B) Conventional C) Refinancings D) Home Improvement Loans F) Non-occupant Loans on Number Average Value Number Average Value Number Average Value Number Average Value Number Average Value
LOANS ORIGINATED 2 $74,100 78 $69,206 150 $73,874 12 $21,769 20 $45,441 APPLICATIONS APPROVED, NOT ACCEPTED 0 $0 6 $58,242 29 $78,363 0 $0 0 $0 APPLICATIONS DENIED 0 $0 16 $52,798 69 $72,911 4 $14,305 4 $39,440 APPLICATIONS WITHDRAWN 1 $48,960 4 $65,725 28 $73,112 1 $40,390 0 $0 FILES CLOSED FOR INCOMPLETENESS 0 $0 2 $92,110 2 $62,665 0 $0 0 $0
Aggregated Statistics For Year 2002(Based on 2 partial tracts) A) FHA, FSA/RHS & VA B) Conventional C) Refinancings D) Home Improvement Loans E) Loans on Dwellings For 5+ Families F) Non-occupant Loans on Number Average Value Number Average Value Number Average Value Number Average Value Number Average Value Number Average Value
LOANS ORIGINATED 4 $75,268 67 $64,764 111 $71,363 16 $21,001 1 $101,700 22 $41,165 APPLICATIONS APPROVED, NOT ACCEPTED 0 $0 5 $42,692 23 $90,323 1 $7,970 0 $0 0 $0 APPLICATIONS DENIED 0 $0 20 $49,672 51 $70,711 6 $15,148 0 $0 2 $37,940 APPLICATIONS WITHDRAWN 0 $0 4 $54,938 26 $83,632 1 $50,470 0 $0 1 $68,880 FILES CLOSED FOR INCOMPLETENESS 0 $0 1 $113,970 18 $73,896 0 $0 0 $0 0 $0
Aggregated Statistics For Year 2001(Based on 2 partial tracts) A) FHA, FSA/RHS & VA B) Conventional C) Refinancings D) Home Improvement Loans F) Non-occupant Loans on Number Average Value Number Average Value Number Average Value Number Average Value Number Average Value
LOANS ORIGINATED 6 $66,257 77 $58,487 96 $562,347 32 $15,833 25 $1,918,052 APPLICATIONS APPROVED, NOT ACCEPTED 0 $0 6 $27,747 6 $85,658 2 $17,325 0 $0 APPLICATIONS DENIED 1 $32,830 20 $43,558 44 $66,365 6 $25,753 3 $45,887 APPLICATIONS WITHDRAWN 1 $66,600 8 $62,040 23 $68,262 2 $11,300 1 $35,640 FILES CLOSED FOR INCOMPLETENESS 0 $0 2 $64,975 4 $65,172 0 $0 0 $0
Aggregated Statistics For Year 2000(Based on 2 partial tracts) A) FHA, FSA/RHS & VA B) Conventional C) Refinancings D) Home Improvement Loans F) Non-occupant Loans on Number Average Value Number Average Value Number Average Value Number Average Value Number Average Value
LOANS ORIGINATED 7 $66,100 72 $59,673 55 $59,146 34 $9,933 19 $42,372 APPLICATIONS APPROVED, NOT ACCEPTED 5 $44,564 11 $46,004 6 $74,960 1 $6,960 1 $38,930 APPLICATIONS DENIED 1 $135,540 35 $41,453 41 $59,697 7 $7,293 2 $206,695 APPLICATIONS WITHDRAWN 2 $49,660 3 $50,753 12 $50,847 0 $0 0 $0 FILES CLOSED FOR INCOMPLETENESS 1 $27,870 6 $60,040 9 $48,281 0 $0 0 $0
Aggregated Statistics For Year 1999(Based on 2 partial tracts) A) FHA, FSA/RHS & VA B) Conventional C) Refinancings D) Home Improvement Loans E) Loans on Dwellings For 5+ Families F) Non-occupant Loans on Number Average Value Number Average Value Number Average Value Number Average Value Number Average Value Number Average Value
LOANS ORIGINATED 6 $64,720 111 $67,007 106 $63,517 47 $15,627 1 $314,290 28 $45,662 APPLICATIONS APPROVED, NOT ACCEPTED 0 $0 11 $40,324 7 $45,406 2 $6,430 0 $0 0 $0 APPLICATIONS DENIED 1 $70,950 61 $40,011 48 $53,184 13 $7,950 0 $0 3 $15,617 APPLICATIONS WITHDRAWN 2 $85,120 13 $59,835 25 $65,441 3 $5,437 0 $0 1 $39,050 FILES CLOSED FOR INCOMPLETENESS 0 $0 4 $67,765 16 $58,132 0 $0 0 $0 0 $0
Detailed HMDA statistics for the following Tracts:
0205.00
, 0206.00
Private Mortgage Insurance Companies Aggregated Statistics For Year 2009(Based on 2 partial tracts) A) Conventional B) Refinancings Number Average Value Number Average Value
LOANS ORIGINATED 3 $158,990 2 $156,080 APPLICATIONS APPROVED, NOT ACCEPTED 0 $0 0 $0 APPLICATIONS DENIED 0 $0 3 $158,303 APPLICATIONS WITHDRAWN 0 $0 0 $0 FILES CLOSED FOR INCOMPLETENESS 0 $0 0 $0
Aggregated Statistics For Year 2008(Based on 2 partial tracts) A) Conventional B) Refinancings C) Non-occupant Loans on Number Average Value Number Average Value Number Average Value
LOANS ORIGINATED 11 $115,093 5 $171,442 2 $89,150 APPLICATIONS APPROVED, NOT ACCEPTED 5 $86,720 3 $120,377 0 $0 APPLICATIONS DENIED 0 $0 1 $188,380 0 $0 APPLICATIONS WITHDRAWN 0 $0 0 $0 0 $0 FILES CLOSED FOR INCOMPLETENESS 0 $0 0 $0 0 $0
Aggregated Statistics For Year 2007(Based on 2 partial tracts) A) Conventional B) Refinancings C) Non-occupant Loans on Number Average Value Number Average Value Number Average Value
LOANS ORIGINATED 41 $95,376 12 $131,850 3 $80,360 APPLICATIONS APPROVED, NOT ACCEPTED 4 $80,995 4 $168,982 0 $0 APPLICATIONS DENIED 0 $0 0 $0 0 $0 APPLICATIONS WITHDRAWN 0 $0 1 $182,910 0 $0 FILES CLOSED FOR INCOMPLETENESS 0 $0 0 $0 0 $0
Aggregated Statistics For Year 2006(Based on 2 partial tracts) A) Conventional B) Refinancings C) Non-occupant Loans on Number Average Value Number Average Value Number Average Value
LOANS ORIGINATED 40 $82,828 6 $101,738 2 $70,160 APPLICATIONS APPROVED, NOT ACCEPTED 4 $102,552 2 $175,525 0 $0 APPLICATIONS DENIED 0 $0 0 $0 0 $0 APPLICATIONS WITHDRAWN 0 $0 0 $0 0 $0 FILES CLOSED FOR INCOMPLETENESS 0 $0 0 $0 0 $0
Aggregated Statistics For Year 2005(Based on 2 partial tracts) A) Conventional B) Refinancings Number Average Value Number Average Value
LOANS ORIGINATED 27 $72,046 10 $105,096 APPLICATIONS APPROVED, NOT ACCEPTED 2 $40,155 0 $0 APPLICATIONS DENIED 0 $0 0 $0 APPLICATIONS WITHDRAWN 1 $108,560 1 $164,150 FILES CLOSED FOR INCOMPLETENESS 0 $0 0 $0
Aggregated Statistics For Year 2004(Based on 2 partial tracts) A) Conventional B) Refinancings C) Non-occupant Loans on Number Average Value Number Average Value Number Average Value
LOANS ORIGINATED 18 $68,917 11 $96,434 1 $60,210 APPLICATIONS APPROVED, NOT ACCEPTED 4 $61,788 3 $118,897 0 $0 APPLICATIONS DENIED 1 $41,430 0 $0 0 $0 APPLICATIONS WITHDRAWN 1 $64,250 1 $42,180 0 $0 FILES CLOSED FOR INCOMPLETENESS 0 $0 0 $0 0 $0
Aggregated Statistics For Year 2003(Based on 2 partial tracts) A) Conventional B) Refinancings C) Non-occupant Loans on Number Average Value Number Average Value Number Average Value
LOANS ORIGINATED 24 $79,612 25 $84,970 1 $36,910 APPLICATIONS APPROVED, NOT ACCEPTED 1 $80,670 2 $98,145 0 $0 APPLICATIONS DENIED 0 $0 0 $0 0 $0 APPLICATIONS WITHDRAWN 1 $63,780 0 $0 0 $0 FILES CLOSED FOR INCOMPLETENESS 0 $0 0 $0 0 $0
Aggregated Statistics For Year 2002(Based on 2 partial tracts) A) Conventional B) Refinancings C) Non-occupant Loans on Number Average Value Number Average Value Number Average Value
LOANS ORIGINATED 15 $71,180 15 $97,395 2 $57,100 APPLICATIONS APPROVED, NOT ACCEPTED 1 $76,910 3 $134,153 0 $0 APPLICATIONS DENIED 1 $52,700 1 $39,170 2 $45,935 APPLICATIONS WITHDRAWN 1 $53,480 3 $60,863 0 $0 FILES CLOSED FOR INCOMPLETENESS 0 $0 0 $0 0 $0
Aggregated Statistics For Year 2001(Based on 2 partial tracts) A) Conventional B) Refinancings Number Average Value Number Average Value
LOANS ORIGINATED 19 $72,623 10 $78,833 APPLICATIONS APPROVED, NOT ACCEPTED 1 $37,050 1 $214,800 APPLICATIONS DENIED 0 $0 1 $52,530 APPLICATIONS WITHDRAWN 0 $0 2 $45,575 FILES CLOSED FOR INCOMPLETENESS 0 $0 0 $0
Aggregated Statistics For Year 2000(Based on 2 partial tracts) A) Conventional B) Refinancings C) Non-occupant Loans on Number Average Value Number Average Value Number Average Value
LOANS ORIGINATED 15 $65,939 5 $126,008 1 $54,360 APPLICATIONS APPROVED, NOT ACCEPTED 2 $132,580 0 $0 0 $0 APPLICATIONS DENIED 1 $215,440 1 $119,020 0 $0 APPLICATIONS WITHDRAWN 0 $0 0 $0 0 $0 FILES CLOSED FOR INCOMPLETENESS 0 $0 0 $0 0 $0
Aggregated Statistics For Year 1999(Based on 2 partial tracts) A) Conventional B) Refinancings Number Average Value Number Average Value
LOANS ORIGINATED 24 $66,048 13 $85,178 APPLICATIONS APPROVED, NOT ACCEPTED 1 $78,880 0 $0 APPLICATIONS DENIED 1 $50,480 0 $0 APPLICATIONS WITHDRAWN 0 $0 0 $0 FILES CLOSED FOR INCOMPLETENESS 0 $0 0 $0
Detailed PMIC statistics for the following Tracts:
0205.00
, 0206.00 Fire-safe hotels and motels in Tuscumbia, Alabama:
Key West Inn Tuscumbia/Muscle Shoals, 1800 Hwy 72, Tuscumbia, Alabama 35674 Phone: (205) 383-0700, Fax: (256) 383-3191
Comfort Inn And Suites, 5101 Hwy 43 S, Tuscumbia, Alabama 35674 Phone: (256) 248-0850, Fax: (256) 248-0857
Best Western Plus, 1934 Hwy 20, Tuscumbia, Alabama 35674 Phone: (256) 386-9889
Microtel Inn & Suites by Wyndham, 1852 Hwy 72 E, Tuscumbia, Alabama 35674 Phone: (256) 248-0055, Fax: (256) 248-0024
All 4 fire-safe hotels and motels in Tuscumbia, Alabama
Most common first names in Tuscumbia, AL among deceased individuals Name Count Lived (average)
James 242 70.3 years Mary 191 79.5 years William 179 72.3 years John 134 74.0 years Robert 115 73.6 years Annie 78 81.9 years Willie 76 77.6 years Charles 74 68.5 years George 58 74.4 years Thomas 56 73.2 years
Most common last names in Tuscumbia, AL among deceased individuals Last name Count Lived (average)
Smith 92 74.3 years Johnson 82 73.8 years Mitchell 67 74.5 years Byrd 57 75.6 years Thompson 57 74.3 years Davis 53 74.8 years Malone 52 74.5 years Hester 50 77.1 years King 50 76.7 years Kimbrough 50 80.1 years
Tuscumbia compared to Alabama state average:
Unemployed percentage significantly below state average. Hispanic race population percentage below state average. Foreign-born population percentage significantly below state average. Length of stay since moving in above state average. Institutionalized population percentage above state average.
#72 on the list of "Top 101 cities with the lowest percentage of workers working at home, population 5,000+"
#90 on the list of "Top 101 cities with largest percentage of males in industries: utilities (population 5,000+)"
#30 on the list of "Top 101 counties with the smallest number of children under 18 without health insurance coverage in 2000 (pop. 50,000+)"
#45 on the list of "Top 101 counties with the highest number of deaths per 1000 residents 2007-2013 (pop. 50,000+)"
#61 on the list of "Top 101 counties with the largest increase in the number of deaths per 1000 residents 2000-2006 to 2007-2013 (pop. 50,000+)"
#77 on the list of "Top 101 counties with the smallest number of people without health insurance coverage in 2000 (pop. 50,000+)"
Top Patent Applicants
Chester Darryl Moon (7)
Missy Raye Miller (2)
David M. Malone (1)
Carter W. Mcguyer (1)
Cory Copeland (1)
Missy R. Miller (1)
Carter Mcguyer (1)
Tyler James Reid (1)
Buford D. Lewis (1)
Tammy Johnson (1)
Total of 17 patent applications in 2008-2024.
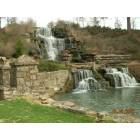
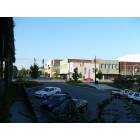
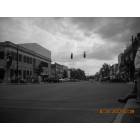
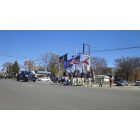
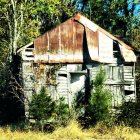

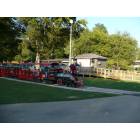
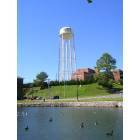

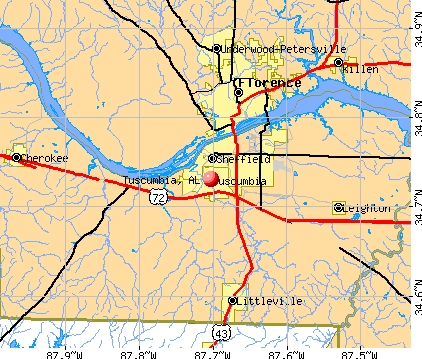


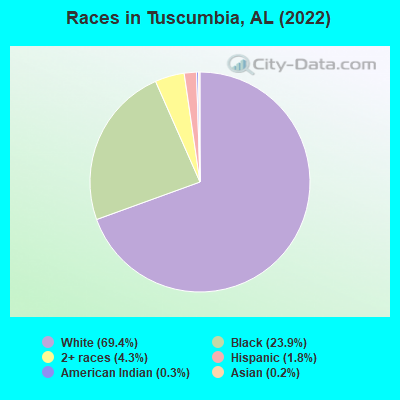

 Recent articles from our blog. Our writers, many of them Ph.D. graduates or candidates, create easy-to-read articles on a wide variety of topics.

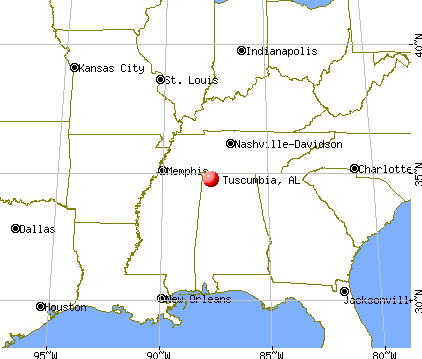
 (42.2 miles
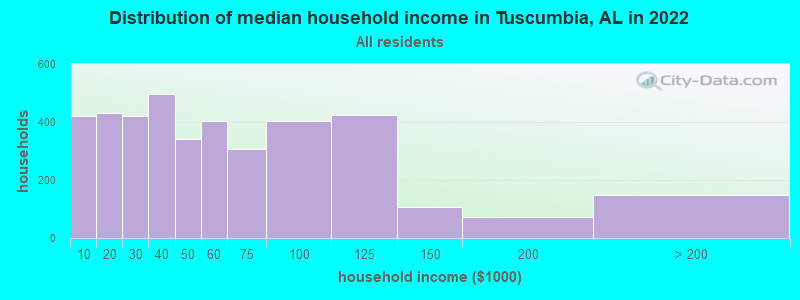
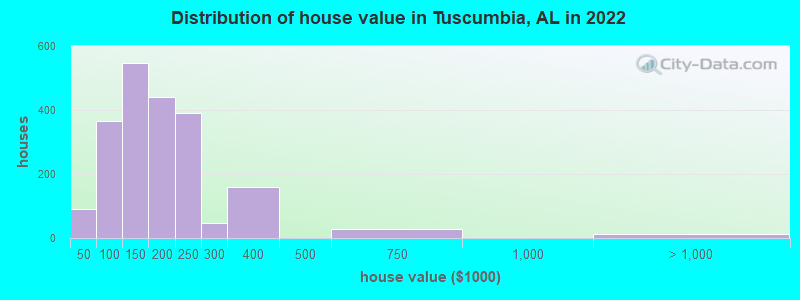

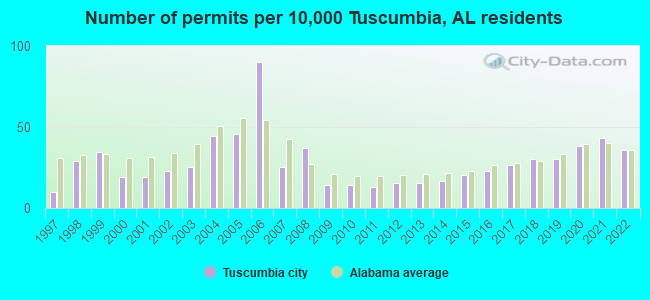
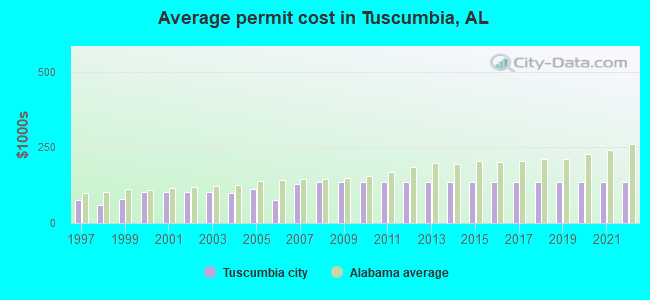
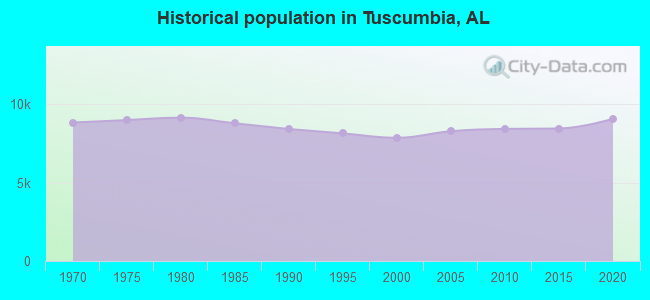
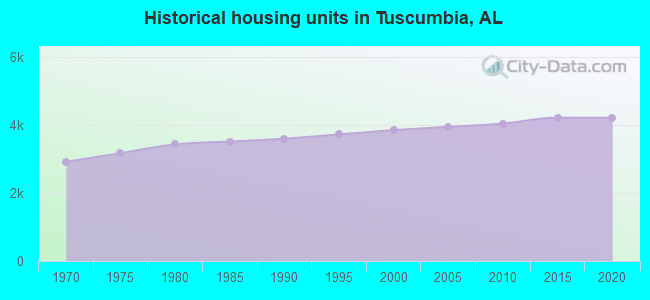
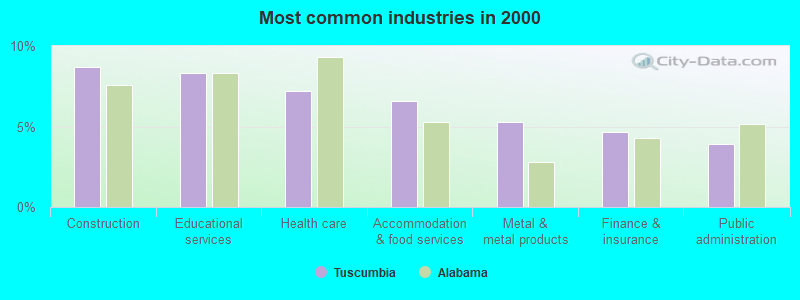

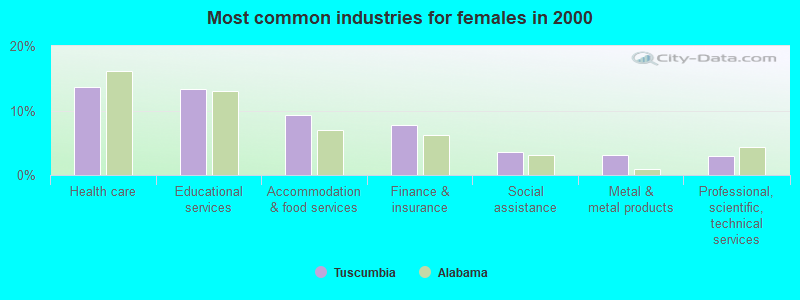
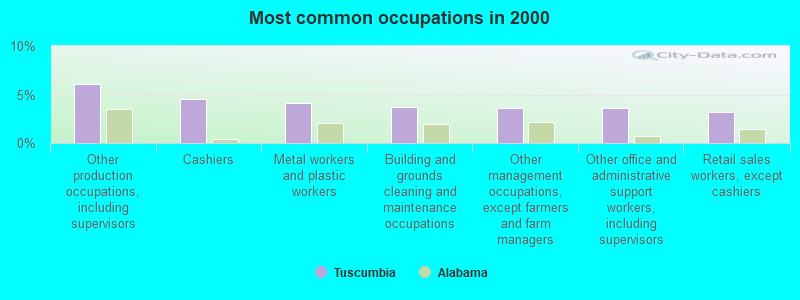
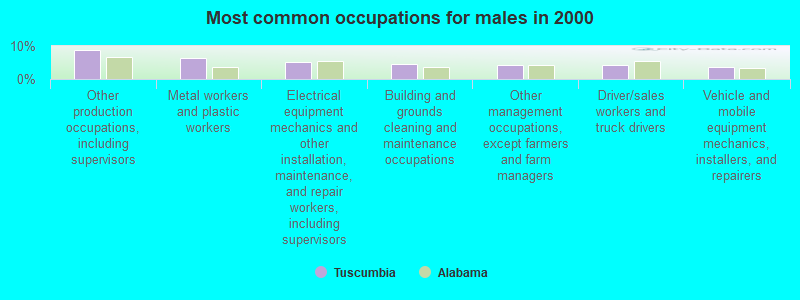
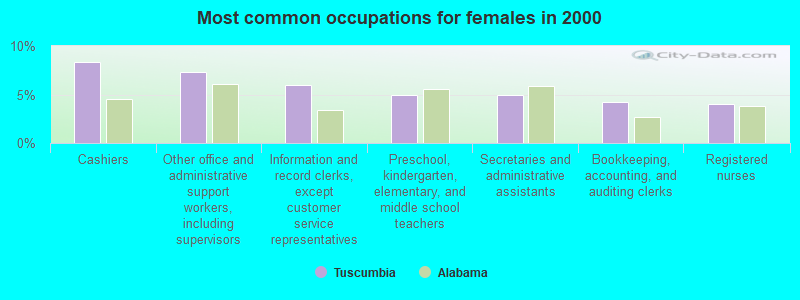
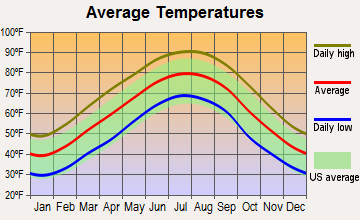
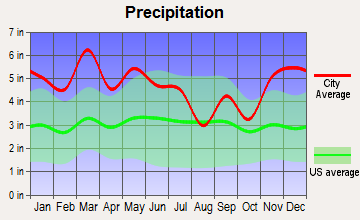
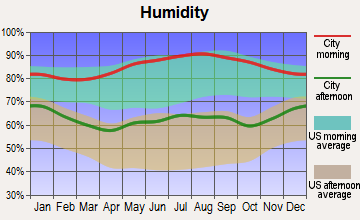

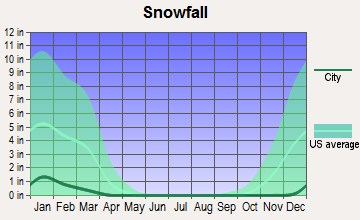
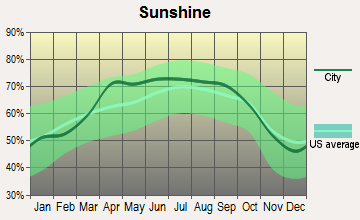
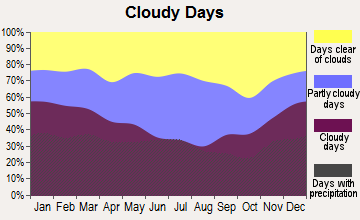
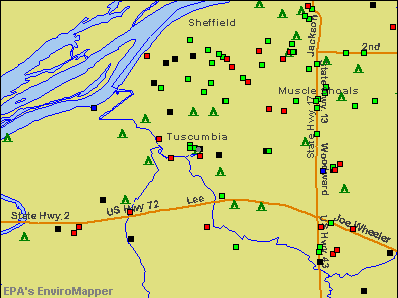

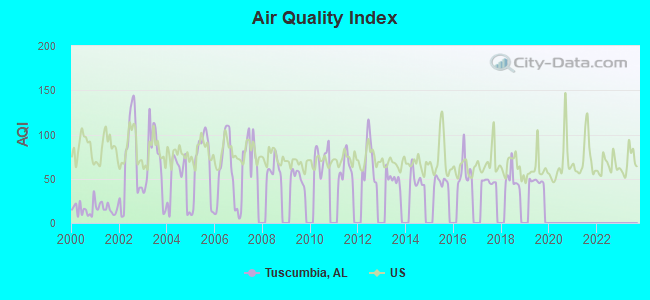
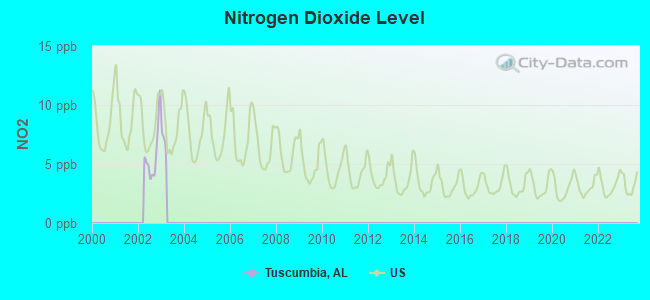
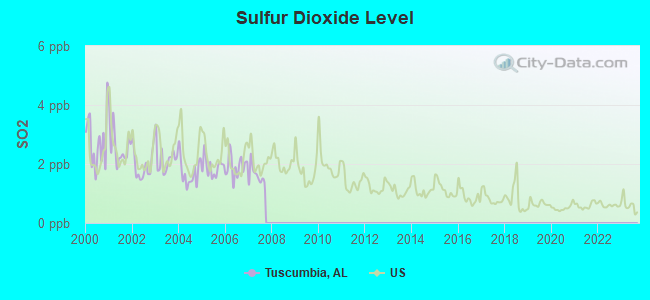
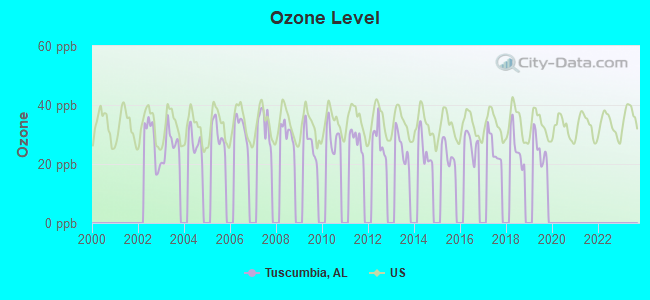
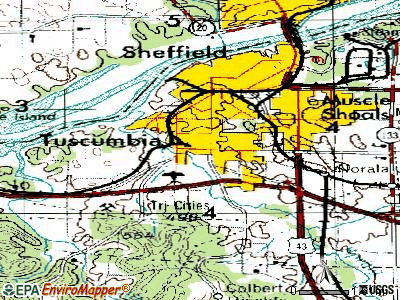
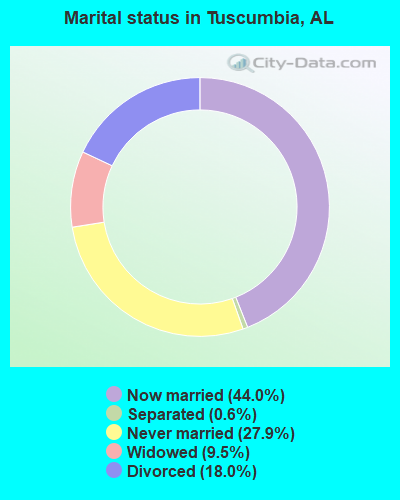
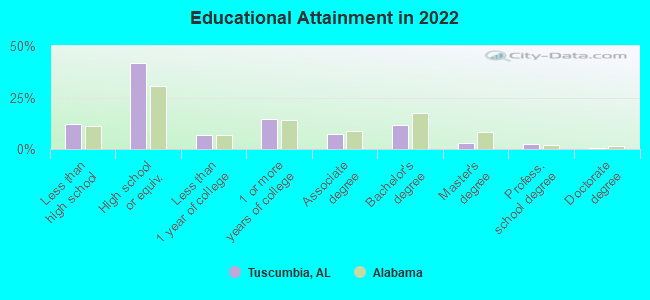
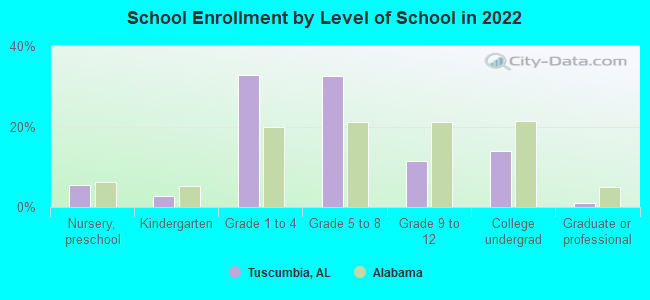
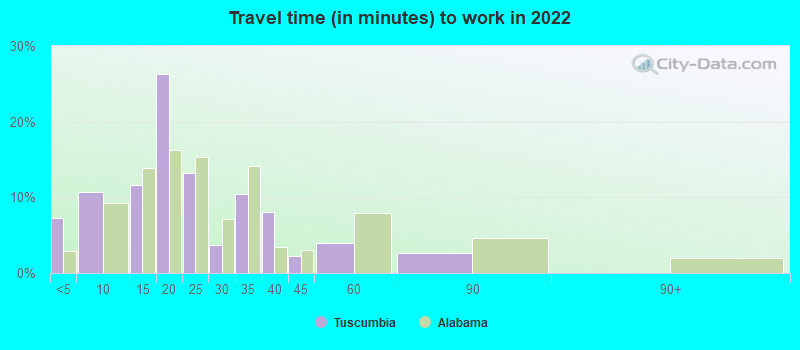
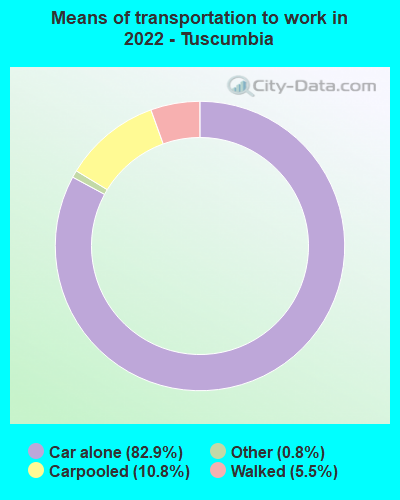
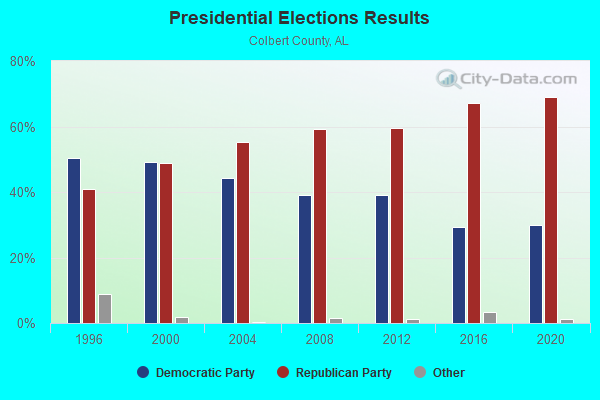
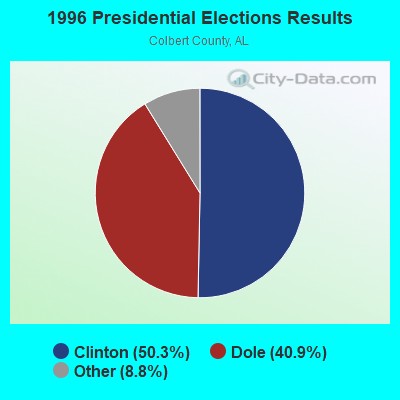
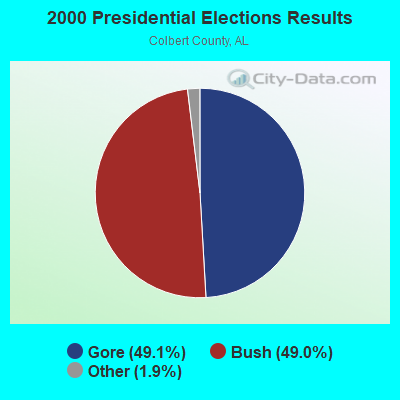
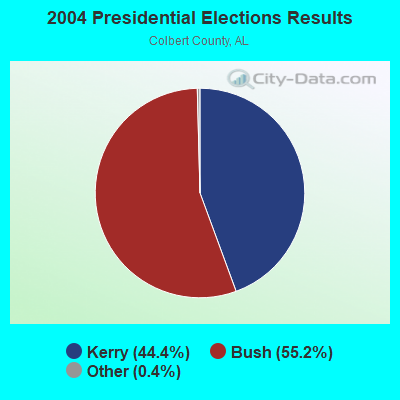
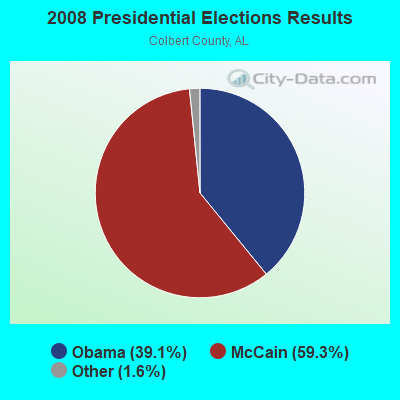
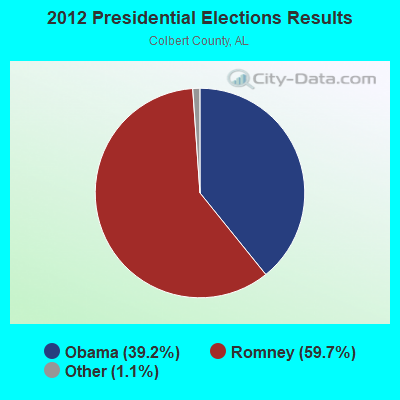
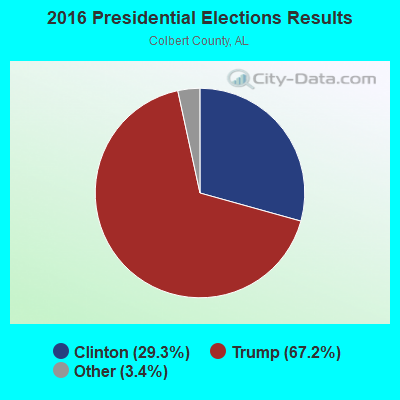
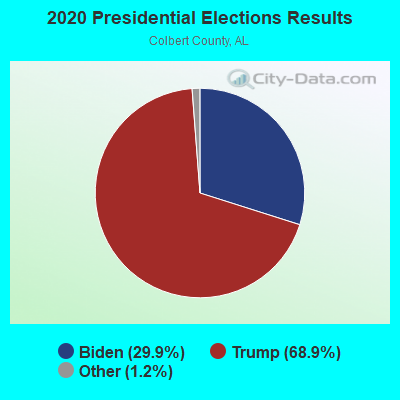
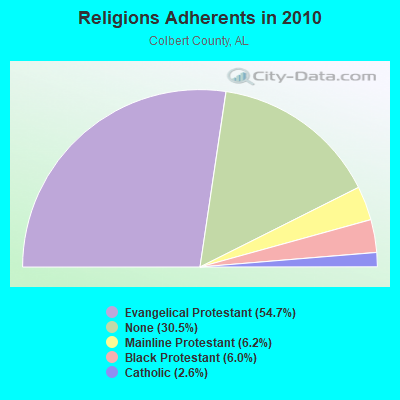

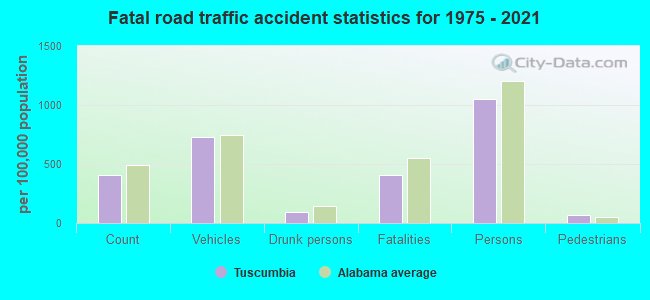

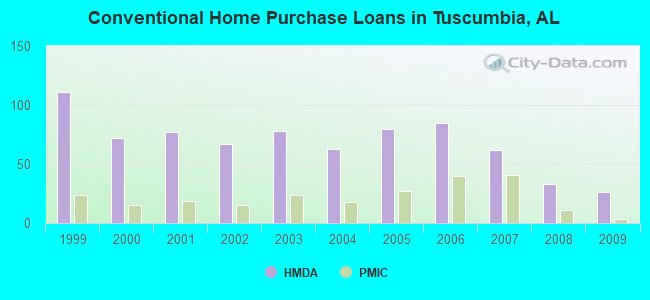
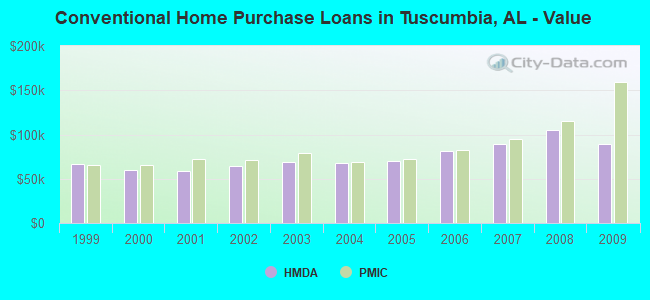
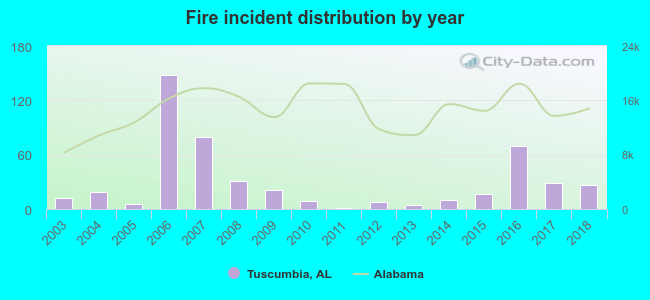 According to the data from the years 2003 - 2018 the average number of fire incidents per year is 31. The highest number of reported fire incidents - 148 took place in 2006, and the least - 1 in 2011. The data has an increasing trend.
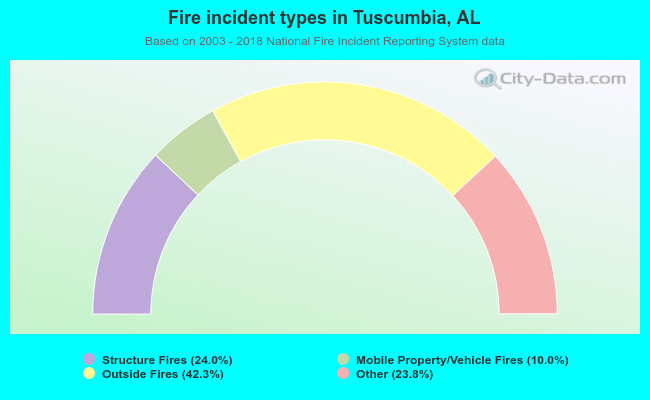 When looking into fire subcategories, the most reports belonged to: Outside Fires (42.3%), and Structure Fires (24.0%).