Westfield, Massachusetts
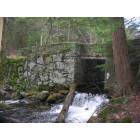
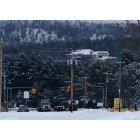
Westfield: Hidden railroad brigde from the 1800's in westfield
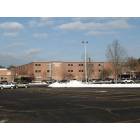
Westfield: Westfield High School

Westfield: My St. Mary Parish , Westfield MA
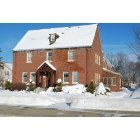
Westfield: My St. Mary Parish , Westfield MA
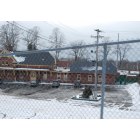
Westfield: The Great River Bridge Westfield2008
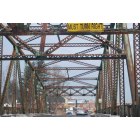
Westfield: The Great River Bridge Westfield2008
Westfield: The Great River Bridge Westfield2008
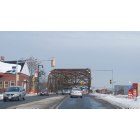
Westfield: The Great River Bridge Westfield2008

Westfield: westfieldchurch
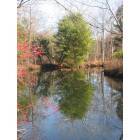
Westfield: stanley park reflecting pool
- add
your
Submit your own pictures of this city and show them to the world
- OSM Map
- General Map
- Google Map
- MSN Map
Population change since 2000: +1.2%
 |
| Males: 19,418 | |
| Females: 21,117 |
| Median resident age: | 39.2 years |
| Massachusetts median age: | 40.3 years |
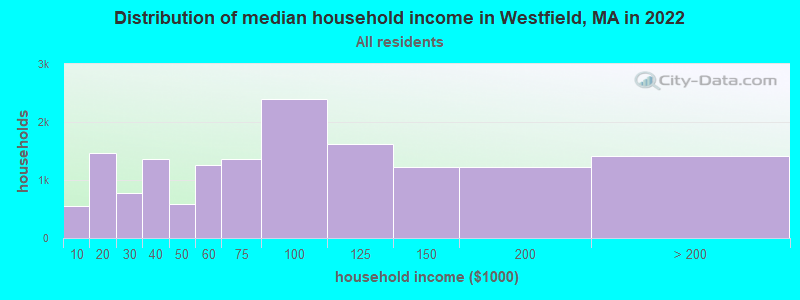
| Westfield: | $75,071 |
| MA: | $94,488 |
Estimated per capita income in 2022: $37,248 (it was $20,600 in 2000)
Westfield city income, earnings, and wages data
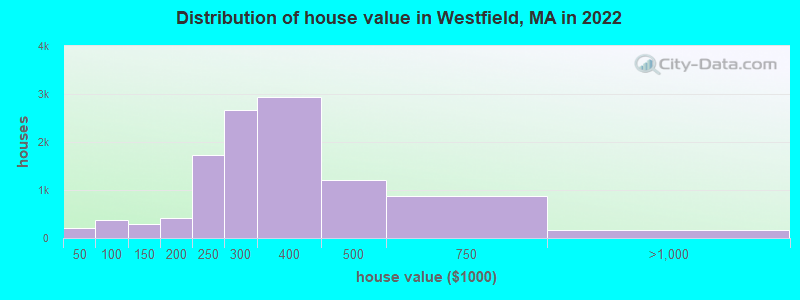
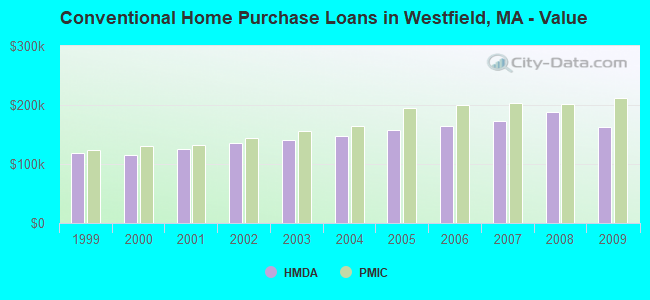
Estimated median house or condo value in 2022: $308,332 (it was $128,900 in 2000)
| Westfield: | $308,332 |
| MA: | $534,700 |
Mean prices in 2022: all housing units: $327,892; detached houses: $347,530; townhouses or other attached units: $279,233; in 2-unit structures: $276,440; in 3-to-4-unit structures: $324,359; in 5-or-more-unit structures: $140,725; mobile homes: $143,246
Median gross rent in 2022: $1,011.
(7.7% for White Non-Hispanic residents, 2.1% for Black residents, 14.3% for Hispanic or Latino residents, 21.1% for other race residents, 11.9% for two or more races residents)
Detailed information about poverty and poor residents in Westfield, MA


Compare current foreclosures near Westfield, MA:
| Photo | Address | Area | Beds / Baths | Price | Details |
|---|---|---|---|---|---|

|
#1
Montgomery St
Westfield, MA 01085
|
1,714 sq. feet
|
2 baths 4 beds |
show details | |

|
#2
Washington St
Westfield, MA 01085
|
1,300 sq. feet
|
2 baths 3 beds |
show details | |

|
#3
Court St
Westfield, MA 01085
|
1,224 sq. feet
|
1 baths 3 beds |
show details | |

|
#4
Jefferson St # 1
Westfield, MA 01085
|
3,063 sq. feet
|
2 baths 6 beds |
show details | |

|
#5
Granville Rd
Westfield, MA 01085
|
3,159 sq. feet
|
1 baths 3 beds |
show details | |

|
#6
Paper Mill Rd
Westfield, MA 01085
|
1,056 sq. feet
|
1 baths 3 beds |
show details | |

|
#7
Berkshire Dr
Westfield, MA 01085
|
1,080 sq. feet
|
1 baths 2 beds |
show details | |

|
#8
E Mountain Rd
Westfield, MA 01085
|
1,188 sq. feet
|
1 baths 3 beds |
show details | |

|
#9
Oakcrest Dr
Westfield, MA 01085
|
2,751 sq. feet
|
3 baths 3 beds |
show details | |

|
#10
Meadow St
Westfield, MA 01085
|
2,050 sq. feet
|
2 baths 6 beds |
show details |
| Photo | Address | Area | Beds / Baths | Price | Details |
|---|---|---|---|---|---|

|
#11
Beveridge Blvd
Westfield, MA 01085
|
1,176 sq. feet
|
1 baths 2 beds |
show details | |

|
#12
Vine St
Westfield, MA 01085
|
1,152 sq. feet
|
1 baths 2 beds |
show details | |

|
#13
Hopkins Rd
Westfield, MA 01085
|
1,404 sq. feet
|
2 baths 3 beds |
show details | |

|
#14
Madison St
Westfield, MA 01085
|
2,369 sq. feet
|
2 baths 4 beds |
show details | |

|
#15
City View Blvd
Westfield, MA 01085
|
1,061 sq. feet
|
1 baths 4 beds |
show details | |

|
#16
Plum St
Westfield, MA 01085
|
1,440 sq. feet
|
1 baths 3 beds |
show details | |

|
#17
Western Cir
Westfield, MA 01085
|
1,710 sq. feet
|
2 baths 3 beds |
show details | |

|
#18
Cleveland Ave
Westfield, MA 01085
|
3,729 sq. feet
|
2 baths 6 beds |
show details | |

|
#19
Court St
Westfield, MA 01085
|
2,652 sq. feet
|
2 baths 5 beds |
show details | |

|
#20
Main St Unit 13
Westfield, MA 01085
|
1,250 sq. feet
|
1 baths 2 beds |
show details |
| Photo | Address | Area | Beds / Baths | Price | Details |
|---|---|---|---|---|---|

|
#21
Hancock St
Westfield, MA 01085
|
1,448 sq. feet
|
1 baths 3 beds |
show details | |

|
#22
Russell Rd Apt 2c
Westfield, MA 01085
|
- sq. feet
|
- baths - beds |
show details | |

|
#23
Stoney Ln
Westfield, MA 01085
|
- sq. feet
|
- baths - beds |
show details | |

|
#24
Blue Sky Dr
Westfield, MA 01085
|
- sq. feet
|
- baths - beds |
show details | |

|
#25
Pleasant St Apt D
Westfield, MA 01085
|
- sq. feet
|
- baths - beds |
show details | |

|
#26
Russell Rd Apt C-13
Westfield, MA 01085
|
- sq. feet
|
- baths - beds |
show details | |

|
#27
Lockhouse Rd Apt 4-1
Westfield, MA 01085
|
- sq. feet
|
- baths - beds |
show details | |

|
#28
Daytona St
Springfield, MA 01108
|
1,825 sq. feet
|
2 baths 6 beds |
$166,400
|
show details |

|
#29
W Franklin St
Holyoke, MA 01040
|
1,558 sq. feet
|
1 baths 2 beds |
$234,900
|
show details |

|
#30
Walnut Street
Springfield, MA 01105
|
2,850 sq. feet
|
2 baths 6 beds |
$110,000
|
show details |
| Photo | Address | Area | Beds / Baths | Price | Details |
|---|---|---|---|---|---|

|
#31
Cold Spring Rd
Southampton, MA 01073
|
2,736 sq. feet
|
1 baths 3 beds |
$284,900
|
show details |

|
#32
Jondot Dr
Enfield, CT 06082
|
1,385 sq. feet
|
1 baths 3 beds |
$299,900
|
show details |

|
#33
Sanford Ave
Enfield, CT 06082
|
21 sq. feet
|
1 baths 4 beds |
$225,000
|
show details |

|
#34
Newman St
Springfield, MA 01105
|
1,676 sq. feet
|
2 baths 3 beds |
$45,900
|
show details |

|
#35
Holland Dr
East Longmeadow, MA 01028
|
1,424 sq. feet
|
1 baths 2 beds |
show details | |

|
#36
Worthy Ave
West Springfield, MA 01089
|
1,501 sq. feet
|
1 baths 3 beds |
show details | |

|
#37
Catherine St
Chicopee, MA 01013
|
1,073 sq. feet
|
1 baths 2 beds |
show details | |

|
#38
Glendale Cir
Windsor Locks, CT 06096
|
1,277 sq. feet
|
1 baths 2 beds |
show details | |

|
#39
Ontario St
Springfield, MA 01104
|
1,260 sq. feet
|
1 baths 3 beds |
show details | |

|
#40
Fountain St
Springfield, MA 01108
|
1,540 sq. feet
|
1 baths 3 beds |
show details |
| Photo | Address | Area | Beds / Baths | Price | Details |
|---|---|---|---|---|---|

|
#41
Stuart St
Springfield, MA 01119
|
864 sq. feet
|
1 baths 3 beds |
show details | |

|
#42
Royal St
Chicopee, MA 01020
|
3,296 sq. feet
|
4 baths 7 beds |
show details | |

|
#43
Newbury St
Springfield, MA 01104
|
1,308 sq. feet
|
1 baths 3 beds |
show details | |

|
#44
Lewandowski Ave
Easthampton, MA 01027
|
1,056 sq. feet
|
1 baths 3 beds |
show details | |

|
#45
Fieldston St
Springfield, MA 01119
|
848 sq. feet
|
1 baths 1 beds |
show details | |

|
#46
Mathewson Ave
Enfield, CT 06082
|
1,666 sq. feet
|
2 baths 4 beds |
show details | |

|
#47
Putnam St
Springfield, MA 01109
|
2,017 sq. feet
|
2 baths 4 beds |
show details | |

|
#48
Derryfield Ave
Springfield, MA 01118
|
1,188 sq. feet
|
1 baths 3 beds |
show details | |

|
#49
Arthur St
Springfield, MA 01104
|
823 sq. feet
|
1 baths 2 beds |
show details | |

|
Check over 1 million property listings on Foreclosure.com!
|
browse all offers | |||


- 32,16479.5%White alone
- 4,33010.7%Hispanic
- 1,6964.2%Asian alone
- 1,1072.7%Two or more races
- 5421.3%Black alone
- 740.2%Other race alone
- 40.01%American Indian alone
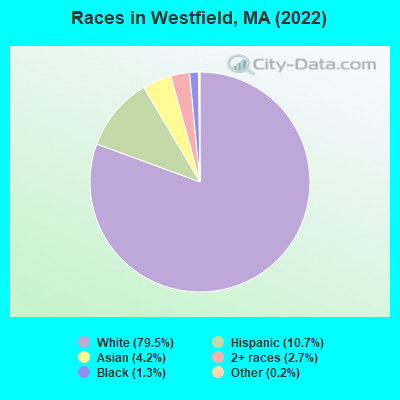
Races in Westfield detailed stats: ancestries, foreign born residents, place of birth
According to our research of Massachusetts and other state lists, there were 19 registered sex offenders living in Westfield, Massachusetts as of April 27, 2024.
The ratio of all residents to sex offenders in Westfield is 2,185 to 1.
The ratio of registered sex offenders to all residents in this city is lower than the state average.
Type |
2009 |
2010 |
2011 |
2012 |
2013 |
2014 |
2015 |
2016 |
2017 |
2018 |
2019 |
2020 |
2021 |
2022 |
|---|---|---|---|---|---|---|---|---|---|---|---|---|---|---|
| Murders (per 100,000) | 0 (0.0) | 1 (2.4) | 0 (0.0) | 0 (0.0) | 1 (2.4) | 0 (0.0) | 0 (0.0) | 0 (0.0) | 0 (0.0) | 0 (0.0) | 3 (7.2) | 0 (0.0) | 0 (0.0) | 0 (0.0) |
| Rapes (per 100,000) | 20 (48.2) | 11 (26.8) | 16 (38.7) | 8 (19.3) | 20 (48.2) | 13 (31.4) | 21 (50.3) | 17 (40.8) | 22 (52.7) | 16 (38.2) | 15 (36.1) | 23 (56.0) | 16 (38.6) | 18 (44.2) |
| Robberies (per 100,000) | 15 (36.2) | 8 (19.5) | 10 (24.2) | 14 (33.7) | 25 (60.3) | 11 (26.6) | 11 (26.4) | 10 (24.0) | 15 (35.9) | 8 (19.1) | 7 (16.9) | 3 (7.3) | 5 (12.1) | 5 (12.3) |
| Assaults (per 100,000) | 56 (135.0) | 75 (182.5) | 67 (162.1) | 54 (130.2) | 58 (139.8) | 62 (149.9) | 48 (115.0) | 66 (158.3) | 71 (170.1) | 87 (207.9) | 58 (139.7) | 57 (138.8) | 70 (168.8) | 69 (169.6) |
| Burglaries (per 100,000) | 157 (378.6) | 194 (472.1) | 144 (348.3) | 201 (484.5) | 175 (421.8) | 107 (258.8) | 107 (256.4) | 116 (278.2) | 97 (232.4) | 78 (186.4) | 52 (125.3) | 46 (112.0) | 50 (120.6) | 30 (73.7) |
| Thefts (per 100,000) | 496 (1,196) | 577 (1,404) | 537 (1,299) | 551 (1,328) | 466 (1,123) | 409 (989.2) | 451 (1,081) | 414 (992.8) | 432 (1,035) | 362 (864.9) | 326 (785.4) | 263 (640.3) | 266 (641.4) | 291 (715.1) |
| Auto thefts (per 100,000) | 40 (96.4) | 39 (94.9) | 22 (53.2) | 18 (43.4) | 23 (55.4) | 16 (38.7) | 26 (62.3) | 20 (48.0) | 31 (74.3) | 24 (57.3) | 21 (50.6) | 16 (39.0) | 33 (79.6) | 43 (105.7) |
| Arson (per 100,000) | 3 (7.2) | 4 (9.7) | 5 (12.1) | 2 (4.8) | 3 (7.2) | 7 (16.9) | 2 (4.8) | 5 (12.0) | 3 (7.2) | 2 (4.8) | 1 (2.4) | 3 (7.3) | 2 (4.8) | 2 (4.9) |
| City-Data.com crime index | 158.5 | 165.4 | 151.2 | 142.1 | 168.3 | 123.9 | 137.3 | 134.5 | 150.6 | 130.1 | 120.6 | 111.3 | 108.7 | 115.2 |
The City-Data.com crime index weighs serious crimes and violent crimes more heavily. Higher means more crime, U.S. average is 246.1. It adjusts for the number of visitors and daily workers commuting into cities.
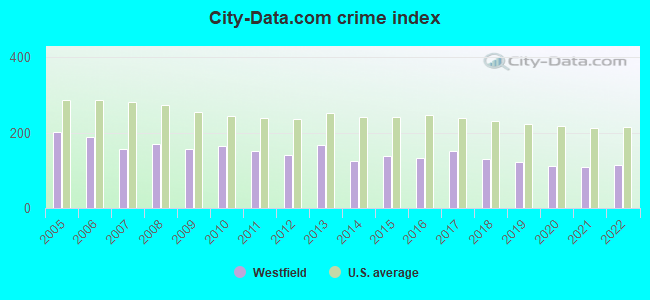
Crime rate in Westfield detailed stats: murders, rapes, robberies, assaults, burglaries, thefts, arson
Full-time law enforcement employees in 2021, including police officers: 88 (84 officers - 81 male; 3 female).
| Officers per 1,000 residents here: | 2.03 |
| Massachusetts average: | 2.53 |
 Recent articles from our blog. Our writers, many of them Ph.D. graduates or candidates, create easy-to-read articles on a wide variety of topics.

 | 2023 Real Estate Observations (5278 replies) |
| Oklahoma to (likely Western) Massachusetts - Beginning Research (274 replies) |
| 1 day trip across MA - what route for iconic scenery? (43 replies) |
| Central or Western MA towns for Seniors (16 replies) |
| Hmmmm.why hasn't Boston faced the awful "doom loop" San Francisco has post pandemic? (18 replies) |
| Best Massachusetts CITIES for a family (44 replies) |
Latest news from Westfield, MA collected exclusively by city-data.com from local newspapers, TV, and radio stations
Ancestries: American (13.6%), Irish (10.9%), Polish (8.5%), Russian (6.3%), Italian (5.5%), Ukrainian (5.2%).
Current Local Time: EST time zone
Elevation: 140 feet
Land area: 46.6 square miles.
Population density: 870 people per square mile (low).
4,648 residents are foreign born (5.9% Europe, 3.9% Asia).
| This city: | 11.5% |
| Massachusetts: | 17.6% |
Median real estate property taxes paid for housing units with mortgages in 2022: $4,785 (1.5%)
Median real estate property taxes paid for housing units with no mortgage in 2022: $4,627 (1.5%)
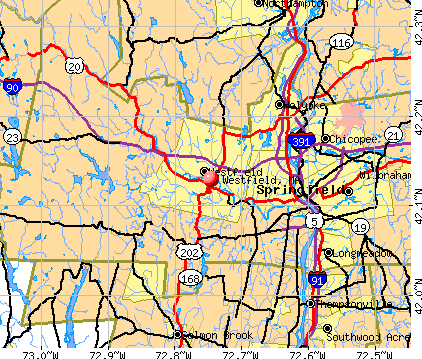
Nearest city with pop. 50,000+: Chicopee, MA  (8.5 miles , pop. 54,653).
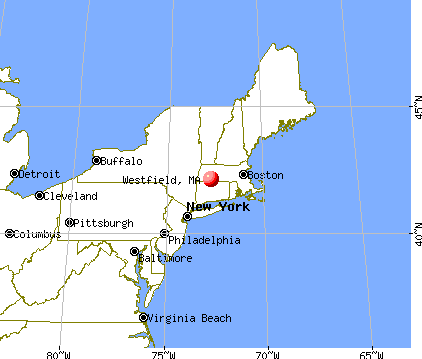
Nearest city with pop. 200,000+: Boston, MA (85.9 miles , pop. 589,141).
Nearest city with pop. 1,000,000+: Bronx, NY (106.2 miles , pop. 1,332,650).
Nearest cities:
), ), ), ), )Latitude: 42.13 N, Longitude: 72.75 W
Daytime population change due to commuting: +1,154 (+2.9%)
Workers who live and work in this city: 7,435 (39.7%)
Area code: 413
Westfield, Massachusetts accommodation & food services, waste management - Economy and Business Data
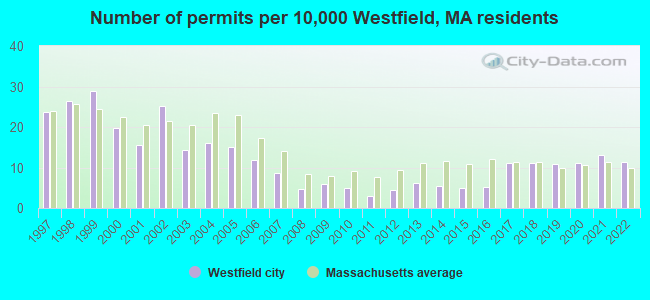
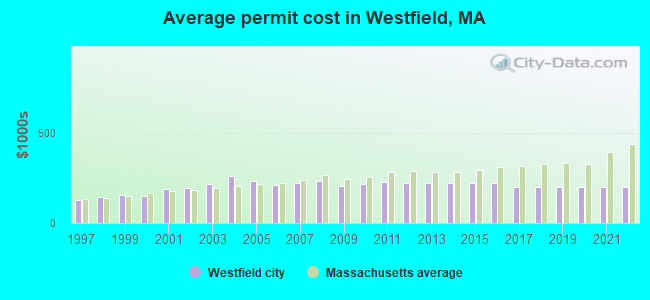
Single-family new house construction building permits:
- 2022: 46 buildings, average cost: $196,900
- 2021: 52 buildings, average cost: $196,900
- 2020: 45 buildings, average cost: $196,900
- 2019: 44 buildings, average cost: $196,900
- 2018: 45 buildings, average cost: $196,900
- 2017: 45 buildings, average cost: $196,900
- 2016: 21 buildings, average cost: $220,300
- 2015: 20 buildings, average cost: $220,300
- 2014: 22 buildings, average cost: $220,300
- 2013: 25 buildings, average cost: $220,600
- 2012: 18 buildings, average cost: $218,800
- 2011: 12 buildings, average cost: $223,700
- 2010: 20 buildings, average cost: $217,500
- 2009: 24 buildings, average cost: $207,200
- 2008: 19 buildings, average cost: $230,300
- 2007: 35 buildings, average cost: $218,900
- 2006: 47 buildings, average cost: $211,200
- 2005: 60 buildings, average cost: $233,700
- 2004: 64 buildings, average cost: $258,500
- 2003: 57 buildings, average cost: $213,500
- 2002: 101 buildings, average cost: $191,200
- 2001: 62 buildings, average cost: $189,800
- 2000: 79 buildings, average cost: $151,600
- 1999: 116 buildings, average cost: $153,300
- 1998: 106 buildings, average cost: $141,500
- 1997: 95 buildings, average cost: $128,500
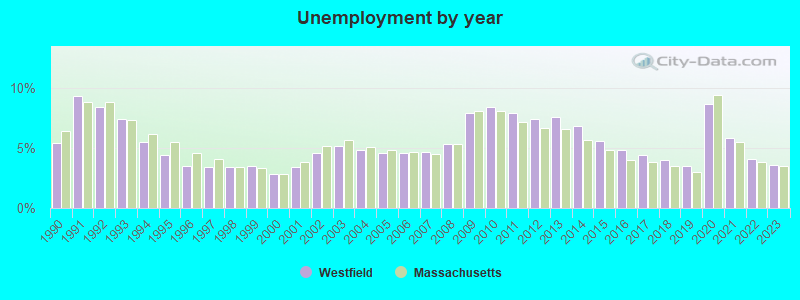
| Here: | 3.6% |
| Massachusetts: | 3.5% |
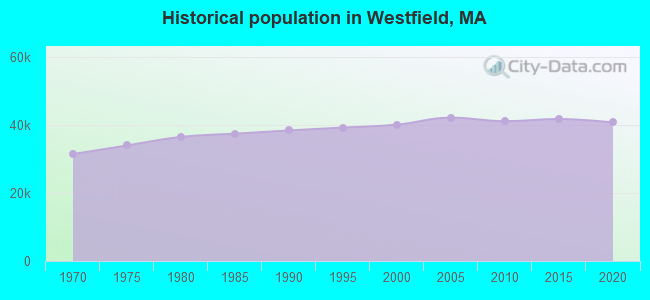
Population change in the 1990s: +1,583 (+4.1%).
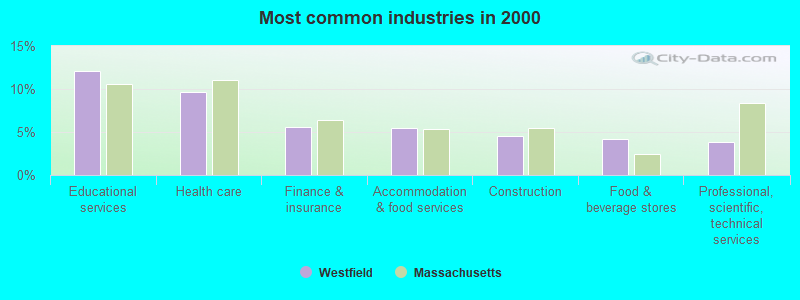
- Educational services (12.2%)
- Health care (9.6%)
- Finance & insurance (5.5%)
- Accommodation & food services (5.5%)
- Construction (4.5%)
- Food & beverage stores (4.1%)
- Professional, scientific, technical services (3.8%)
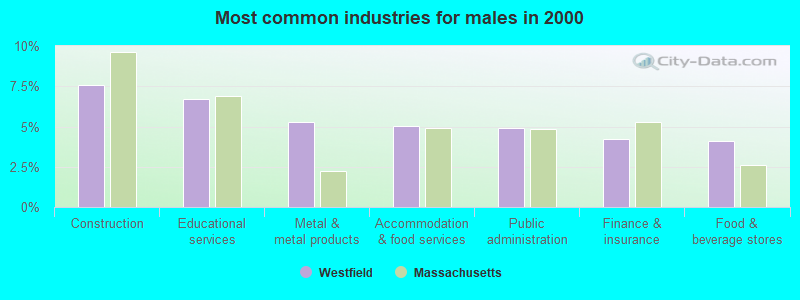
- Construction (7.6%)
- Educational services (6.7%)
- Metal & metal products (5.3%)
- Accommodation & food services (5.0%)
- Public administration (4.9%)
- Finance & insurance (4.2%)
- Food & beverage stores (4.1%)
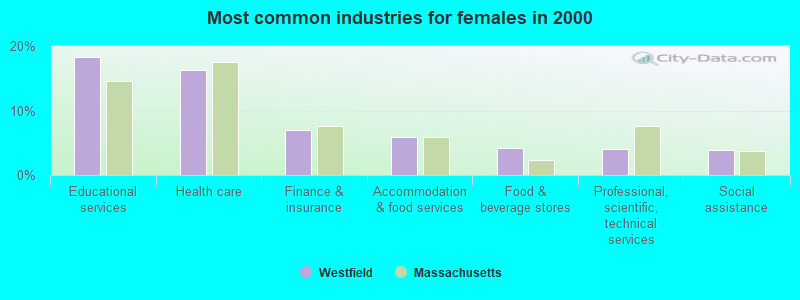
- Educational services (18.3%)
- Health care (16.3%)
- Finance & insurance (7.0%)
- Accommodation & food services (5.9%)
- Food & beverage stores (4.2%)
- Professional, scientific, technical services (4.0%)
- Social assistance (3.9%)
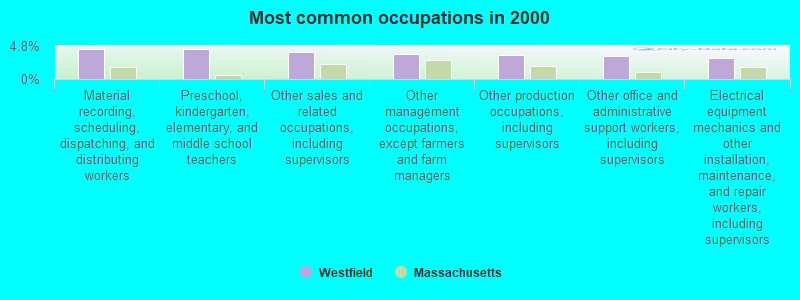
- Material recording, scheduling, dispatching, and distributing workers (4.4%)
- Preschool, kindergarten, elementary, and middle school teachers (4.3%)
- Other sales and related occupations, including supervisors (3.9%)
- Other management occupations, except farmers and farm managers (3.6%)
- Other production occupations, including supervisors (3.5%)
- Other office and administrative support workers, including supervisors (3.3%)
- Electrical equipment mechanics and other installation, maintenance, and repair workers, including supervisors (3.0%)
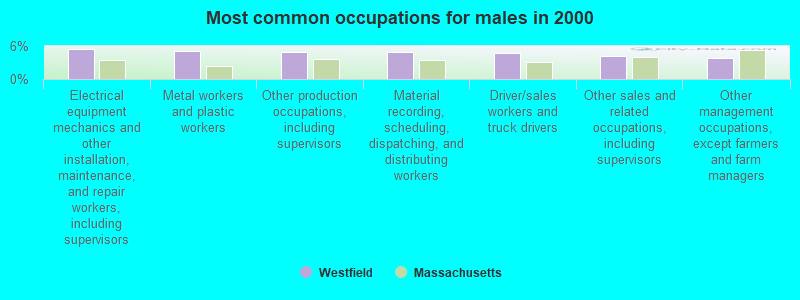
- Electrical equipment mechanics and other installation, maintenance, and repair workers, including supervisors (5.5%)
- Metal workers and plastic workers (5.1%)
- Other production occupations, including supervisors (4.9%)
- Material recording, scheduling, dispatching, and distributing workers (4.8%)
- Driver/sales workers and truck drivers (4.8%)
- Other sales and related occupations, including supervisors (4.1%)
- Other management occupations, except farmers and farm managers (3.9%)
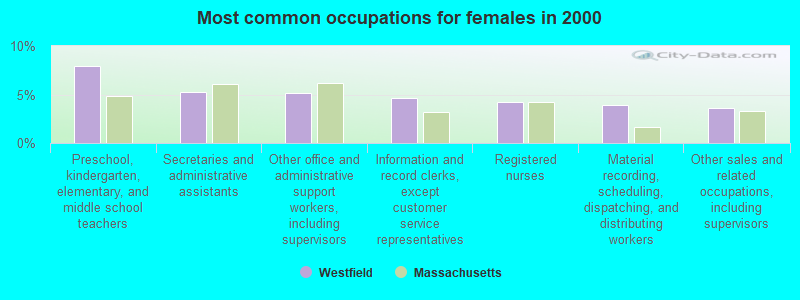
- Preschool, kindergarten, elementary, and middle school teachers (8.0%)
- Secretaries and administrative assistants (5.2%)
- Other office and administrative support workers, including supervisors (5.1%)
- Information and record clerks, except customer service representatives (4.7%)
- Registered nurses (4.2%)
- Material recording, scheduling, dispatching, and distributing workers (3.9%)
- Other sales and related occupations, including supervisors (3.6%)
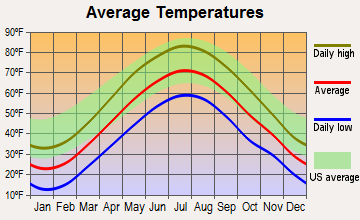
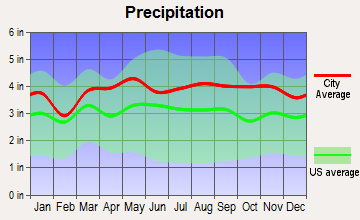
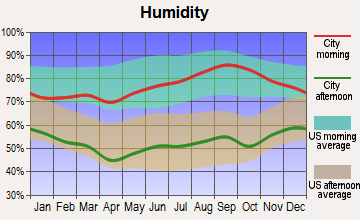
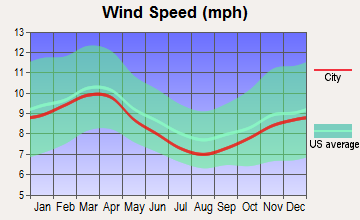
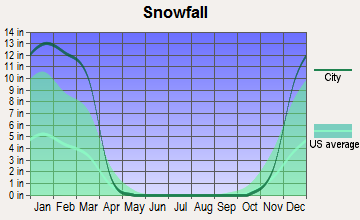
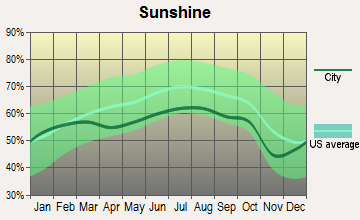
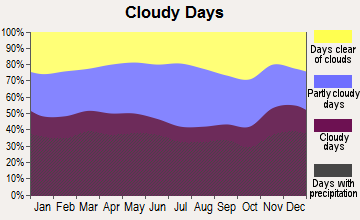
Average climate in Westfield, Massachusetts
Based on data reported by over 4,000 weather stations
|
|

(lower is better)
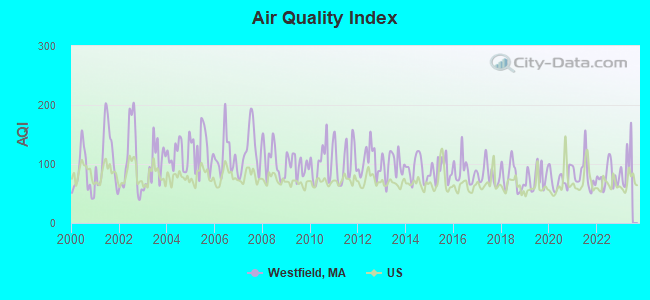
Air Quality Index (AQI) level in 2022 was 78.6. This is about average.
| City: | 78.6 |
| U.S.: | 72.6 |
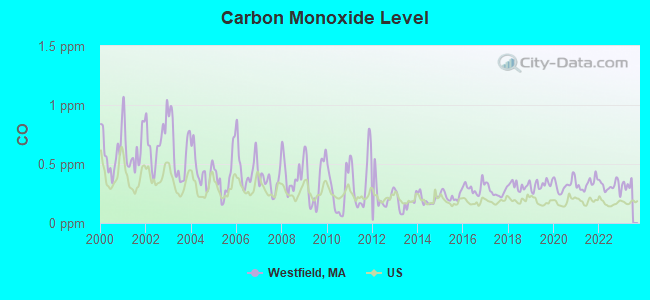
Carbon Monoxide (CO) [ppm] level in 2022 was 0.312. This is worse than average. Closest monitor was 8.1 miles away from the city center.
| City: | 0.312 |
| U.S.: | 0.251 |
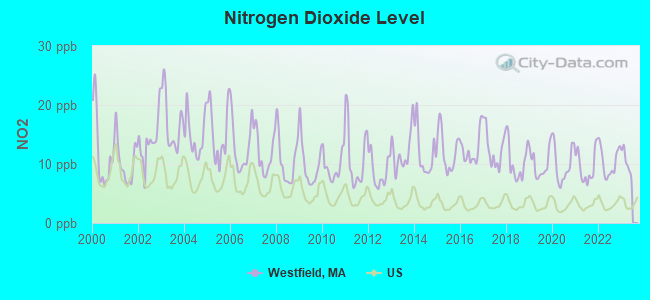
Nitrogen Dioxide (NO2) [ppb] level in 2022 was 10.4. This is significantly worse than average. Closest monitor was 5.9 miles away from the city center.
| City: | 10.4 |
| U.S.: | 5.1 |
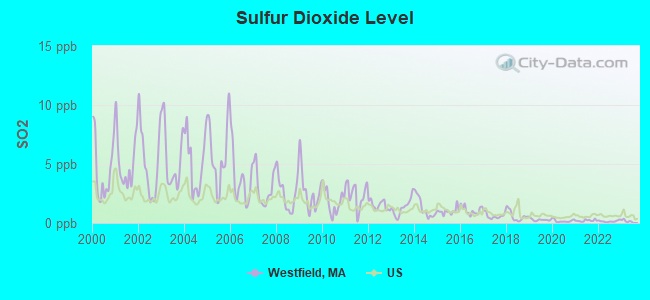
Sulfur Dioxide (SO2) [ppb] level in 2022 was 0.150. This is significantly better than average. Closest monitor was 6.9 miles away from the city center.
| City: | 0.150 |
| U.S.: | 1.515 |
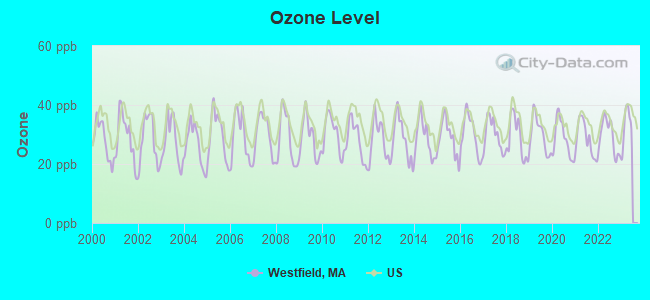
Ozone [ppb] level in 2022 was 29.3. This is about average. Closest monitor was 5.9 miles away from the city center.
| City: | 29.3 |
| U.S.: | 33.3 |
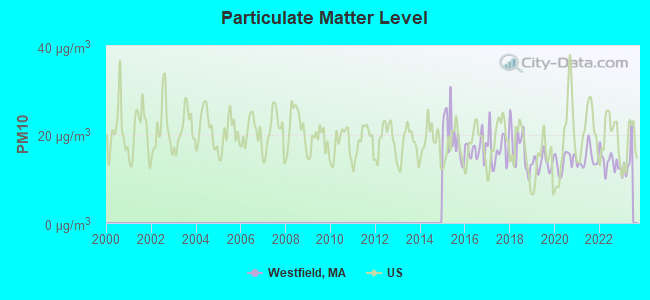
Particulate Matter (PM10) [µg/m3] level in 2022 was 13.8. This is better than average. Closest monitor was 7.8 miles away from the city center.
| City: | 13.8 |
| U.S.: | 19.2 |
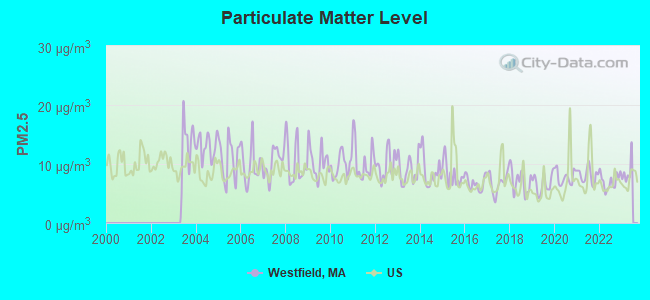
Particulate Matter (PM2.5) [µg/m3] level in 2022 was 7.09. This is about average. Closest monitor was 7.8 miles away from the city center.
| City: | 7.09 |
| U.S.: | 8.11 |
Tornado activity:
Westfield-area historical tornado activity is above Massachusetts state average. It is 9% smaller than the overall U.S. average.
On 10/3/1979, a category F4 (max. wind speeds 207-260 mph) tornado 6.0 miles away from the Westfield city center killed 3 people and injured 500 people and caused between $50,000,000 and $500,000,000 in damages.
On 5/29/1995, a category F4 tornado 21.9 miles away from the city center killed 3 people and injured 24 people and caused between $5,000,000 and $50,000,000 in damages.
Earthquake activity:
Westfield-area historical earthquake activity is significantly above Massachusetts state average. It is 70% smaller than the overall U.S. average.On 10/7/1983 at 10:18:46, a magnitude 5.3 (5.1 MB, 5.3 LG, 5.1 ML, Class: Moderate, Intensity: VI - VII) earthquake occurred 149.7 miles away from the city center
On 4/20/2002 at 10:50:47, a magnitude 5.3 (5.3 ML, Depth: 3.0 mi) earthquake occurred 171.6 miles away from Westfield center
On 4/20/2002 at 10:50:47, a magnitude 5.2 (5.2 MB, 4.2 MS, 5.2 MW, 5.0 MW) earthquake occurred 170.2 miles away from Westfield center
On 1/19/1982 at 00:14:42, a magnitude 4.7 (4.5 MB, 4.7 MD, 4.5 LG, Class: Light, Intensity: IV - V) earthquake occurred 111.2 miles away from Westfield center
On 10/16/2012 at 23:12:25, a magnitude 4.7 (4.7 ML, Depth: 10.0 mi) earthquake occurred 146.7 miles away from the city center
On 8/23/2011 at 17:51:04, a magnitude 5.8 (5.8 MW, Depth: 3.7 mi) earthquake occurred 400.8 miles away from the city center
Magnitude types: regional Lg-wave magnitude (LG), body-wave magnitude (MB), duration magnitude (MD), local magnitude (ML), surface-wave magnitude (MS), moment magnitude (MW)
Natural disasters:
The number of natural disasters in Hampden County (22) is greater than the US average (15).Major Disasters (Presidential) Declared: 12
Emergencies Declared: 9
Causes of natural disasters: Storms: 6, Floods: 5, Hurricanes: 5, Snowstorms: 4, Winter Storms: 4, Blizzards: 2, Snows: 2, Snowfall: 1, Tornado: 1, Tropical Storm: 1, Wind: 1, Other: 1 (Note: some incidents may be assigned to more than one category).
Main business address for: MESTEK INC (AIR COND & WARM AIR HEATING EQUIP & COMM & INDL REFRIG EQUIP), WESTFIELD FINANCIAL INC (SAVINGS INSTITUTION, FEDERALLY CHARTERED), WORONOCO BANCORP INC (SAVINGS INSTITUTIONS, NOT FEDERALLY CHARTERED).
Hospitals and medical centers in Westfield:
- NOBLE HOSPITAL (Government - Federal, 115 WEST SILVER STREET)
- WESTERN MASSACHUSETTS HOSPITAL (91 EAST MOUNTAIN ROAD)
- NOBLE VISITING NURSE (77 MILL STREET, SUITE 207)
- GOVERNORS CENTER (66 BROAD STREET)
- RENAISSANCE MANOR OF WESTFIELD (37 FEEDING HILLS ROAD)
- WESTFIELD CARE AND REHABILITATION CENTER (60 EAST SILVER STREET)
Airports and heliports located in Westfield:
- Westfield-Barnes Regional Airport (BAF) (Runways: 2, Commercial Ops: 9, Air Taxi Ops: 741, Itinerant Ops: 20,267, Local Ops: 15,028, Military Ops: 5,573)
- Mundale Airport (MA80) (Runways: 1)
- Digital Heliport (MA79)
Amtrak stations near Westfield:
- 8 miles: SPRINGFIELD (66 LYMAN ST.) . Services: ticket office, partially wheelchair accessible, enclosed waiting area, public restrooms, public payphones, full-service food facilities, snack bar, vending machines, ATM, paid short-term parking, paid long-term parking, call for car rental service, taxi stand, intercity bus service, public transit connection.
- 16 miles: WINDSOR LOCKS (S. MAIN ST. (RTE. 159)) . Services: public payphones, free short-term parking, free long-term parking, call for car rental service, call for taxi service, public transit connection.
- 20 miles: WINDSOR (41 CENTRAL ST.) . Services: enclosed waiting area, public restrooms, public payphones, free short-term parking, call for car rental service, call for taxi service, public transit connection.
College/University in Westfield:
Other colleges/universities with over 2000 students near Westfield:
- Holyoke Community College (about 7 miles; Holyoke, MA; Full-time enrollment: 4,911)
- Springfield Technical Community College (about 9 miles; Springfield, MA; FT enrollment: 4,750)
- American International College (about 10 miles; Springfield, MA; FT enrollment: 2,733)
- Bay Path College (about 10 miles; Longmeadow, MA; FT enrollment: 2,085)
- Springfield College (about 10 miles; Springfield, MA; FT enrollment: 3,144)
- Western New England University (about 12 miles; Springfield, MA; FT enrollment: 3,477)
- Mount Holyoke College (about 13 miles; South Hadley, MA; FT enrollment: 2,573)
Public high schools in Westfield:
- WESTFIELD HIGH (Students: 1,654, Location: 177 MONTGOMERY RD, Grades: 9-12)
- WESTFIELD VOCATIONAL TECHNICAL HIGH (Students: 499, Location: 33 SMITH AVENUE, Grades: 9-12)
Private high schools in Westfield:
- ST MARY HIGH SCHOOL (Students: 128, Location: 27 BARTLETT ST, Grades: 9-12)
- WESTFIELD CHRISTIAN ACADEMY (Students: 107, Location: 866 NORTH RD, Grades: KG-9)
- WHITE OAK SCHOOL (Students: 84, Location: 533 NORTH RD, Grades: UG-12)
Public elementary/middle schools in Westfield:
- NORTH MIDDLE SCHOOL (Students: 779, Location: 350 SOUTHAMPTON ROAD, Grades: 6-8)
- JUNIPER PARK (Students: 497, Location: 715 WESTERN AVENUE, Grades: KG-5)
- PAPER MILL (Students: 423, Location: 148 PAPER MILL RD, Grades: KG-5)
- MUNGER HILL (Students: 393, Location: 33 MALLARD LANE, Grades: KG-5)
- SOUTHAMPTON ROAD (Students: 391, Location: 330 SOUTHAMPTON RD, Grades: KG-5)
- HIGHLAND (Students: 320, Location: 34 WESTERN AVENUE, Grades: KG-5)
- FRANKLIN AVE (Students: 190, Location: 22 FRANKLIN AVENUE, Grades: KG-5)
- ABNER GIBBS (Students: 172, Location: 50 WEST SILVER STREET, Grades: KG-5)
- SOUTH MIDDLE SCHOOL (Location: 30 WEST SILVER STREET, Grades: 6-8)
Private elementary/middle school in Westfield:
User-submitted facts and corrections:
- Holy Trinity School in Westfield MA is now closed.
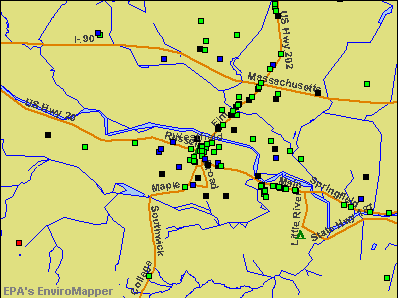
Points of interest:
Notable locations in Westfield: Chapman Playground (A), East Mountain Ski Touring Center (B), Whip City Speedway (C), Shaker Forms Country Club (D), East Mountain Country Club (E), Tekoa Country Club (F), Camp Shepard (G), Westgate Plaza (H), Westfield Shops (I), Little River Plaza (J), Bates Hall (K), Westfield Fire Department Station 2 (L), Westfield Fire Department Station 3 (M), Westfield Fire Department Station 4 Headquarters (N), Courtney Hall (O), Westfield City Hall (P), Westfield Vocational Technical High School Library (Q), Davis Hall (R), Dickinson Building (S), Ely Building (T). Display/hide their locations on the map
Shopping Centers: Little River Plaza Shopping Center (1), Westfield Shops Shopping Center (2), Westgate Plaza Shopping Center (3), Westgate Shopping Center (4), Big Y Shopping Center (5). Display/hide their locations on the map
Main business address in Westfield include: MESTEK INC (A), WESTFIELD FINANCIAL INC (B), WORONOCO BANCORP INC (C). Display/hide their locations on the map
Churches in Westfield include: Westfield Assembly of God Church (A), Westfield Alliance Church (B), United Church of Christ (C), Saint Johns Lutheran Church (D), Saint Casimirs Church (E), Resurrection Life Church (F), Full Gospel Church (G), First United Methodist Church (H), First Congregational Church (I). Display/hide their locations on the map
Cemeteries: Pine Hill Cemetery (1), Saint Josephs Cemetery (2), Saint Marys Cemetery (3), Middle Farms Cemetery (4). Display/hide their locations on the map
Lakes and reservoirs: Round Pond (A), Pequot Pond (B), Long Pond (C), Hampton Ponds (D), Doe Pond (E), Buck Pond (F), Springdale Pond (G), Arm Brook Reservoir (H). Display/hide their locations on the map
Streams, rivers, and creeks: Hundred Acre Brook (A), Kellog Brook (B), Little River (C), Walker Brook (D), Powdermill Brook (E), Cook Brook (F), Munn Brook (G), Moose Meadow Brook (H), Jim Brook (I). Display/hide their locations on the map
Parks in Westfield include: Hampton Ponds State Park (1), Allen Park (2), Holcomb Park (3), Stanley Park (4), Apremont Park (5), Sadle Know Playground (6), Campus Green (7), Cross Street Playground (8). Display/hide their locations on the map
Tourist attractions: Dewey House (Historical Places & Services; 87 South Maple Street) (1), Rock 'n' Roll Music (Amusement & Theme Parks; 120 Northwest Road) (2). Display/hide their approximate locations on the map
Hotel: Elm Motel (50 Russell Rd) (1). Display/hide its approximate location on the map
Courts: Court Management Corporation (30 Court Street) (1), Mass Commonwealth - District Court Of Westfield Clerk Magistrates Depart (27 Washington Street) (2), Mass Commonwealth - District Court Of Westfield Clerk Magistrates Dept- Probation Depart (224 Elm Street) (3). Display/hide their approximate locations on the map
Birthplace of: Philip A. Payton, Jr. - Businessman, Adonis Terry - Major League Baseball player, Clara C. M. Cannon - Second Counselor in the general presidency of the Church of Jesus Christ of Latter-day Saints, Don Pardo - Voice actor, Ferdinand Vandeveer Hayden - Geologist, Frederic Rzewski - Composer, Kacey Bellamy - Ice hockey player, William Shepard - Massachusetts Revolutionary War officer, Asahel Bush - Newspaper publisher, Dale Quarterley - Busch series NASCAR driver (born: Jan 25, 1961).
Drinking water stations with addresses in Westfield and their reported violations in the past:
WESTFIELD WATER DEPT (Population served: 42,000, Surface water):Past health violations:Past monitoring violations:
- MCL, Monthly (TCR) - In JUN-2014, Contaminant: Coliform. Follow-up actions: St AO (w/o penalty) issued (AUG-01-2014)
- MCL, Monthly (TCR) - In JUN-2012, Contaminant: Coliform. Follow-up actions: St AO (w/o penalty) issued (JUL-02-2012)
- MCL, Monthly (TCR) - In JUL-2010, Contaminant: Coliform. Follow-up actions: St AO (w/o penalty) issued (OCT-18-2010)
- MCL, Monthly (TCR) - In MAR-2010, Contaminant: Coliform. Follow-up actions: St AO (w/o penalty) issued (2 times from MAR-31-2010 to OCT-18-2010)
- MCL, Monthly (TCR) - In JUL-2008, Contaminant: Coliform. Follow-up actions: St AO (w/o penalty) issued (AUG-22-2008)
- One minor monitoring violation
- 42 regular monitoring violations
| This city: | 2.5 people |
| Massachusetts: | 2.5 people |
| This city: | 65.5% |
| Whole state: | 63.0% |
| This city: | 7.2% |
| Whole state: | 7.0% |
Likely homosexual households (counted as self-reported same-sex unmarried-partner households)
- Lesbian couples: 0.4% of all households
- Gay men: 0.3% of all households
People in group quarters in Westfield in 2010:
- 2,517 people in college/university student housing
- 294 people in nursing facilities/skilled-nursing facilities
- 65 people in correctional facilities intended for juveniles
- 39 people in other noninstitutional facilities
- 34 people in emergency and transitional shelters (with sleeping facilities) for people experiencing homelessness
- 20 people in group homes intended for adults
- 7 people in residential treatment centers for adults
People in group quarters in Westfield in 2000:
- 1,885 people in college dormitories (includes college quarters off campus)
- 370 people in nursing homes
- 77 people in hospitals/wards and hospices for chronically ill
- 77 people in other hospitals or wards for chronically ill
- 61 people in homes for abused, dependent, and neglected children
- 51 people in other noninstitutional group quarters
- 19 people in homes for the mentally retarded
- 3 people in mental (psychiatric) hospitals or wards
- 2 people in religious group quarters
Banks with most branches in Westfield (2011 data):
- Westfield Bank: Www.Westfieldbank.com Branch, Westfield Branch, Drive-Up Facility, Southampton Road Branch, at 141 Elm Street. Info updated 2011/07/21: Bank assets: $1,259.3 mil, Deposits: $733.6 mil, local headquarters, positive income, Commercial Lending Specialization, 12 total offices
- Bank of America, National Association: Westfield Branch at 10 Main Street, branch established on 1961/11/17; Westfield Drive-Up Branch at 10 Main Street, branch established on 2011/05/31. Info updated 2009/11/18: Bank assets: $1,451,969.3 mil, Deposits: $1,077,176.8 mil, headquarters in Charlotte, NC, positive income, 5782 total offices, Holding Company: Bank Of America Corporation
- United Bank: Westfield Branch at 10 Elm Street, branch established on 1981/01/01; Southampton Road Branch at 168 Southampton Road, branch established on 2006/12/29. Info updated 2012/01/20: Bank assets: $1,617.9 mil, Deposits: $1,235.2 mil, headquarters in West Springfield, MA, positive income, Commercial Lending Specialization, 25 total offices
- Berkshire Bank: Little River Branch at 22 Little River Road, branch established on 1971/11/17; Woronoco Bank Branch at 31 Court Street, branch established on 1871/05/05. Info updated 2011/08/24: Bank assets: $3,955.6 mil, Deposits: $3,176.2 mil, headquarters in Pittsfield, MA, positive income, Commercial Lending Specialization, 64 total offices
- First Niagara Bank, National Association: Westfield Branch at 10 Broad Street, branch established on 1985/08/01. Info updated 2011/06/09: Bank assets: $32,750.6 mil, Deposits: $19,595.4 mil, headquarters in Buffalo, NY, positive income, Commercial Lending Specialization, 351 total offices, Holding Company: First Niagara Financial Group, Inc.
- TD Bank, National Association: Westfield Branch at 60 Main Street, branch established on 1975/12/12. Info updated 2010/10/04: Bank assets: $188,912.6 mil, Deposits: $153,149.8 mil, headquarters in Wilmington, DE, positive income, 1314 total offices, Holding Company: Toronto-Dominion Bank, The
- Sovereign Bank, National Association: Westfield Branch at 30 Elm Street, branch established on 1959/09/21. Info updated 2012/01/31: Bank assets: $78,146.9 mil, Deposits: $48,042.9 mil, headquarters in Wilmington, DE, positive income, Commercial Lending Specialization, 718 total offices, Holding Company: Banco Santander, S.A.
- PeoplesBank: Westfield Branch at 281 East Main Street, branch established on 2006/04/07. Info updated 2007/02/12: Bank assets: $1,653.1 mil, Deposits: $1,224.2 mil, headquarters in Holyoke, MA, positive income, Commercial Lending Specialization, 18 total offices, Holding Company: Peoplesbancorp, Mhc
- RBS Citizens, National Association: Westfield Stop & Shop Branch at 57 Main Street, branch established on 2001/12/16. Info updated 2007/09/19: Bank assets: $106,940.6 mil, Deposits: $75,690.2 mil, headquarters in Providence, RI, positive income, 1135 total offices, Holding Company: Uk Financial Investments Limited
- 2 other banks with 2 local branches
For population 15 years and over in Westfield:
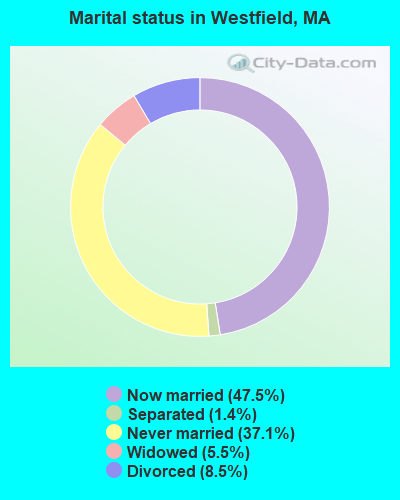
- Never married: 37.1%
- Now married: 47.5%
- Separated: 1.4%
- Widowed: 5.5%
- Divorced: 8.5%
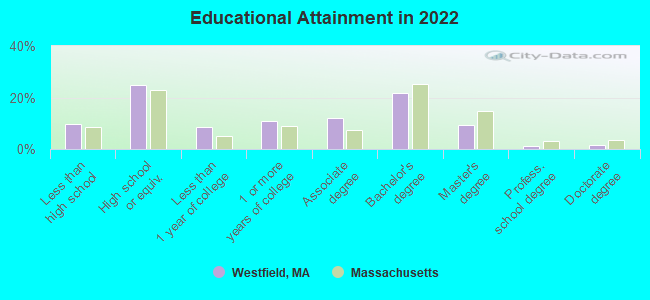
For population 25 years and over in Westfield:
- High school or higher: 89.8%
- Bachelor's degree or higher: 32.6%
- Graduate or professional degree: 11.6%
- Unemployed: 4.9%
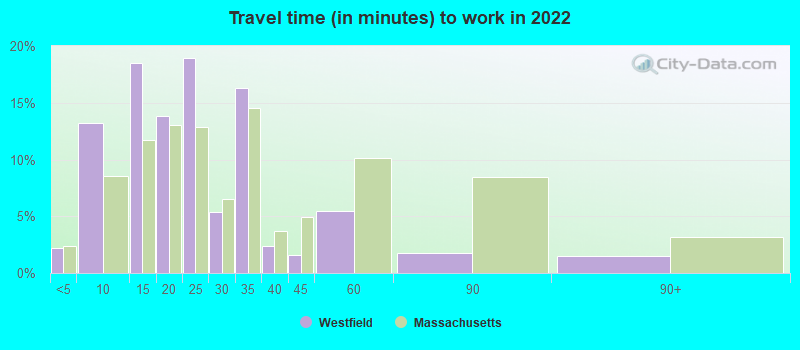
- Mean travel time to work (commute): 22.1 minutes
| Here: | 12.5 |
| Massachusetts average: | 13.0 |
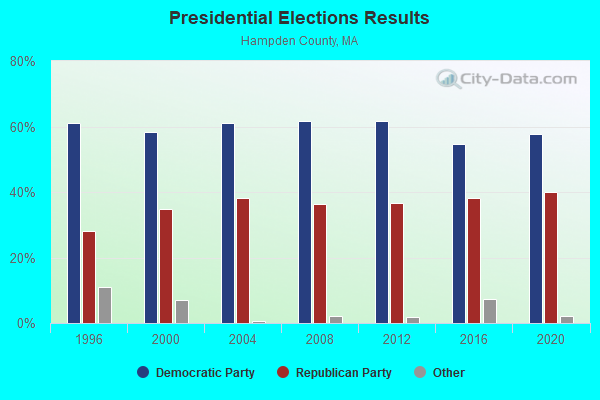
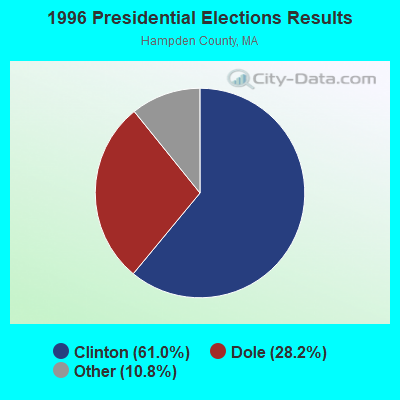
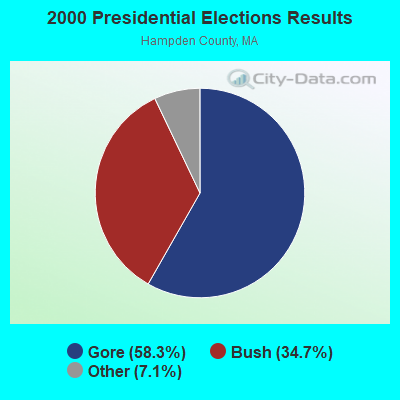
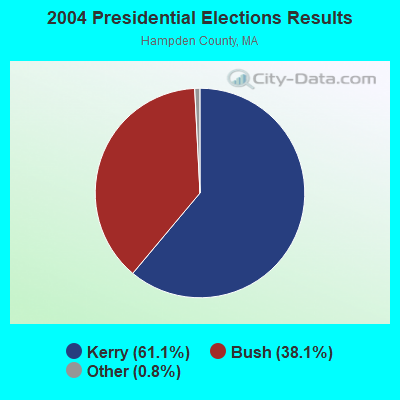
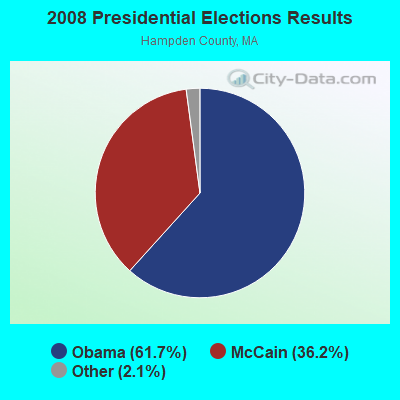
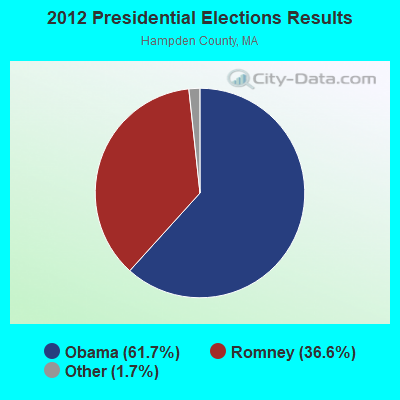
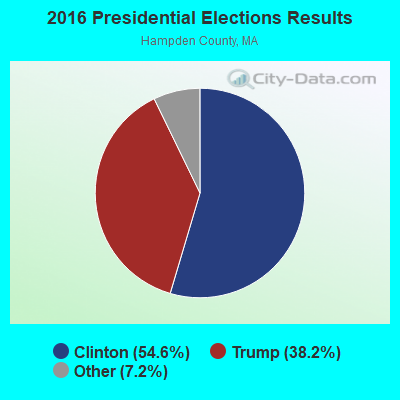
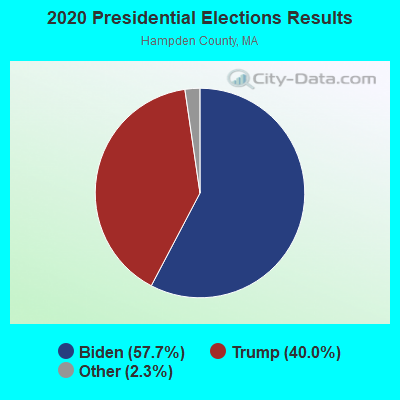
Graphs represent county-level data. Detailed 2008 Election Results
Religion statistics for Westfield, MA (based on Hampden County data)
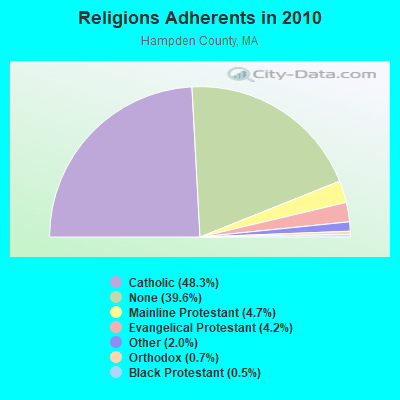
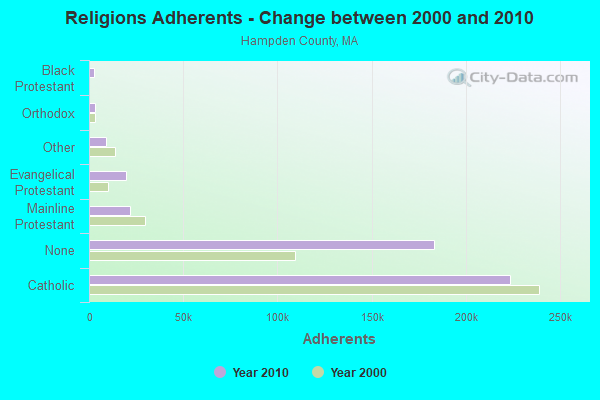
| Religion | Adherents | Congregations |
|---|---|---|
| Catholic | 223,685 | 65 |
| Mainline Protestant | 21,962 | 88 |
| Evangelical Protestant | 19,438 | 114 |
| Other | 9,140 | 31 |
| Orthodox | 3,406 | 10 |
| Black Protestant | 2,491 | 16 |
| None | 183,368 | - |
Food Environment Statistics:
| Hampden County: | 1.95 / 10,000 pop. |
| State: | 1.98 / 10,000 pop. |
| Hampden County: | 0.04 / 10,000 pop. |
| Massachusetts: | 0.05 / 10,000 pop. |
| This county: | 1.87 / 10,000 pop. |
| Massachusetts: | 2.22 / 10,000 pop. |
| This county: | 2.43 / 10,000 pop. |
| Massachusetts: | 1.77 / 10,000 pop. |
| This county: | 7.27 / 10,000 pop. |
| Massachusetts: | 8.76 / 10,000 pop. |
| Hampden County: | 9.2% |
| State: | 8.1% |
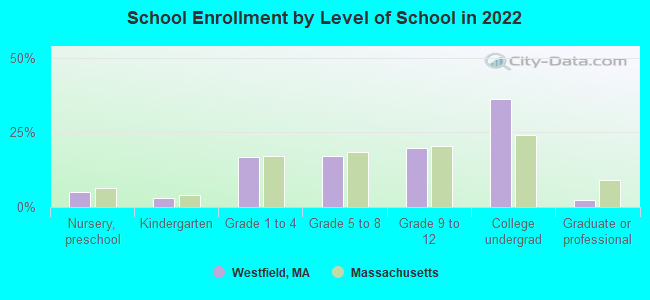
| Here: | 25.9% |
| Massachusetts: | 22.5% |
| Hampden County: | 16.2% |
| Massachusetts: | 16.5% |
Health and Nutrition:
| Westfield: | 48.4% |
| Massachusetts: | 50.5% |
| Westfield: | 44.9% |
| Massachusetts: | 48.0% |
| Westfield: | 28.6 |
| Massachusetts: | 28.4 |
| Westfield: | 21.9% |
| Massachusetts: | 20.7% |
| Westfield: | 10.8% |
| Massachusetts: | 10.4% |
| Westfield: | 6.8 |
| Massachusetts: | 6.8 |
| Westfield: | 33.2% |
| Massachusetts: | 33.4% |
| Westfield: | 55.4% |
| Massachusetts: | 57.1% |
| Here: | 77.8% |
| Massachusetts: | 79.2% |
More about Health and Nutrition of Westfield, MA Residents
| Local government employment and payroll (March 2022) | |||||
| Function | Full-time employees | Monthly full-time payroll | Average yearly full-time wage | Part-time employees | Monthly part-time payroll |
|---|---|---|---|---|---|
| Elementary and Secondary - Instruction | 564 | $3,170,784 | $67,463 | 68 | $60,532 |
| Elementary and Secondary - Other Total | 104 | $507,446 | $58,551 | 45 | $38,026 |
| Firefighters | 88 | $587,751 | $80,148 | 0 | $0 |
| Police Protection - Officers | 84 | $629,592 | $89,942 | 3 | $3,286 |
| Electric Power | 61 | $515,805 | $101,470 | 7 | $14,966 |
| Financial Administration | 31 | $164,249 | $63,580 | 1 | $948 |
| Water Supply | 27 | $134,722 | $59,876 | 1 | $762 |
| Local Libraries | 17 | $68,518 | $48,366 | 8 | $13,441 |
| Gas Supply | 16 | $198,070 | $148,553 | 3 | $9,876 |
| Other Government Administration | 16 | $88,680 | $66,510 | 14 | $16,363 |
| Sewerage | 14 | $74,996 | $64,282 | 0 | $0 |
| Streets and Highways | 14 | $75,706 | $64,891 | 0 | $0 |
| Solid Waste Management | 10 | $46,037 | $55,244 | 3 | $2,706 |
| Welfare | 10 | $43,823 | $52,588 | 7 | $14,127 |
| Airports | 8 | $33,349 | $50,024 | 0 | $0 |
| Natural Resources | 7 | $31,562 | $54,106 | 2 | $3,379 |
| Health | 6 | $34,643 | $69,286 | 0 | $0 |
| Police - Other | 6 | $22,555 | $45,110 | 7 | $5,770 |
| Judicial and Legal | 5 | $32,054 | $76,930 | 1 | $2,761 |
| Parks and Recreation | 3 | $16,446 | $65,784 | 3 | $450 |
| Housing and Community Development (Local) | 3 | $21,468 | $85,872 | 0 | $0 |
| Fire - Other | 2 | $8,758 | $52,548 | 0 | $0 |
| Other and Unallocable | 0 | $0 | 6 | $875 | |
| Totals for Government | 1,096 | $6,507,012 | $71,245 | 179 | $188,267 |
Westfield government finances - Expenditure in 2021 (per resident):
- Construction - General - Other: $8,043,000 ($198.42)
Water Utilities: $2,012,000 ($49.64)
Regular Highways: $1,520,000 ($37.50)
Sewerage: $1,045,000 ($25.78)
Health - Other: $927,000 ($22.87)
Elementary and Secondary Education: $332,000 ($8.19)
Housing and Community Development: $11,000 ($0.27)
- Current Operations - Elementary and Secondary Education: $81,361,000 ($2007.18)
Electric Utilities: $50,355,000 ($1242.26)
General - Other: $25,294,000 ($624.00)
Gas Utilities: $16,785,000 ($414.09)
Police Protection: $7,623,000 ($188.06)
Local Fire Protection: $4,945,000 ($121.99)
Water Utilities: $4,353,000 ($107.39)
Health - Other: $3,473,000 ($85.68)
Sewerage: $3,348,000 ($82.60)
Regular Highways: $3,142,000 ($77.51)
Solid Waste Management: $2,774,000 ($68.43)
Financial Administration: $1,680,000 ($41.45)
Protective Inspection and Regulation - Other: $1,273,000 ($31.40)
Libraries: $1,048,000 ($25.85)
Public Welfare - Other: $650,000 ($16.04)
Central Staff Services: $459,000 ($11.32)
Judicial and Legal Services: $459,000 ($11.32)
Housing and Community Development: $395,000 ($9.74)
Parks and Recreation: $296,000 ($7.30)
General Public Buildings: $131,000 ($3.23)
Natural Resources - Other: $88,000 ($2.17)
- Electric Utilities - Interest on Debt: $749,000 ($18.48)
- General - Interest on Debt: $3,019,000 ($74.48)
- Intergovernmental to Local - Other - Elementary and Secondary Education: $2,128,000 ($52.50)
Other - Health - Other: $11,000 ($0.27)
- Intergovernmental to State - Transit Utilities: $386,000 ($9.52)
General - Other: $40,000 ($0.99)
- Other Capital Outlay - Elementary and Secondary Education: $2,561,000 ($63.18)
Regular Highways: $1,635,000 ($40.34)
General - Other: $737,000 ($18.18)
Police Protection: $297,000 ($7.33)
Solid Waste Management: $244,000 ($6.02)
Local Fire Protection: $79,000 ($1.95)
Protective Inspection and Regulation - Other: $18,000 ($0.44)
Health - Other: $10,000 ($0.25)
Financial Administration: $8,000 ($0.20)
Judicial and Legal Services: $4,000 ($0.10)
Public Welfare - Other: $1,000 ($0.02)
- Total Salaries and Wages: $50,329,000 ($1241.62)
- Water Utilities - Interest on Debt: $503,000 ($12.41)
Westfield government finances - Revenue in 2021 (per resident):
- Charges - Other: $7,713,000 ($190.28)
Sewerage: $6,730,000 ($166.03)
Elementary and Secondary Education School Lunch: $955,000 ($23.56)
Elementary and Secondary Education - Other: $109,000 ($2.69)
Elementary and Secondary Education School Tuition and Transportation: $37,000 ($0.91)
- Federal Intergovernmental - Other: $8,905,000 ($219.69)
Education: $946,000 ($23.34)
Housing and Community Development: $432,000 ($10.66)
- Local Intergovernmental - Education: $2,531,000 ($62.44)
Other: $11,000 ($0.27)
- Miscellaneous - General Revenue - Other: $4,431,000 ($109.31)
Donations From Private Sources: $500,000 ($12.34)
Interest Earnings: $159,000 ($3.92)
Special Assessments: $44,000 ($1.09)
Fines and Forfeits: $25,000 ($0.62)
- Revenue - Electric Utilities: $58,162,000 ($1434.86)
Gas Utilities: $22,618,000 ($557.99)
Water Utilities: $8,279,000 ($204.24)
- State Intergovernmental - Education: $47,766,000 ($1178.39)
General Local Government Support: $7,473,000 ($184.36)
Other: $5,754,000 ($141.95)
Electric Utilities: $2,183,000 ($53.85)
Highways: $1,834,000 ($45.24)
Public Welfare: $444,000 ($10.95)
Sewerage: $426,000 ($10.51)
Health and Hospitals: $203,000 ($5.01)
Water Utilities: $33,000 ($0.81)
- Tax - Property: $84,682,000 ($2089.11)
Other Selective Sales: $2,023,000 ($49.91)
Other License: $639,000 ($15.76)
Westfield government finances - Debt in 2021 (per resident):
- Long Term Debt - Beginning Outstanding - Unspecified Public Purpose: $94,841,000 ($2339.73)
Outstanding Unspecified Public Purpose: $93,222,000 ($2299.79)
Retired Unspecified Public Purpose: $37,389,000 ($922.39)
Issue, Unspecified Public Purpose: $35,770,000 ($882.45)
- Short Term Debt Outstanding - Beginning: $9,479,000 ($233.85)
End of Fiscal Year: $6,840,000 ($168.74)
Westfield government finances - Cash and Securities in 2021 (per resident):
- Bond Funds - Cash and Securities: $7,576,000 ($186.90)
- Other Funds - Cash and Securities: $98,336,000 ($2425.95)
3.64% of this county's 2021 resident taxpayers lived in other counties in 2020 ($58,474 average adjusted gross income)
| Here: | 3.64% |
| Massachusetts average: | 6.35% |
0.02% of residents moved from foreign countries ($105 average AGI)
Hampden County: 0.02% Massachusetts average: 0.01%
Top counties from which taxpayers relocated into this county between 2020 and 2021:
| from Hampshire County, MA | |
| from Hartford County, CT | |
| from Worcester County, MA |
4.26% of this county's 2020 resident taxpayers moved to other counties in 2021 ($66,146 average adjusted gross income)
| Here: | 4.26% |
| Massachusetts average: | 7.18% |
0.03% of residents moved to foreign countries ($223 average AGI)
Hampden County: 0.03% Massachusetts average: 0.02%
Top counties to which taxpayers relocated from this county between 2020 and 2021:
| to Hampshire County, MA | |
| to Hartford County, CT | |
| to Worcester County, MA |
| Businesses in Westfield, MA | ||||
| Name | Count | Name | Count | |
|---|---|---|---|---|
| AT&T | 1 | KFC | 1 | |
| Ace Hardware | 1 | MasterBrand Cabinets | 10 | |
| Advance Auto Parts | 1 | McDonald's | 2 | |
| Applebee's | 1 | New Balance | 1 | |
| AutoZone | 1 | Payless | 1 | |
| Blockbuster | 1 | Penske | 2 | |
| Burger King | 1 | RadioShack | 1 | |
| CVS | 2 | Rite Aid | 1 | |
| Carson Pirie Scott | 1 | Staples | 1 | |
| Circle K | 1 | Starbucks | 1 | |
| Domino's Pizza | 1 | Stop & Shop | 1 | |
| DressBarn | 1 | Subway | 5 | |
| Dressbarn | 1 | T-Mobile | 2 | |
| Dunkin Donuts | 7 | T.J.Maxx | 1 | |
| Econo Lodge | 1 | Taco Bell | 1 | |
| FedEx | 5 | U-Haul | 2 | |
| GNC | 1 | UPS | 8 | |
| GameStop | 1 | Vans | 1 | |
| H&R Block | 1 | Walmart | 1 | |
| Holiday Inn | 1 | Wendy's | 1 | |
| Home Depot | 1 | YMCA | 1 | |
| Jones New York | 1 | |||
Strongest AM radio stations in Westfield:
- WNNZ (640 AM; 50 kW; WESTFIELD, MA; Owner: CLEAR CHANNEL BROADCASTING LICENSES, INC.)
- WHYN (560 AM; 5 kW; SPRINGFIELD, MA; Owner: CLEAR CHANNEL BROADCASTING LICENSES, INC.)
- WACE (730 AM; 5 kW; CHICOPEE, MA; Owner: CARTER BROADCASTING CORP.)
- WSPR (1270 AM; 5 kW; SPRINGFIELD, MA; Owner: ANTONIO F. AND HELENA R. GOIS, TENANTS BY THE ENTIRETY)
- WTIC (1080 AM; 50 kW; HARTFORD, CT; Owner: INFINITY RADIO OPERATIONS INC.)
- WCRN (830 AM; 50 kW; WORCESTER, MA; Owner: CARTER BROADCASTING CORPORATION)
- WVNE (760 AM; daytime; 25 kW; LEICESTER, MA; Owner: BLOUNT MASSCOM, INC.)
- WACM (1490 AM; 1 kW; WEST SPRINGFIELD, MA; Owner: ANTONIO F. GOIS)
- WMAS (1450 AM; 1 kW; SPRINGFIELD, MA; Owner: LAPPIN COMMUNICATIONS, INC.)
- WALE (990 AM; 50 kW; GREENVILLE, RI; Owner: NORTH AMERICAN BROADCASTING CO., INC.)
- WHNP (1600 AM; 2 kW; EAST LONGMEADOW, MA; Owner: SAGA COMMUNICATIONS OF NEW ENGLAND, LLC)
- WRKO (680 AM; 50 kW; BOSTON, MA; Owner: ENTERCOM BOSTON LICENSE, LLC)
- WEEI (850 AM; 50 kW; BOSTON, MA; Owner: ENTERCOM BOSTON LICENSE, LLC)
Strongest FM radio stations in Westfield:
- WAQY (102.1 FM; SPRINGFIELD, MA; Owner: SAGA COMMUNICATIONS OF NEW ENGLAND, LLC)
- WPKX (97.9 FM; ENFIELD, CT; Owner: CAPSTAR TX LIMITED PARTNERSHIP)
- WHYN-FM (93.1 FM; SPRINGFIELD, MA; Owner: CLEAR CHANNEL BROADCASTING LICENSES, INC.)
- WRNX (100.9 FM; AMHERST, MA; Owner: WESTERN MASSACHUSETTS RADIO COMPANY)
- WCCH (103.5 FM; HOLYOKE, MA; Owner: HOLYOKE COMMUNITY COLLEGE)
- WFCR (88.5 FM; AMHERST, MA; Owner: UNIVERSITY OF MASSACHUSETTS)
- WMAS-FM (94.7 FM; SPRINGFIELD, MA; Owner: LAPPIN COMMUNICATIONS, INC.)
- WAMC-FM (90.3 FM; ALBANY, NY; Owner: WAMC)
- WRCH (100.5 FM; NEW BRITAIN, CT; Owner: INFINITY RADIO OPERATIONS INC.)
- WTIC-FM (96.5 FM; HARTFORD, CT; Owner: INFINITY RADIO OPERATIONS INC.)
- WCCC-FM (106.9 FM; HARTFORD, CT; Owner: MARLIN BROADCASTING, LLC)
- WAMH (89.3 FM; AMHERST, MA; Owner: TRUSTEES OF AMHERST COLLEGE)
- WWUH (91.3 FM; WEST HARTFORD, CT; Owner: UNIVERSITY OF HARTFORD)
- W246AM (97.1 FM; AMHERST, MA; Owner: GREAT NORTHERN RADIO, LLC)
- WLZX (99.3 FM; NORTHAMPTON, MA; Owner: SAGA COMMUNICATIONS OF NEW ENGLAND, LLC)
- WSKB (89.5 FM; WESTFIELD, MA; Owner: TRUSTEES OF WESTFIELD STATE COLLEGE)
- WHVP (91.1 FM; HUDSON, NY; Owner: SOUND OF LIFE, INC.)
- WAMQ (105.1 FM; GREAT BARRINGTON, MA; Owner: WAMC)
- WAAF (107.3 FM; WORCESTER, MA; Owner: ENTERCOM BOSTON LICENSE, LLC)
- WJMJ (88.9 FM; HARTFORD, CT; Owner: ST. THOMAS SEMINARY)
TV broadcast stations around Westfield:
- WWLP (Channel 22; SPRINGFIELD, MA; Owner: WWLP BROADCASTING, LLC)
- W67DF (Channel 67; SPRINGFIELD, MA; Owner: TRINITY BROADCASTING NETWORK)
- WDMR-LP (Channel 65; SPRINGFIELD, MA; Owner: ZGS HARTFORD, INC.)
- WTIC-TV (Channel 61; HARTFORD, CT; Owner: TRIBUNE TELEVISION COMPANY)
- W11BJ (Channel 11; HARTFORD, CT; Owner: COMMUNICATIONS SITE MANAGEMENT LLC)
- WUVN (Channel 18; HARTFORD, CT; Owner: ENTRAVISION HOLDINGS, LLC)
- WYDN (Channel 48; WORCESTER, MA; Owner: EDUCATIONAL PUBLIC TV CORPORATION)
- WTXX (Channel 20; WATERBURY, CT; Owner: WTXX INC.)
- WVIT (Channel 30; NEW BRITAIN, CT; Owner: OUTLET BROADCASTING, INC)
- WEDH (Channel 24; HARTFORD, CT; Owner: CONNECTICUT PUBLIC BROADCASTING, INC.)
- WFSB (Channel 3; HARTFORD, CT; Owner: MEREDITH CORPORATION)
- WGBY-TV (Channel 57; SPRINGFIELD, MA; Owner: WGBH EDUCATIONAL FOUNDATION)
- WGGB-TV (Channel 40; SPRINGFIELD, MA; Owner: WGGB LICENSEE, LLC)
- W12CL (Channel 12; GRANBY, CT; Owner: SALVATORE MINNITI)
- WHCT-LP (Channel 38; HARTFORD, CT; Owner: VENTURE TECHNOLOGIES GROUP, LLC)
- WHTX-LP (Channel 10; HARTFORD, CT; Owner: ENTRAVISION HOLDINGS, LLC)
- National Bridge Inventory (NBI) Statistics
- 45Number of bridges
- 436ft / 133mTotal length
- $96,437,000Total costs
- 685,913Total average daily traffic
- 61,350Total average daily truck traffic
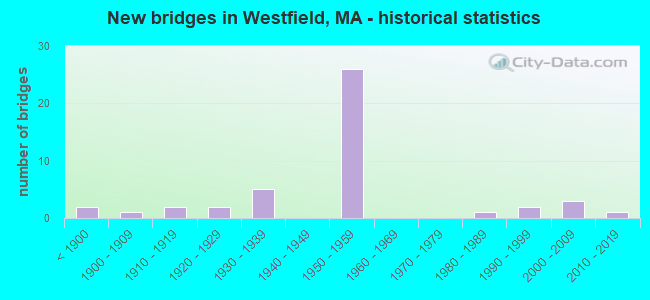
- New bridges - historical statistics
- 2Before 1900
- 11900-1909
- 21910-1919
- 21920-1929
- 51930-1939
- 261950-1959
- 11980-1989
- 21990-1999
- 32000-2009
- 12010-2019
FCC Registered Private Land Mobile Towers: 2 (See the full list of FCC Registered Private Land Mobile Towers in Westfield, MA)
FCC Registered Broadcast Land Mobile Towers: 27 (See the full list of FCC Registered Broadcast Land Mobile Towers)
FCC Registered Microwave Towers: 11 (See the full list of FCC Registered Microwave Towers in this town)
FCC Registered Maritime Coast & Aviation Ground Towers: 8 (See the full list of FCC Registered Maritime Coast & Aviation Ground Towers)
FCC Registered Amateur Radio Licenses: 170 (See the full list of FCC Registered Amateur Radio Licenses in Westfield)
FAA Registered Aircraft Manufacturers and Dealers: 5 (See the full list of FAA Registered Manufacturers and Dealers in Westfield)
FAA Registered Aircraft: 26 (See the full list of FAA Registered Aircraft)
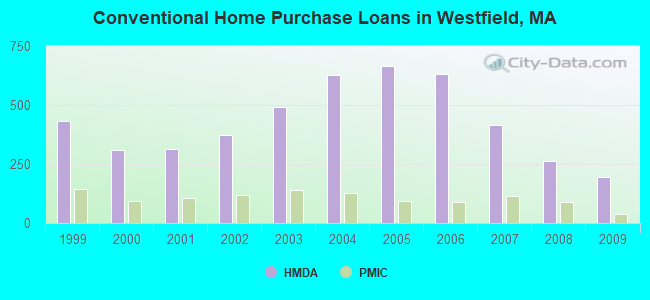
| Home Mortgage Disclosure Act Aggregated Statistics For Year 2009 (Based on 8 full tracts) | ||||||||||||||
| A) FHA, FSA/RHS & VA Home Purchase Loans | B) Conventional Home Purchase Loans | C) Refinancings | D) Home Improvement Loans | E) Loans on Dwellings For 5+ Families | F) Non-occupant Loans on < 5 Family Dwellings (A B C & D) | G) Loans On Manufactured Home Dwelling (A B C & D) | ||||||||
|---|---|---|---|---|---|---|---|---|---|---|---|---|---|---|
| Number | Average Value | Number | Average Value | Number | Average Value | Number | Average Value | Number | Average Value | Number | Average Value | Number | Average Value | |
| LOANS ORIGINATED | 123 | $184,268 | 197 | $162,345 | 841 | $179,126 | 85 | $103,659 | 4 | $409,250 | 37 | $124,595 | 10 | $53,100 |
| APPLICATIONS APPROVED, NOT ACCEPTED | 3 | $192,333 | 14 | $171,071 | 66 | $181,773 | 6 | $34,667 | 0 | $0 | 3 | $142,333 | 5 | $43,800 |
| APPLICATIONS DENIED | 10 | $135,300 | 37 | $126,216 | 217 | $185,691 | 30 | $62,333 | 2 | $298,000 | 12 | $135,833 | 6 | $28,500 |
| APPLICATIONS WITHDRAWN | 14 | $199,000 | 20 | $195,700 | 157 | $195,127 | 7 | $105,714 | 1 | $260,000 | 2 | $167,500 | 0 | $0 |
| FILES CLOSED FOR INCOMPLETENESS | 2 | $137,000 | 8 | $157,000 | 49 | $196,061 | 4 | $273,250 | 1 | $227,000 | 0 | $0 | 2 | $60,000 |
Detailed HMDA statistics for the following Tracts: 8125.00 , 8126.00, 8127.01, 8127.02, 8128.00, 8129.01, 8129.02, 8129.03
| Private Mortgage Insurance Companies Aggregated Statistics For Year 2009 (Based on 7 full tracts) | ||||
| A) Conventional Home Purchase Loans | B) Refinancings | |||
|---|---|---|---|---|
| Number | Average Value | Number | Average Value | |
| LOANS ORIGINATED | 37 | $212,432 | 29 | $252,828 |
| APPLICATIONS APPROVED, NOT ACCEPTED | 19 | $233,053 | 9 | $223,333 |
| APPLICATIONS DENIED | 3 | $359,667 | 22 | $246,682 |
| APPLICATIONS WITHDRAWN | 2 | $191,000 | 3 | $260,667 |
| FILES CLOSED FOR INCOMPLETENESS | 0 | $0 | 0 | $0 |
Detailed PMIC statistics for the following Tracts: 8125.00 , 8126.00, 8127.01, 8127.02, 8128.00, 8129.01, 8129.02
2002 - 2018 National Fire Incident Reporting System (NFIRS) incidents
- Fire incident types reported to NFIRS in Westfield, MA
- 1,21951.5%Structure Fires
- 73130.9%Outside Fires
- 34714.6%Mobile Property/Vehicle Fires
- 723.0%Other
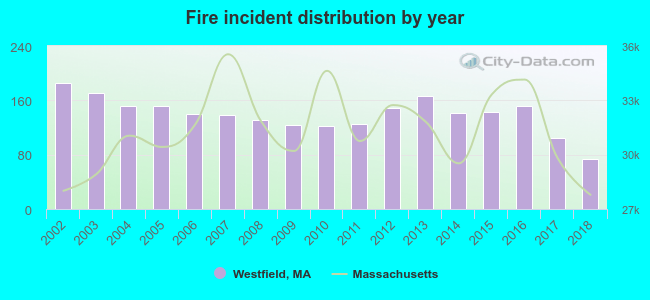 Based on the data from the years 2002 - 2018 the average number of fires per year is 139. The highest number of fires - 185 took place in 2002, and the least - 74 in 2018. The data has a declining trend.
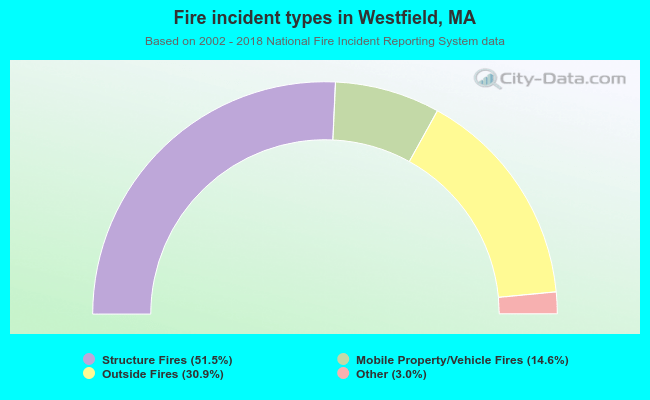 When looking into fire subcategories, the most reports belonged to: Structure Fires (51.5%), and Outside Fires (30.9%).
Fire-safe hotels and motels in Westfield, Massachusetts:
- Econo Lodge Inn & Suites, 2 Southampton Rd, Westfield, Massachusetts 01085 , Phone: (413) 568-2821, Fax: (413) 572-0663
- Holiday Inn Express & Suites, 39 Southampton Rd, Westfield, Massachusetts 01085 , Phone: (413) 564-6900, Fax: (413) 564-6904
- Quality inn, 2 Southampton Rd, Westfield, Massachusetts 01085 , Phone: (413) 568-2821, Fax: (413) 572-0663
- Quality Inn, 2 Southampton Rd, Westfield, Massachusetts 01085 , Phone: (413) 568-2821, Fax: (413) 572-0663
| Most common first names in Westfield, MA among deceased individuals | ||
| Name | Count | Lived (average) |
|---|---|---|
| John | 420 | 75.3 years |
| Mary | 417 | 82.5 years |
| Joseph | 255 | 76.4 years |
| William | 252 | 72.7 years |
| Helen | 215 | 80.8 years |
| Edward | 194 | 74.8 years |
| George | 177 | 76.0 years |
| Robert | 177 | 69.8 years |
| Anna | 170 | 84.3 years |
| James | 140 | 74.9 years |
| Most common last names in Westfield, MA among deceased individuals | ||
| Last name | Count | Lived (average) |
|---|---|---|
| Smith | 55 | 77.7 years |
| Williams | 51 | 77.0 years |
| Miller | 38 | 79.3 years |
| Sullivan | 36 | 76.5 years |
| Oleksak | 33 | 77.0 years |
| Fitzgerald | 32 | 78.6 years |
| Murphy | 30 | 81.0 years |
| Clark | 29 | 81.0 years |
| White | 29 | 74.7 years |
| Shea | 28 | 79.0 years |
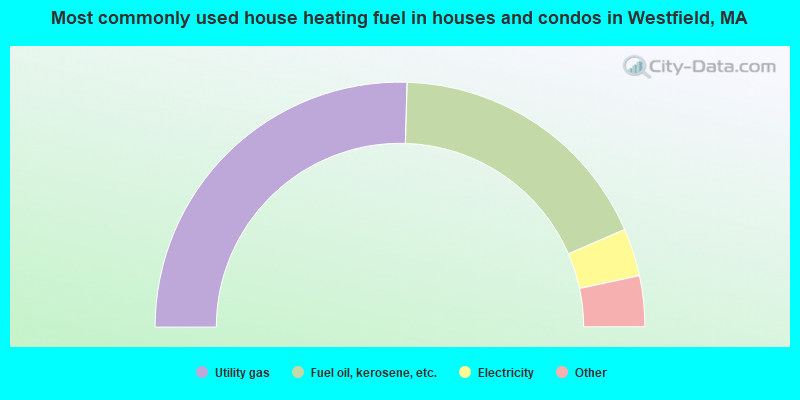
- 50.9%Utility gas
- 36.0%Fuel oil, kerosene, etc.
- 6.3%Electricity
- 3.0%Bottled, tank, or LP gas
- 2.6%Wood
- 1.1%Other fuel
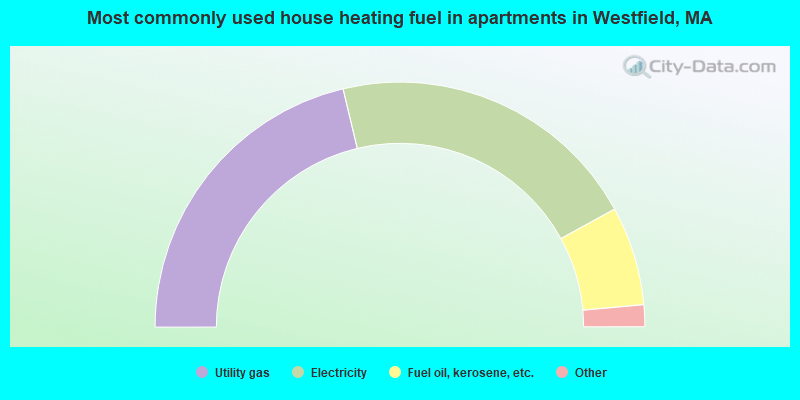
- 42.6%Utility gas
- 41.5%Electricity
- 13.1%Fuel oil, kerosene, etc.
- 1.6%Bottled, tank, or LP gas
- 0.8%No fuel used
- 0.3%Other fuel
- 0.2%Coal or coke
Westfield compared to Massachusetts state average:
- Median house value below state average.
- Unemployed percentage significantly below state average.
- Black race population percentage significantly below state average.
- Foreign-born population percentage below state average.
- Length of stay since moving in significantly above state average.
Westfield on our top lists:
- #11 on the list of "Top 101 cities with the most residents born in Other South Central Asia (population 500+)"
- #52 on the list of "Top 101 cities with the most residents born in Ukraine (population 500+)"
- #74 on the list of "Top 101 cities with the biggest local government total salary and wages expenses per resident (population 10,000+)"
- #90 on the list of "Top 101 cities with the biggest property tax revenues per resident (population 10,000+)"
- #14 on the list of "Top 101 counties with the lowest percentage of residents relocating from other counties between 2010 and 2011"
- #21 on the list of "Top 101 counties with the largest number of people moving out compared to moving in (pop. 50,000+)"
- #22 on the list of "Top 101 counties with the highest carbon monoxide air pollution readings in 2012 (ppm)"
- #31 on the list of "Top 101 counties with the lowest percentage of residents relocating to other counties in 2011"
- #34 on the list of "Top 101 counties with the lowest percentage of residents that keep firearms around their homes"

|
|
Total of 236 patent applications in 2008-2024.