York, South Carolina Submit your own pictures of this city and show them to the world
OSM Map
General Map
Google Map
MSN Map
OSM Map
General Map
Google Map
MSN Map
OSM Map
General Map
Google Map
MSN Map
OSM Map
General Map
Google Map
MSN Map
Please wait while loading the map...
Population in 2022: 8,648 (97% urban, 3% rural). Population change since 2000: +23.8%Males: 3,974 Females: 4,674
March 2022 cost of living index in York: 90.4 (less than average, U.S. average is 100) Percentage of residents living in poverty in 2022: 17.4%for White Non-Hispanic residents , 18.5% for Black residents , 4.8% for Hispanic or Latino residents , 16.6% for other race residents , 0.2% for two or more races residents )
Profiles of local businesses
Business Search - 14 Million verified businesses
Data:
Median household income ($)
Median household income (% change since 2000)
Household income diversity
Ratio of average income to average house value (%)
Ratio of average income to average rent
Median household income ($) - White
Median household income ($) - Black or African American
Median household income ($) - Asian
Median household income ($) - Hispanic or Latino
Median household income ($) - American Indian and Alaska Native
Median household income ($) - Multirace
Median household income ($) - Other Race
Median household income for houses/condos with a mortgage ($)
Median household income for apartments without a mortgage ($)
Races - White alone (%)
Races - White alone (% change since 2000)
Races - Black alone (%)
Races - Black alone (% change since 2000)
Races - American Indian alone (%)
Races - American Indian alone (% change since 2000)
Races - Asian alone (%)
Races - Asian alone (% change since 2000)
Races - Hispanic (%)
Races - Hispanic (% change since 2000)
Races - Native Hawaiian and Other Pacific Islander alone (%)
Races - Native Hawaiian and Other Pacific Islander alone (% change since 2000)
Races - Two or more races (%)
Races - Two or more races (% change since 2000)
Races - Other race alone (%)
Races - Other race alone (% change since 2000)
Racial diversity
Unemployment (%)
Unemployment (% change since 2000)
Unemployment (%) - White
Unemployment (%) - Black or African American
Unemployment (%) - Asian
Unemployment (%) - Hispanic or Latino
Unemployment (%) - American Indian and Alaska Native
Unemployment (%) - Multirace
Unemployment (%) - Other Race
Population density (people per square mile)
Population - Males (%)
Population - Females (%)
Population - Males (%) - White
Population - Males (%) - Black or African American
Population - Males (%) - Asian
Population - Males (%) - Hispanic or Latino
Population - Males (%) - American Indian and Alaska Native
Population - Males (%) - Multirace
Population - Males (%) - Other Race
Population - Females (%) - White
Population - Females (%) - Black or African American
Population - Females (%) - Asian
Population - Females (%) - Hispanic or Latino
Population - Females (%) - American Indian and Alaska Native
Population - Females (%) - Multirace
Population - Females (%) - Other Race
Coronavirus confirmed cases (Apr 27, 2024)
Deaths caused by coronavirus (Apr 27, 2024)
Coronavirus confirmed cases (per 100k population) (Apr 27, 2024)
Deaths caused by coronavirus (per 100k population) (Apr 27, 2024)
Daily increase in number of cases (Apr 27, 2024)
Weekly increase in number of cases (Apr 27, 2024)
Cases doubled (in days) (Apr 27, 2024)
Hospitalized patients (Apr 18, 2022)
Negative test results (Apr 18, 2022)
Total test results (Apr 18, 2022)
COVID Vaccine doses distributed (per 100k population) (Sep 19, 2023)
COVID Vaccine doses administered (per 100k population) (Sep 19, 2023)
COVID Vaccine doses distributed (Sep 19, 2023)
COVID Vaccine doses administered (Sep 19, 2023)
Likely homosexual households (%)
Likely homosexual households (% change since 2000)
Likely homosexual households - Lesbian couples (%)
Likely homosexual households - Lesbian couples (% change since 2000)
Likely homosexual households - Gay men (%)
Likely homosexual households - Gay men (% change since 2000)
Cost of living index
Median gross rent ($)
Median contract rent ($)
Median monthly housing costs ($)
Median house or condo value ($)
Median house or condo value ($ change since 2000)
Mean house or condo value by units in structure - 1, detached ($)
Mean house or condo value by units in structure - 1, attached ($)
Mean house or condo value by units in structure - 2 ($)
Mean house or condo value by units in structure by units in structure - 3 or 4 ($)
Mean house or condo value by units in structure - 5 or more ($)
Mean house or condo value by units in structure - Boat, RV, van, etc. ($)
Mean house or condo value by units in structure - Mobile home ($)
Median house or condo value ($) - White
Median house or condo value ($) - Black or African American
Median house or condo value ($) - Asian
Median house or condo value ($) - Hispanic or Latino
Median house or condo value ($) - American Indian and Alaska Native
Median house or condo value ($) - Multirace
Median house or condo value ($) - Other Race
Median resident age
Resident age diversity
Median resident age - Males
Median resident age - Females
Median resident age - White
Median resident age - Black or African American
Median resident age - Asian
Median resident age - Hispanic or Latino
Median resident age - American Indian and Alaska Native
Median resident age - Multirace
Median resident age - Other Race
Median resident age - Males - White
Median resident age - Males - Black or African American
Median resident age - Males - Asian
Median resident age - Males - Hispanic or Latino
Median resident age - Males - American Indian and Alaska Native
Median resident age - Males - Multirace
Median resident age - Males - Other Race
Median resident age - Females - White
Median resident age - Females - Black or African American
Median resident age - Females - Asian
Median resident age - Females - Hispanic or Latino
Median resident age - Females - American Indian and Alaska Native
Median resident age - Females - Multirace
Median resident age - Females - Other Race
Commute - mean travel time to work (minutes)
Travel time to work - Less than 5 minutes (%)
Travel time to work - Less than 5 minutes (% change since 2000)
Travel time to work - 5 to 9 minutes (%)
Travel time to work - 5 to 9 minutes (% change since 2000)
Travel time to work - 10 to 19 minutes (%)
Travel time to work - 10 to 19 minutes (% change since 2000)
Travel time to work - 20 to 29 minutes (%)
Travel time to work - 20 to 29 minutes (% change since 2000)
Travel time to work - 30 to 39 minutes (%)
Travel time to work - 30 to 39 minutes (% change since 2000)
Travel time to work - 40 to 59 minutes (%)
Travel time to work - 40 to 59 minutes (% change since 2000)
Travel time to work - 60 to 89 minutes (%)
Travel time to work - 60 to 89 minutes (% change since 2000)
Travel time to work - 90 or more minutes (%)
Travel time to work - 90 or more minutes (% change since 2000)
Marital status - Never married (%)
Marital status - Now married (%)
Marital status - Separated (%)
Marital status - Widowed (%)
Marital status - Divorced (%)
Median family income ($)
Median family income (% change since 2000)
Median non-family income ($)
Median non-family income (% change since 2000)
Median per capita income ($)
Median per capita income (% change since 2000)
Median family income ($) - White
Median family income ($) - Black or African American
Median family income ($) - Asian
Median family income ($) - Hispanic or Latino
Median family income ($) - American Indian and Alaska Native
Median family income ($) - Multirace
Median family income ($) - Other Race
Median year house/condo built
Median year apartment built
Year house built - Built 2005 or later (%)
Year house built - Built 2000 to 2004 (%)
Year house built - Built 1990 to 1999 (%)
Year house built - Built 1980 to 1989 (%)
Year house built - Built 1970 to 1979 (%)
Year house built - Built 1960 to 1969 (%)
Year house built - Built 1950 to 1959 (%)
Year house built - Built 1940 to 1949 (%)
Year house built - Built 1939 or earlier (%)
Average household size
Household density (households per square mile)
Average household size - White
Average household size - Black or African American
Average household size - Asian
Average household size - Hispanic or Latino
Average household size - American Indian and Alaska Native
Average household size - Multirace
Average household size - Other Race
Occupied housing units (%)
Vacant housing units (%)
Owner occupied housing units (%)
Renter occupied housing units (%)
Vacancy status - For rent (%)
Vacancy status - For sale only (%)
Vacancy status - Rented or sold, not occupied (%)
Vacancy status - For seasonal, recreational, or occasional use (%)
Vacancy status - For migrant workers (%)
Vacancy status - Other vacant (%)
Residents with income below the poverty level (%)
Residents with income below 50% of the poverty level (%)
Children below poverty level (%)
Poor families by family type - Married-couple family (%)
Poor families by family type - Male, no wife present (%)
Poor families by family type - Female, no husband present (%)
Poverty status for native-born residents (%)
Poverty status for foreign-born residents (%)
Poverty among high school graduates not in families (%)
Poverty among people who did not graduate high school not in families (%)
Residents with income below the poverty level (%) - White
Residents with income below the poverty level (%) - Black or African American
Residents with income below the poverty level (%) - Asian
Residents with income below the poverty level (%) - Hispanic or Latino
Residents with income below the poverty level (%) - American Indian and Alaska Native
Residents with income below the poverty level (%) - Multirace
Residents with income below the poverty level (%) - Other Race
Air pollution - Air Quality Index (AQI)
Air pollution - CO
Air pollution - NO2
Air pollution - SO2
Air pollution - Ozone
Air pollution - PM10
Air pollution - PM25
Air pollution - Pb
Crime - Murders per 100,000 population
Crime - Rapes per 100,000 population
Crime - Robberies per 100,000 population
Crime - Assaults per 100,000 population
Crime - Burglaries per 100,000 population
Crime - Thefts per 100,000 population
Crime - Auto thefts per 100,000 population
Crime - Arson per 100,000 population
Crime - City-data.com crime index
Crime - Violent crime index
Crime - Property crime index
Crime - Murders per 100,000 population (5 year average)
Crime - Rapes per 100,000 population (5 year average)
Crime - Robberies per 100,000 population (5 year average)
Crime - Assaults per 100,000 population (5 year average)
Crime - Burglaries per 100,000 population (5 year average)
Crime - Thefts per 100,000 population (5 year average)
Crime - Auto thefts per 100,000 population (5 year average)
Crime - Arson per 100,000 population (5 year average)
Crime - City-data.com crime index (5 year average)
Crime - Violent crime index (5 year average)
Crime - Property crime index (5 year average)
1996 Presidential Elections Results (%) - Democratic Party (Clinton)
1996 Presidential Elections Results (%) - Republican Party (Dole)
1996 Presidential Elections Results (%) - Other
2000 Presidential Elections Results (%) - Democratic Party (Gore)
2000 Presidential Elections Results (%) - Republican Party (Bush)
2000 Presidential Elections Results (%) - Other
2004 Presidential Elections Results (%) - Democratic Party (Kerry)
2004 Presidential Elections Results (%) - Republican Party (Bush)
2004 Presidential Elections Results (%) - Other
2008 Presidential Elections Results (%) - Democratic Party (Obama)
2008 Presidential Elections Results (%) - Republican Party (McCain)
2008 Presidential Elections Results (%) - Other
2012 Presidential Elections Results (%) - Democratic Party (Obama)
2012 Presidential Elections Results (%) - Republican Party (Romney)
2012 Presidential Elections Results (%) - Other
2016 Presidential Elections Results (%) - Democratic Party (Clinton)
2016 Presidential Elections Results (%) - Republican Party (Trump)
2016 Presidential Elections Results (%) - Other
2020 Presidential Elections Results (%) - Democratic Party (Biden)
2020 Presidential Elections Results (%) - Republican Party (Trump)
2020 Presidential Elections Results (%) - Other
Ancestries Reported - Arab (%)
Ancestries Reported - Czech (%)
Ancestries Reported - Danish (%)
Ancestries Reported - Dutch (%)
Ancestries Reported - English (%)
Ancestries Reported - French (%)
Ancestries Reported - French Canadian (%)
Ancestries Reported - German (%)
Ancestries Reported - Greek (%)
Ancestries Reported - Hungarian (%)
Ancestries Reported - Irish (%)
Ancestries Reported - Italian (%)
Ancestries Reported - Lithuanian (%)
Ancestries Reported - Norwegian (%)
Ancestries Reported - Polish (%)
Ancestries Reported - Portuguese (%)
Ancestries Reported - Russian (%)
Ancestries Reported - Scotch-Irish (%)
Ancestries Reported - Scottish (%)
Ancestries Reported - Slovak (%)
Ancestries Reported - Subsaharan African (%)
Ancestries Reported - Swedish (%)
Ancestries Reported - Swiss (%)
Ancestries Reported - Ukrainian (%)
Ancestries Reported - United States (%)
Ancestries Reported - Welsh (%)
Ancestries Reported - West Indian (%)
Ancestries Reported - Other (%)
Educational Attainment - No schooling completed (%)
Educational Attainment - Less than high school (%)
Educational Attainment - High school or equivalent (%)
Educational Attainment - Less than 1 year of college (%)
Educational Attainment - 1 or more years of college (%)
Educational Attainment - Associate degree (%)
Educational Attainment - Bachelor's degree (%)
Educational Attainment - Master's degree (%)
Educational Attainment - Professional school degree (%)
Educational Attainment - Doctorate degree (%)
School Enrollment - Nursery, preschool (%)
School Enrollment - Kindergarten (%)
School Enrollment - Grade 1 to 4 (%)
School Enrollment - Grade 5 to 8 (%)
School Enrollment - Grade 9 to 12 (%)
School Enrollment - College undergrad (%)
School Enrollment - Graduate or professional (%)
School Enrollment - Not enrolled in school (%)
School enrollment - Public schools (%)
School enrollment - Private schools (%)
School enrollment - Not enrolled (%)
Median number of rooms in houses and condos
Median number of rooms in apartments
Housing units lacking complete plumbing facilities (%)
Housing units lacking complete kitchen facilities (%)
Density of houses
Urban houses (%)
Rural houses (%)
Households with people 60 years and over (%)
Households with people 65 years and over (%)
Households with people 75 years and over (%)
Households with one or more nonrelatives (%)
Households with no nonrelatives (%)
Population in households (%)
Family households (%)
Nonfamily households (%)
Population in families (%)
Family households with own children (%)
Median number of bedrooms in owner occupied houses
Mean number of bedrooms in owner occupied houses
Median number of bedrooms in renter occupied houses
Mean number of bedrooms in renter occupied houses
Median number of vehichles in owner occupied houses
Mean number of vehichles in owner occupied houses
Median number of vehichles in renter occupied houses
Mean number of vehichles in renter occupied houses
Mortgage status - with mortgage (%)
Mortgage status - with second mortgage (%)
Mortgage status - with home equity loan (%)
Mortgage status - with both second mortgage and home equity loan (%)
Mortgage status - without a mortgage (%)
Average family size
Average family size - White
Average family size - Black or African American
Average family size - Asian
Average family size - Hispanic or Latino
Average family size - American Indian and Alaska Native
Average family size - Multirace
Average family size - Other Race
Geographical mobility - Same house 1 year ago (%)
Geographical mobility - Moved within same county (%)
Geographical mobility - Moved from different county within same state (%)
Geographical mobility - Moved from different state (%)
Geographical mobility - Moved from abroad (%)
Place of birth - Born in state of residence (%)
Place of birth - Born in other state (%)
Place of birth - Native, outside of US (%)
Place of birth - Foreign born (%)
Housing units in structures - 1, detached (%)
Housing units in structures - 1, attached (%)
Housing units in structures - 2 (%)
Housing units in structures - 3 or 4 (%)
Housing units in structures - 5 to 9 (%)
Housing units in structures - 10 to 19 (%)
Housing units in structures - 20 to 49 (%)
Housing units in structures - 50 or more (%)
Housing units in structures - Mobile home (%)
Housing units in structures - Boat, RV, van, etc. (%)
House/condo owner moved in on average (years ago)
Renter moved in on average (years ago)
Year householder moved into unit - Moved in 1999 to March 2000 (%)
Year householder moved into unit - Moved in 1995 to 1998 (%)
Year householder moved into unit - Moved in 1990 to 1994 (%)
Year householder moved into unit - Moved in 1980 to 1989 (%)
Year householder moved into unit - Moved in 1970 to 1979 (%)
Year householder moved into unit - Moved in 1969 or earlier (%)
Means of transportation to work - Drove car alone (%)
Means of transportation to work - Carpooled (%)
Means of transportation to work - Public transportation (%)
Means of transportation to work - Bus or trolley bus (%)
Means of transportation to work - Streetcar or trolley car (%)
Means of transportation to work - Subway or elevated (%)
Means of transportation to work - Railroad (%)
Means of transportation to work - Ferryboat (%)
Means of transportation to work - Taxicab (%)
Means of transportation to work - Motorcycle (%)
Means of transportation to work - Bicycle (%)
Means of transportation to work - Walked (%)
Means of transportation to work - Other means (%)
Working at home (%)
Industry diversity
Most Common Industries - Agriculture, forestry, fishing and hunting, and mining (%)
Most Common Industries - Agriculture, forestry, fishing and hunting (%)
Most Common Industries - Mining, quarrying, and oil and gas extraction (%)
Most Common Industries - Construction (%)
Most Common Industries - Manufacturing (%)
Most Common Industries - Wholesale trade (%)
Most Common Industries - Retail trade (%)
Most Common Industries - Transportation and warehousing, and utilities (%)
Most Common Industries - Transportation and warehousing (%)
Most Common Industries - Utilities (%)
Most Common Industries - Information (%)
Most Common Industries - Finance and insurance, and real estate and rental and leasing (%)
Most Common Industries - Finance and insurance (%)
Most Common Industries - Real estate and rental and leasing (%)
Most Common Industries - Professional, scientific, and management, and administrative and waste management services (%)
Most Common Industries - Professional, scientific, and technical services (%)
Most Common Industries - Management of companies and enterprises (%)
Most Common Industries - Administrative and support and waste management services (%)
Most Common Industries - Educational services, and health care and social assistance (%)
Most Common Industries - Educational services (%)
Most Common Industries - Health care and social assistance (%)
Most Common Industries - Arts, entertainment, and recreation, and accommodation and food services (%)
Most Common Industries - Arts, entertainment, and recreation (%)
Most Common Industries - Accommodation and food services (%)
Most Common Industries - Other services, except public administration (%)
Most Common Industries - Public administration (%)
Occupation diversity
Most Common Occupations - Management, business, science, and arts occupations (%)
Most Common Occupations - Management, business, and financial occupations (%)
Most Common Occupations - Management occupations (%)
Most Common Occupations - Business and financial operations occupations (%)
Most Common Occupations - Computer, engineering, and science occupations (%)
Most Common Occupations - Computer and mathematical occupations (%)
Most Common Occupations - Architecture and engineering occupations (%)
Most Common Occupations - Life, physical, and social science occupations (%)
Most Common Occupations - Education, legal, community service, arts, and media occupations (%)
Most Common Occupations - Community and social service occupations (%)
Most Common Occupations - Legal occupations (%)
Most Common Occupations - Education, training, and library occupations (%)
Most Common Occupations - Arts, design, entertainment, sports, and media occupations (%)
Most Common Occupations - Healthcare practitioners and technical occupations (%)
Most Common Occupations - Health diagnosing and treating practitioners and other technical occupations (%)
Most Common Occupations - Health technologists and technicians (%)
Most Common Occupations - Service occupations (%)
Most Common Occupations - Healthcare support occupations (%)
Most Common Occupations - Protective service occupations (%)
Most Common Occupations - Fire fighting and prevention, and other protective service workers including supervisors (%)
Most Common Occupations - Law enforcement workers including supervisors (%)
Most Common Occupations - Food preparation and serving related occupations (%)
Most Common Occupations - Building and grounds cleaning and maintenance occupations (%)
Most Common Occupations - Personal care and service occupations (%)
Most Common Occupations - Sales and office occupations (%)
Most Common Occupations - Sales and related occupations (%)
Most Common Occupations - Office and administrative support occupations (%)
Most Common Occupations - Natural resources, construction, and maintenance occupations (%)
Most Common Occupations - Farming, fishing, and forestry occupations (%)
Most Common Occupations - Construction and extraction occupations (%)
Most Common Occupations - Installation, maintenance, and repair occupations (%)
Most Common Occupations - Production, transportation, and material moving occupations (%)
Most Common Occupations - Production occupations (%)
Most Common Occupations - Transportation occupations (%)
Most Common Occupations - Material moving occupations (%)
People in Group quarters - Institutionalized population (%)
People in Group quarters - Correctional institutions (%)
People in Group quarters - Federal prisons and detention centers (%)
People in Group quarters - Halfway houses (%)
People in Group quarters - Local jails and other confinement facilities (including police lockups) (%)
People in Group quarters - Military disciplinary barracks (%)
People in Group quarters - State prisons (%)
People in Group quarters - Other types of correctional institutions (%)
People in Group quarters - Nursing homes (%)
People in Group quarters - Hospitals/wards, hospices, and schools for the handicapped (%)
People in Group quarters - Hospitals/wards and hospices for chronically ill (%)
People in Group quarters - Hospices or homes for chronically ill (%)
People in Group quarters - Military hospitals or wards for chronically ill (%)
People in Group quarters - Other hospitals or wards for chronically ill (%)
People in Group quarters - Hospitals or wards for drug/alcohol abuse (%)
People in Group quarters - Mental (Psychiatric) hospitals or wards (%)
People in Group quarters - Schools, hospitals, or wards for the mentally retarded (%)
People in Group quarters - Schools, hospitals, or wards for the physically handicapped (%)
People in Group quarters - Institutions for the deaf (%)
People in Group quarters - Institutions for the blind (%)
People in Group quarters - Orthopedic wards and institutions for the physically handicapped (%)
People in Group quarters - Wards in general hospitals for patients who have no usual home elsewhere (%)
People in Group quarters - Wards in military hospitals for patients who have no usual home elsewhere (%)
People in Group quarters - Juvenile institutions (%)
People in Group quarters - Long-term care (%)
People in Group quarters - Homes for abused, dependent, and neglected children (%)
People in Group quarters - Residential treatment centers for emotionally disturbed children (%)
People in Group quarters - Training schools for juvenile delinquents (%)
People in Group quarters - Short-term care, detention or diagnostic centers for delinquent children (%)
People in Group quarters - Type of juvenile institution unknown (%)
People in Group quarters - Noninstitutionalized population (%)
People in Group quarters - College dormitories (includes college quarters off campus) (%)
People in Group quarters - Military quarters (%)
People in Group quarters - On base (%)
People in Group quarters - Barracks, unaccompanied personnel housing (UPH), (Enlisted/Officer), ;and similar group living quarters for military personnel (%)
People in Group quarters - Transient quarters for temporary residents (%)
People in Group quarters - Military ships (%)
People in Group quarters - Group homes (%)
People in Group quarters - Homes or halfway houses for drug/alcohol abuse (%)
People in Group quarters - Homes for the mentally ill (%)
People in Group quarters - Homes for the mentally retarded (%)
People in Group quarters - Homes for the physically handicapped (%)
People in Group quarters - Other group homes (%)
People in Group quarters - Religious group quarters (%)
People in Group quarters - Dormitories (%)
People in Group quarters - Agriculture workers' dormitories on farms (%)
People in Group quarters - Job Corps and vocational training facilities (%)
People in Group quarters - Other workers' dormitories (%)
People in Group quarters - Crews of maritime vessels (%)
People in Group quarters - Other nonhousehold living situations (%)
People in Group quarters - Other noninstitutional group quarters (%)
Residents speaking English at home (%)
Residents speaking English at home - Born in the United States (%)
Residents speaking English at home - Native, born elsewhere (%)
Residents speaking English at home - Foreign born (%)
Residents speaking Spanish at home (%)
Residents speaking Spanish at home - Born in the United States (%)
Residents speaking Spanish at home - Native, born elsewhere (%)
Residents speaking Spanish at home - Foreign born (%)
Residents speaking other language at home (%)
Residents speaking other language at home - Born in the United States (%)
Residents speaking other language at home - Native, born elsewhere (%)
Residents speaking other language at home - Foreign born (%)
Class of Workers - Employee of private company (%)
Class of Workers - Self-employed in own incorporated business (%)
Class of Workers - Private not-for-profit wage and salary workers (%)
Class of Workers - Local government workers (%)
Class of Workers - State government workers (%)
Class of Workers - Federal government workers (%)
Class of Workers - Self-employed workers in own not incorporated business and Unpaid family workers (%)
House heating fuel used in houses and condos - Utility gas (%)
House heating fuel used in houses and condos - Bottled, tank, or LP gas (%)
House heating fuel used in houses and condos - Electricity (%)
House heating fuel used in houses and condos - Fuel oil, kerosene, etc. (%)
House heating fuel used in houses and condos - Coal or coke (%)
House heating fuel used in houses and condos - Wood (%)
House heating fuel used in houses and condos - Solar energy (%)
House heating fuel used in houses and condos - Other fuel (%)
House heating fuel used in houses and condos - No fuel used (%)
House heating fuel used in apartments - Utility gas (%)
House heating fuel used in apartments - Bottled, tank, or LP gas (%)
House heating fuel used in apartments - Electricity (%)
House heating fuel used in apartments - Fuel oil, kerosene, etc. (%)
House heating fuel used in apartments - Coal or coke (%)
House heating fuel used in apartments - Wood (%)
House heating fuel used in apartments - Solar energy (%)
House heating fuel used in apartments - Other fuel (%)
House heating fuel used in apartments - No fuel used (%)
Armed forces status - In Armed Forces (%)
Armed forces status - Civilian (%)
Armed forces status - Civilian - Veteran (%)
Armed forces status - Civilian - Nonveteran (%)
Fatal accidents locations in years 2005-2021
Fatal accidents locations in 2005
Fatal accidents locations in 2006
Fatal accidents locations in 2007
Fatal accidents locations in 2008
Fatal accidents locations in 2009
Fatal accidents locations in 2010
Fatal accidents locations in 2011
Fatal accidents locations in 2012
Fatal accidents locations in 2013
Fatal accidents locations in 2014
Fatal accidents locations in 2015
Fatal accidents locations in 2016
Fatal accidents locations in 2017
Fatal accidents locations in 2018
Fatal accidents locations in 2019
Fatal accidents locations in 2020
Fatal accidents locations in 2021
Alcohol use - People drinking some alcohol every month (%)
Alcohol use - People not drinking at all (%)
Alcohol use - Average days/month drinking alcohol
Alcohol use - Average drinks/week
Alcohol use - Average days/year people drink much
Audiometry - Average condition of hearing (%)
Audiometry - People that can hear a whisper from across a quiet room (%)
Audiometry - People that can hear normal voice from across a quiet room (%)
Audiometry - Ears ringing, roaring, buzzing (%)
Audiometry - Had a job exposure to loud noise (%)
Audiometry - Had off-work exposure to loud noise (%)
Blood Pressure & Cholesterol - Has high blood pressure (%)
Blood Pressure & Cholesterol - Checking blood pressure at home (%)
Blood Pressure & Cholesterol - Frequently checking blood cholesterol (%)
Blood Pressure & Cholesterol - Has high cholesterol level (%)
Consumer Behavior - Money monthly spent on food at supermarket/grocery store
Consumer Behavior - Money monthly spent on food at other stores
Consumer Behavior - Money monthly spent on eating out
Consumer Behavior - Money monthly spent on carryout/delivered foods
Consumer Behavior - Income spent on food at supermarket/grocery store (%)
Consumer Behavior - Income spent on food at other stores (%)
Consumer Behavior - Income spent on eating out (%)
Consumer Behavior - Income spent on carryout/delivered foods (%)
Current Health Status - General health condition (%)
Current Health Status - Blood donors (%)
Current Health Status - Has blood ever tested for HIV virus (%)
Current Health Status - Left-handed people (%)
Dermatology - People using sunscreen (%)
Diabetes - Diabetics (%)
Diabetes - Had a blood test for high blood sugar (%)
Diabetes - People taking insulin (%)
Diet Behavior & Nutrition - Diet health (%)
Diet Behavior & Nutrition - Milk product consumption (# of products/month)
Diet Behavior & Nutrition - Meals not home prepared (#/week)
Diet Behavior & Nutrition - Meals from fast food or pizza place (#/week)
Diet Behavior & Nutrition - Ready-to-eat foods (#/month)
Diet Behavior & Nutrition - Frozen meals/pizza (#/month)
Drug Use - People that ever used marijuana or hashish (%)
Drug Use - Ever used hard drugs (%)
Drug Use - Ever used any form of cocaine (%)
Drug Use - Ever used heroin (%)
Drug Use - Ever used methamphetamine (%)
Health Insurance - People covered by health insurance (%)
Kidney Conditions-Urology - Avg. # of times urinating at night
Medical Conditions - People with asthma (%)
Medical Conditions - People with anemia (%)
Medical Conditions - People with psoriasis (%)
Medical Conditions - People with overweight (%)
Medical Conditions - Elderly people having difficulties in thinking or remembering (%)
Medical Conditions - People who ever received blood transfusion (%)
Medical Conditions - People having trouble seeing even with glass/contacts (%)
Medical Conditions - People with arthritis (%)
Medical Conditions - People with gout (%)
Medical Conditions - People with congestive heart failure (%)
Medical Conditions - People with coronary heart disease (%)
Medical Conditions - People with angina pectoris (%)
Medical Conditions - People who ever had heart attack (%)
Medical Conditions - People who ever had stroke (%)
Medical Conditions - People with emphysema (%)
Medical Conditions - People with thyroid problem (%)
Medical Conditions - People with chronic bronchitis (%)
Medical Conditions - People with any liver condition (%)
Medical Conditions - People who ever had cancer or malignancy (%)
Mental Health - People who have little interest in doing things (%)
Mental Health - People feeling down, depressed, or hopeless (%)
Mental Health - People who have trouble sleeping or sleeping too much (%)
Mental Health - People feeling tired or having little energy (%)
Mental Health - People with poor appetite or overeating (%)
Mental Health - People feeling bad about themself (%)
Mental Health - People who have trouble concentrating on things (%)
Mental Health - People moving or speaking slowly or too fast (%)
Mental Health - People having thoughts they would be better off dead (%)
Oral Health - Average years since last visit a dentist
Oral Health - People embarrassed because of mouth (%)
Oral Health - People with gum disease (%)
Oral Health - General health of teeth and gums (%)
Oral Health - Average days a week using dental floss/device
Oral Health - Average days a week using mouthwash for dental problem
Oral Health - Average number of teeth
Pesticide Use - Households using pesticides to control insects (%)
Pesticide Use - Households using pesticides to kill weeds (%)
Physical Activity - People doing vigorous-intensity work activities (%)
Physical Activity - People doing moderate-intensity work activities (%)
Physical Activity - People walking or bicycling (%)
Physical Activity - People doing vigorous-intensity recreational activities (%)
Physical Activity - People doing moderate-intensity recreational activities (%)
Physical Activity - Average hours a day doing sedentary activities
Physical Activity - Average hours a day watching TV or videos
Physical Activity - Average hours a day using computer
Physical Functioning - People having limitations keeping them from working (%)
Physical Functioning - People limited in amount of work they can do (%)
Physical Functioning - People that need special equipment to walk (%)
Physical Functioning - People experiencing confusion/memory problems (%)
Physical Functioning - People requiring special healthcare equipment (%)
Prescription Medications - Average number of prescription medicines taking
Preventive Aspirin Use - Adults 40+ taking low-dose aspirin (%)
Reproductive Health - Vaginal deliveries (%)
Reproductive Health - Cesarean deliveries (%)
Reproductive Health - Deliveries resulted in a live birth (%)
Reproductive Health - Pregnancies resulted in a delivery (%)
Reproductive Health - Women breastfeeding newborns (%)
Reproductive Health - Women that had a hysterectomy (%)
Reproductive Health - Women that had both ovaries removed (%)
Reproductive Health - Women that have ever taken birth control pills (%)
Reproductive Health - Women taking birth control pills (%)
Reproductive Health - Women that have ever used Depo-Provera or injectables (%)
Reproductive Health - Women that have ever used female hormones (%)
Sexual Behavior - People 18+ that ever had sex (vaginal, anal, or oral) (%)
Sexual Behavior - Males 18+ that ever had vaginal sex with a woman (%)
Sexual Behavior - Males 18+ that ever performed oral sex on a woman (%)
Sexual Behavior - Males 18+ that ever had anal sex with a woman (%)
Sexual Behavior - Males 18+ that ever had any sex with a man (%)
Sexual Behavior - Females 18+ that ever had vaginal sex with a man (%)
Sexual Behavior - Females 18+ that ever performed oral sex on a man (%)
Sexual Behavior - Females 18+ that ever had anal sex with a man (%)
Sexual Behavior - Females 18+ that ever had any kind of sex with a woman (%)
Sexual Behavior - Average age people first had sex
Sexual Behavior - Average number of female sex partners in lifetime (males 18+)
Sexual Behavior - Average number of female vaginal sex partners in lifetime (males 18+)
Sexual Behavior - Average age people first performed oral sex on a woman (18+)
Sexual Behavior - Average number of woman performed oral sex on in lifetime (18+)
Sexual Behavior - Average number of male sex partners in lifetime (males 18+)
Sexual Behavior - Average number of male anal sex partners in lifetime (males 18+)
Sexual Behavior - Average age people first performed oral sex on a man (18+)
Sexual Behavior - Average number of male oral sex partners in lifetime (18+)
Sexual Behavior - People using protection when performing oral sex (%)
Sexual Behavior - Average number of times people have vaginal or anal sex a year
Sexual Behavior - People having sex without condom (%)
Sexual Behavior - Average number of male sex partners in lifetime (females 18+)
Sexual Behavior - Average number of male vaginal sex partners in lifetime (females 18+)
Sexual Behavior - Average number of female sex partners in lifetime (females 18+)
Sexual Behavior - Circumcised males 18+ (%)
Sleep Disorders - Average hours sleeping at night
Sleep Disorders - People that has trouble sleeping (%)
Smoking-Cigarette Use - People smoking cigarettes (%)
Taste & Smell - People 40+ having problems with smell (%)
Taste & Smell - People 40+ having problems with taste (%)
Taste & Smell - People 40+ that ever had wisdom teeth removed (%)
Taste & Smell - People 40+ that ever had tonsils teeth removed (%)
Taste & Smell - People 40+ that ever had a loss of consciousness because of a head injury (%)
Taste & Smell - People 40+ that ever had a broken nose or other serious injury to face or skull (%)
Taste & Smell - People 40+ that ever had two or more sinus infections (%)
Weight - Average height (inches)
Weight - Average weight (pounds)
Weight - Average BMI
Weight - People that are obese (%)
Weight - People that ever were obese (%)
Weight - People trying to lose weight (%)
Officers per 1,000 residents here:
4.24South Carolina average:
2.21
Latest news from York, SC collected exclusively by city-data.com from local newspapers, TV, and radio stations
Ancestries: American (12.5%), English (7.6%), Irish (4.1%), German (2.9%), Scottish (2.7%), Scotch-Irish (1.5%).
Current Local Time:
Incorporated on 12/07/1841
Land area: 7.87 square miles.
Population density: 1,099 people per square mile (low).
369 residents are foreign born (3.5% Latin America ).
This city:
4.2%South Carolina:
5.3%
Median real estate property taxes paid for housing units with mortgages in 2022: $1,598 (0.6%)Median real estate property taxes paid for housing units with no mortgage in 2022: $425 (0.5%)
Nearest city with pop. 50,000+: Gastonia, NC
Nearest city with pop. 200,000+: Charlotte, NC
Nearest city with pop. 1,000,000+: Philadelphia, PA
Nearest cities:
Smyrna, SC (3.2 miles),
Latitude: 34.99 N, Longitude: 81.24 W
Daytime population change due to commuting: +3,153 (+35.5%)Workers who live and work in this city: 1,608 (37.6%)
Property values in York, SC
Single-family new house construction building permits:
2022: 254 buildings , average cost: $302,8002021: 42 buildings , average cost: $213,0002020: 63 buildings , average cost: $247,7002019: 88 buildings , average cost: $256,3002018: 79 buildings , average cost: $269,8002017: 32 buildings , average cost: $200,2002016: 38 buildings , average cost: $245,7002015: 12 buildings , average cost: $193,6002014: 8 buildings , average cost: $185,6002013: 8 buildings , average cost: $175,5002012: 6 buildings , average cost: $214,7002011: 5 buildings , average cost: $176,8002010: 19 buildings , average cost: $168,1002009: 39 buildings , average cost: $180,1002008: 25 buildings , average cost: $173,2002007: 89 buildings , average cost: $129,1002006: 83 buildings , average cost: $108,7002005: 32 buildings , average cost: $93,5002004: 81 buildings , average cost: $105,9002003: 49 buildings , average cost: $100,8002002: 3 buildings , average cost: $100,700Unemployment in December 2023: Here:
2.9%South Carolina:
3.1%
Population change in the 1990s: +256 (+3.8%).
Most common occupations in York, SC (%)
Both Males Females
Other production occupations, including supervisors (7.7%)
Laborers and material movers, hand (6.3%)
Building and grounds cleaning and maintenance occupations (5.3%)
Textile, apparel, and furnishings workers (4.4%)
Metal workers and plastic workers (4.1%)
Material recording, scheduling, dispatching, and distributing workers (4.1%)
Other management occupations, except farmers and farm managers (3.3%)
Laborers and material movers, hand (9.6%)
Other production occupations, including supervisors (9.6%)
Building and grounds cleaning and maintenance occupations (6.5%)
Metal workers and plastic workers (5.8%)
Electrical equipment mechanics and other installation, maintenance, and repair workers, including supervisors (5.2%)
Driver/sales workers and truck drivers (5.2%)
Sales representatives, services, wholesale and manufacturing (3.6%)
Textile, apparel, and furnishings workers (6.4%)
Other production occupations, including supervisors (5.8%)
Material recording, scheduling, dispatching, and distributing workers (4.7%)
Secretaries and administrative assistants (4.5%)
Other management occupations, except farmers and farm managers (4.2%)
Other sales and related occupations, including supervisors (4.2%)
Building and grounds cleaning and maintenance occupations (4.1%)
Tornado activity:
York-area historical tornado activity is near South Carolina state average. It is 17% greater than the overall U.S. average.
On 5/5/1989, a category F4 (max. wind speeds 207-260 mph) tornado 28.9 miles away from the York city center killed one person and injured 6 people and caused between $5,000,000 and $50,000,000 in damages.
On 3/27/1994, a category F3 (max. wind speeds 158-206 mph) tornado 14.4 miles away from the city center injured 2 people and caused between $5,000,000 and $50,000,000 in damages.
Earthquake activity:
York-area historical earthquake activity is significantly above South Carolina state average. It is 13% smaller than the overall U.S. average. On 8/9/2020 at 12:07:37, a magnitude 5.1 (5.1 MW, Depth: 4.7 mi, Class: Moderate, Intensity: VI - VII) earthquake occurred 102.8 miles away from York center On 8/23/2011 at 17:51:04, a magnitude 5.8 (5.8 MW, Depth: 3.7 mi) earthquake occurred 272.8 miles away from the city center On 8/2/1974 at 08:52:09, a magnitude 4.9 (4.3 MB, 4.9 LG, Class: Light, Intensity: IV - V) earthquake occurred 105.4 miles away from York center On 11/22/1974 at 05:25:55, a magnitude 4.7 (4.7 MB) earthquake occurred 157.9 miles away from the city center On 11/30/1973 at 07:48:41, a magnitude 4.7 (4.7 MB, 4.6 ML) earthquake occurred 163.3 miles away from the city center On 7/27/1980 at 18:52:21, a magnitude 5.2 (5.1 MB, 4.7 MS, 5.0 UK, 5.2 UK) earthquake occurred 268.0 miles away from York center Magnitude types: regional Lg-wave magnitude (LG), body-wave magnitude (MB), local magnitude (ML), surface-wave magnitude (MS), moment magnitude (MW) Natural disasters: The number of natural disasters in York County (11) is smaller than the US average (15).Major Disasters (Presidential) Declared: 4Emergencies Declared: 5Hurricanes: 4, Winter Storms: 2, Drought: 1, Flood: 1, Ice Storm: 1, Storm: 1, Tropical Storm: 1, Other: 1 (Note: some incidents may be assigned to more than one category). Hospitals and medical centers in York: DIVINE SAVIOUR HOSPITAL (provides emergency services, 111 S CONGRESS ST) WHITE OAK MANOR - YORK (111 SOUTH CONGRESS STREET)
FRESENIUS OF YORK (1440 E ALEXANDER LOVE HWY)
Amtrak station near York: 20 miles: GASTONIA (350 HANCOCK ST.) Services: enclosed waiting area, public restrooms, public payphones, free short-term parking, free long-term parking, call for taxi service.
Operable nuclear power plants near York:
9 miles: Catawba 1 and 2 in Clover, SC.
Colleges/universities with over 2000 students nearest to York:
Winthrop University (about 13 miles; Rock Hill, SC ; Full-time enrollment: 5,575)
York Technical College (about 15 miles; Rock Hill, SC ; FT enrollment: 3,572)
Gaston College (about 23 miles; Dallas, NC ; FT enrollment: 4,385)
Limestone College (about 24 miles; Gaffney, SC ; FT enrollment: 2,758)
Cleveland Community College (about 25 miles; Shelby, NC ; FT enrollment: 2,541)
Queens University of Charlotte (about 27 miles; Charlotte, NC ; FT enrollment: 2,083)
Johnson & Wales University-Charlotte (about 28 miles; Charlotte, NC ; FT enrollment: 2,518)
Public high schools in York:
Private high school in York: BLESSED HOPE BAPTIST SCHOOL Students: 177, Location: 410 BLESSED HOPE RD, Grades: PK-12)
Public elementary/middle schools in York: YORK INTERMEDIATE Students: 704, Location: 1280 JOHNSON ROAD, Grades: 5-6)HUNTER STREET ELEMENTARY Students: 653, Location: 1100 HUNTER STREET, Grades: PK-4)COTTON BELT ELEMENTARY Students: 604, Location: 1176 BLACK HIGHWAY, Grades: PK-4)JEFFERSON ELEMENTARY Location: 1543 CHESTER HIGHWAY, Grades: PK-4)
YORK MIDDLE Location: 1010 DEVINNEY ROAD, Grades: 7-8)
HAROLD C. JOHNSON ELEMENTARY Location: 400 EAST JEFFERSON STREET, Grades: PK-4)
See full list of schools located in York
Notable locations in York: (A) , York City Hall (B) , York County Courthouse (C) , York Public Library (D) , York Fire Department (E) , Episcopal Childrens Home (F) . Display/hide their locations on the map
Shopping Center: (1) . Display/hide its location on the map
Churches in York include: (A) , Bright Light Freewill Baptist Church (B) , Central Baptist Church (C) , Church of God (D) , Church of God of Prophecy (E) , Church of the Nazarene (F) , Divine Savior Catholic Church (G) , Episcopal Church of the Good Shepherd (H) , First Baptist Church (I) . Display/hide their locations on the map
Cemeteries: (1) , Union Cemetery (2) . Display/hide their locations on the map
Reservoirs: (A) , Upper York Reservoir (B) . Display/hide their locations on the map
Park in York: (1) . Display/hide its location on the map
Tourist attractions:
Hotel:
Courts:
Birthplace of: Charles Randolph-Wright - Film director, Ernest Dixon (American football) - Football player, Stanyarne Wilson - Politician.
York County has a predicted average indoor radon screening level between 2 and 4 pCi/L (pico curies per liter) - Moderate Potential Drinking water stations with addresses in York and their reported violations in the past:
MCAFEES MHP (4660008) (Population served: 100, Groundwater):
Past health violations:
MCL, Monthly (TCR) - In JUN-2014, Contaminant: Coliform
MCL, Monthly (TCR) - In JUN-2013, Contaminant: Coliform. Follow-up actions: St Public Notif received (JUL-11-2013), St Violation/Reminder Notice (AUG-01-2013), St Public Notif requested (AUG-01-2013), St Formal NOV issued (DEC-04-2013), St Show-cause Hearing (DEC-17-2013), St Compliance achieved (FEB-05-2014), St AO (w/penalty) issued (MAR-07-2014), St Admin Penalty assessed (MAR-07-2014)
MCL, Monthly (TCR) - In JAN-2009, Contaminant: Coliform. Follow-up actions: St Public Notif requested (MAR-03-2009), St Violation/Reminder Notice (MAR-03-2009), St Public Notif received (MAR-17-2009), St Compliance achieved (APR-08-2010)
Past monitoring violations:
Monitoring, Repeat Major (TCR) - In DEC-2012, Contaminant: Coliform (TCR). Follow-up actions: St Compliance achieved (FEB-21-2013)
4 routine major monitoring violations
One minor monitoring violation
Population served: 25, Groundwater):
Past health violations:
MCL, Monthly (TCR) - In SEP-2007, Contaminant: Coliform. Follow-up actions: St Public Notif requested (NOV-09-2007), St Violation/Reminder Notice (NOV-09-2007), St Compliance achieved (APR-01-2011)
Past monitoring violations:
One routine major monitoring violation
One minor monitoring violation
Drinking water stations with addresses in York that have no violations reported:
GOODS MHP (4660098) (Population served: 128, Primary Water Source Type: Groundwater)
CARROLL MHP 2 (4660088) (Population served: 66, Primary Water Source Type: Groundwater)
Average household size: This city:
2.6 peopleSouth Carolina:
2.5 people
Percentage of family households: This city:
67.5%Whole state:
67.5%
Percentage of households with unmarried partners: This city:
7.9%Whole state:
6.0%
Likely homosexual households (counted as self-reported same-sex unmarried-partner households)
Lesbian couples: 0.5% of all households Gay men: 0.3% of all households
People in group quarters in York in 2010:
193 people in nursing facilities/skilled-nursing facilities
28 people in residential treatment centers for juveniles (non-correctional)
8 people in group homes intended for adults
2 people in emergency and transitional shelters (with sleeping facilities) for people experiencing homelessness
People in group quarters in York in 2000:
99 people in nursing homes
87 people in other noninstitutional group quarters
34 people in mental (psychiatric) hospitals or wards
32 people in schools, hospitals, or wards for the intellectually disabled
24 people in agriculture workers' dormitories on farms
Banks with branches in York (2011 data):
Bank of York: East Liberty Street Branch at East Liberty Street Extension, branch established on 1973/09/27; Bank Of York at 13 W Liberty St, branch established on 1935/04/15. Info updated 2006/11/03: Bank assets: $181.9 mil, Deposits: $152.6 mil, local headquarters , positive income , 4 total offices , Holding Company: York Bancshares, Inc.
First Citizens Bank and Trust Company, Inc.: Congress Street Branch at 12 North Congress Street, branch established on 1933/03/09; York Branch at 911 East Liberty Street, branch established on 2001/05/07. Info updated 2011/08/24: Bank assets: $8,104.0 mil, Deposits: $6,880.8 mil, headquarters in Columbia, SC, positive income , 197 total offices , Holding Company: First Citizens Bancorporation, Inc.
Woodforest National Bank: Sc York at 970 East Liberty Street, branch established on 2010/02/13. Info updated 2011/05/10: Bank assets: $3,488.9 mil, Deposits: $3,097.6 mil, headquarters in Houston, TX, positive income , Commercial Lending Specialization, 766 total offices , Holding Company: Woodforest Financial Group Employee Stock Ownership Plan (With 401(K) Provisions)
SCBT National Association: York Branch at 801 E. Liberty Street, branch established on 1999/01/12. Info updated 2011/08/01: Bank assets: $3,893.8 mil, Deposits: $3,257.7 mil, headquarters in Orangeburg, SC, positive income , Commercial Lending Specialization, 79 total offices , Holding Company: Scbt Financial Corporation
For population 15 years and over in York:
Never married: 37.4%Now married: 39.0%Separated: 1.7%Widowed: 7.2%Divorced: 14.8% For population 25 years and over in York:
High school or higher: 82.9%Bachelor's degree or higher: 17.7%Graduate or professional degree: 6.3%Unemployed: 7.0%Mean travel time to work (commute): 25.5 minutes
Education Gini index (Inequality in education) Here:
16.8South Carolina average:
11.1
Religion statistics for York, SC (based on York County data)
Religion Adherents Congregations Evangelical Protestant 67,634 215 Mainline Protestant 20,901 60 Catholic 14,030 5 Black Protestant 5,605 34 Other 4,121 11 Orthodox 15 1 None 113,767 -
Source: Clifford Grammich, Kirk Hadaway, Richard Houseal, Dale E.Jones, Alexei Krindatch, Richie Stanley and Richard H.Taylor. 2012. 2010 U.S.Religion Census: Religious Congregations & Membership Study. Association of Statisticians of American Religious Bodies. Jones, Dale E., et al. 2002. Congregations and Membership in the United States 2000. Nashville, TN: Glenmary Research Center. Graphs represent county-level data
Food Environment Statistics: Number of grocery stores : 40York County :
1.92 / 10,000 pop.State :
1.99 / 10,000 pop.
Number of supercenters and club stores : 2Here :
0.10 / 10,000 pop.South Carolina :
0.15 / 10,000 pop.
Number of convenience stores (no gas) : 16York County :
0.77 / 10,000 pop.State :
0.85 / 10,000 pop.
Number of convenience stores (with gas) : 97This county :
4.65 / 10,000 pop.South Carolina :
5.38 / 10,000 pop.
Number of full-service restaurants : 117York County :
5.61 / 10,000 pop.South Carolina :
7.75 / 10,000 pop.
Adult diabetes rate : York County :
8.8%South Carolina :
10.6%
Adult obesity rate : York County :
28.0%South Carolina :
29.4%
Low-income preschool obesity rate : Here :
14.0%South Carolina :
13.4%
Health and Nutrition: Healthy diet rate : Here:
46.9%South Carolina:
49.2%
Average overall health of teeth and gums : York:
43.7%South Carolina:
46.2%
Average BMI : This city:
29.5South Carolina:
29.0
People feeling badly about themselves : People not drinking alcohol at all : York:
12.4%South Carolina:
11.0%
Average hours sleeping at night : This city:
6.8South Carolina:
6.8
Overweight people : Here:
34.8%South Carolina:
34.4%
General health condition : Average condition of hearing : York:
79.4%South Carolina:
79.9%
More about Health and Nutrition of York, SC Residents
Local government employment and payroll (March 2022)
Function
Full-time employees
Monthly full-time payroll
Average yearly full-time wage
Part-time employees
Monthly part-time payroll
Police Protection - Officers
36 $163,363 $54,454 0 $0 Firefighters
11 $47,326 $51,628 0 $0 Solid Waste Management
8 $29,698 $44,547 1 $992 Police - Other
7 $26,498 $45,425 0 $0 Water Supply
7 $28,626 $49,073 0 $0 Financial Administration
6 $25,285 $50,570 0 $0 Other Government Administration
6 $15,248 $30,496 7 $4,429 Parks and Recreation
6 $25,075 $50,150 5 $1,771 Sewerage
3 $16,585 $66,340 1 $1,147 Fire - Other
1 $3,386 $40,632 0 $0 Judicial and Legal
1 $3,151 $37,812 3 $717
Totals for Government
92 $384,241 $50,118 17 $9,056
York government finances - Expenditure in 2017 (per resident):
Current Operations - Police Protection: $2,799,000 ($323.66)
Water Utilities: $1,262,000 ($145.93)Solid Waste Management: $1,130,000 ($130.67)Local Fire Protection: $918,000 ($106.15)Parks and Recreation: $792,000 ($91.58)Central Staff Services: $555,000 ($64.18)Sewerage: $533,000 ($61.63)Financial Administration: $486,000 ($56.20)General Public Buildings: $205,000 ($23.70)General - Other: $193,000 ($22.32)Judicial and Legal Services: $145,000 ($16.77)Regular Highways: $117,000 ($13.53)General - Interest on Debt: $36,000 ($4.16)
Intergovernmental to Local - Other - Water Utilities: $461,000 ($53.31)
Other - Judicial and Legal Services: $14,000 ($1.62)Other - Financial Administration: $4,000 ($0.46)Other - Correctional Institutions: $2,000 ($0.23)Other Capital Outlay - Sewerage: $789,000 ($91.23)
Water Utilities: $437,000 ($50.53)General Public Building: $117,000 ($13.53)Local Fire Protection: $106,000 ($12.26)Police Protection: $102,000 ($11.79)Solid Waste Management: $88,000 ($10.18)Parks and Recreation: $33,000 ($3.82)Total Salaries and Wages: $4,558,000 ($527.06)
York government finances - Revenue in 2017 (per resident):
Charges - Solid Waste Management: $927,000 ($107.19)
Parks and Recreation: $100,000 ($11.56)Other: $5,000 ($0.58)Local Intergovernmental - Other: $221,000 ($25.56)
Miscellaneous - General Revenue - Other: $1,785,000 ($206.41)
Fines and Forfeits: $89,000 ($10.29)Donations From Private Sources: $18,000 ($2.08)Interest Earnings: $12,000 ($1.39)Rents: $3,000 ($0.35)Revenue - Water Utilities: $3,280,000 ($379.28)
State Intergovernmental - General Local Government Support: $330,000 ($38.16)
Tax - Property: $3,089,000 ($357.19)
Other Selective Sales: $527,000 ($60.94)Occupation and Business License - Other: $486,000 ($56.20)
York government finances - Debt in 2017 (per resident):
Long Term Debt - Beginning Outstanding - Unspecified Public Purpose: $909,000 ($105.11)
Outstanding Unspecified Public Purpose: $766,000 ($88.58)Retired Unspecified Public Purpose: $142,000 ($16.42)
York government finances - Cash and Securities in 2017 (per resident):
Other Funds - Cash and Securities: $5,189,000 ($600.02)
Businesses in York, SC
Name Count Name Count
Advance Auto Parts 1 Nike 1 AutoZone 1 Papa John's Pizza 1 Burger King 1 Pizza Hut 1 Chevrolet 1 Rite Aid 1 Circle K 1 SONIC Drive-In 1 Days Inn 1 Subway 2 Domino's Pizza 1 T-Mobile 1 FedEx 3 U-Haul 3 Ford 1 UPS 2 H&R Block 1 Walgreens 1 KFC 1 Walmart 1 La-Z-Boy 1 Wendy's 1 Lowe's 1 YMCA 2 McDonald's 1
Strongest AM radio stations in York:
WBT (1110 AM; 50 kW; CHARLOTTE, NC; Owner: JEFFERSON-PILOT COMMUNICATNS CO. OF NORTH CAROLINA)
WAGL (1560 AM; daytime; 50 kW; LANCASTER, SC; Owner: PALMETTO BROADCASTING SYSTEM, INC.)
WLTC (1370 AM; 20 kW; GASTONIA, NC)
WBCU (1460 AM; 50 kW; UNION, SC)
WBZK (980 AM; 3 kW; YORK, SC; Owner: CAROLINA METRO RADIO, LLC)
WCGC (1270 AM; 10 kW; BELMONT, NC; Owner: WHVN, INC.)
WCEO (840 AM; daytime; 50 kW; COLUMBIA, SC; Owner: EASTERN BROADCASTING GROUP, INC.)
WHKY (1290 AM; 50 kW; HICKORY, NC; Owner: LONG COMMUNICATIONS, LLC.)
WLFJ (660 AM; daytime; 50 kW; GREENVILLE, SC; Owner: CLEAR CHANNEL BROADCASTING LICENSES, INC.)
WBAJ (890 AM; daytime; 50 kW; BLYTHEWOOD, SC; Owner: FAMILY FIRST)
WCSZ (1070 AM; 50 kW; SANS SOUCI, SC; Owner: WHYZ RADIO, L.P.)
WFNZ (610 AM; 5 kW; CHARLOTTE, NC; Owner: INFINITY RADIO SUBSIDIARY OPERATIONS INC.)
WFGW (1010 AM; 50 kW; BLACK MOUNTAIN, NC; Owner: BLUE RIDGE BROADCASTING CORP.)
Strongest FM radio stations in York:
WBAV-FM (101.9 FM; GASTONIA, NC; Owner: INFINITY RADIO SUBSIDIARY OPERATIONS INC.)
WLNK (107.9 FM; CHARLOTTE, NC; Owner: JEFFERSON-PILOT COMMUNICATIONS COMPANY OF NORTH CAROLINA)
WWMG (96.1 FM; SHELBY, NC; Owner: CLEAR CHANNEL BROADCASTING LICENSES, INC.)
WKKT (96.9 FM; STATESVILLE, NC; Owner: CAPSTAR TX LIMITED PARTNERSHIP)
WPEG (97.9 FM; CONCORD, NC; Owner: INFINITY RADIO SUBSIDIARY OPERATIONS INC.)
WNKS (95.1 FM; CHARLOTTE, NC; Owner: INFINITY RADIO SUBSIDIARY OPERATIONS INC.)
W219CH (91.7 FM; LOWRYS, SC; Owner: RICHBURG EDUCATIONAL BROADCASTERS, INC.)
WBT-FM (99.3 FM; CHESTER, SC; Owner: JEFFERSON-PILOT COMMUNICATIONS COMPANY OF NORTH CAROLINA)
WLYT (102.9 FM; HICKORY, NC; Owner: CAPSTAR TX LIMITED PARTNERSHIP)
WRFX-FM (99.7 FM; KANNAPOLIS, NC; Owner: CAPSTAR TX LIMITED PARTNERSHIP)
WNSC-FM (88.9 FM; ROCK HILL, SC; Owner: SOUTH CAROLINA EDUCATIONAL TV COMMISSION)
WSGE (91.7 FM; DALLAS, NC; Owner: GASTON COLLEGE)
WSOC-FM (103.7 FM; CHARLOTTE, NC; Owner: INFINITY RADIO SUBSIDIARY OPERATIONS INC.)
WSSL-FM (100.5 FM; GRAY COURT, SC; Owner: CAPSTAR TX LIMITED PARTNERSHIP)
WSSS (104.7 FM; CHARLOTTE, NC; Owner: INFINITY RADIO SUBSIDIARY OPERATIONS INC.)
WAGI-FM (105.3 FM; GAFFNEY, SC; Owner: GAFFNEY BROADCASTING, INC.)
WXRC (95.7 FM; HICKORY, NC; Owner: PACIFIC BROADCASTING GROUP, INC.)
WMIT (106.9 FM; BLACK MOUNTAIN, NC; Owner: BLUE RIDGE BROADCASTING CORPORATION)
WNCW (88.7 FM; SPINDALE, NC; Owner: ISOTHERMAL COMMUNITY COLLEGE)
WTPT (93.3 FM; FOREST CITY, NC; Owner: UPSTATE BROADCASTING, LLC)
TV broadcast stations around York:
WBTV (Channel 3; CHARLOTTE, NC; Owner: JEFFERSON-PILOT COMMUNICATIONS/WBTV, INC.)
WCNC-TV (Channel 36; CHARLOTTE, NC; Owner: WCNC-TV, INC.)
WJZY (Channel 46; BELMONT, NC; Owner: WJZY-TV, INC.)
WWWB (Channel 55; ROCK HILL, SC; Owner: WWWB-TV, INC.)
WNSC-TV (Channel 30; ROCK HILL, SC; Owner: SOUTH CAROLINA EDUCATIONAL TV COMMISSION)
WAFF (Channel 48; HUNTSVILLE, AL; Owner: RAYCOM AMERICA, INC.)
WSOC-TV (Channel 9; CHARLOTTE, NC; Owner: WSOC-TV HOLDINGS, INC.)
WGTB-LP (Channel 28; CHARLOTTE, NC; Owner: VICTORY CHRISTIAN CENTER, INC.)
WCCB (Channel 18; CHARLOTTE, NC; Owner: NORTH CAROLINA BROADCASTING PARTNERS)
WTVI (Channel 42; CHARLOTTE, NC; Owner: CHARLOTTE-MECKLENBURG PUBLIC BROADCASTING AUTHORITY)
WUNG-TV (Channel 58; CONCORD, NC; Owner: UNIVERSITY OF NORTH CAROLINA)
WRET-TV (Channel 49; SPARTANBURG, SC; Owner: SOUTH CAROLINA EDUCATIONAL TV COMMISSION)
WAXN (Channel 64; KANNAPOLIS, NC; Owner: WSOC-TV HOLDINGS, INC.)
W38CN (Channel 38; CHARLOTTE, NC; Owner: NATIONAL MINORITY T.V., INC.)
W25BR (Channel 25; CHARLOTTE, NC; Owner: WORD OF GOD FELLOWSHIP, INC.)
WSQY-LP (Channel 66; SPARTANBURG, SC; Owner: ASHEVILLE MEDIA GROUP, LLC)
W34BN (Channel 34; CHARLOTTE, NC; Owner: THREE ANGELS BROADCASTING NETWORK)
W52CW (Channel 52; CHARLOTTE, NC; Owner: TRINITY BROADCASTING NETWORK)
National Bridge Inventory (NBI) Statistics 27 Number of bridges174ft / 53.1m Total length $2,045,000 Total costs82,481 Total average daily traffic7,322 Total average daily truck traffic128,424 Total future (year 2037) average daily traffic
New bridges - historical statistics
1 1920-1929 3 1930-1939 1 1940-1949 4 1950-1959 3 1960-1969 2 1970-1979 2 1980-1989 3 1990-1999 5 2000-2009 3 2010-2019
See full National Bridge Inventory statistics for York, SC
Home Mortgage Disclosure Act Aggregated Statistics For Year 2009(Based on 3 partial tracts) A) FHA, FSA/RHS & VA B) Conventional C) Refinancings D) Home Improvement Loans F) Non-occupant Loans on G) Loans On Manufactured Number Average Value Number Average Value Number Average Value Number Average Value Number Average Value Number Average Value
LOANS ORIGINATED 35 $120,105 14 $140,851 53 $122,583 4 $21,282 8 $84,751 2 $80,360 APPLICATIONS APPROVED, NOT ACCEPTED 2 $100,485 0 $0 13 $117,612 1 $2,840 0 $0 0 $0 APPLICATIONS DENIED 11 $99,174 9 $113,656 35 $127,497 2 $70,700 2 $75,825 1 $147,830 APPLICATIONS WITHDRAWN 6 $123,745 4 $122,648 21 $140,563 1 $2,840 1 $152,150 0 $0 FILES CLOSED FOR INCOMPLETENESS 2 $75,125 0 $0 3 $172,303 0 $0 0 $0 0 $0
Aggregated Statistics For Year 2008(Based on 3 partial tracts) A) FHA, FSA/RHS & VA B) Conventional C) Refinancings D) Home Improvement Loans E) Loans on Dwellings For 5+ Families F) Non-occupant Loans on G) Loans On Manufactured Number Average Value Number Average Value Number Average Value Number Average Value Number Average Value Number Average Value Number Average Value
LOANS ORIGINATED 41 $124,719 38 $126,598 75 $99,993 16 $42,188 1 $1,103,470 27 $61,065 5 $60,190 APPLICATIONS APPROVED, NOT ACCEPTED 3 $110,443 2 $72,685 11 $95,869 0 $0 0 $0 1 $119,450 1 $100,250 APPLICATIONS DENIED 6 $142,395 9 $99,012 53 $102,356 14 $58,424 0 $0 7 $104,246 3 $82,963 APPLICATIONS WITHDRAWN 6 $126,733 8 $171,724 19 $107,278 1 $96,620 0 $0 2 $80,610 1 $54,040 FILES CLOSED FOR INCOMPLETENESS 0 $0 1 $138,650 3 $135,030 0 $0 0 $0 0 $0 0 $0
Aggregated Statistics For Year 2007(Based on 3 partial tracts) A) FHA, FSA/RHS & VA B) Conventional C) Refinancings D) Home Improvement Loans F) Non-occupant Loans on G) Loans On Manufactured Number Average Value Number Average Value Number Average Value Number Average Value Number Average Value Number Average Value
LOANS ORIGINATED 25 $130,848 109 $118,053 81 $117,746 18 $46,469 33 $80,492 3 $127,410 APPLICATIONS APPROVED, NOT ACCEPTED 1 $91,010 11 $112,785 19 $106,981 4 $51,708 7 $91,009 1 $43,600 APPLICATIONS DENIED 11 $134,884 25 $117,780 79 $103,563 17 $55,871 13 $87,115 6 $65,423 APPLICATIONS WITHDRAWN 4 $118,205 12 $141,064 29 $107,422 1 $28,440 5 $73,252 1 $21,330 FILES CLOSED FOR INCOMPLETENESS 0 $0 4 $105,465 8 $109,315 0 $0 2 $63,610 0 $0
Aggregated Statistics For Year 2006(Based on 3 partial tracts) A) FHA, FSA/RHS & VA B) Conventional C) Refinancings D) Home Improvement Loans F) Non-occupant Loans on G) Loans On Manufactured Number Average Value Number Average Value Number Average Value Number Average Value Number Average Value Number Average Value
LOANS ORIGINATED 8 $121,162 111 $96,531 73 $88,545 11 $20,115 39 $65,426 4 $51,500 APPLICATIONS APPROVED, NOT ACCEPTED 0 $0 13 $115,004 17 $69,114 2 $23,990 7 $56,169 1 $104,280 APPLICATIONS DENIED 1 $44,790 30 $69,056 77 $92,111 9 $23,374 18 $64,158 5 $26,264 APPLICATIONS WITHDRAWN 2 $98,410 13 $90,111 41 $91,180 2 $16,000 4 $39,460 0 $0 FILES CLOSED FOR INCOMPLETENESS 0 $0 2 $161,310 7 $102,851 0 $0 1 $65,410 0 $0
Aggregated Statistics For Year 2005(Based on 3 partial tracts) A) FHA, FSA/RHS & VA B) Conventional C) Refinancings D) Home Improvement Loans E) Loans on Dwellings For 5+ Families F) Non-occupant Loans on G) Loans On Manufactured Number Average Value Number Average Value Number Average Value Number Average Value Number Average Value Number Average Value Number Average Value
LOANS ORIGINATED 15 $120,241 112 $94,809 87 $97,182 16 $27,744 0 $0 37 $68,949 5 $52,880 APPLICATIONS APPROVED, NOT ACCEPTED 1 $191,970 14 $95,232 21 $83,997 1 $4,980 0 $0 3 $65,933 5 $66,506 APPLICATIONS DENIED 3 $111,863 26 $74,616 95 $103,999 14 $25,508 0 $0 9 $79,168 12 $65,145 APPLICATIONS WITHDRAWN 1 $172,060 10 $84,975 33 $107,474 3 $122,687 1 $59,720 5 $86,222 1 $67,550 FILES CLOSED FOR INCOMPLETENESS 0 $0 1 $89,070 14 $105,673 1 $49,060 0 $0 0 $0 0 $0
Aggregated Statistics For Year 2004(Based on 3 partial tracts) A) FHA, FSA/RHS & VA B) Conventional C) Refinancings D) Home Improvement Loans F) Non-occupant Loans on G) Loans On Manufactured Number Average Value Number Average Value Number Average Value Number Average Value Number Average Value Number Average Value
LOANS ORIGINATED 9 $127,324 74 $124,501 99 $88,608 11 $32,160 29 $67,559 6 $45,733 APPLICATIONS APPROVED, NOT ACCEPTED 0 $0 10 $81,954 15 $77,149 2 $69,075 2 $66,420 4 $52,072 APPLICATIONS DENIED 1 $182,340 26 $86,637 65 $87,710 6 $20,248 5 $52,220 8 $34,244 APPLICATIONS WITHDRAWN 2 $135,090 8 $121,906 35 $110,637 0 $0 3 $95,837 1 $95,290 FILES CLOSED FOR INCOMPLETENESS 0 $0 2 $90,635 8 $87,556 1 $17,780 0 $0 0 $0
Aggregated Statistics For Year 2003(Based on 3 partial tracts) A) FHA, FSA/RHS & VA B) Conventional C) Refinancings D) Home Improvement Loans E) Loans on Dwellings For 5+ Families F) Non-occupant Loans on Number Average Value Number Average Value Number Average Value Number Average Value Number Average Value Number Average Value
LOANS ORIGINATED 21 $106,606 71 $120,226 148 $97,094 16 $9,518 1 $66,120 30 $57,709 APPLICATIONS APPROVED, NOT ACCEPTED 1 $118,030 3 $126,693 17 $82,803 0 $0 0 $0 1 $32,710 APPLICATIONS DENIED 4 $119,802 13 $118,223 65 $91,425 3 $11,017 0 $0 3 $60,920 APPLICATIONS WITHDRAWN 1 $80,340 9 $128,811 27 $93,649 0 $0 0 $0 3 $54,793 FILES CLOSED FOR INCOMPLETENESS 0 $0 1 $73,570 4 $119,305 0 $0 0 $0 1 $49,060
Aggregated Statistics For Year 2002(Based on 3 partial tracts) A) FHA, FSA/RHS & VA B) Conventional C) Refinancings D) Home Improvement Loans F) Non-occupant Loans on Number Average Value Number Average Value Number Average Value Number Average Value Number Average Value
LOANS ORIGINATED 12 $107,256 54 $104,991 122 $108,283 18 $10,340 24 $58,570 APPLICATIONS APPROVED, NOT ACCEPTED 1 $97,410 4 $149,682 25 $102,136 1 $28,440 0 $0 APPLICATIONS DENIED 3 $124,733 20 $59,100 59 $85,314 7 $25,399 5 $48,806 APPLICATIONS WITHDRAWN 2 $102,030 8 $106,602 24 $97,035 1 $7,110 1 $30,160 FILES CLOSED FOR INCOMPLETENESS 0 $0 4 $122,825 5 $82,688 0 $0 0 $0
Aggregated Statistics For Year 2001(Based on 3 partial tracts) A) FHA, FSA/RHS & VA B) Conventional C) Refinancings D) Home Improvement Loans E) Loans on Dwellings For 5+ Families F) Non-occupant Loans on Number Average Value Number Average Value Number Average Value Number Average Value Number Average Value Number Average Value
LOANS ORIGINATED 21 $91,828 59 $86,478 133 $86,699 10 $8,311 1 $78,920 17 $60,511 APPLICATIONS APPROVED, NOT ACCEPTED 3 $78,107 14 $57,732 18 $50,423 1 $11,380 0 $0 1 $55,840 APPLICATIONS DENIED 2 $90,895 108 $50,146 67 $60,590 8 $16,352 0 $0 3 $60,877 APPLICATIONS WITHDRAWN 0 $0 14 $77,671 27 $80,166 3 $13,090 0 $0 2 $126,440 FILES CLOSED FOR INCOMPLETENESS 0 $0 2 $54,050 9 $94,059 0 $0 0 $0 0 $0
Aggregated Statistics For Year 2000(Based on 3 partial tracts) A) FHA, FSA/RHS & VA B) Conventional C) Refinancings D) Home Improvement Loans F) Non-occupant Loans on Number Average Value Number Average Value Number Average Value Number Average Value Number Average Value
LOANS ORIGINATED 20 $98,286 73 $98,494 52 $72,144 22 $9,491 16 $66,653 APPLICATIONS APPROVED, NOT ACCEPTED 2 $71,850 23 $55,111 17 $63,961 6 $13,183 2 $54,625 APPLICATIONS DENIED 4 $66,405 150 $48,937 72 $62,398 13 $21,020 2 $57,945 APPLICATIONS WITHDRAWN 2 $76,790 19 $62,927 31 $67,485 1 $7,110 4 $83,128 FILES CLOSED FOR INCOMPLETENESS 2 $113,050 2 $117,700 5 $72,806 0 $0 0 $0
Aggregated Statistics For Year 1999(Based on 3 partial tracts) A) FHA, FSA/RHS & VA B) Conventional C) Refinancings D) Home Improvement Loans F) Non-occupant Loans on Number Average Value Number Average Value Number Average Value Number Average Value Number Average Value
LOANS ORIGINATED 19 $95,254 86 $77,329 66 $78,687 29 $16,212 18 $57,692 APPLICATIONS APPROVED, NOT ACCEPTED 0 $0 32 $60,333 22 $64,180 3 $11,693 1 $53,690 APPLICATIONS DENIED 3 $78,773 127 $49,578 61 $62,621 10 $9,621 3 $41,117 APPLICATIONS WITHDRAWN 4 $99,392 7 $61,506 33 $65,656 0 $0 0 $0 FILES CLOSED FOR INCOMPLETENESS 1 $175,000 9 $71,349 11 $78,158 0 $0 0 $0
Detailed HMDA statistics for the following Tracts:
0616.01
, 0616.02
Private Mortgage Insurance Companies Aggregated Statistics For Year 2009(Based on 3 partial tracts) A) Conventional B) Refinancings C) Non-occupant Loans on Number Average Value Number Average Value Number Average Value
LOANS ORIGINATED 2 $140,570 1 $156,430 0 $0 APPLICATIONS APPROVED, NOT ACCEPTED 2 $67,220 0 $0 0 $0 APPLICATIONS DENIED 1 $56,880 0 $0 0 $0 APPLICATIONS WITHDRAWN 1 $117,420 0 $0 1 $57,590 FILES CLOSED FOR INCOMPLETENESS 0 $0 0 $0 0 $0
Aggregated Statistics For Year 2008(Based on 3 partial tracts) A) Conventional B) Refinancings C) Non-occupant Loans on Number Average Value Number Average Value Number Average Value
LOANS ORIGINATED 14 $115,986 7 $122,649 3 $83,660 APPLICATIONS APPROVED, NOT ACCEPTED 8 $105,594 3 $117,643 3 $41,237 APPLICATIONS DENIED 2 $110,950 0 $0 2 $110,950 APPLICATIONS WITHDRAWN 2 $108,265 0 $0 1 $57,590 FILES CLOSED FOR INCOMPLETENESS 0 $0 0 $0 0 $0
Aggregated Statistics For Year 2007(Based on 3 partial tracts) A) Conventional B) Refinancings C) Non-occupant Loans on Number Average Value Number Average Value Number Average Value
LOANS ORIGINATED 44 $116,509 11 $156,805 7 $62,007 APPLICATIONS APPROVED, NOT ACCEPTED 3 $108,280 0 $0 1 $67,960 APPLICATIONS DENIED 0 $0 0 $0 0 $0 APPLICATIONS WITHDRAWN 3 $114,997 2 $199,710 1 $22,750 FILES CLOSED FOR INCOMPLETENESS 0 $0 0 $0 0 $0
Aggregated Statistics For Year 2006(Based on 3 partial tracts) A) Conventional B) Refinancings C) Non-occupant Loans on Number Average Value Number Average Value Number Average Value
LOANS ORIGINATED 18 $110,712 8 $124,800 3 $44,690 APPLICATIONS APPROVED, NOT ACCEPTED 1 $146,470 2 $174,215 0 $0 APPLICATIONS DENIED 1 $120,870 0 $0 0 $0 APPLICATIONS WITHDRAWN 2 $129,485 0 $0 0 $0 FILES CLOSED FOR INCOMPLETENESS 0 $0 0 $0 0 $0
Aggregated Statistics For Year 2005(Based on 3 partial tracts) A) Conventional B) Refinancings C) Non-occupant Loans on D) Loans On Manufactured Number Average Value Number Average Value Number Average Value Number Average Value
LOANS ORIGINATED 12 $116,047 8 $98,759 5 $78,556 0 $0 APPLICATIONS APPROVED, NOT ACCEPTED 4 $195,348 2 $101,510 1 $167,090 1 $83,190 APPLICATIONS DENIED 0 $0 0 $0 0 $0 0 $0 APPLICATIONS WITHDRAWN 1 $206,190 0 $0 0 $0 0 $0 FILES CLOSED FOR INCOMPLETENESS 0 $0 0 $0 0 $0 0 $0
Aggregated Statistics For Year 2004(Based on 3 partial tracts) A) Conventional B) Refinancings C) Non-occupant Loans on Number Average Value Number Average Value Number Average Value
LOANS ORIGINATED 16 $140,342 5 $136,564 2 $47,200 APPLICATIONS APPROVED, NOT ACCEPTED 2 $102,230 2 $108,430 0 $0 APPLICATIONS DENIED 0 $0 0 $0 0 $0 APPLICATIONS WITHDRAWN 1 $111,630 2 $108,785 1 $79,630 FILES CLOSED FOR INCOMPLETENESS 0 $0 0 $0 0 $0
Aggregated Statistics For Year 2003(Based on 3 partial tracts) A) Conventional B) Refinancings C) Non-occupant Loans on Number Average Value Number Average Value Number Average Value
LOANS ORIGINATED 12 $92,239 25 $111,950 2 $43,440 APPLICATIONS APPROVED, NOT ACCEPTED 3 $126,003 2 $101,765 0 $0 APPLICATIONS DENIED 0 $0 0 $0 0 $0 APPLICATIONS WITHDRAWN 1 $17,780 2 $107,185 1 $17,780 FILES CLOSED FOR INCOMPLETENESS 1 $34,840 0 $0 0 $0
Aggregated Statistics For Year 2002(Based on 3 partial tracts) A) Conventional B) Refinancings C) Non-occupant Loans on Number Average Value Number Average Value Number Average Value
LOANS ORIGINATED 18 $109,174 28 $133,661 3 $74,313 APPLICATIONS APPROVED, NOT ACCEPTED 1 $193,240 6 $121,798 0 $0 APPLICATIONS DENIED 2 $68,885 1 $255,250 1 $76,080 APPLICATIONS WITHDRAWN 1 $242,450 1 $41,950 0 $0 FILES CLOSED FOR INCOMPLETENESS 0 $0 1 $76,790 0 $0
Aggregated Statistics For Year 2001(Based on 3 partial tracts) A) Conventional B) Refinancings C) Non-occupant Loans on Number Average Value Number Average Value Number Average Value
LOANS ORIGINATED 21 $104,073 22 $116,812 1 $70,950 APPLICATIONS APPROVED, NOT ACCEPTED 2 $129,150 4 $100,780 0 $0 APPLICATIONS DENIED 0 $0 1 $89,090 0 $0 APPLICATIONS WITHDRAWN 0 $0 0 $0 0 $0 FILES CLOSED FOR INCOMPLETENESS 0 $0 1 $83,190 0 $0
Aggregated Statistics For Year 2000(Based on 3 partial tracts) A) Conventional B) Refinancings Number Average Value Number Average Value
LOANS ORIGINATED 10 $98,469 3 $122,590 APPLICATIONS APPROVED, NOT ACCEPTED 1 $157,130 0 $0 APPLICATIONS DENIED 2 $102,630 2 $106,975 APPLICATIONS WITHDRAWN 0 $0 0 $0 FILES CLOSED FOR INCOMPLETENESS 0 $0 0 $0
Aggregated Statistics For Year 1999(Based on 3 partial tracts) A) Conventional B) Refinancings C) Non-occupant Loans on Number Average Value Number Average Value Number Average Value
LOANS ORIGINATED 14 $111,614 8 $88,510 2 $79,675 APPLICATIONS APPROVED, NOT ACCEPTED 0 $0 0 $0 0 $0 APPLICATIONS DENIED 1 $63,310 1 $91,960 0 $0 APPLICATIONS WITHDRAWN 0 $0 1 $64,740 0 $0 FILES CLOSED FOR INCOMPLETENESS 0 $0 0 $0 0 $0
Detailed PMIC statistics for the following Tracts:
0616.01
, 0616.02
Most common first names in York, SC among deceased individuals Name Count Lived (average)
James 197 69.6 years William 152 70.9 years Mary 144 78.0 years John 120 72.5 years Robert 96 71.4 years Annie 60 78.3 years Charles 57 67.4 years Margaret 52 76.8 years Thomas 50 66.2 years George 45 74.1 years
Most common last names in York, SC among deceased individuals Last name Count Lived (average)
Smith 73 74.0 years Robinson 51 79.1 years Brown 51 70.5 years Williams 51 72.5 years Jones 44 79.8 years Stewart 43 75.4 years Moore 36 75.1 years Childers 35 71.1 years White 33 78.1 years Carroll 32 76.8 years
York compared to South Carolina state average:
Unemployed percentage below state average. Hispanic race population percentage above state average. Length of stay since moving in significantly above state average. Institutionalized population percentage above state average.
#96 on the list of "Top 101 cities with largest percentage of females in industries: administrative and support and waste management services (population 5,000+)"
#99 on the list of "Top 101 cities with largest percentage of females in occupations: production occupations (population 5,000+)"
#100 on the list of "Top 101 cities with the largest percentage of people in schools, hospitals, or wards for the mentally retarded (population 1,000+)"
#60 (29745) on the list of "Top 101 zip codes with the largest percentage of Scotch-Irish first ancestries (pop 5,000+)"
#13 on the list of "Top 101 counties with the lowest percentage of residents that drank alcohol in the past 30 days"
#15 on the list of "Top 101 counties with the highest average weight of females"
#26 on the list of "Top 101 counties with the lowest Sulfur Oxides Annual air pollution readings in 2012 (µg/m3 )"
#45 on the list of "Top 101 counties with the highest percentage of residents that keep firearms around their homes"
#56 on the list of "Top 101 counties with the largest number of people moving in compared to moving out (pop. 50,000+)"
Top Patent Applicants
Brian Lee (33)
Christian H. Reinke (18)
Philip E. Parker (15)
Tom Benfield (7)
William F. Jones (7)
David S. Segletes (7)
Nicholas F. Martin, Jr. (6)
Scott Alan Reed (4)
Bryan P. Thomas (4)
Darin Cate (4)
Total of 156 patent applications in 2008-2024.
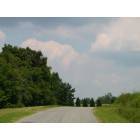
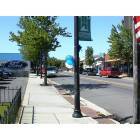
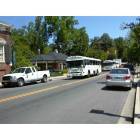

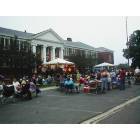
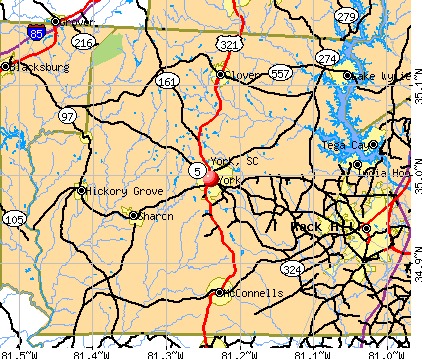


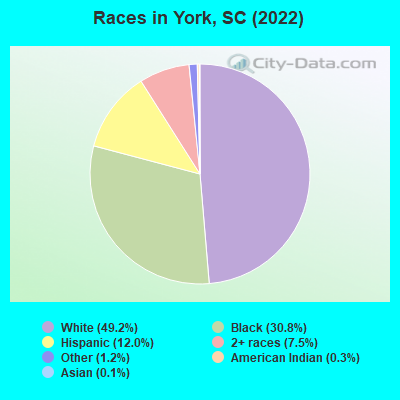
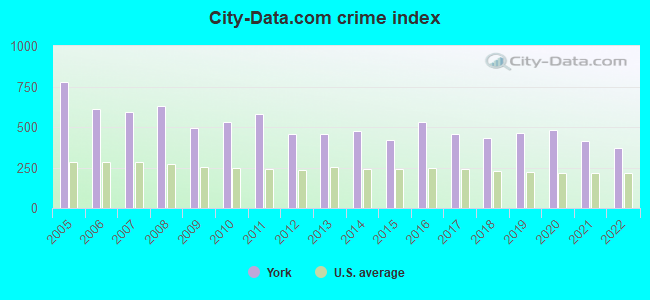
 Recent articles from our blog. Our writers, many of them Ph.D. graduates or candidates, create easy-to-read articles on a wide variety of topics.

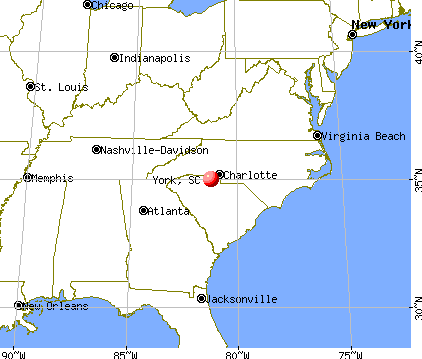
 (18.3 miles

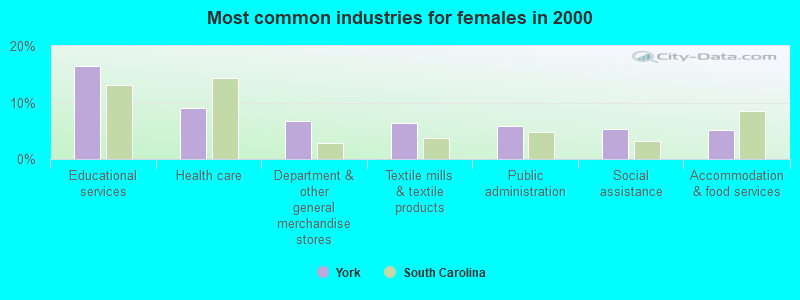
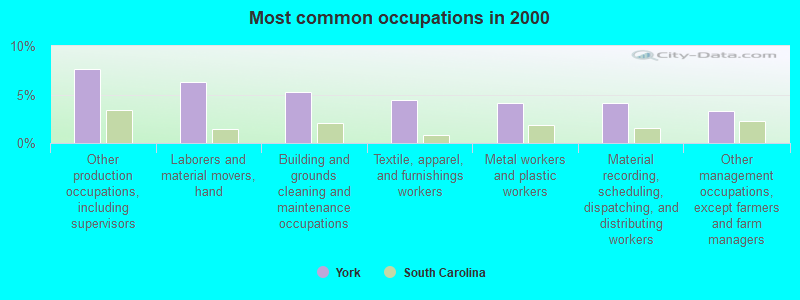
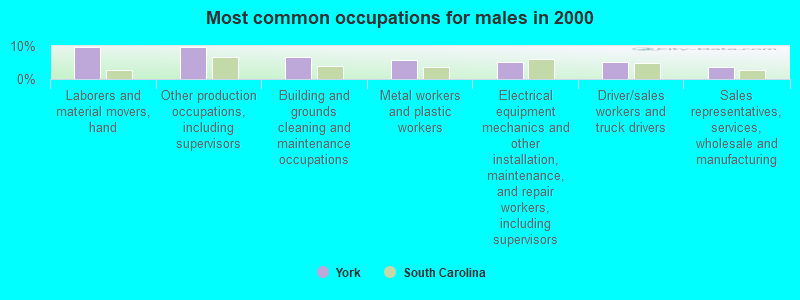
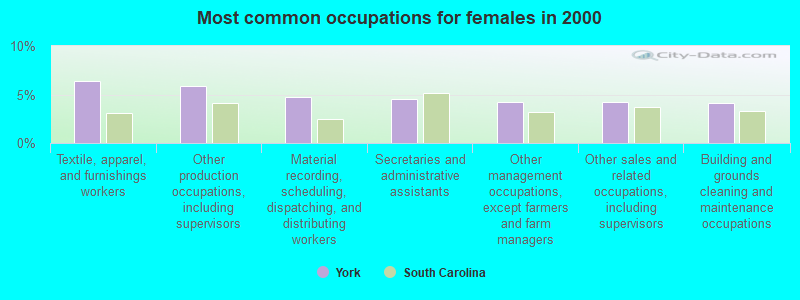
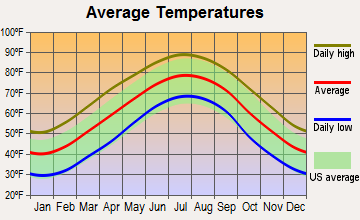

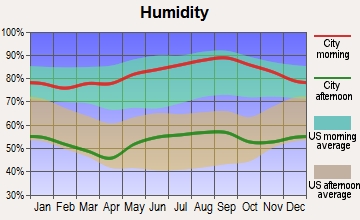
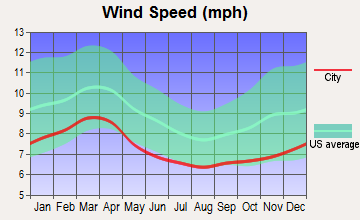
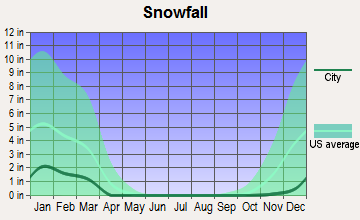

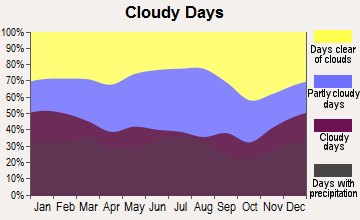
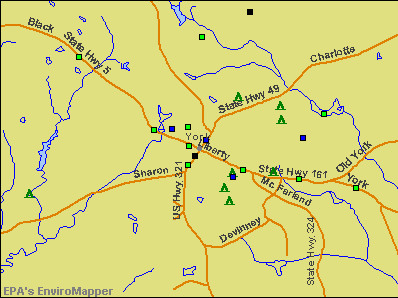

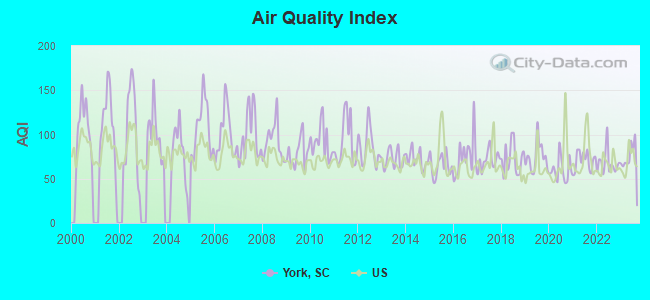
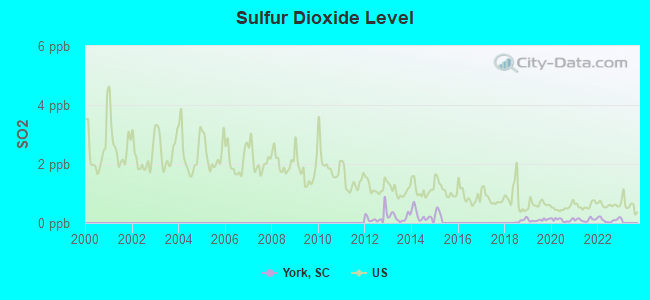
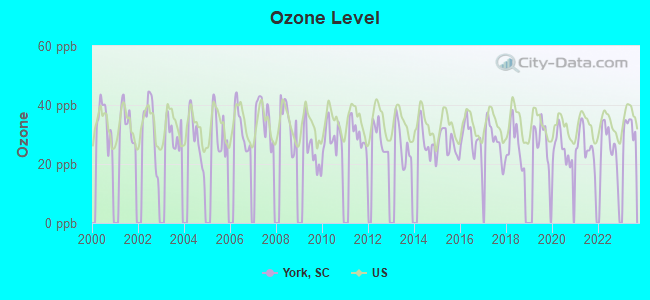
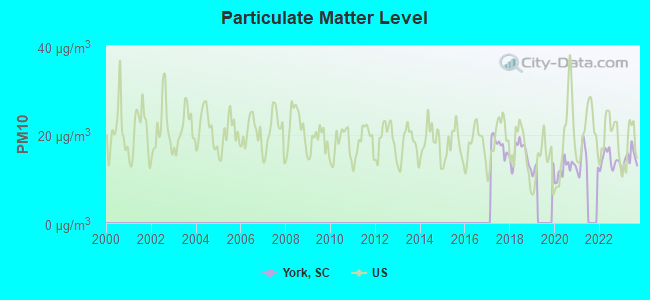
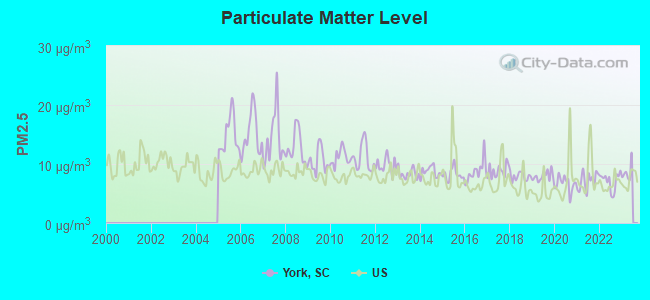
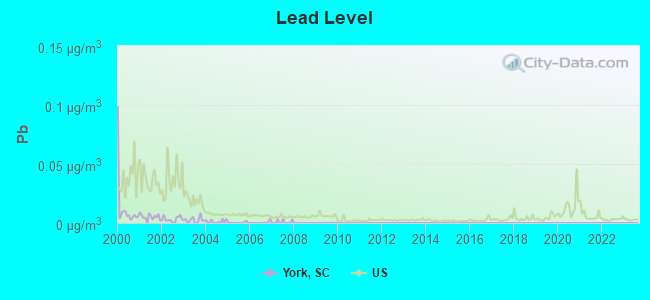
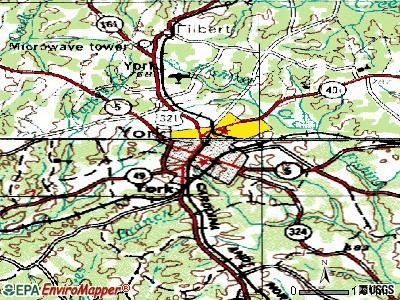
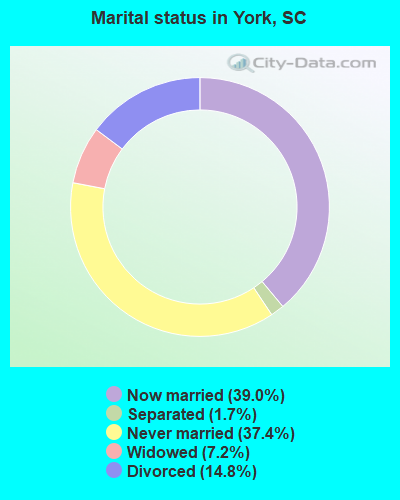
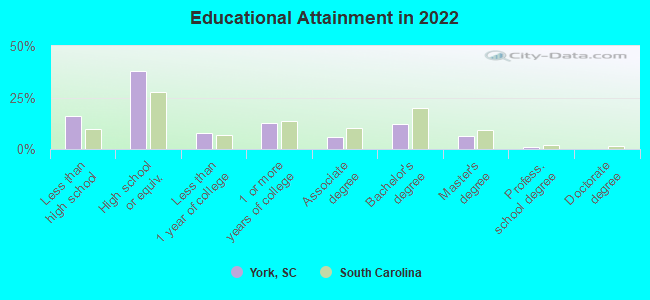
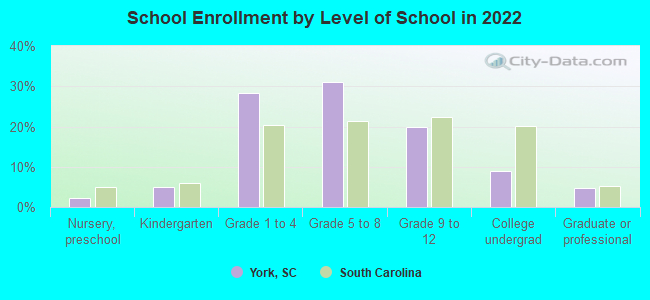
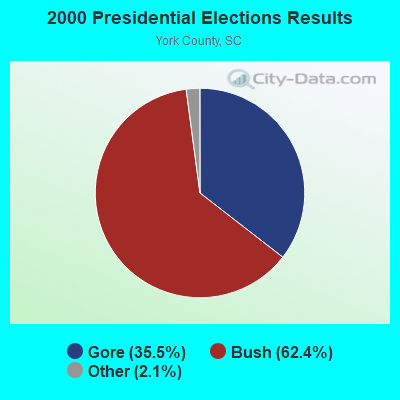
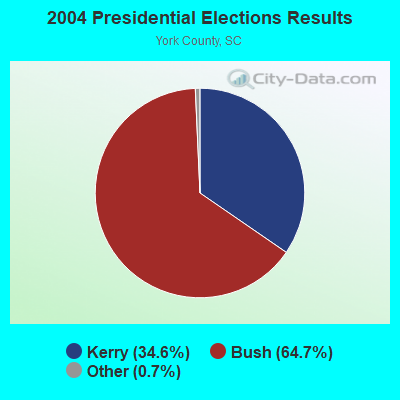
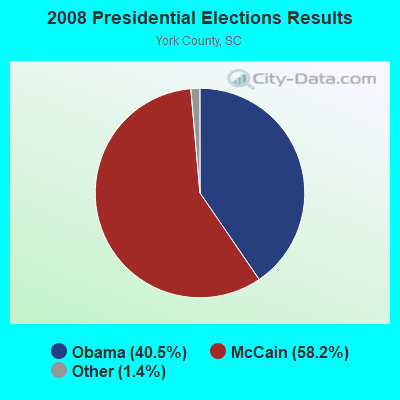
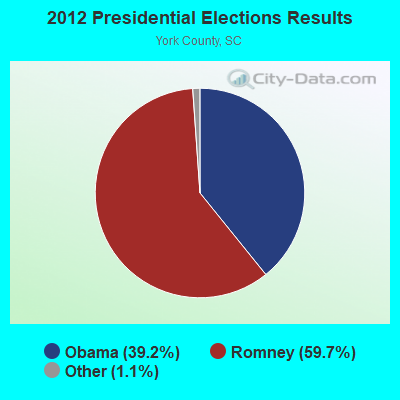
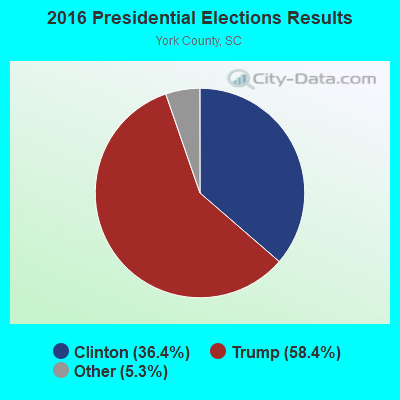
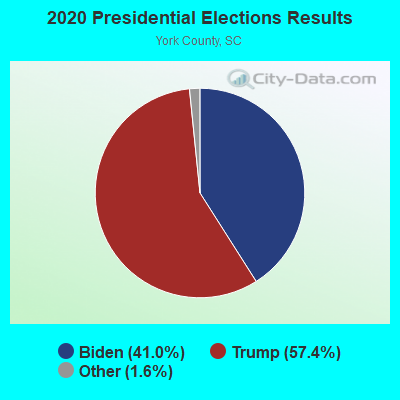
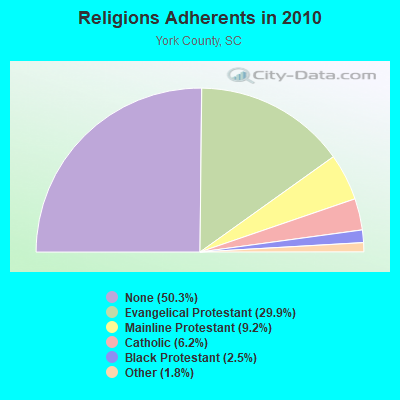
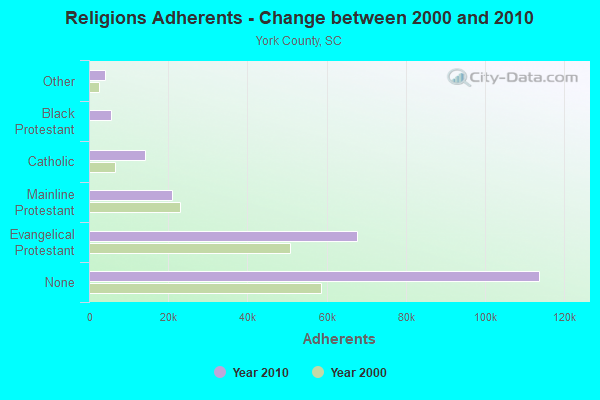
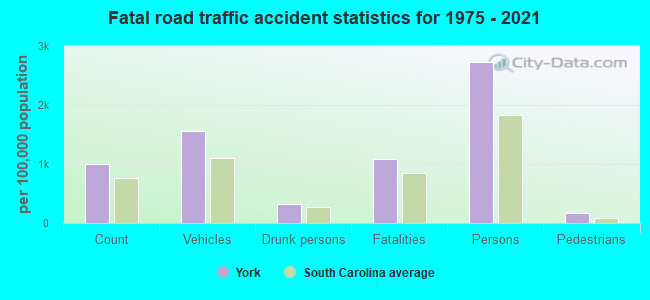
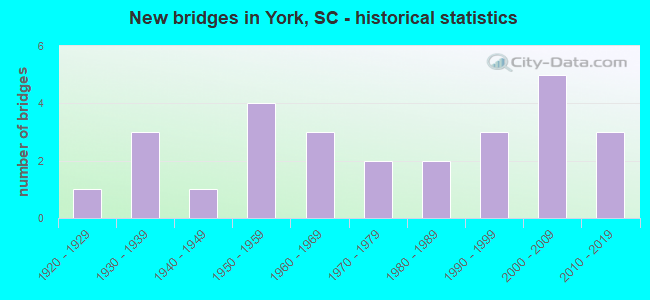
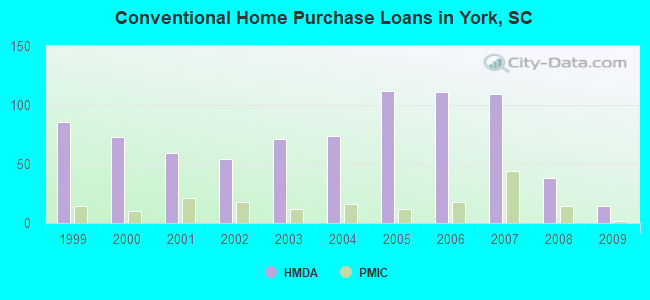
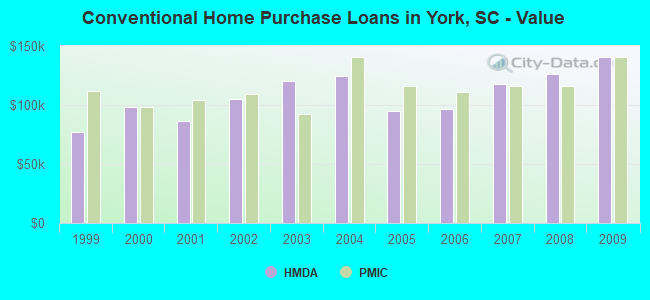
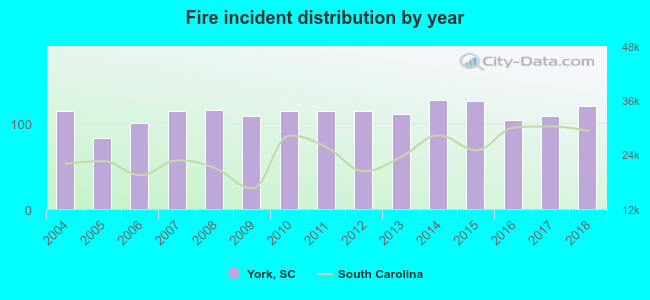 Based on the data from the years 2004 - 2018 the average number of fires per year is 112. The highest number of reported fire incidents - 127 took place in 2014, and the least - 83 in 2005. The data has a growing trend.
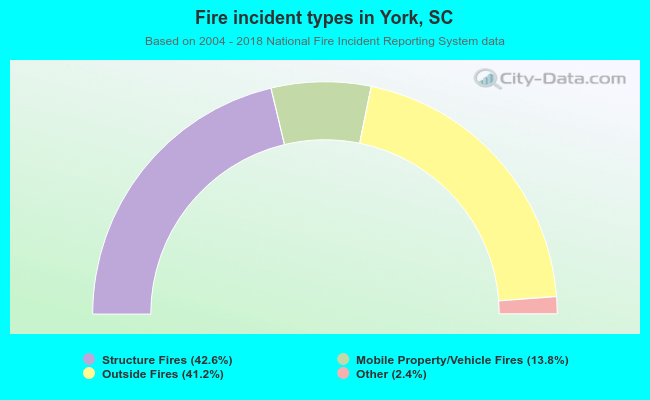 When looking into fire subcategories, the most reports belonged to: Structure Fires (42.6%), and Outside Fires (41.2%).