Benton County, Mississippi (MS)
County owner-occupied free and clear houses and condos in 2010: 1,293
County owner-occupied houses and condos in 2000: 2,529
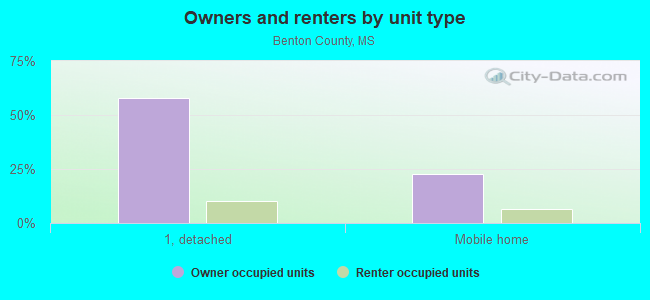
Renter-occupied apartments: 706 (it was 470 in 2000)
| % of renters here: | 16% |
| State: | 30% |
Land area: 407 sq. mi.
Water area: 1.9 sq. mi.
Population density: 19 people per square mile (low).
Industries providing employment: Educational, health and social services (20.9%), Construction (14.4%), Manufacturing (14.0%).
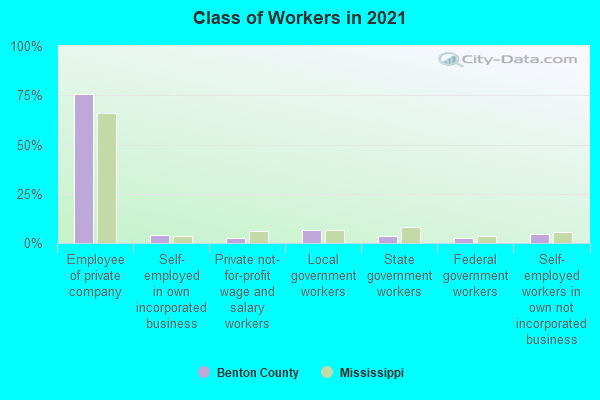
Type of workers:
- Private wage or salary: 82%
- Government: 14%
- Self-employed, not incorporated: 4%
- Unpaid family work: 0%
- OSM Map
- General Map
- Google Map
- MSN Map

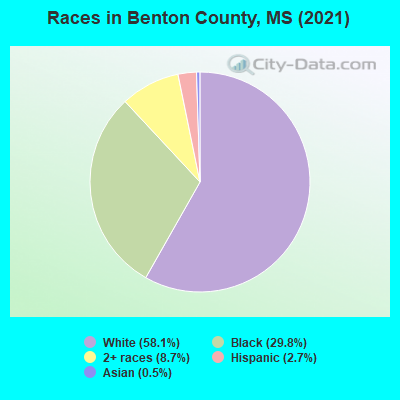
- 4,51759.2%White Non-Hispanic Alone
- 2,45532.2%Black Non-Hispanic Alone
- 3945.2%Two or more races
- 2393.1%Hispanic or Latino
- 260.3%Asian alone
- 30.04%Some other race alone
- 20.03%Native Hawaiian and Other
Pacific Islander alone
| Median resident age: | 42.6 years |
| Mississippi median age: | 38.9 years |
| Males: 3,750 | |
| Females: 3,838 |

 | Teaching in teacher shortage areas. (6 replies) |
| Potts Camp,ms? (2 replies) |
| Benton County: | 2.0 people |
| Mississippi: | 3 people |
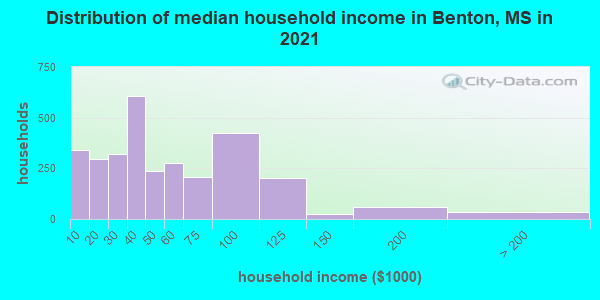
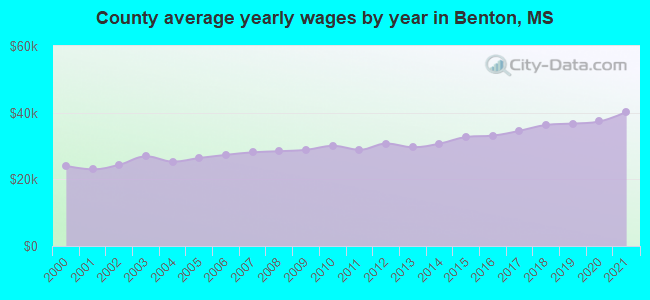
Estimated median household income in 2022: $38,555 ($24,149 in 1999)
| This county: | $38,555 |
| Mississippi: | $52,719 |
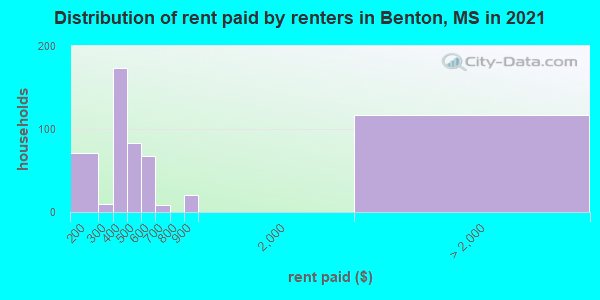
Median contract rent in 2022 for apartments: $443 (lower quartile is $355, upper quartile is $531)
| This county: | $443 |
| State: | $656 |
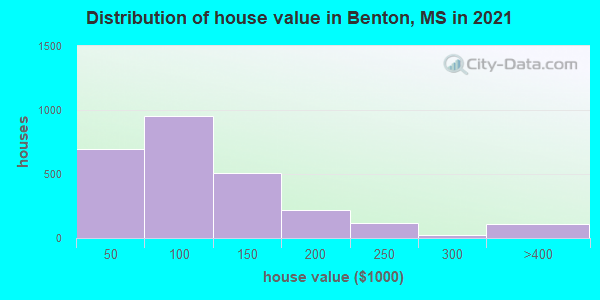
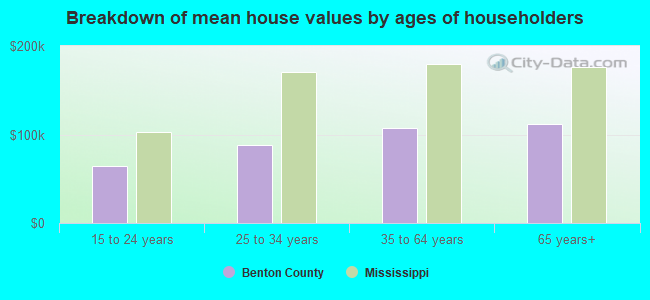
Estimated median house or condo value in 2022: $103,526 (it was $50,700 in 2000)
| Benton: | $103,526 |
| Mississippi: | $162,500 |
Mean price in 2022:
Median monthly housing costs for homes and condos with a mortgage: $964Detached houses: $156,937
Here: $156,937 State: $226,494 Mobile homes: $59,105
Here: $59,105 State: $73,695
Median monthly housing costs for units without a mortgage: $367
Institutionalized population: 78
Crime in 1987 (reported by the sheriff's office or county police, not the county total):
- Murders: 0
- Rapes: 0
- Robberies: 1
- Assaults: 5
- Burglaries: 2
- Thefts: 2
- Auto thefts: 2
Crime in 1986 (reported by the sheriff's office or county police, not the county total):
- Murders: 1
- Rapes: 0
- Robberies: 0
- Assaults: 0
- Burglaries: 11
- Thefts: 7
- Auto thefts: 3
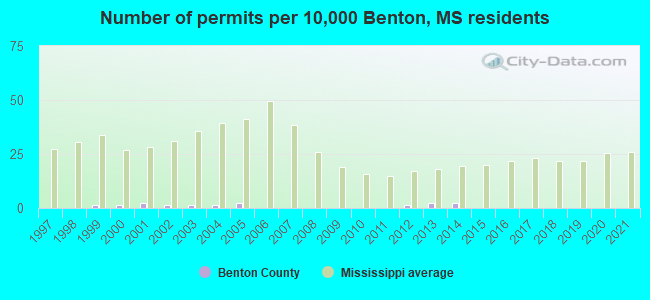
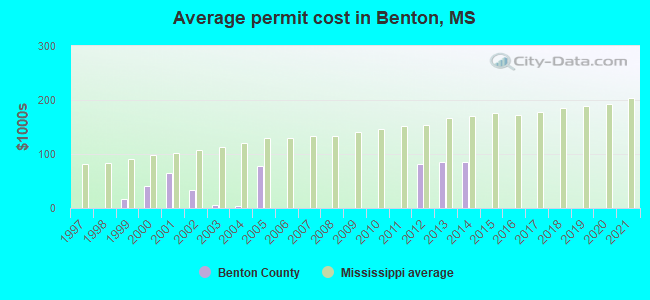
Single-family new house construction building permits:
- 2022: 0 buildings
- 2021: 0 buildings
- 2020: 0 buildings
- 2019: 0 buildings
- 2018: 0 buildings
- 2017: 0 buildings
- 2016: 0 buildings
- 2015: 0 buildings
- 2014: 2 buildings, average cost: $85,000
- 2013: 2 buildings, average cost: $85,000
- 2012: 1 building, cost: $81,300
- 2011: 0 buildings
- 2010: 0 buildings
- 2009: 0 buildings
- 2008: 0 buildings
- 2007: 0 buildings
- 2006: 0 buildings
- 2005: 2 buildings, average cost: $77,500
- 2004: 1 building, cost: $3,000
- 2003: 1 building, cost: $5,000
- 2002: 1 building, cost: $34,000
- 2001: 2 buildings, average cost: $65,000
- 2000: 1 building, cost: $40,000
- 1999: 1 building, cost: $16,000
- 1998: 0 buildings
- 1997: 0 buildings
Median real estate property taxes paid for housing units with mortgages in 2022: $684 (0.7%)
Median real estate property taxes paid for housing units with no mortgage in 2022: $759 (0.7%)
| Benton County: | 17.6% |
| Mississippi: | 19.1% |
Median age of residents in 2022: 42.6 years old
(Males: 40.5 years old, Females: 44.4 years old)
(Median age for: White residents: 45.9 years old, Black residents: 41.1 years old, Asian residents: 37.0 years old, Hispanic or Latino residents: 66.7 years old, Other race residents: 70.6 years old)
Fair market rent in 2006 for a 1-bedroom apartment in Benton County is $465 a month.
Fair market rent for a 2-bedroom apartment is $515 a month.
Fair market rent for a 3-bedroom apartment is $618 a month.
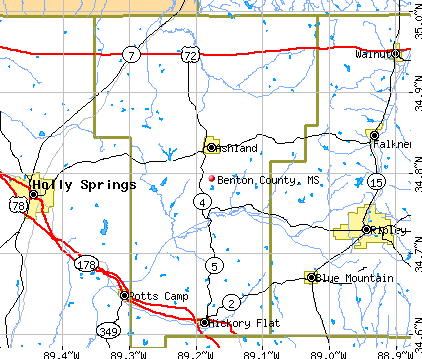
Cities in this county include: Ashland, Hickory Flat, Snow Lake Shores.
Neighboring counties: Catoosa County, Georgia  , Garvin County, Oklahoma
  , Lawrence County, Alabama , York County, South Carolina , Monroe County, Arkansas .
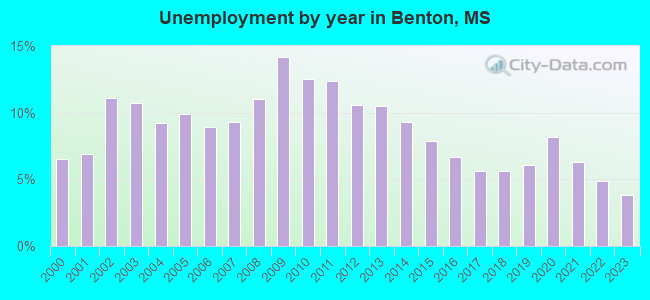
| Here: | 3.3% |
| Mississippi: | 2.6% |
Current college students: 210
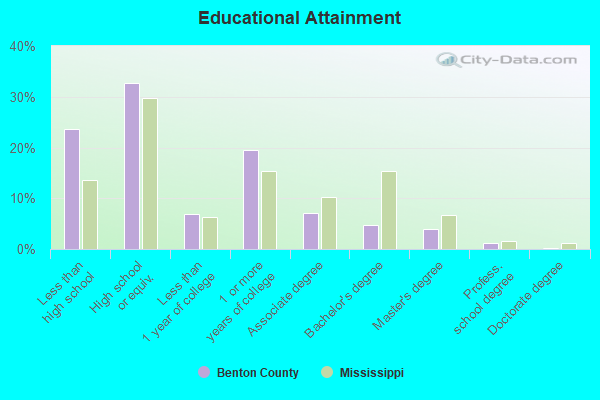
People 25 years of age or older with a high school degree or higher: 78.0%
People 25 years of age or older with a bachelor's degree or higher: 11.0%
Number of foreign born residents: 501 (36.6% naturalized citizens)
| Benton County: | 6.6% |
| Whole state: | 2.2% |
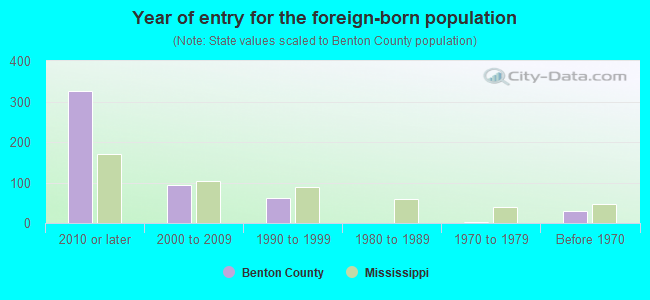
- Year of entry for the foreign-born population
- 3592010 or later
- 1332000 to 2009
- 41990 to 1999
- 01980 to 1989
- 21970 to 1979
- 29Before 1970
Mean travel time to work (commute): # minutes
Percentage of county residents living and working in this county: 72.6%
Housing units in structures:
- One, detached: 2,908
- One, attached: 9
- Two: 6
- 3 or 4: 13
- 5 to 9: 2
- 10 to 19: 32
- 20 or more: 4
- Mobile homes: 1,191
Housing units in Benton County with a mortgage: 1,005 (45 second mortgage, 0 home equity loan, 23 both second mortgage and home equity loan)
Houses without a mortgage: 0
| Here: | 100.0% with mortgage |
| State: | 97.5% with mortgage |
Religion statistics for Benton County
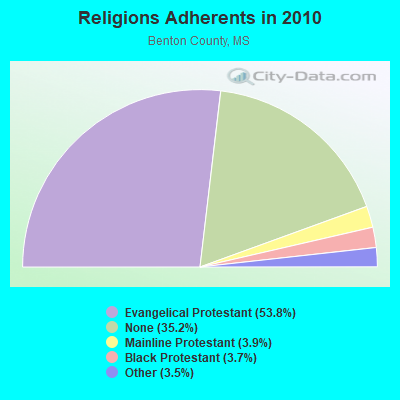
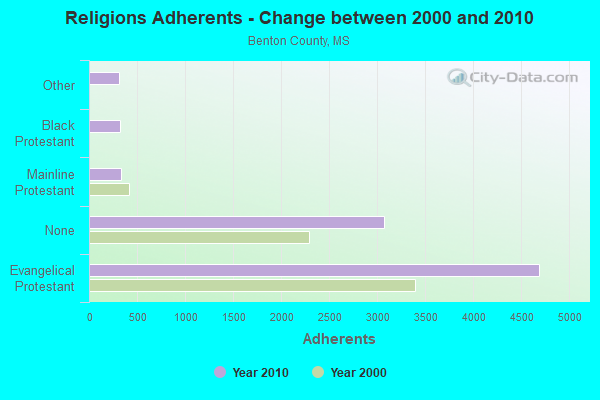
| Religion | Adherents | Congregations |
|---|---|---|
| Evangelical Protestant | 4,692 | 20 |
| Mainline Protestant | 337 | 7 |
| Black Protestant | 321 | 3 |
| Other | 308 | 1 |
| None | 3,071 | - |
Source: Clifford Grammich, Kirk Hadaway, Richard Houseal, Dale E.Jones, Alexei Krindatch, Richie Stanley and Richard H.Taylor. 2012. 2010 U.S.Religion Census: Religious Congregations & Membership Study. Association of Statisticians of American Religious Bodies. Jones, Dale E., et al. 2002. Congregations and Membership in the United States 2000. Nashville, TN: Glenmary Research Center.
Food Environment Statistics:
| Benton County: | 1.25 / 10,000 pop. |
| State: | 2.08 / 10,000 pop. |
| Benton County: | 9.98 / 10,000 pop. |
| Mississippi: | 6.36 / 10,000 pop. |
| Benton County: | 12.7% |
| Mississippi: | 12.3% |
| Benton County: | 34.6% |
| State: | 33.1% |
| Here: | 10.3% |
| State: | 14.4% |
Agriculture in Benton County:
Average size of farms: 333 acresAverage value of agricultural products sold per farm: $28,571
Average value of crops sold per acre for harvested cropland: $229.97
The value of livestock, poultry, and their products as a percentage of the total market value of agricultural products sold: 10.55%
Average total farm production expenses per farm: $32,007
Harvested cropland as a percentage of land in farms: 33.41%
Irrigated harvested cropland as a percentage of land in farms: 0.05%
Average market value of all machinery and equipment per farm: $39,250
The percentage of farms operated by a family or individual: 93.05%
Average age of principal farm operators: 60 years
Average number of cattle and calves per 100 acres of all land in farms: 13.48
Milk cows as a percentage of all cattle and calves: 0.04%
Corn for grain: 5440 harvested acres
Upland cotton: 7410 harvested acres
Soybeans for beans: 16634 harvested acres
Vegetables: 16 harvested acres
Earthquake activity:
Benton County-area historical earthquake activity is significantly above Mississippi state average. It is 309% greater than the overall U.S. average.On 3/25/1976 at 00:41:20, a magnitude 5.0 (4.9 MB, 5.0 LG, Class: Moderate, Intensity: VI - VII) earthquake occurred 87.4 miles away from Benton County center
On 5/4/1991 at 01:18:54, a magnitude 5.0 (4.4 MB, 4.6 LG, 5.0 LG, Depth: 3.1 mi) earthquake occurred 127.8 miles away from the county center
On 4/27/1989 at 16:47:49, a magnitude 4.7 (4.6 MB, 4.7 LG, 4.3 LG, Class: Light, Intensity: IV - V) earthquake occurred 90.3 miles away from the county center
On 9/26/1990 at 13:18:51, a magnitude 5.0 (4.7 MB, 4.8 LG, 5.0 LG, Depth: 7.7 mi) earthquake occurred 165.5 miles away from the county center
On 4/18/2008 at 09:36:59, a magnitude 5.4 (5.1 MB, 4.8 MS, 5.4 MW, 5.2 MW) earthquake occurred 263.1 miles away from Benton County center
On 1/18/1999 at 07:00:53, a magnitude 4.8 (4.8 MB, 4.0 LG, Depth: 0.6 mi) earthquake occurred 146.0 miles away from the county center
Magnitude types: regional Lg-wave magnitude (LG), body-wave magnitude (MB), surface-wave magnitude (MS), moment magnitude (MW)
Most recent natural disasters:
- Mississippi Covid-19 Pandemic, Incident Period: January 20, 2020, FEMA Id: 4528, Natural disaster type: Other
- Mississippi Severe Storms, Tornadoes, Straight-line Winds, and Flooding, Incident Period: December 23, 2015 to December 28, 2015, Major Disaster (Presidential) Declared DR-4248: January 04, 2016, FEMA Id: 4248, Natural disaster type: Storm, Tornado, Flood, Wind
- Mississippi Severe Storms, Tornadoes, Straight-line Winds, and Associated Flooding, Incident Period: April 15, 2011 to April 28, 2011, Major Disaster (Presidential) Declared DR-1972: April 29, 2011, FEMA Id: 1972, Natural disaster type: Storm, Tornado, Flood, Wind
- Mississippi Severe Storms, Tornadoes, and Flooding, Incident Period: May 01, 2010 to May 02, 2010, Major Disaster (Presidential) Declared DR-1916: May 14, 2010, FEMA Id: 1916, Natural disaster type: Storm, Tornado, Flood
- Mississippi Severe Storms and Tornadoes, Incident Period: November 24, 2001 to December 17, 2001, Major Disaster (Presidential) Declared DR-1398: December 07, 2001, FEMA Id: 1398, Natural disaster type: Storm, Tornado
- Mississippi Severe Storm, Winter Storm, Freezing Rain And Sleet, Incident Period: February 09, 1994 to February 14, 1994, Major Disaster (Presidential) Declared DR-1009: February 18, 1994, FEMA Id: 1009, Natural disaster type: Winter Storm, Storm, Freeze
- Mississippi Flooding, Severe Storm, Tornado, Incident Period: April 26, 1991 to May 31, 1991, Major Disaster (Presidential) Declared DR-906: May 17, 1991, FEMA Id: 906, Natural disaster type: Storm, Tornado, Flood
- Mississippi Flooding, Severe Storm, Tornado, Incident Period: January 24, 1990 to March 15, 1990, Major Disaster (Presidential) Declared DR-859: February 28, 1990, FEMA Id: 859, Natural disaster type: Storm, Tornado, Flood
- Mississippi Drought and Freezing, Incident Period: February 22, 1977, Emergency Declared EM-3032: February 22, 1977, FEMA Id: 3032, Natural disaster type: Freeze, Drought
- Mississippi STORMS, TORNADOES, Incident Period: February 22, 1971, Major Disaster (Presidential) Declared DR-302: February 22, 1971, FEMA Id: 302, Natural disaster type: Storm, Tornado
The number of natural disasters in Benton County (10) is smaller than the US average (15).
Major Disasters (Presidential) Declared: 8
Emergencies Declared: 1
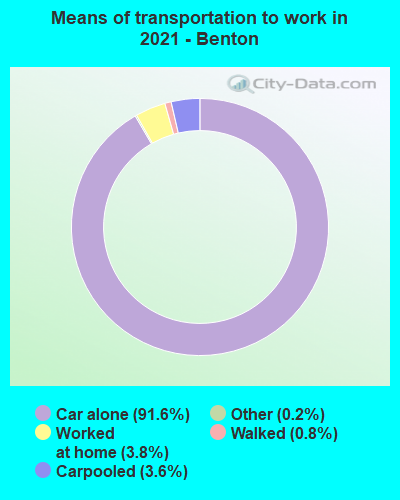
Means of transportation to work:
- Drove a car alone: 1,222 (89.0%)
- Carpooled: 55 (4.0%)
- Taxicab, motorcycle, or other means: 5 (0.4%)
- Walked: 8 (0.6%)
- Worked at home: 72 (5.2%)
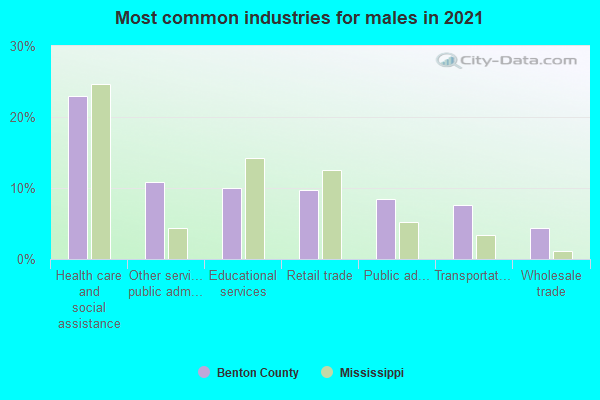
- Health care and social assistance (28%)
- Educational services (12%)
- Other services, except public administration (10%)
- Agriculture, forestry, fishing and hunting (8%)
- Retail trade (8%)
- Professional, scientific, and technical services (7%)
- Transportation and warehousing (6%)
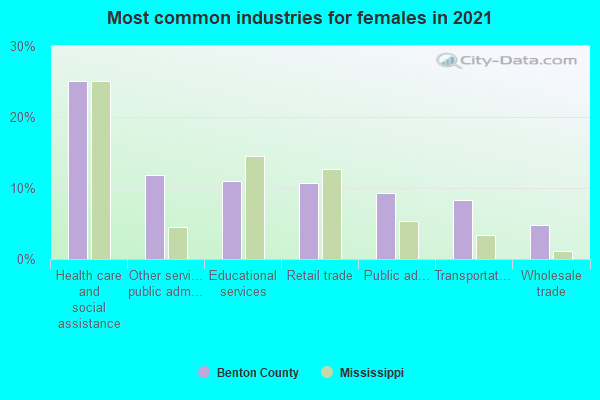
- Health care and social assistance (29%)
- Educational services (12%)
- Other services, except public administration (10%)
- Agriculture, forestry, fishing and hunting (8%)
- Retail trade (8%)
- Professional, scientific, and technical services (7%)
- Transportation and warehousing (7%)
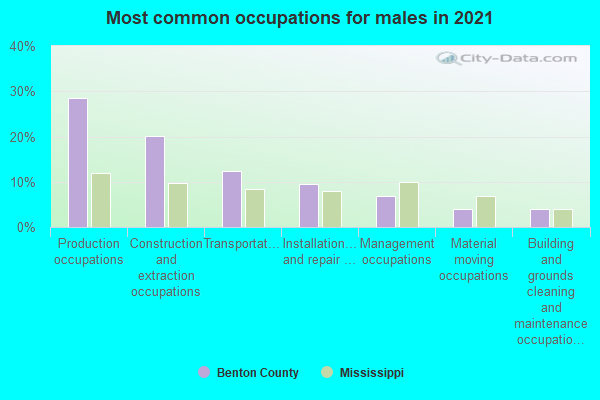
- Production occupations (23%)
- Construction and extraction occupations (21%)
- Transportation occupations (13%)
- Installation, maintenance, and repair occupations (10%)
- Management occupations (8%)
- Material moving occupations (5%)
- Sales and related occupations (5%)
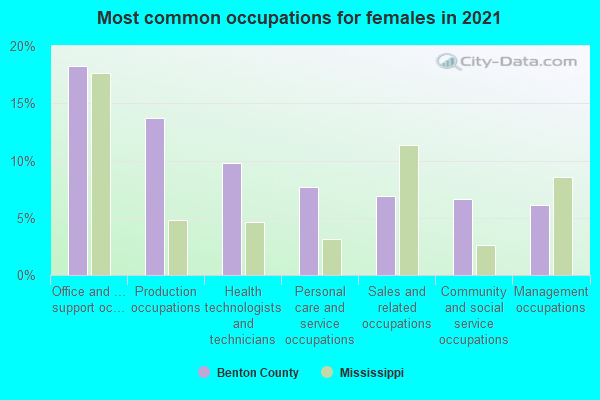
- Office and administrative support occupations (19%)
- Production occupations (12%)
- Personal care and service occupations (10%)
- Healthcare support occupations (10%)
- Health technologists and technicians (7%)
- Management occupations (7%)
- Educational instruction, and library occupations (7%)
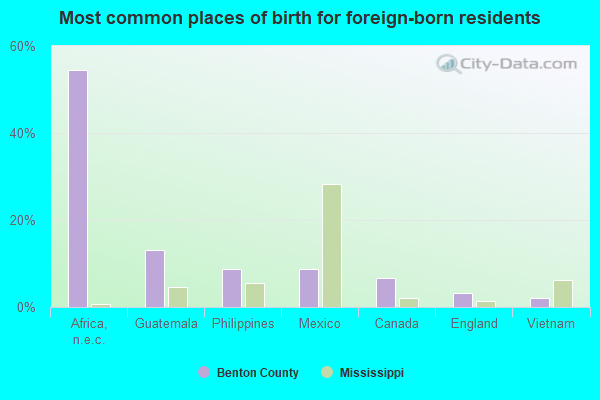
- Africa, n.e.c. (48%)
- Guatemala (20%)
- Philippines (11%)
- Canada (7%)
- England (2%)
- Vietnam (2%)
- Mexico (1%)
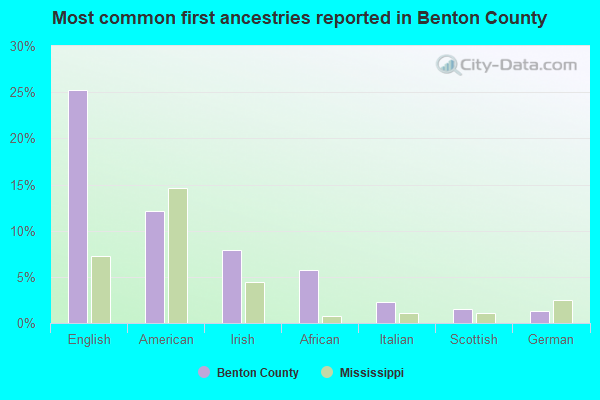
- English (26%)
- American (12%)
- African (7%)
- Irish (6%)
- Italian (2%)
- Scottish (2%)
- German (1%)
9 people in local jails and other municipal confinement facilities
100 people in nursing homes
16 people in local jails and other confinement facilities (including police lockups)
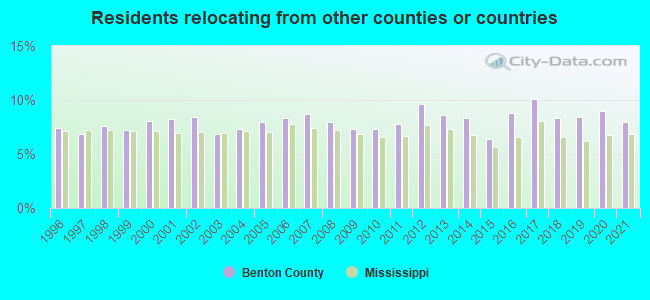
7.92% of this county's 2021 resident taxpayers lived in other counties in 2020 ($37,751 average adjusted gross income)
| Here: | 7.92% |
| Mississippi average: | 6.85% |
10 or fewer of this county's residents moved from foreign countries.
5.59% relocated from other counties in Mississippi ($24,733 average AGI)
2.32% relocated from other states ($13,018 average AGI)
Benton County: 2.32% Mississippi average: 2.80%
Top counties from which taxpayers relocated into this county between 2020 and 2021:
| from Marshall County, MS | |
| from DeSoto County, MS | |
| from Shelby County, TN | |
| from Tippah County, MS |
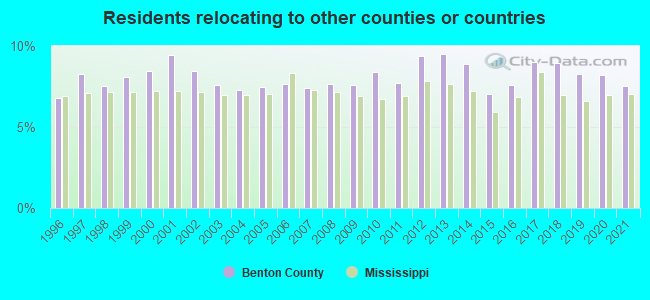
7.53% of this county's 2020 resident taxpayers moved to other counties in 2021 ($32,770 average adjusted gross income)
| Here: | 7.53% |
| Mississippi average: | 7.03% |
10 or fewer of this county's residents moved to foreign countries.
5.55% relocated to other counties in Mississippi ($24,296 average AGI)
1.98% relocated to other states ($8,474 average AGI)
Benton County: 1.98% Mississippi average: 2.99%
Top counties to which taxpayers relocated from this county between 2020 and 2021:
| to Marshall County, MS | |
| to Shelby County, TN | |
| to Tippah County, MS | |
| to Union County, MS | |
| to DeSoto County, MS |
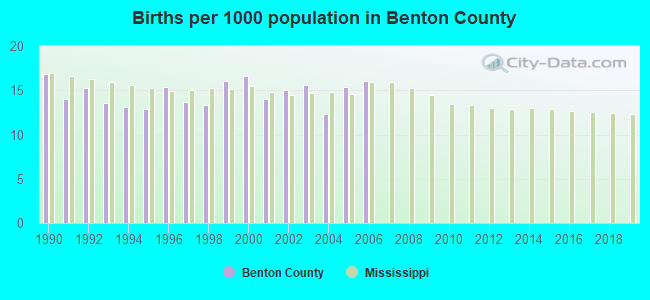
Births per 1000 population from 1990 to 1999: 14.4
Births per 1000 population from 2000 to 2006: 15.0
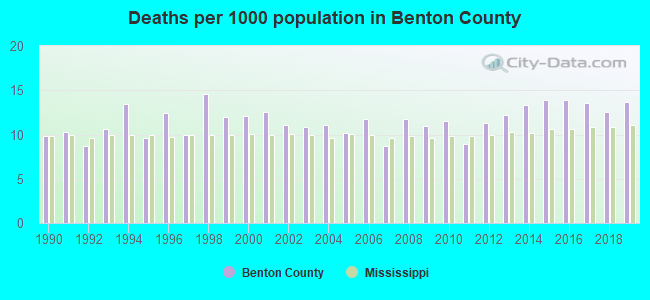
Deaths per 1000 population from 1990 to 1999: 11.1
Deaths per 1000 population from 2000 to 2009: 11.1
Deaths per 1000 population from 2010 to 2020: 12.8
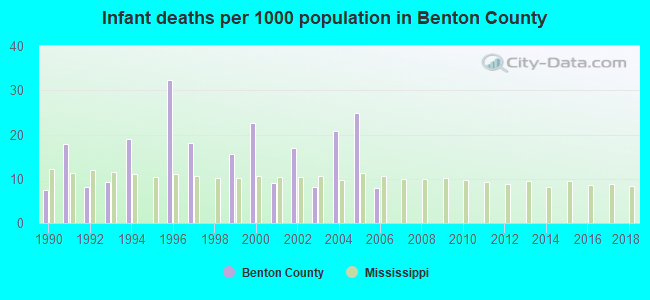
Infant deaths per 1000 live births from 1990 to 1999: 12.8
Infant deaths per 1000 live births from 2000 to 2006: 15.7
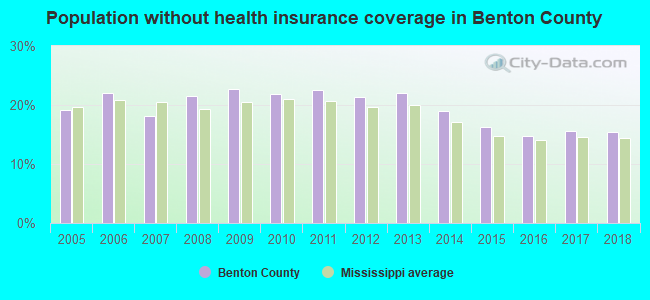
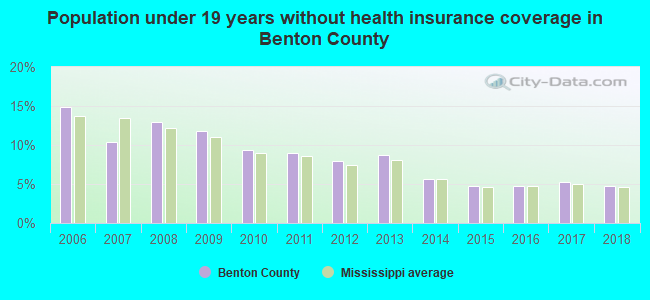
Persons under 19 years old without health insurance coverage in 2018: 4.7%
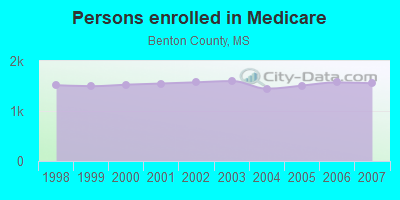
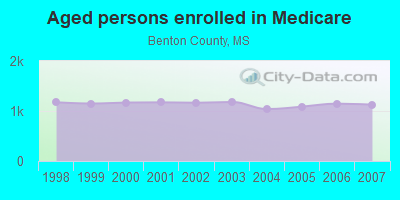
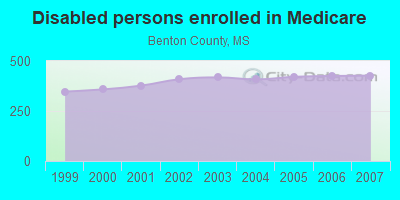
Persons enrolled in hospital insurance and/or supplemental medical insurance (Medicare) in July 1, 2007: 1,554 (1,127 aged, 427 disabled)
Children under 18 without health insurance coverage in 2007: 291 (14%)
Most common underlying causes of death in Benton County, Mississippi in 1999 - 2019:
- Bronchus or lung, unspecified - Malignant neoplasms (64)
- Hypertensive heart disease without (congestive) heart failure (60)
- Cardiovascular disease, unspecified (46)
- Atherosclerotic heart disease (15)
- Chronic obstructive pulmonary disease, unspecified (11)
- Congestive heart failure (11)
- Acute myocardial infarction, unspecified (10)
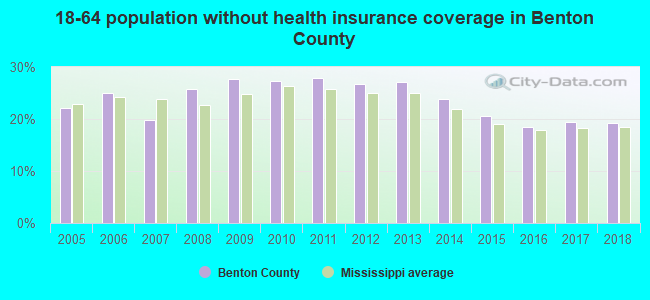
Population without health insurance coverage in 2000: 19%
Children under 18 without health insurance coverage in 2000: 15%
Medical specialist MDs per 100,000 population in 2005: 1,083
EPA green book nonattainment status in 2004-2006: 1
Crimes per 100,000 population in 1996: 1
Household type by relationship:
Households: 7,588- Male householders: 1,510 (581 living alone), Female householders: 1,648 (580 living alone)
1,445 spouses (1,328 opposite-sex spouses), 67 unmarried partners, (66 opposite-sex unmarried partners), 1,987 children (1,861 natural, 22 adopted, 99 stepchildren), 288 grandchildren, 103 brothers or sisters, 79 parents, 0 foster children, 293 other relatives, 28 non-relatives
- In group quarters: 98
Size of family households: 1,199 2-persons, 223 3-persons, 346 4-persons, 106 5-persons, 69 6-persons, 18 7-or-more-persons.
Size of nonfamily households: 1,163 1-person, 46 2-persons.
963 married couples with children.
322 single-parent households (144 men, 178 women).
93.1% of residents of Benton speak English at home.
2.1% of residents speak Spanish at home (12% speak English very well, 44% speak English well, 44% speak English not well).
0.2% of residents speak other Indo-European language at home (29% speak English very well, 71% speak English not well).
0.1% of residents speak Asian or Pacific Island language at home (100% speak English well).
2.9% of residents speak other language at home (100% speak English well).
In fiscal year 2004:
Federal Government expenditure: $57,036,000 ($7,271 per capita)
Department of Defense expenditure: $1,942,000
Federal direct payments to individuals for retirement and disability: $22,752,000
Federal other direct payments to individuals: $11,807,000
Federal direct payments not to individuals: $1,357,000
Federal grants: $17,115,000
Federal procurement contracts: $2,462,000 ($1,243,000 Department of Defense)
Federal salaries and wages: $1,544,000 ($187,000 Department of Defense)
Federal Government direct loans: $357,000
Federal guaranteed/insured loans: $246,000
Federal Government insurance: $2,159,000
Population change from April 1, 2000 to July 1, 2005:
Births: 647| Here: | 82 per 1000 residents |
| State: | 78 per 1000 residents |
Deaths: 469
| Here: | 60 per 1000 residents |
| State: | 51 per 1000 residents |
Net international migration: -1
| Here: | |
| State: |
Net internal migration: -338
| Here: | |
| State: |
Total withdrawal of fresh water for public supply: 0.47 millions of gallons per day (all from ground)
| Here: | 5.8 |
| State: | 6.3 |
| Here: | 4.5 |
| State: | 4.8 |
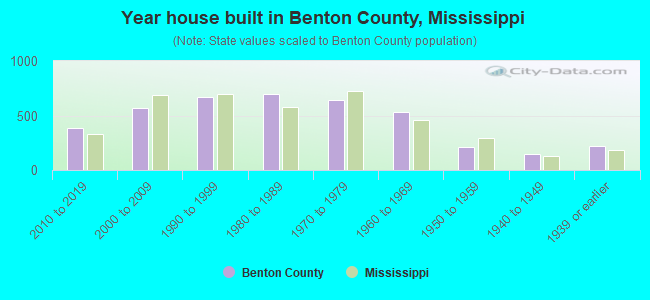
- Year house built in Benton County, Mississippi
- 602020 or later
- 4132010 to 2019
- 7012000 to 2009
- 5421990 to 1999
- 5971980 to 1989
- 6641970 to 1979
- 5601960 to 1969
- 2201950 to 1959
- 1161940 to 1949
- 1991939 or earlier
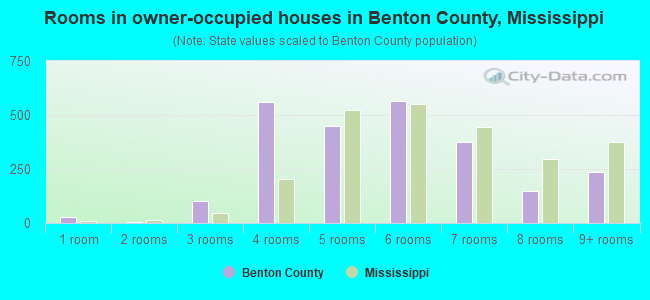
- Rooms in owner-occupied houses in Benton County, Mississippi
- 261 room
- 42 rooms
- 1353 rooms
- 5174 rooms
- 4695 rooms
- 6256 rooms
- 4877 rooms
- 1278 rooms
- 2269+ rooms
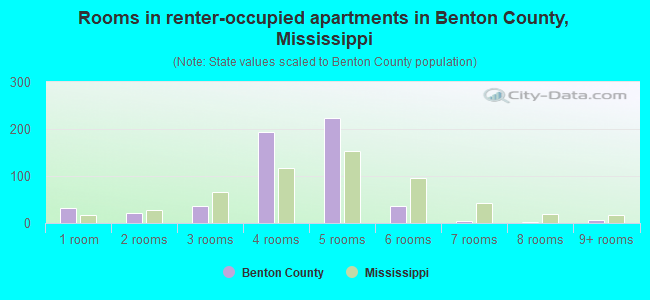
- Rooms in renter-occupied apartments in Benton County, Mississippi
- 211 room
- 242 rooms
- 163 rooms
- 2364 rooms
- 1555 rooms
- 996 rooms
- 67 rooms
- 48 rooms
- 89+ rooms
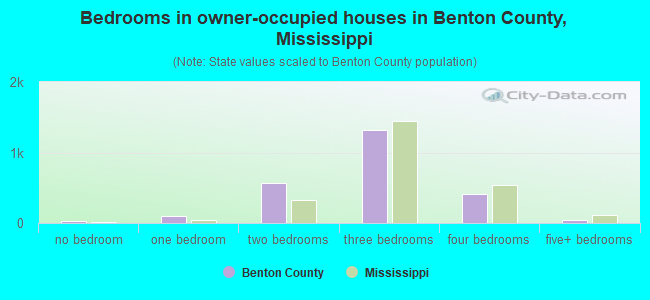
- Bedrooms in owner-occupied houses in Benton County, Mississippi
- 27no bedroom
- 1181 bedroom
- 5102 bedrooms
- 1,3993 bedrooms
- 4614 bedrooms
- 525+ bedrooms
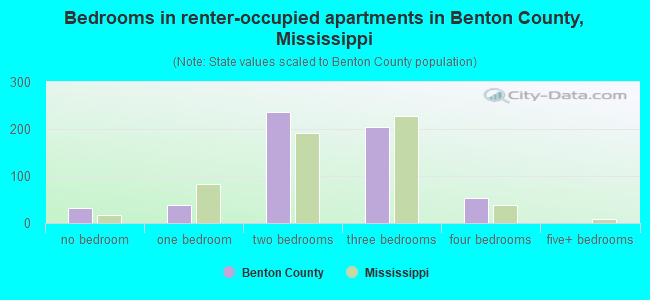
- Bedrooms in renter-occupied apartments in Benton County, Mississippi
- 22no bedroom
- 321 bedroom
- 2562 bedrooms
- 2023 bedrooms
- 684 bedrooms
- 05+ bedrooms
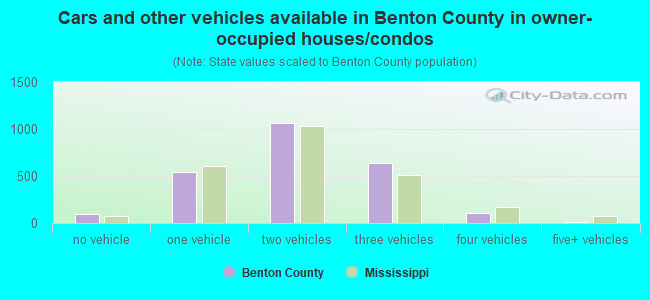
- Cars and other vehicles available in Benton County in owner-occupied houses/condos
- 147no vehicle
- 6391 vehicle
- 1,0492 vehicles
- 5973 vehicles
- 1244 vehicles
- 265+ vehicles
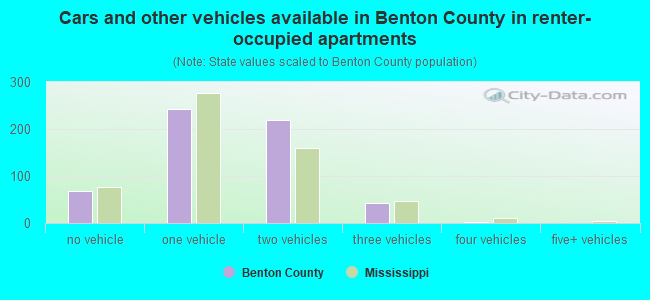
- Cars and other vehicles available in Benton County in renter-occupied apartments
- 57no vehicle
- 3151 vehicle
- 1702 vehicles
- 433 vehicles
- 24 vehicles
- 05+ vehicles
92.6% of Benton County residents lived in the same house 1 years ago.
Out of people who lived in different houses, 17% lived in this county.
Out of people who lived in different counties, 73% lived in Mississippi.
| Benton County: | 92.6% |
| State average: | 88.9% |
Place of birth for U.S.-born residents:
- This state: 4,863
- Other state: 2,196
- Northeast: 39
- Midwest: 470
- South: 1,433
- West: 248
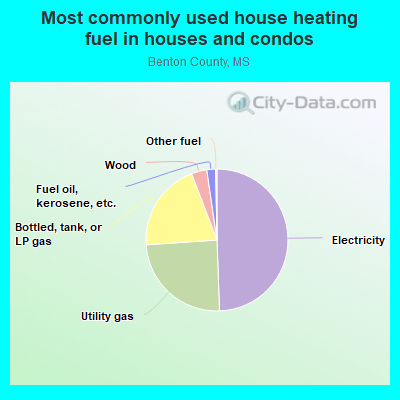
- 50.3%Electricity
- 23.0%Utility gas
- 21.0%Bottled, tank, or LP gas
- 4.4%Wood
- 0.6%Fuel oil, kerosene, etc.
- 0.6%No fuel used
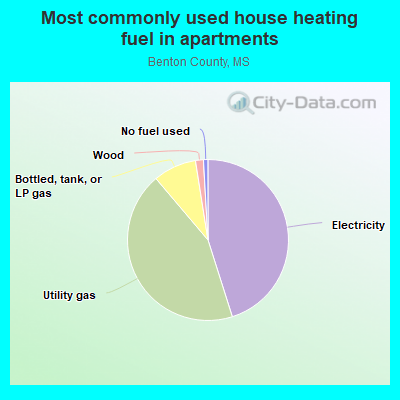
- 45.3%Utility gas
- 41.2%Electricity
- 12.6%Bottled, tank, or LP gas
- 0.9%Wood
Private vs. public school enrollment:
| Here: | 2.8% |
| Mississippi: | 16.1% |
| Here: | 4.2% |
| Mississippi: | 14.6% |
| Here: | 15.0% |
| Mississippi: | 12.8% |

Benton County government finances - Expenditure in 2017:
- Charges - Other: $67,000
- Current Operations - Regular Highways: $1,690,000
Central Staff Services: $1,210,000
Police Protection: $1,133,000
Financial Administration: $738,000
Judicial and Legal Services: $590,000
General Public Buildings: $413,000
Libraries: $235,000
General - Other: $198,000
Local Fire Protection: $140,000
Natural Resources - Other: $54,000
Health - Other: $36,000
Public Welfare - Other: $9,000
- Federal Intergovernmental - Other: $17,000
- General - Interest on Debt: $5,000
- Local Intergovernmental - Other: $76,000
- Long Term Debt - Beginning Outstanding - Unspecified Public Purpose: $256,000
Retired Unspecified Public Purpose: $153,000
Outstanding Unspecified Public Purpose: $103,000
- Miscellaneous - Fines and Forfeits: $110,000
General Revenue - Other: $86,000
Sale of Property: $42,000
Interest Earnings: $23,000
- Other Funds - Cash and Securities: $6,026,000
- State Intergovernmental - General Local Government Support: $4,083,000
Highways: $716,000
Other: $276,000
- Tax - Property: $2,545,000
Other License: $148,000
- Total Salaries and Wages: $105,000
Benton County government finances - Revenue in 2017:
- Charges - Other: $67,000
- Current Operations - Regular Highways: $1,690,000
Central Staff Services: $1,210,000
Police Protection: $1,133,000
Financial Administration: $738,000
Judicial and Legal Services: $590,000
General Public Buildings: $413,000
Libraries: $235,000
General - Other: $198,000
Local Fire Protection: $140,000
Natural Resources - Other: $54,000
Health - Other: $36,000
Public Welfare - Other: $9,000
- Federal Intergovernmental - Other: $17,000
- General - Interest on Debt: $5,000
- Local Intergovernmental - Other: $76,000
- Long Term Debt - Beginning Outstanding - Unspecified Public Purpose: $256,000
Retired Unspecified Public Purpose: $153,000
Outstanding Unspecified Public Purpose: $103,000
- Miscellaneous - Fines and Forfeits: $110,000
General Revenue - Other: $86,000
Sale of Property: $42,000
Interest Earnings: $23,000
- Other Funds - Cash and Securities: $6,026,000
- State Intergovernmental - General Local Government Support: $4,083,000
Highways: $716,000
Other: $276,000
- Tax - Property: $2,545,000
Other License: $148,000
- Total Salaries and Wages: $105,000
Benton County government finances - Debt in 2017:
- Charges - Other: $67,000
- Current Operations - Regular Highways: $1,690,000
Central Staff Services: $1,210,000
Police Protection: $1,133,000
Financial Administration: $738,000
Judicial and Legal Services: $590,000
General Public Buildings: $413,000
Libraries: $235,000
General - Other: $198,000
Local Fire Protection: $140,000
Natural Resources - Other: $54,000
Health - Other: $36,000
Public Welfare - Other: $9,000
- Federal Intergovernmental - Other: $17,000
- General - Interest on Debt: $5,000
- Local Intergovernmental - Other: $76,000
- Long Term Debt - Beginning Outstanding - Unspecified Public Purpose: $256,000
Retired Unspecified Public Purpose: $153,000
Outstanding Unspecified Public Purpose: $103,000
- Miscellaneous - Fines and Forfeits: $110,000
General Revenue - Other: $86,000
Sale of Property: $42,000
Interest Earnings: $23,000
- Other Funds - Cash and Securities: $6,026,000
- State Intergovernmental - General Local Government Support: $4,083,000
Highways: $716,000
Other: $276,000
- Tax - Property: $2,545,000
Other License: $148,000
- Total Salaries and Wages: $105,000
Benton County government finances - Cash and Securities in 2017:
- Charges - Other: $67,000
- Current Operations - Regular Highways: $1,690,000
Central Staff Services: $1,210,000
Police Protection: $1,133,000
Financial Administration: $738,000
Judicial and Legal Services: $590,000
General Public Buildings: $413,000
Libraries: $235,000
General - Other: $198,000
Local Fire Protection: $140,000
Natural Resources - Other: $54,000
Health - Other: $36,000
Public Welfare - Other: $9,000
- Federal Intergovernmental - Other: $17,000
- General - Interest on Debt: $5,000
- Local Intergovernmental - Other: $76,000
- Long Term Debt - Beginning Outstanding - Unspecified Public Purpose: $256,000
Retired Unspecified Public Purpose: $153,000
Outstanding Unspecified Public Purpose: $103,000
- Miscellaneous - Fines and Forfeits: $110,000
General Revenue - Other: $86,000
Sale of Property: $42,000
Interest Earnings: $23,000
- Other Funds - Cash and Securities: $6,026,000
- State Intergovernmental - General Local Government Support: $4,083,000
Highways: $716,000
Other: $276,000
- Tax - Property: $2,545,000
Other License: $148,000
- Total Salaries and Wages: $105,000
Supplemental Security Income (SSI) in 2006:
- Total number of recipients: 500
- Number of aged recipients: 79
- Number of blind and disabled recipients: 421
- Number of recipients under 18: 76
- Number of recipients between 18 and 64: 263
- Number of recipients older than 64: 161
- Number of recipients also receiving OASDI: 216
- Amount of payments (thousands of dollars): 191
| Most common first names in Benton County, MS among deceased individuals | ||
| Name | Count | Lived (average) |
|---|---|---|
| James | 223 | 72.3 years |
| Mary | 176 | 78.3 years |
| John | 148 | 74.2 years |
| William | 124 | 73.9 years |
| Willie | 124 | 75.9 years |
| Robert | 92 | 70.4 years |
| George | 76 | 76.3 years |
| Charles | 59 | 68.7 years |
| Henry | 52 | 73.0 years |
| Annie | 52 | 78.4 years |
| Most common last names in Benton County, MS among deceased individuals | ||
| Last name | Count | Lived (average) |
|---|---|---|
| Jones | 134 | 74.6 years |
| Smith | 93 | 75.5 years |
| Brown | 79 | 73.2 years |
| Taylor | 60 | 76.3 years |
| Thompson | 52 | 76.0 years |
| Cox | 48 | 76.3 years |
| Williams | 46 | 73.5 years |
| Johnson | 46 | 75.5 years |
| Moore | 46 | 77.3 years |
| Jeffries | 42 | 73.1 years |
Businesses in Benton County, MS
- UPS: 1
Benton County on our top lists:
- #100 on the list of "Top 101 counties with the smallest number of children under 18 without health insurance coverage in 2000"