La Salle Parish, Louisiana (LA)
County owner-occupied free and clear houses and condos in 2010: 2,254
County owner-occupied houses and condos in 2000: 4,416
Renter-occupied apartments: 1,063 (it was 875 in 2000)
| % of renters here: | 17% |
| State: | 33% |
Land area: 624 sq. mi.
Water area: 38.5 sq. mi.
Population density: 23 people per square mile (low).
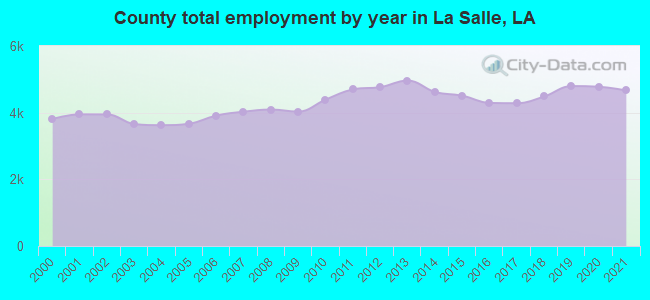
Industries providing employment: Educational, health and social services (30.2%), Agriculture,forestry,fishing and hunting, and mining (14.6%), Retail trade (11.4%).
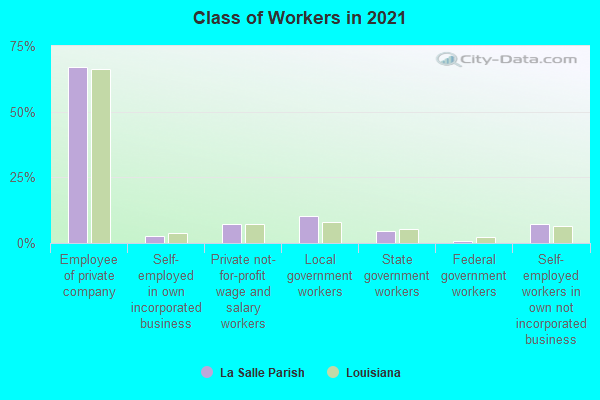
Type of workers:
- Private wage or salary: 75%
- Government: 18%
- Self-employed, not incorporated: 7%
- Unpaid family work: 0%
- OSM Map
- General Map
- Google Map
- MSN Map

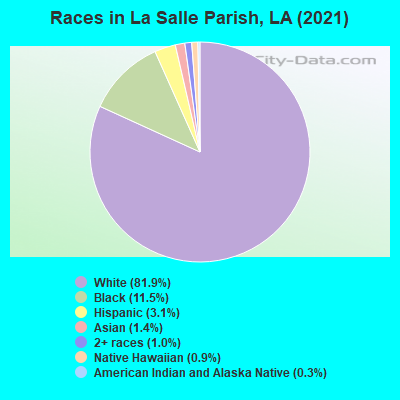
- 11,48679.0%White Non-Hispanic Alone
- 1,68911.6%Black Non-Hispanic Alone
- 5974.1%Hispanic or Latino
- 3392.3%Two or more races
- 2831.9%Asian alone
- 800.6%Native Hawaiian and Other
Pacific Islander alone - 590.4%American Indian and Alaska Native alone
| Median resident age: | 38.9 years |
| Louisiana median age: | 38.2 years |
| Males: 7,902 | |
| Females: 6,701 |

| La Salle Parish: | 2.0 people |
| Louisiana: | 3 people |
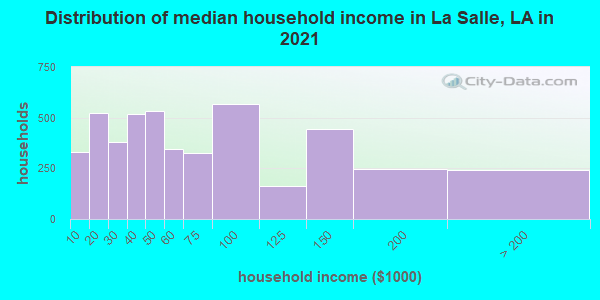
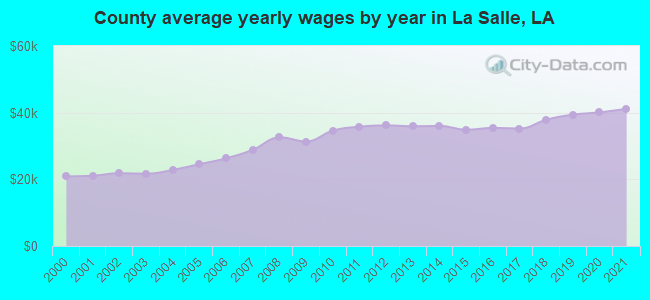
Estimated median household income in 2022: $57,402 ($28,189 in 1999)
| This county: | $57,402 |
| Louisiana: | $55,416 |
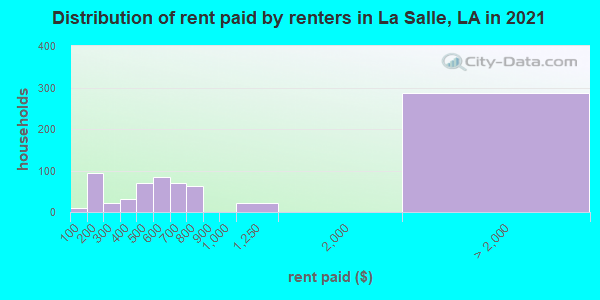
Median contract rent in 2022 for apartments: $333 (lower quartile is $164, upper quartile is $598)
| This county: | $333 |
| State: | $779 |
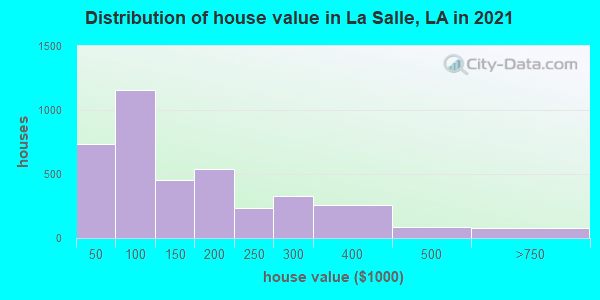
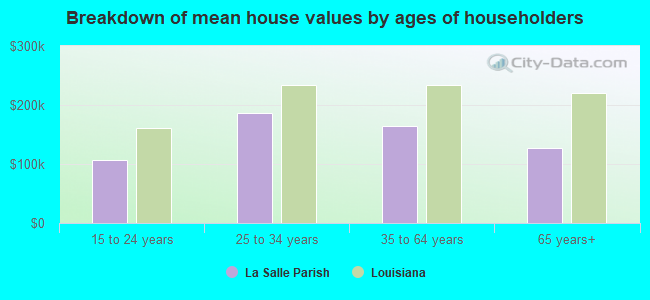
Estimated median house or condo value in 2022: $127,124 (it was $43,300 in 2000)
| La Salle: | $127,124 |
| Louisiana: | $209,200 |
Median monthly housing costs for homes and condos with a mortgage: $1,330
Median monthly housing costs for units without a mortgage: $358
Institutionalized population: 1,229
Crime in 2020 (reported by the sheriff's office or county police, not the county total):
- Murders: 0
- Rapes: 0
- Robberies: 1
- Assaults: 36
- Burglaries: 16
- Thefts: 13
- Auto thefts: 1
Crime in 2019 (reported by the sheriff's office or county police, not the county total):
- Murders: 0
- Rapes: 2
- Robberies: 1
- Assaults: 27
- Burglaries: 28
- Thefts: 31
- Auto thefts: 7
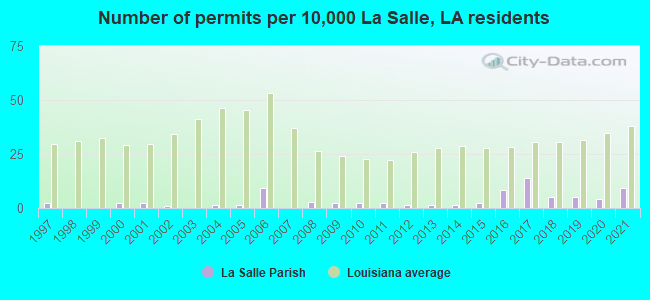
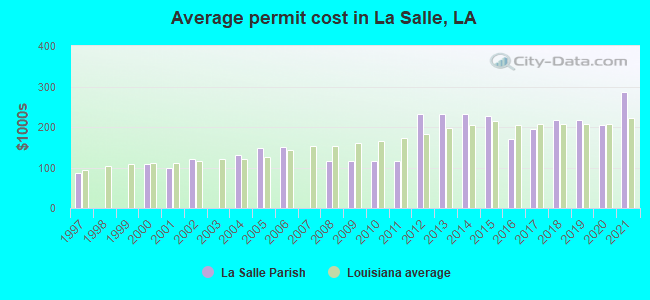
Single-family new house construction building permits:
- 2021: 13 buildings, average cost: $287,300
- 2020: 6 buildings, average cost: $204,400
- 2019: 7 buildings, average cost: $217,000
- 2018: 7 buildings, average cost: $217,000
- 2017: 20 buildings, average cost: $195,800
- 2016: 12 buildings, average cost: $170,700
- 2015: 3 buildings, average cost: $225,700
- 2014: 2 buildings, average cost: $232,500
- 2013: 2 buildings, average cost: $232,500
- 2012: 2 buildings, average cost: $232,500
- 2011: 3 buildings, average cost: $116,300
- 2010: 3 buildings, average cost: $116,300
- 2009: 3 buildings, average cost: $116,300
- 2008: 4 buildings, average cost: $116,300
- 2007: 0 buildings
- 2006: 13 buildings, average cost: $150,000
- 2005: 2 buildings, average cost: $148,500
- 2004: 2 buildings, average cost: $131,000
- 2003: 0 buildings
- 2002: 1 building, cost: $121,800
- 2001: 3 buildings, average cost: $100,000
- 2000: 3 buildings, average cost: $109,000
- 1999: 0 buildings
- 1998: 0 buildings
- 1997: 3 buildings, average cost: $87,200
Median real estate property taxes paid for housing units with mortgages in 2022: $1,291 (0.7%)
Median real estate property taxes paid for housing units with no mortgage in 2022: $499 (0.6%)
| La Salle Parish: | 15.1% |
| Louisiana: | 18.6% |
Median age of residents in 2022: 38.9 years old
(Males: 37.1 years old, Females: 40.9 years old)
(Median age for: White residents: 39.9 years old, Black residents: 35.8 years old, American Indian residents: 61.2 years old, Asian residents: 31.2 years old, Hispanic or Latino residents: 35.1 years old, Other race residents: 36.9 years old)
Fair market rent in 2006 for a 1-bedroom apartment in La Salle Parish is $344 a month.
Fair market rent for a 2-bedroom apartment is $421 a month.
Fair market rent for a 3-bedroom apartment is $533 a month.
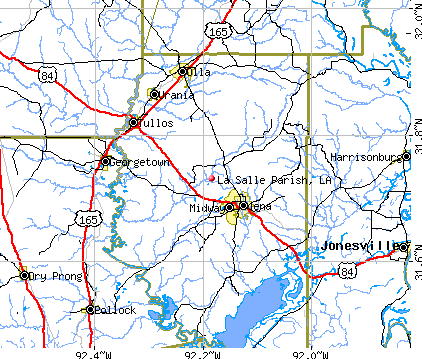
Cities in this county include: Jena, Midway, Olla, Urania, Hester, Tullos.
Neighboring counties: Ben Hill County, Georgia  , Catahoula Parish
  , Simpson County, Mississippi , Washington County, Alabama , Stewart County, Georgia , Reagan County, Texas
  .
.
Current college students: 371
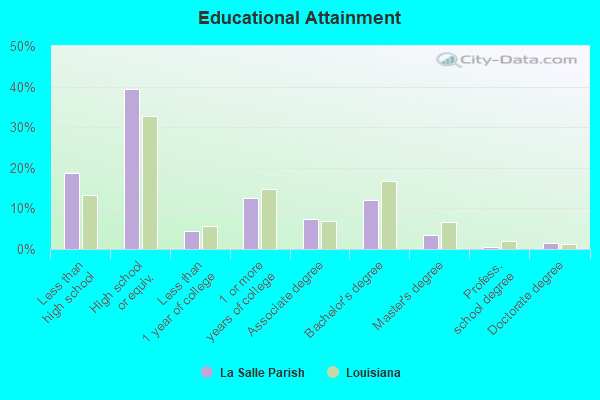
People 25 years of age or older with a high school degree or higher: 82.9%
People 25 years of age or older with a bachelor's degree or higher: 17.7%
Number of foreign born residents: 192 (47.4% naturalized citizens)
| La Salle Parish: | 1.3% |
| Whole state: | 4.2% |
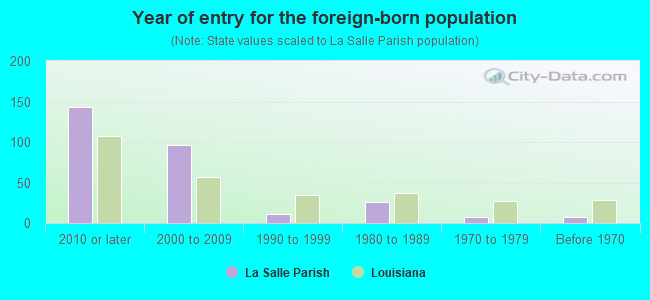
- Year of entry for the foreign-born population
- 802010 or later
- 902000 to 2009
- 51990 to 1999
- 261980 to 1989
- 81970 to 1979
- 7Before 1970
Mean travel time to work (commute): " minutes
Percentage of county residents living and working in this county: 91.9%
Housing units in structures:
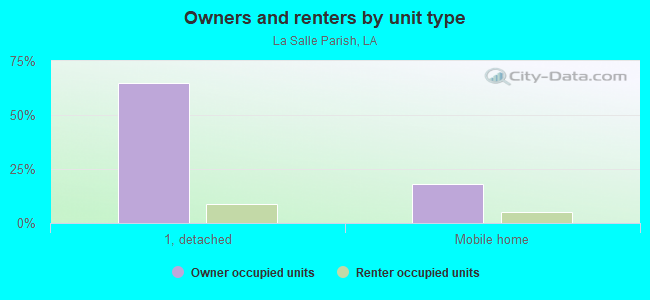
- One, detached: 4,346
- One, attached: 31
- Two: 71
- 3 or 4: 55
- 5 to 9: 27
- 10 to 19: 4
- 50 or more: 5
- Mobile homes: 1,707
- Boats, RVs, vans, etc.: 48
Housing units in La Salle Parish with a mortgage: 1,881 (61 second mortgage, 0 home equity loan, 56 both second mortgage and home equity loan)
Houses without a mortgage: 0
| Here: | 100.0% with mortgage |
| State: | 98.3% with mortgage |
Religion statistics for La Salle Parish
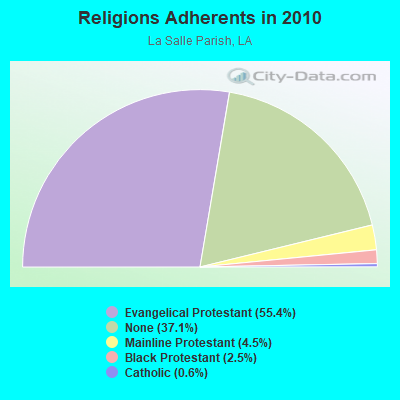
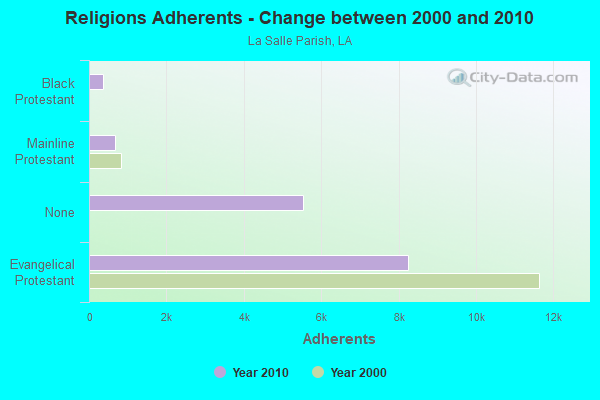
| Religion | Adherents | Congregations |
|---|---|---|
| Evangelical Protestant | 8,242 | 45 |
| Mainline Protestant | 672 | 6 |
| Black Protestant | 368 | 2 |
| Catholic | 90 | 2 |
| Other | - | 1 |
| None | 5,518 | - |
Source: Clifford Grammich, Kirk Hadaway, Richard Houseal, Dale E.Jones, Alexei Krindatch, Richie Stanley and Richard H.Taylor. 2012. 2010 U.S.Religion Census: Religious Congregations & Membership Study. Association of Statisticians of American Religious Bodies. Jones, Dale E., et al. 2002. Congregations and Membership in the United States 2000. Nashville, TN: Glenmary Research Center.
Food Environment Statistics:
| La Salle Parish: | 2.14 / 10,000 pop. |
| State: | 2.56 / 10,000 pop. |
| This county: | 4.27 / 10,000 pop. |
| Louisiana: | 1.29 / 10,000 pop. |
| La Salle Parish: | 5.70 / 10,000 pop. |
| Louisiana: | 4.49 / 10,000 pop. |
| This county: | 1.42 / 10,000 pop. |
| State: | 5.92 / 10,000 pop. |
| La Salle Parish: | 11.1% |
| Louisiana: | 10.9% |
| La Salle Parish: | 28.6% |
| State: | 29.2% |
| Here: | 13.2% |
| State: | 13.7% |
Agriculture in La Salle Parish:
Average size of farms: 105 acresAverage value of agricultural products sold per farm: $6,345
Average value of crops sold per acre for harvested cropland: $63.70
The value of nursery, greenhouse, floriculture, and sod as a percentage of the total market value of agricultural products sold: 0.00%
The value of livestock, poultry, and their products as a percentage of the total market value of agricultural products sold: 81.73%
Average total farm production expenses per farm: $6,546
Harvested cropland as a percentage of land in farms: 17.30%
Average market value of all machinery and equipment per farm: $22,420
The percentage of farms operated by a family or individual: 96.89%
Average age of principal farm operators: 53 years
Average number of cattle and calves per 100 acres of all land in farms: 19.01
Earthquake activity:
La Salle Parish-area historical earthquake activity is significantly above Louisiana state average. It is 232% greater than the overall U.S. average.On 5/17/2012 at 08:12:00, a magnitude 4.8 (4.8 MW, Depth: 3.1 mi, Class: Light, Intensity: IV - V) earthquake occurred 129.0 miles away from La Salle Parish center
On 11/6/2011 at 03:53:10, a magnitude 5.7 (5.7 MW, Depth: 3.2 mi, Class: Moderate, Intensity: VI - VII) earthquake occurred 372.4 miles away from the county center
On 9/2/2013 at 23:51:15, a magnitude 4.3 (4.3 MW, Depth: 2.9 mi) earthquake occurred 132.4 miles away from the county center
On 9/3/2016 at 12:02:44, a magnitude 5.8 (5.8 MW, Depth: 3.5 mi) earthquake occurred 423.3 miles away from the county center
On 9/2/2013 at 21:52:38, a magnitude 4.2 (4.2 MW, Depth: 3.0 mi) earthquake occurred 138.5 miles away from La Salle Parish center
On 3/25/1976 at 00:41:20, a magnitude 5.0 (4.9 MB, 5.0 LG) earthquake occurred 290.6 miles away from the county center
Magnitude types: regional Lg-wave magnitude (LG), body-wave magnitude (MB), moment magnitude (MW)
Most recent natural disasters:
- Louisiana Hurricane Delta, Incident Period: October 6, 2020 - October 10, 2020, FEMA Id: 4570, Natural disaster type: Hurricane
- Louisiana Hurricane Laura, Incident Period: August 22, 2020 - August 27, 2020, FEMA Id: 4559, Natural disaster type: Hurricane
- Louisiana Covid-19 Pandemic, Incident Period: January 20, 2020, Major Disaster (Presidential) Declared DR-4484-LA: March 24, 2020, FEMA Id: 4484, Natural disaster type: Other
- Louisiana Severe Storms and Flooding, Incident Period: March 08, 2016 to April 08, 2016, Major Disaster (Presidential) Declared DR-4263: March 13, 2016, FEMA Id: 4263, Natural disaster type: Storm, Flood
- Louisiana Flooding, Incident Period: April 25, 2011 to July 07, 2011, Emergency Declared EM-3322: May 06, 2011, FEMA Id: 3322, Natural disaster type: Flood
- Louisiana Flooding, Incident Period: April 25, 2011 to July 07, 2011, Major Disaster (Presidential) Declared DR-4015: August 18, 2011, FEMA Id: 4015, Natural disaster type: Flood
- Louisiana Hurricane Gustav, Incident Period: September 01, 2008 to September 11, 2008, Major Disaster (Presidential) Declared DR-1786: September 02, 2008, FEMA Id: 1786, Natural disaster type: Hurricane
- Louisiana Severe Storms and Flooding, Incident Period: October 16, 2006 to November 08, 2006, Major Disaster (Presidential) Declared DR-1668: November 02, 2006, FEMA Id: 1668, Natural disaster type: Storm, Flood
- Louisiana Hurricane Rita, Incident Period: September 23, 2005 to November 01, 2005, Major Disaster (Presidential) Declared DR-1607: September 24, 2005, FEMA Id: 1607, Natural disaster type: Hurricane
- Louisiana Hurricane Rita, Incident Period: September 20, 2005 to November 01, 2005, Emergency Declared EM-3260: September 21, 2005, FEMA Id: 3260, Natural disaster type: Hurricane
- 11 other natural disasters have been reported since 1953.
The number of natural disasters in La Salle Parish (21) is greater than the US average (15).
Major Disasters (Presidential) Declared: 15
Emergencies Declared: 4
Causes of natural disasters: Floods: 12, Hurricanes: 7, Storms: 7, Tornadoes: 3, Drought: 1, Freeze: 1, Heavy Rain: 1, Other: 1 (Note: some incidents may be assigned to more than one category).
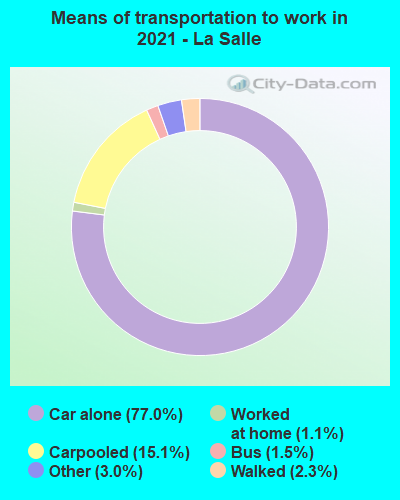
Means of transportation to work:
- Drove a car alone: 4,350 (74.5%)
- Carpooled: 850 (14.5%)
- Bus: 61 (1.0%)
- Taxicab, motorcycle, or other means: 180 (3.1%)
- Walked: 145 (2.5%)
- Worked at home: 187 (3.2%)
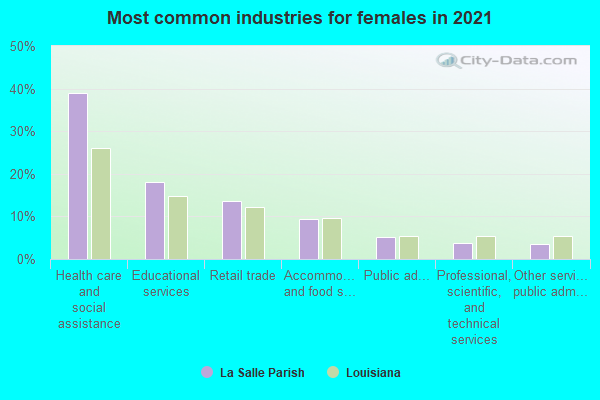
- Health care and social assistance (26%)
- Educational services (14%)
- Retail trade (7%)
- Accommodation and food services (7%)
- Other services, except public administration (5%)
- Professional, scientific, and technical services (3%)
- Public administration (3%)
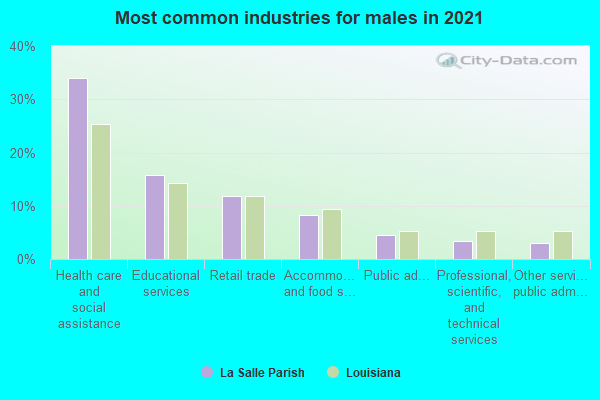
- Health care and social assistance (36%)
- Educational services (19%)
- Retail trade (10%)
- Accommodation and food services (10%)
- Other services, except public administration (7%)
- Professional, scientific, and technical services (5%)
- Public administration (4%)
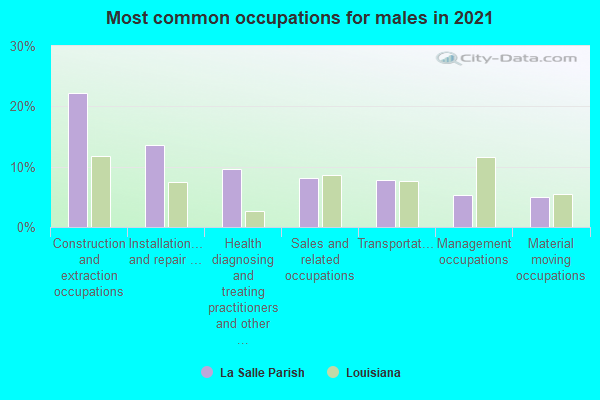
- Construction and extraction occupations (23%)
- Installation, maintenance, and repair occupations (12%)
- Sales and related occupations (9%)
- Health diagnosing and treating practitioners and other technical occupations (8%)
- Management occupations (7%)
- Transportation occupations (6%)
- Material moving occupations (5%)
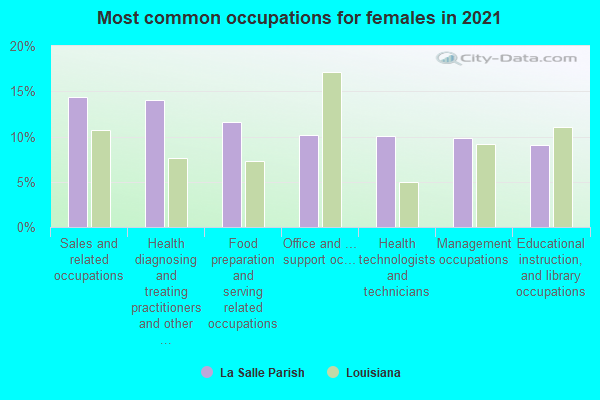
- Sales and related occupations (16%)
- Food preparation and serving related occupations (13%)
- Office and administrative support occupations (12%)
- Health diagnosing and treating practitioners and other technical occupations (12%)
- Management occupations (9%)
- Educational instruction, and library occupations (8%)
- Healthcare support occupations (8%)
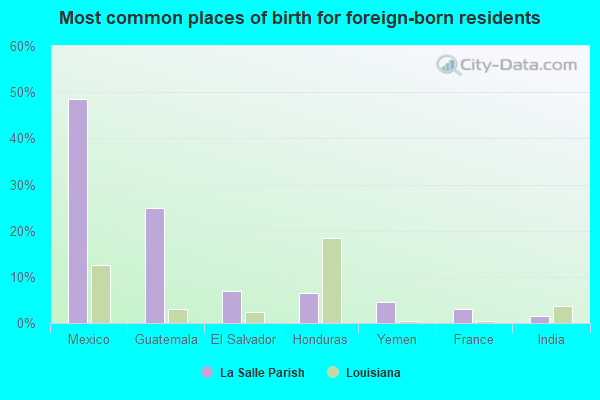
- Mexico (53%)
- El Salvador (12%)
- Honduras (10%)
- India (5%)
- Cuba (4%)
- France (3%)
- Iraq (3%)
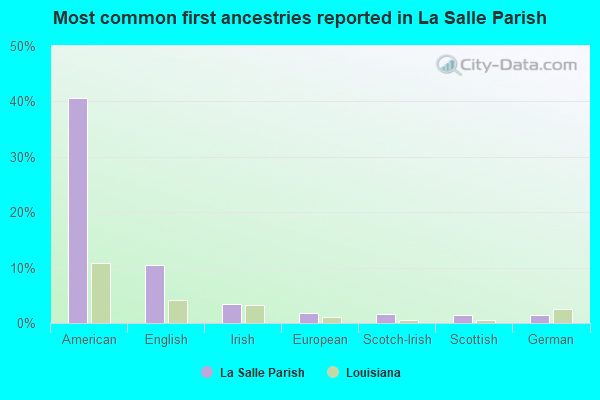
- American (51%)
- English (12%)
- Irish (2%)
- Scottish (2%)
- European (1%)
- German (1%)
- Scotch-Irish (1%)
People in group quarters in La Salle Parish, Louisiana in 2010:
- 604 people in state prisons
- 427 people in federal detention centers
- 181 people in nursing facilities/skilled-nursing facilities
- 14 people in group homes intended for adults
- 13 people in local jails and other municipal confinement facilities
- 4 people in mental (psychiatric) hospitals and psychiatric units in other hospitals
People in group quarters in La Salle Parish, Louisiana in 2000:
- 464 people in local jails and other confinement facilities (including police lockups)
- 244 people in unknown juvenile institutions
- 206 people in nursing homes
- 6 people in other types of correctional institutions
- 3 people in mental (psychiatric) hospitals or wards
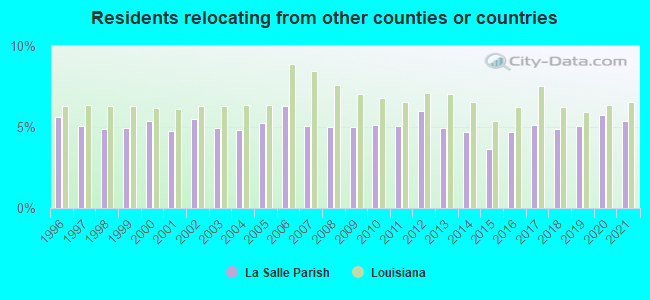
5.39% of this county's 2021 resident taxpayers lived in other counties in 2020 ($31,133 average adjusted gross income)
| Here: | 5.39% |
| Louisiana average: | 6.53% |
10 or fewer of this county's residents moved from foreign countries.
4.54% relocated from other counties in Louisiana ($26,635 average AGI)
0.85% relocated from other states ($4,498 average AGI)
La Salle Parish: 0.85% Louisiana average: 2.12%
Top counties from which taxpayers relocated into this county between 2020 and 2021:
| from Rapides Parish, LA | |
| from Catahoula Parish, LA | |
| from Grant Parish, LA |
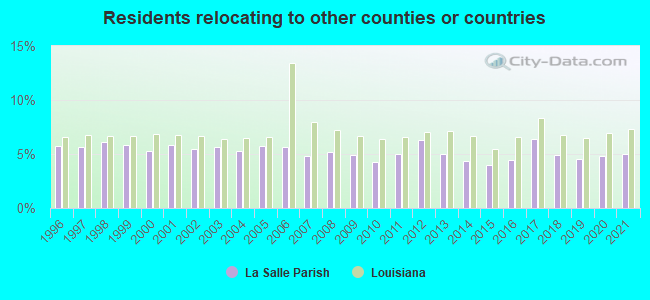
5.03% of this county's 2020 resident taxpayers moved to other counties in 2021 ($43,018 average adjusted gross income)
| Here: | 5.03% |
| Louisiana average: | 7.33% |
10 or fewer of this county's residents moved to foreign countries.
4.13% relocated to other counties in Louisiana ($33,853 average AGI)
0.90% relocated to other states ($9,170 average AGI)
La Salle Parish: 0.90% Louisiana average: 2.97%
Top counties to which taxpayers relocated from this county between 2020 and 2021:
| to Catahoula Parish, LA | |
| to Rapides Parish, LA | |
| to Caldwell Parish, LA |
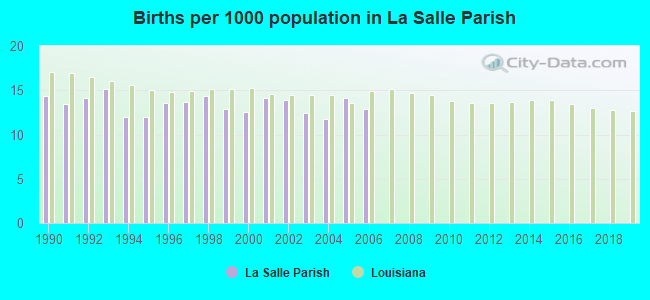
Births per 1000 population from 1990 to 1999: 13.5
Births per 1000 population from 2000 to 2006: 13.1
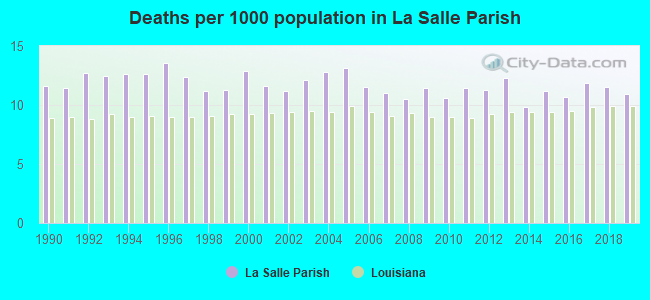
Deaths per 1000 population from 1990 to 1999: 12.2
Deaths per 1000 population from 2000 to 2009: 11.8
Deaths per 1000 population from 2010 to 2020: 11.4
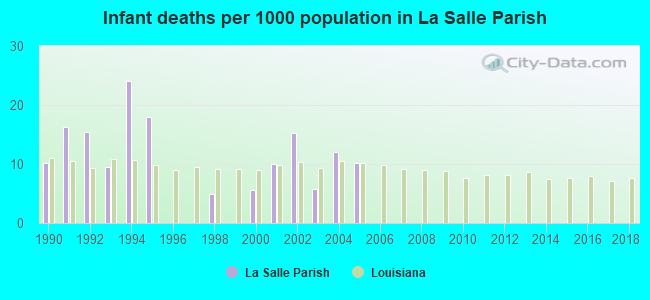
Infant deaths per 1000 live births from 1990 to 1999: 9.8
Infant deaths per 1000 live births from 2000 to 2006: 8.4
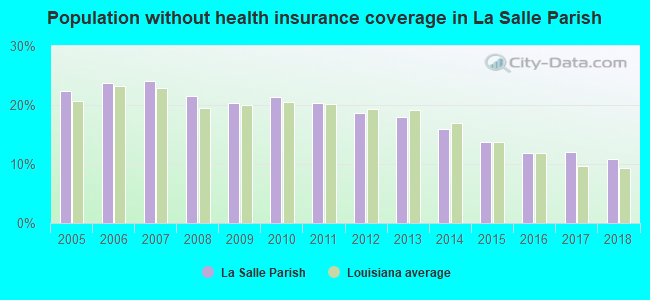
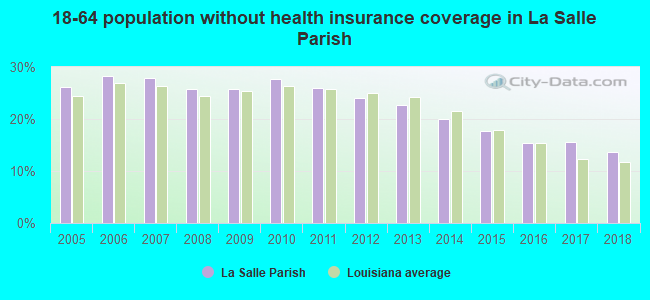
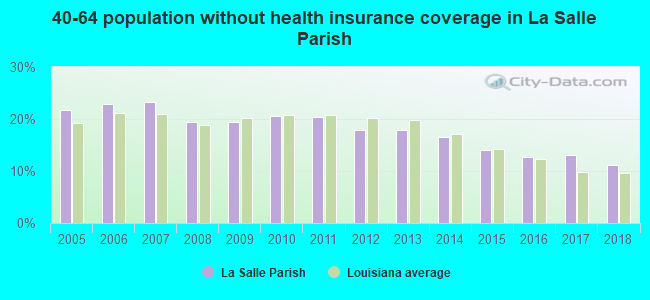
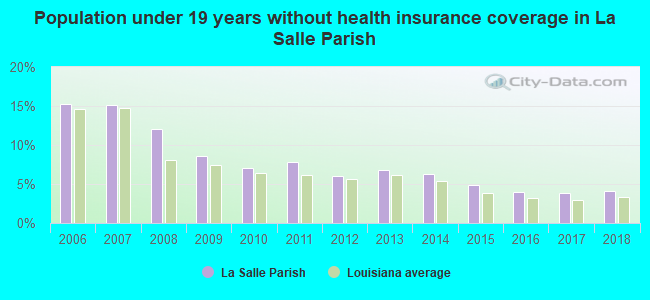
Persons under 19 years old without health insurance coverage in 2018: 4.1%
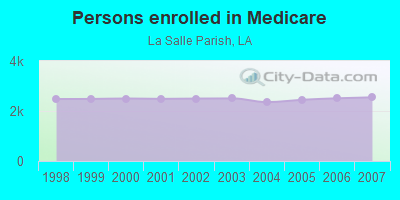
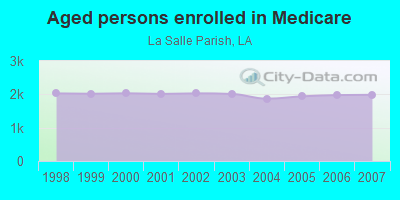
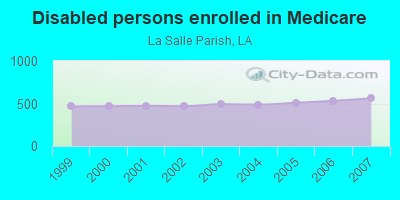
Persons enrolled in hospital insurance and/or supplemental medical insurance (Medicare) in July 1, 2007: 2,547 (1,986 aged, 561 disabled)
Children under 18 without health insurance coverage in 2007: 464 (14%)
Most common underlying causes of death in La Salle Parish, Louisiana in 1999 - 2019:
- Acute myocardial infarction, unspecified (293)
- Bronchus or lung, unspecified - Malignant neoplasms (211)
- Atherosclerotic heart disease (88)
- Chronic obstructive pulmonary disease, unspecified (71)
- Alzheimer disease, unspecified (16)
- Cardiomyopathy, unspecified (11)
- Congestive heart failure (11)
- Pneumonia, unspecified (11)
Population without health insurance coverage in 2000: 14%
Children under 18 without health insurance coverage in 2000: 10%
Short term general hospital admissions per 100,000 population in 2004: 18,756
Short term general hospital beds per 100,000 population in 2004: 671
Emergency room visits per 100,000 population in 2004: 92,606
General practice office based MDs per 100,000 population in 2005: 1,168
Medical specialist MDs per 100,000 population in 2005: 1,239
Total births per 100,000 population, July 2005 - July 2006 : 15
Total deaths per 100,000 population, July 2005 - July 2006: 50
Crimes per 100,000 population in 1996: 1
Household type by relationship:
Households: 14,603- Male householders: 2,373 (374 living alone), Female householders: 2,423 (665 living alone)
2,500 spouses (2,481 opposite-sex spouses), 237 unmarried partners, (237 opposite-sex unmarried partners), 4,627 children (4,152 natural, 226 adopted, 254 stepchildren), 572 grandchildren, 127 brothers or sisters, 84 parents, 0 foster children, 388 other relatives, 132 non-relatives
- In group quarters: 1,106
Size of family households: 1,617 2-persons, 598 3-persons, 719 4-persons, 430 5-persons, 182 6-persons, 12 7-or-more-persons.
Size of nonfamily households: 1,038 1-person, 151 2-persons, 1 4-persons.
1,515 married couples with children.
1,133 single-parent households (145 men, 988 women).
96.3% of residents of La Salle speak English at home.
2.3% of residents speak Spanish at home (53% speak English very well, 30% speak English well, 4% speak English not well, 13% don't speak English at all).
0.6% of residents speak other Indo-European language at home (78% speak English very well, 22% speak English well).
0.6% of residents speak Asian or Pacific Island language at home (99% speak English well, 1% don't speak English at all).
0.1% of residents speak other language at home (73% speak English well, 27% don't speak English at all).
In fiscal year 2004:
Federal Government expenditure: $86,893,000 ($6,136 per capita)
Department of Defense expenditure: $5,546,000
Federal direct payments to individuals for retirement and disability: $35,611,000
Federal other direct payments to individuals: $25,593,000
Federal direct payments not to individuals: $804,000
Federal grants: $18,452,000
Federal procurement contracts: $900,000 ($477,000 Department of Defense)
Federal salaries and wages: $5,532,000 ($3,910,000 Department of Defense)
Federal Government direct loans: $219,000
Federal guaranteed/insured loans: $993,000
Federal Government insurance: $5,037,000
Population change from April 1, 2000 to July 1, 2005:
Births: 962| Here: | 69 per 1000 residents |
| State: | 78 per 1000 residents |
Deaths: 865
| Here: | 62 per 1000 residents |
| State: | 49 per 1000 residents |
Net international migration: +15
| Here: | +1 per 1000 residents |
| State: | +4 per 1000 residents |
Net internal migration: -327
| Here: | |
| State: |
Total withdrawal of fresh water for public supply: 2.80 millions of gallons per day (all from ground)
| Here: | 5.8 |
| State: | 6.2 |
| Here: | 4.9 |
| State: | 4.4 |
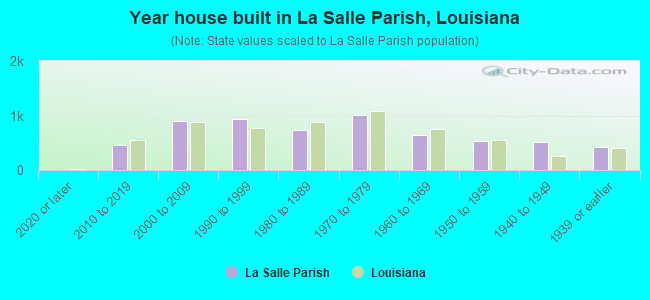
- Year house built in La Salle Parish, Louisiana
- 52020 or later
- 5702010 to 2019
- 9172000 to 2009
- 9061990 to 1999
- 7041980 to 1989
- 1,1281970 to 1979
- 5551960 to 1969
- 3621950 to 1959
- 5571940 to 1949
- 4751939 or earlier
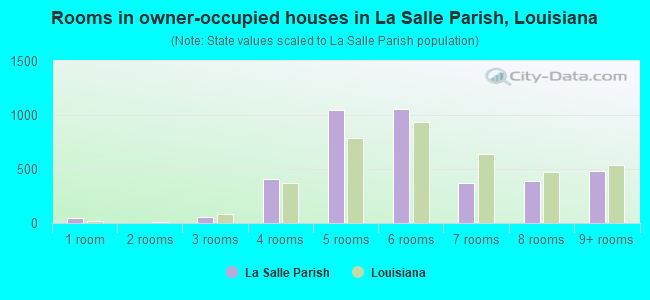
- Rooms in owner-occupied houses in La Salle Parish, Louisiana
- 291 room
- 172 rooms
- 393 rooms
- 3484 rooms
- 1,2155 rooms
- 1,1256 rooms
- 4097 rooms
- 3818 rooms
- 4349+ rooms
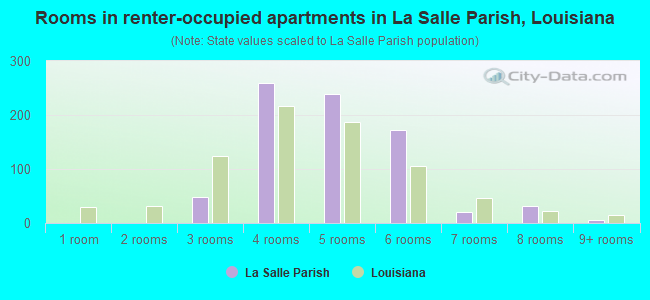
- Rooms in renter-occupied apartments in La Salle Parish, Louisiana
- 01 room
- 682 rooms
- 533 rooms
- 1914 rooms
- 2345 rooms
- 1766 rooms
- 197 rooms
- 268 rooms
- 189+ rooms
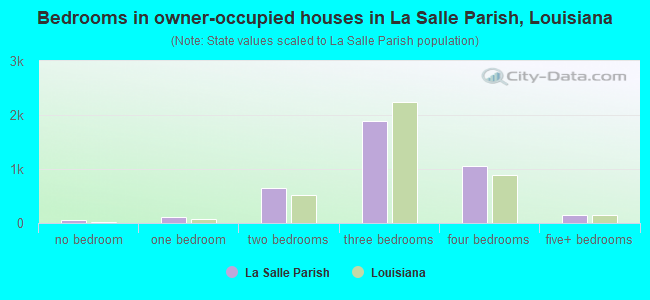
- Bedrooms in owner-occupied houses in La Salle Parish, Louisiana
- 32no bedroom
- 1181 bedroom
- 5782 bedrooms
- 2,0693 bedrooms
- 1,1004 bedrooms
- 1295+ bedrooms
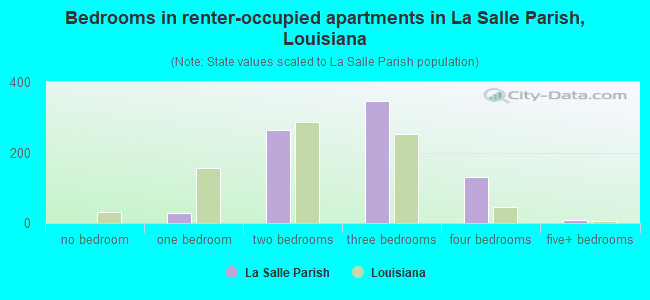
- Bedrooms in renter-occupied apartments in La Salle Parish, Louisiana
- 0no bedroom
- 1001 bedroom
- 2872 bedrooms
- 2773 bedrooms
- 1244 bedrooms
- 95+ bedrooms
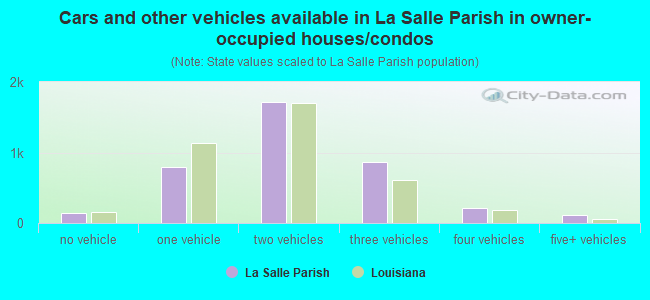
- Cars and other vehicles available in La Salle Parish in owner-occupied houses/condos
- 102no vehicle
- 6581 vehicle
- 2,1312 vehicles
- 8023 vehicles
- 2024 vehicles
- 945+ vehicles
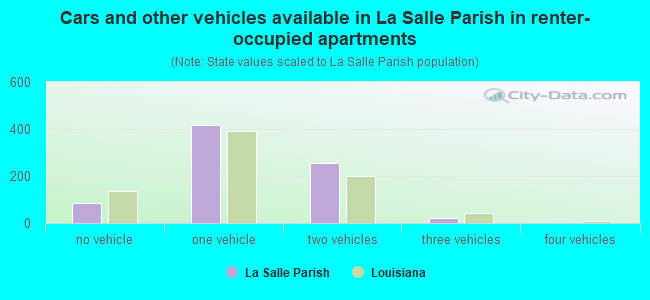
- Cars and other vehicles available in La Salle Parish in renter-occupied apartments
- 124no vehicle
- 4331 vehicle
- 2142 vehicles
- 283 vehicles
- 04 vehicles
- 05+ vehicles
88.8% of La Salle Parish residents lived in the same house 1 years ago.
Out of people who lived in different houses, 36% lived in this county.
Out of people who lived in different counties, 66% lived in Louisiana.
| La Salle Parish: | 88.8% |
| State average: | 88.3% |
Place of birth for U.S.-born residents:
- This state: 12,315
- Other state: 2,002
- Northeast: 8
- Midwest: 288
- South: 1,388
- West: 303
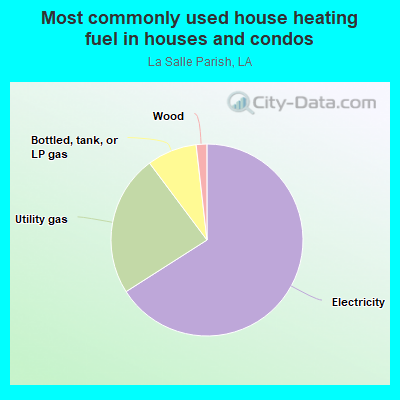
- 65.6%Electricity
- 26.8%Utility gas
- 6.1%Bottled, tank, or LP gas
- 1.4%Wood
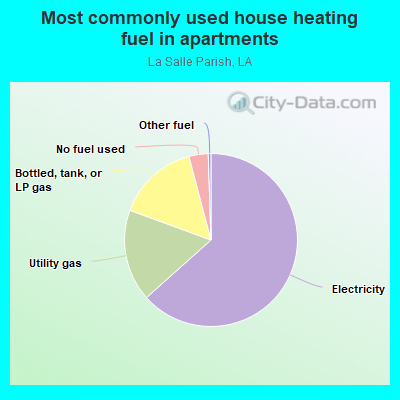
- 59.7%Electricity
- 18.9%Utility gas
- 17.1%Bottled, tank, or LP gas
- 3.9%No fuel used
- 0.4%Other fuel
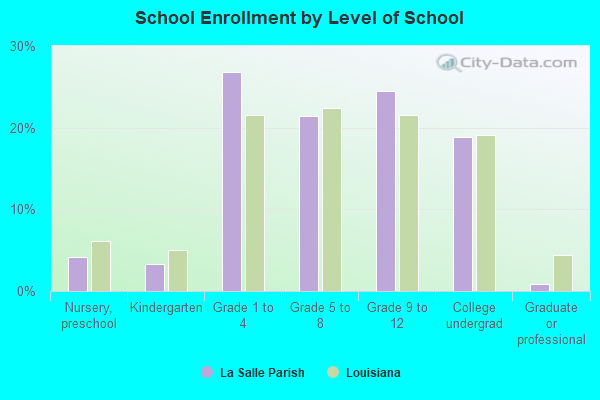
Private vs. public school enrollment:
| Here: | 9.3% |
| Louisiana: | 19.6% |
| Here: | 19.3% |
| Louisiana: | 18.3% |
| Here: | 0.0% |
| Louisiana: | 17.4% |
La Salle Parish government finances - Expenditure in 2020:
- Charges - Hospital Public: $56,773,000
Hospital Public: $53,681,000
Sewerage: $311,000
Other: $53,000
Other: $4,000
- Construction - Hospitals: $6,599,000
Hospitals: $178,000
- Current Operations - Hospitals: $55,514,000
Hospitals: $26,844,000
General - Other: $7,266,000
General - Other: $5,639,000
Police Protection: $5,059,000
Police Protection: $4,673,000
Financial Administration: $640,000
Financial Administration: $576,000
Water Utilities: $389,000
Sewerage: $331,000
Judicial and Legal Services: $206,000
Local Fire Protection: $82,000
Health - Other: $31,000
Health - Other: $22,000
- Federal Intergovernmental - Health and Hospitals: $1,090,000
Health and Hospitals: $637,000
Other: $15,000
Other: $9,000
- General - Interest on Debt: $792,000
Interest on Debt: $95,000
- Intergovernmental to Local - Other - Health - Other: $230,000
Other - Health - Other: $195,000
Other - General - Other: $2,000
Other - General - Other: $2,000
- Intergovernmental to State - Water Utilities: $3,000
- Local Intergovernmental - Health and Hospitals: $856,000
Health and Hospitals: $147,000
Other: $12,000
Other: $6,000
- Long Term Debt - Beginning Outstanding - Unspecified Public Purpose: $19,814,000
Outstanding Unspecified Public Purpose: $19,575,000
Retired Nonguaranteed - Public Debt for Private Purpose: $4,909,000
Beginning Outstanding - Public Debt for Private Purpose: $4,909,000
Beginning Outstanding - Unspecified Public Purpose: $2,361,000
Outstanding Unspecified Public Purpose: $1,889,000
Retired Unspecified Public Purpose: $472,000
Retired Unspecified Public Purpose: $239,000
- Miscellaneous - General Revenue - Other: $3,607,000
General Revenue - Other: $2,034,000
Fines and Forfeits: $514,000
Fines and Forfeits: $398,000
Interest Earnings: $196,000
Interest Earnings: $65,000
Sale of Property: $2,000
- Other Capital Outlay - Hospitals: $569,000
Hospitals: $450,000
Health - Other: $206,000
Police Protection: $177,000
Police Protection: $113,000
Local Fire Protection: $36,000
Sewerage: $17,000
- Other Funds - Cash and Securities: $17,212,000
Cash and Securities: $9,602,000
- Revenue - Water Utilities: $358,000
- Short Term Debt Outstanding - End of Fiscal Year: $259,000
Beginning: $190,000
Beginning: $5,000
End of Fiscal Year: $4,000
- Sinking Funds - Cash and Securities: $50,000
- State Intergovernmental - Health and Hospitals: $5,403,000
General Local Government Support: $1,476,000
General Local Government Support: $1,335,000
Other: $286,000
Other: $142,000
- Tax - Property: $7,706,000
Property: $7,675,000
General Sales and Gross Receipts: $1,305,000
General Sales and Gross Receipts: $1,178,000
Public Utilities Sales: $207,000
Public Utilities Sales: $199,000
Occupation and Business License - Other: $79,000
Occupation and Business License - Other: $73,000
Other License: $8,000
Other License: $5,000
Alcoholic Beverage Sales: $4,000
Alcoholic Beverage Sales: $4,000
- Total Salaries and Wages: $36,766,000
: $17,634,000
La Salle Parish government finances - Revenue in 2020:
- Charges - Hospital Public: $56,773,000
Hospital Public: $53,681,000
Sewerage: $311,000
Other: $53,000
Other: $4,000
- Construction - Hospitals: $6,599,000
Hospitals: $178,000
- Current Operations - Hospitals: $55,514,000
Hospitals: $26,844,000
General - Other: $7,266,000
General - Other: $5,639,000
Police Protection: $5,059,000
Police Protection: $4,673,000
Financial Administration: $640,000
Financial Administration: $576,000
Water Utilities: $389,000
Sewerage: $331,000
Judicial and Legal Services: $206,000
Local Fire Protection: $82,000
Health - Other: $31,000
Health - Other: $22,000
- Federal Intergovernmental - Health and Hospitals: $1,090,000
Health and Hospitals: $637,000
Other: $15,000
Other: $9,000
- General - Interest on Debt: $792,000
Interest on Debt: $95,000
- Intergovernmental to Local - Other - Health - Other: $230,000
Other - Health - Other: $195,000
Other - General - Other: $2,000
Other - General - Other: $2,000
- Intergovernmental to State - Water Utilities: $3,000
- Local Intergovernmental - Health and Hospitals: $856,000
Health and Hospitals: $147,000
Other: $12,000
Other: $6,000
- Long Term Debt - Beginning Outstanding - Unspecified Public Purpose: $19,814,000
Outstanding Unspecified Public Purpose: $19,575,000
Retired Nonguaranteed - Public Debt for Private Purpose: $4,909,000
Beginning Outstanding - Public Debt for Private Purpose: $4,909,000
Beginning Outstanding - Unspecified Public Purpose: $2,361,000
Outstanding Unspecified Public Purpose: $1,889,000
Retired Unspecified Public Purpose: $472,000
Retired Unspecified Public Purpose: $239,000
- Miscellaneous - General Revenue - Other: $3,607,000
General Revenue - Other: $2,034,000
Fines and Forfeits: $514,000
Fines and Forfeits: $398,000
Interest Earnings: $196,000
Interest Earnings: $65,000
Sale of Property: $2,000
- Other Capital Outlay - Hospitals: $569,000
Hospitals: $450,000
Health - Other: $206,000
Police Protection: $177,000
Police Protection: $113,000
Local Fire Protection: $36,000
Sewerage: $17,000
- Other Funds - Cash and Securities: $17,212,000
Cash and Securities: $9,602,000
- Revenue - Water Utilities: $358,000
- Short Term Debt Outstanding - End of Fiscal Year: $259,000
Beginning: $190,000
Beginning: $5,000
End of Fiscal Year: $4,000
- Sinking Funds - Cash and Securities: $50,000
- State Intergovernmental - Health and Hospitals: $5,403,000
General Local Government Support: $1,476,000
General Local Government Support: $1,335,000
Other: $286,000
Other: $142,000
- Tax - Property: $7,706,000
Property: $7,675,000
General Sales and Gross Receipts: $1,305,000
General Sales and Gross Receipts: $1,178,000
Public Utilities Sales: $207,000
Public Utilities Sales: $199,000
Occupation and Business License - Other: $79,000
Occupation and Business License - Other: $73,000
Other License: $8,000
Other License: $5,000
Alcoholic Beverage Sales: $4,000
Alcoholic Beverage Sales: $4,000
- Total Salaries and Wages: $36,766,000
: $17,634,000
La Salle Parish government finances - Debt in 2020:
- Charges - Hospital Public: $56,773,000
Hospital Public: $53,681,000
Sewerage: $311,000
Other: $53,000
Other: $4,000
- Construction - Hospitals: $6,599,000
Hospitals: $178,000
- Current Operations - Hospitals: $55,514,000
Hospitals: $26,844,000
General - Other: $7,266,000
General - Other: $5,639,000
Police Protection: $5,059,000
Police Protection: $4,673,000
Financial Administration: $640,000
Financial Administration: $576,000
Water Utilities: $389,000
Sewerage: $331,000
Judicial and Legal Services: $206,000
Local Fire Protection: $82,000
Health - Other: $31,000
Health - Other: $22,000
- Federal Intergovernmental - Health and Hospitals: $1,090,000
Health and Hospitals: $637,000
Other: $15,000
Other: $9,000
- General - Interest on Debt: $792,000
Interest on Debt: $95,000
- Intergovernmental to Local - Other - Health - Other: $230,000
Other - Health - Other: $195,000
Other - General - Other: $2,000
Other - General - Other: $2,000
- Intergovernmental to State - Water Utilities: $3,000
- Local Intergovernmental - Health and Hospitals: $856,000
Health and Hospitals: $147,000
Other: $12,000
Other: $6,000
- Long Term Debt - Beginning Outstanding - Unspecified Public Purpose: $19,814,000
Outstanding Unspecified Public Purpose: $19,575,000
Retired Nonguaranteed - Public Debt for Private Purpose: $4,909,000
Beginning Outstanding - Public Debt for Private Purpose: $4,909,000
Beginning Outstanding - Unspecified Public Purpose: $2,361,000
Outstanding Unspecified Public Purpose: $1,889,000
Retired Unspecified Public Purpose: $472,000
Retired Unspecified Public Purpose: $239,000
- Miscellaneous - General Revenue - Other: $3,607,000
General Revenue - Other: $2,034,000
Fines and Forfeits: $514,000
Fines and Forfeits: $398,000
Interest Earnings: $196,000
Interest Earnings: $65,000
Sale of Property: $2,000
- Other Capital Outlay - Hospitals: $569,000
Hospitals: $450,000
Health - Other: $206,000
Police Protection: $177,000
Police Protection: $113,000
Local Fire Protection: $36,000
Sewerage: $17,000
- Other Funds - Cash and Securities: $17,212,000
Cash and Securities: $9,602,000
- Revenue - Water Utilities: $358,000
- Short Term Debt Outstanding - End of Fiscal Year: $259,000
Beginning: $190,000
Beginning: $5,000
End of Fiscal Year: $4,000
- Sinking Funds - Cash and Securities: $50,000
- State Intergovernmental - Health and Hospitals: $5,403,000
General Local Government Support: $1,476,000
General Local Government Support: $1,335,000
Other: $286,000
Other: $142,000
- Tax - Property: $7,706,000
Property: $7,675,000
General Sales and Gross Receipts: $1,305,000
General Sales and Gross Receipts: $1,178,000
Public Utilities Sales: $207,000
Public Utilities Sales: $199,000
Occupation and Business License - Other: $79,000
Occupation and Business License - Other: $73,000
Other License: $8,000
Other License: $5,000
Alcoholic Beverage Sales: $4,000
Alcoholic Beverage Sales: $4,000
- Total Salaries and Wages: $36,766,000
: $17,634,000
La Salle Parish government finances - Cash and Securities in 2020:
- Charges - Hospital Public: $56,773,000
Hospital Public: $53,681,000
Sewerage: $311,000
Other: $53,000
Other: $4,000
- Construction - Hospitals: $6,599,000
Hospitals: $178,000
- Current Operations - Hospitals: $55,514,000
Hospitals: $26,844,000
General - Other: $7,266,000
General - Other: $5,639,000
Police Protection: $5,059,000
Police Protection: $4,673,000
Financial Administration: $640,000
Financial Administration: $576,000
Water Utilities: $389,000
Sewerage: $331,000
Judicial and Legal Services: $206,000
Local Fire Protection: $82,000
Health - Other: $31,000
Health - Other: $22,000
- Federal Intergovernmental - Health and Hospitals: $1,090,000
Health and Hospitals: $637,000
Other: $15,000
Other: $9,000
- General - Interest on Debt: $792,000
Interest on Debt: $95,000
- Intergovernmental to Local - Other - Health - Other: $230,000
Other - Health - Other: $195,000
Other - General - Other: $2,000
Other - General - Other: $2,000
- Intergovernmental to State - Water Utilities: $3,000
- Local Intergovernmental - Health and Hospitals: $856,000
Health and Hospitals: $147,000
Other: $12,000
Other: $6,000
- Long Term Debt - Beginning Outstanding - Unspecified Public Purpose: $19,814,000
Outstanding Unspecified Public Purpose: $19,575,000
Retired Nonguaranteed - Public Debt for Private Purpose: $4,909,000
Beginning Outstanding - Public Debt for Private Purpose: $4,909,000
Beginning Outstanding - Unspecified Public Purpose: $2,361,000
Outstanding Unspecified Public Purpose: $1,889,000
Retired Unspecified Public Purpose: $472,000
Retired Unspecified Public Purpose: $239,000
- Miscellaneous - General Revenue - Other: $3,607,000
General Revenue - Other: $2,034,000
Fines and Forfeits: $514,000
Fines and Forfeits: $398,000
Interest Earnings: $196,000
Interest Earnings: $65,000
Sale of Property: $2,000
- Other Capital Outlay - Hospitals: $569,000
Hospitals: $450,000
Health - Other: $206,000
Police Protection: $177,000
Police Protection: $113,000
Local Fire Protection: $36,000
Sewerage: $17,000
- Other Funds - Cash and Securities: $17,212,000
Cash and Securities: $9,602,000
- Revenue - Water Utilities: $358,000
- Short Term Debt Outstanding - End of Fiscal Year: $259,000
Beginning: $190,000
Beginning: $5,000
End of Fiscal Year: $4,000
- Sinking Funds - Cash and Securities: $50,000
- State Intergovernmental - Health and Hospitals: $5,403,000
General Local Government Support: $1,476,000
General Local Government Support: $1,335,000
Other: $286,000
Other: $142,000
- Tax - Property: $7,706,000
Property: $7,675,000
General Sales and Gross Receipts: $1,305,000
General Sales and Gross Receipts: $1,178,000
Public Utilities Sales: $207,000
Public Utilities Sales: $199,000
Occupation and Business License - Other: $79,000
Occupation and Business License - Other: $73,000
Other License: $8,000
Other License: $5,000
Alcoholic Beverage Sales: $4,000
Alcoholic Beverage Sales: $4,000
- Total Salaries and Wages: $36,766,000
: $17,634,000
Supplemental Security Income (SSI) in 2006:
- Total number of recipients: 486
- Number of aged recipients: 52
- Number of blind and disabled recipients: 434
- Number of recipients under 18: 50
- Number of recipients between 18 and 64: 317
- Number of recipients older than 64: 119
- Number of recipients also receiving OASDI: 191
- Amount of payments (thousands of dollars): 186
| Most common first names in La Salle Parish, LA among deceased individuals | ||
| Name | Count | Lived (average) |
|---|---|---|
| James | 125 | 74.7 years |
| John | 114 | 75.9 years |
| William | 107 | 74.5 years |
| Mary | 82 | 79.7 years |
| Willie | 51 | 77.5 years |
| Robert | 48 | 70.2 years |
| George | 46 | 72.4 years |
| Henry | 44 | 77.0 years |
| Thomas | 43 | 74.7 years |
| Charles | 42 | 66.5 years |
| Most common last names in La Salle Parish, LA among deceased individuals | ||
| Last name | Count | Lived (average) |
|---|---|---|
| Smith | 115 | 75.8 years |
| Taylor | 58 | 77.7 years |
| Jones | 50 | 71.0 years |
| Brown | 46 | 73.9 years |
| Poole | 46 | 75.4 years |
| Bradford | 45 | 76.5 years |
| Walker | 35 | 72.8 years |
| Wilson | 34 | 74.5 years |
| Coleman | 33 | 76.0 years |
| Davis | 33 | 77.2 years |
| Businesses in La Salle Parish, LA | ||||
| Name | Count | Name | Count | |
|---|---|---|---|---|
| AT&T | 1 | Popeyes | 1 | |
| Ace Hardware | 1 | RadioShack | 1 | |
| AutoZone | 1 | SONIC Drive-In | 1 | |
| FedEx | 1 | Subway | 1 | |
| Ford | 1 | U-Haul | 2 | |
| H&R Block | 1 | UPS | 1 | |
| Lane Furniture | 1 | Walmart | 1 | |
| McDonald's | 1 | |||