Litchfield County, Connecticut (CT)
County owner-occupied free and clear houses and condos in 2010: 15,697
County owner-occupied houses and condos in 2000: 53,813
Renter-occupied apartments: 18,185 (it was 17,738 in 2000)
| % of renters here: | 25% |
| State: | 33% |
Land area: 920 sq. mi.
Water area: 24.7 sq. mi.
Population density: 199 people per square mile (high).
Industries providing employment: Educational, health and social services (25.0%), Manufacturing (13.0%), Retail trade (12.2%), Professional, scientific, management, administrative, and waste management services (10.9%).
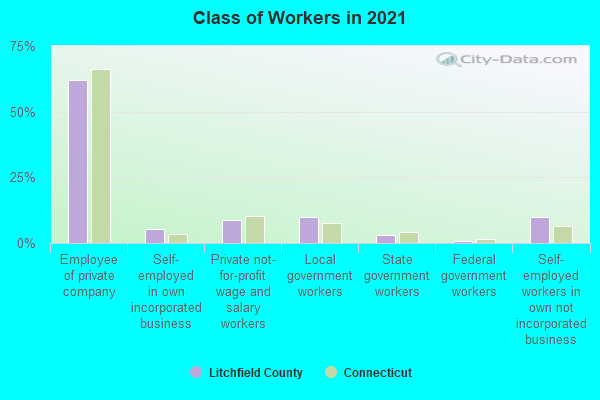
Type of workers:
- Private wage or salary: 79%
- Government: 13%
- Self-employed, not incorporated: 8%
- Unpaid family work: 0%
- OSM Map
- General Map
- Google Map
- MSN Map

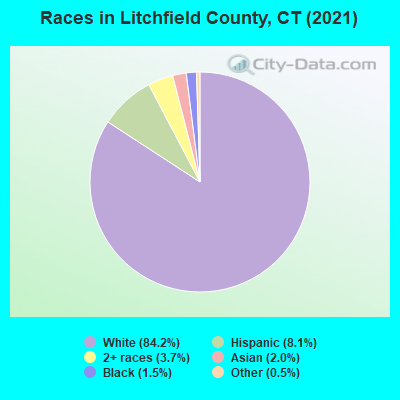
- 155,35786.2%White Non-Hispanic Alone
- 12,8467.1%Hispanic or Latino
- 4,7792.7%Two or more races
- 3,6872.0%Asian alone
- 2,7721.5%Black Non-Hispanic Alone
- 6070.3%Some other race alone
- 1620.09%American Indian and Alaska Native alone
| Median resident age: | 47.3 years |
| Connecticut median age: | 40.9 years |
| Males: 90,979 | |
| Females: 92,232 |

 | 2024 Connecticut Town Tournament VI (Celebrating the 10-Year Anniversary & Dazzleman's Memorial) (725 replies) |
| Major Art Publication Names Litchfield County Center of Contemporary Art (3 replies) |
| Economic Climate in CT 2 (135 replies) |
| Economic Climate in CT (18750 replies) |
| Connecticut Weather Discussion 3 (8061 replies) |
| Connecticut TOWN TOURNAMENT V (2022) (831 replies) |
| Litchfield County: | 2.0 people |
| Connecticut: | 3 people |
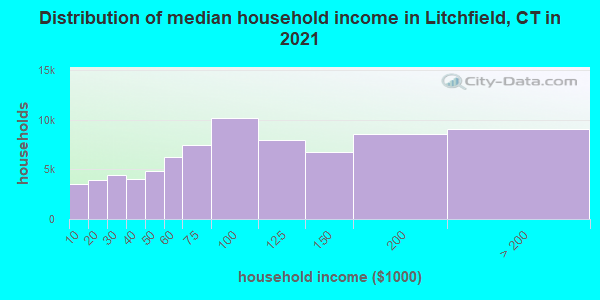
Estimated median household income in 2022: $92,173 ($56,273 in 1999)
| This county: | $92,173 |
| Connecticut: | $88,429 |
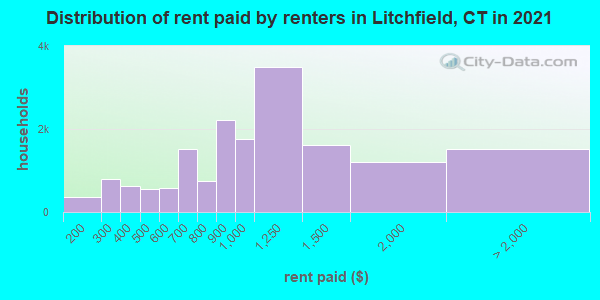
Median contract rent in 2022 for apartments: $992 (lower quartile is $787, upper quartile is $1,309)
| This county: | $992 |
| State: | $1158 |
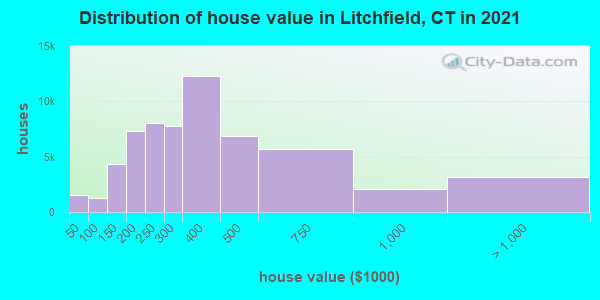
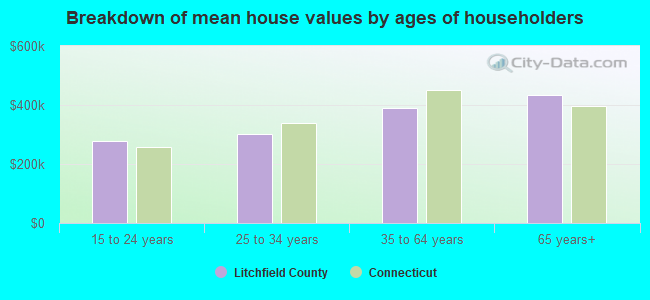
Estimated median house or condo value in 2022: $337,039 (it was $155,900 in 2000)
| Litchfield: | $337,039 |
| Connecticut: | $347,200 |
Mean price in 2022:
Median monthly housing costs for homes and condos with a mortgage: $2,122Detached houses: $455,293
Here: $455,293 State: $503,946 Townhouses or other attached units: $232,674
Here: $232,674 State: $304,959 In 2-unit structures: $242,050
Here: $242,050 State: $304,133 In 3-to-4-unit structures: $229,634
Here: $229,634 State: $272,970 In 5-or-more-unit structures: $182,162
Here: $182,162 State: $249,308 Mobile homes: $243,504
Here: $243,504 State: $151,361 Occupied boats, RVs, vans, etc.: $127,144
Here: $127,144 State: $297,887
Median monthly housing costs for units without a mortgage: $944
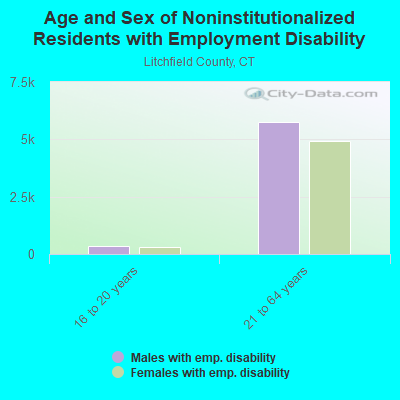
Institutionalized population: 1,566
Health of residents in Litchfield County based on CDC Behavioral Risk Factor Surveillance System Survey Questionnaires from 2003 to 2012:
General health status score of residents in this county from 1 (poor) to 5 (excellent) is 3.7. This is significantly better than average.80.1% of residents exercised in the past month. This is about average.
51.8% of residents smoked 100+ cigarettes in their lives. This is more than average.
66.8% of adult residents drank alcohol in the past 30 days. This is less than average.
79.5% of residents visited a dentist within the past year. This is more than average.
Average weight of males is 195 pounds. This is about average.
Average weight of females is 155 pounds. This is less than average.
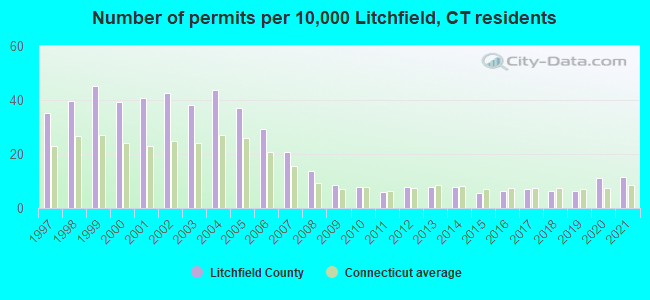
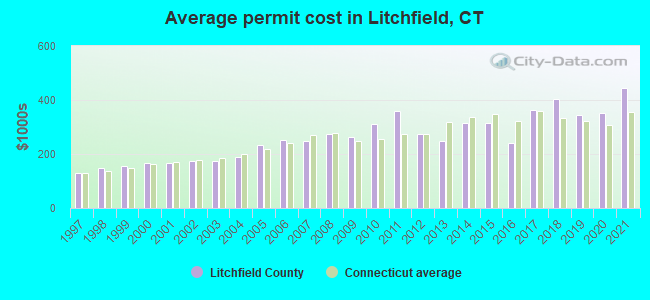
Single-family new house construction building permits:
- 2022: 205 buildings, average cost: $438,500
- 2021: 209 buildings, average cost: $445,400
- 2020: 200 buildings, average cost: $351,100
- 2019: 117 buildings, average cost: $345,700
- 2018: 117 buildings, average cost: $404,400
- 2017: 125 buildings, average cost: $363,100
- 2016: 112 buildings, average cost: $238,900
- 2015: 101 buildings, average cost: $316,100
- 2014: 141 buildings, average cost: $314,300
- 2013: 145 buildings, average cost: $249,600
- 2012: 144 buildings, average cost: $272,700
- 2011: 111 buildings, average cost: $358,700
- 2010: 140 buildings, average cost: $310,600
- 2009: 157 buildings, average cost: $261,700
- 2008: 249 buildings, average cost: $274,100
- 2007: 375 buildings, average cost: $248,900
- 2006: 534 buildings, average cost: $253,200
- 2005: 674 buildings, average cost: $233,900
- 2004: 799 buildings, average cost: $190,300
- 2003: 697 buildings, average cost: $172,900
- 2002: 776 buildings, average cost: $173,300
- 2001: 743 buildings, average cost: $167,700
- 2000: 718 buildings, average cost: $164,500
- 1999: 820 buildings, average cost: $154,800
- 1998: 721 buildings, average cost: $147,800
- 1997: 639 buildings, average cost: $129,700
Median real estate property taxes paid for housing units with mortgages in 2022: $5,660 (1.9%)
Median real estate property taxes paid for housing units with no mortgage in 2022: $5,350 (1.8%)
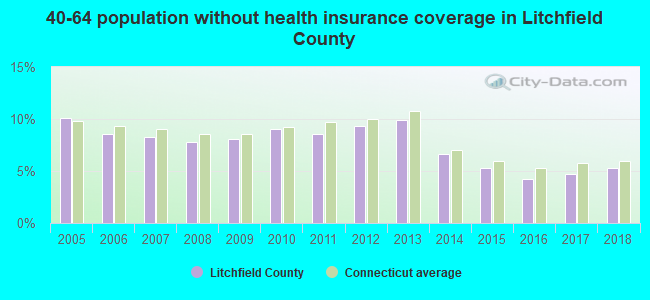
| Litchfield County: | 7.6% |
| Connecticut: | 9.8% |
Median age of residents in 2022: 47.3 years old
(Males: 46.4 years old, Females: 48.0 years old)
(Median age for: White residents: 50.2 years old, Black residents: 36.1 years old, American Indian residents: 55.5 years old, Asian residents: 36.7 years old, Hispanic or Latino residents: 30.1 years old, Other race residents: 33.4 years old)
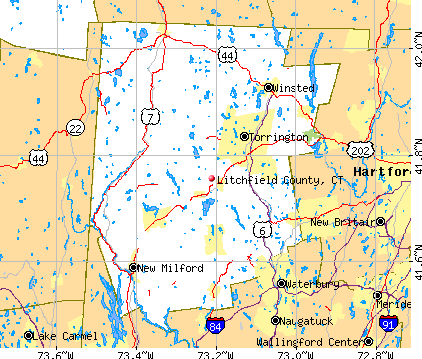
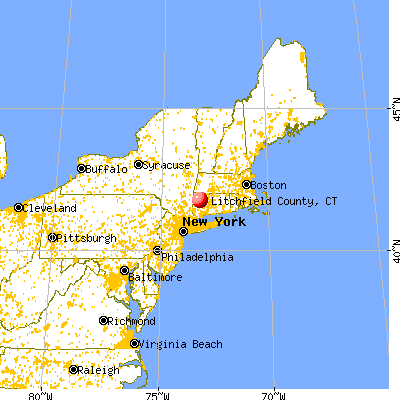
Area name: Litchfield County, CT
Fair market rent in 2006 for a 1-bedroom apartment in Litchfield County is $723 a month.
Fair market rent for a 2-bedroom apartment is $854 a month.
Fair market rent for a 3-bedroom apartment is $1097 a month.
Cities in this county include: Torrington, Watertown, Plymouth, Winchester, Woodbury, Oakville, Thomaston, Winsted, New Milford, New Hartford.
2023 air pollution in Litchfield County:
Carbon Monoxide: 0.155 ppm (standard limit: 9 ppm). Near U.S. average.
Ozone (1-hour): 0.040 ppm (standard limit: 0.12 ppm). Near U.S. average.
Particulate Matter (PM10) Annual: 7.6 µg/m3. Below U.S. average.
Particulate Matter (PM2.5) Annual: 7.8 µg/m3(standard limit: 15.0 µg/m3). Near U.S. average.
Sulfur Oxides Annual: 0.000 ppm (standard limit: 0.03 ppm). Near U.S. average.
Neighboring counties: Chemung County, New York  , Berrien County, Michigan , Lee County, Illinois , Ottawa County, Ohio , Platte County, Nebraska , Stanton County, Nebraska .
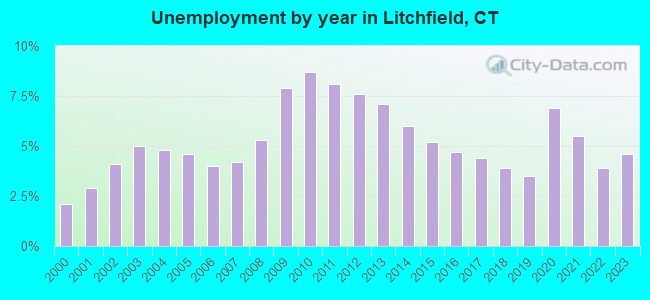
| Here: | 3.6% |
| Connecticut: | 3.9% |
Current college students: 7,392
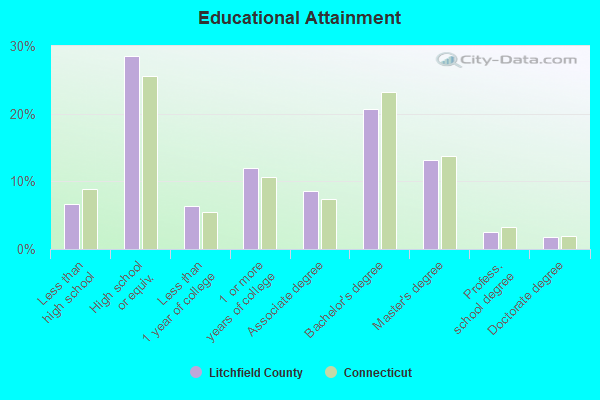
People 25 years of age or older with a high school degree or higher: 93.9%
People 25 years of age or older with a bachelor's degree or higher: 37.1%
Number of foreign born residents: 14,244 (59.4% naturalized citizens)
| Litchfield County: | 7.8% |
| Whole state: | 15.7% |
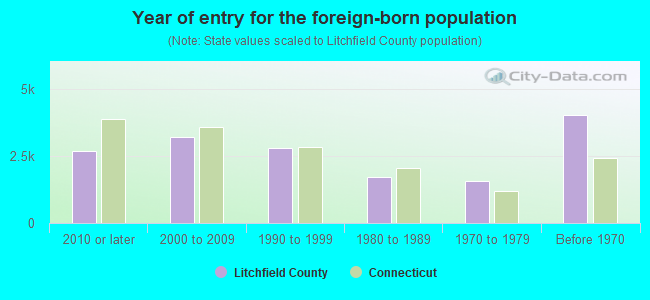
- Year of entry for the foreign-born population
- 1,9332010 or later
- 3,4772000 to 2009
- 2,8111990 to 1999
- 1,7251980 to 1989
- 1,5541970 to 1979
- 4,044Before 1970
Mean travel time to work (commute): minutes
Percentage of county residents living and working in this county: 94.5%

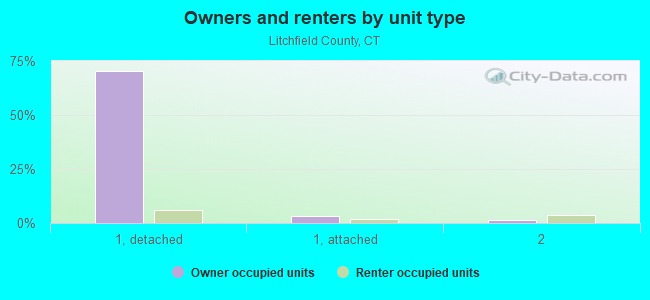
Housing units in structures:
- One, detached: 65,429
- One, attached: 3,623
- Two: 5,976
- 3 or 4: 5,606
- 5 to 9: 3,121
- 10 to 19: 1,849
- 20 to 49: 1,330
- 50 or more: 1,304
- Mobile homes: 327
- Boats, RVs, vans, etc.: 27
Housing units in Litchfield County with a mortgage: 37,779 (6,311 second mortgage, 175 home equity loan, 5,155 both second mortgage and home equity loan)
Houses without a mortgage: 1,090
| Here: | 97.4% with mortgage |
| State: | 95.9% with mortgage |
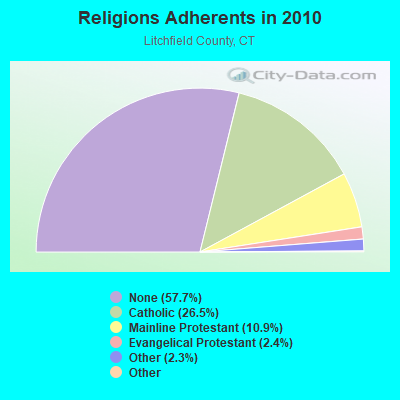
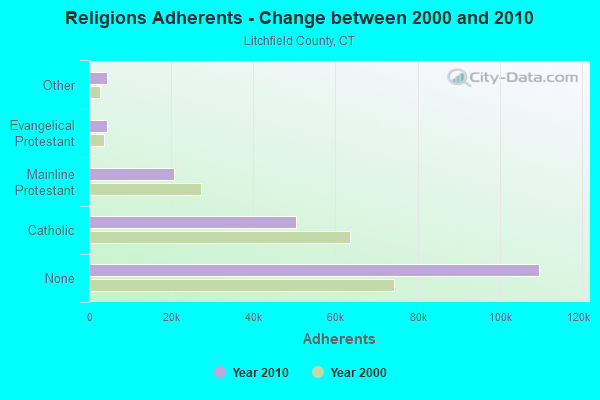
Religion statistics for Litchfield County
| Religion | Adherents | Congregations |
|---|---|---|
| Catholic | 50,354 | 30 |
| Mainline Protestant | 20,681 | 87 |
| Evangelical Protestant | 4,483 | 39 |
| Other | 4,420 | 16 |
| Orthodox | 175 | 2 |
| Black Protestant | 160 | 2 |
| None | 109,654 | - |
Source: Clifford Grammich, Kirk Hadaway, Richard Houseal, Dale E.Jones, Alexei Krindatch, Richie Stanley and Richard H.Taylor. 2012. 2010 U.S.Religion Census: Religious Congregations & Membership Study. Association of Statisticians of American Religious Bodies. Jones, Dale E., et al. 2002. Congregations and Membership in the United States 2000. Nashville, TN: Glenmary Research Center.
Food Environment Statistics:
| Litchfield County: | 2.29 / 10,000 pop. |
| State: | 2.21 / 10,000 pop. |
| Here: | 0.05 / 10,000 pop. |
| Connecticut: | 0.07 / 10,000 pop. |
| This county: | 0.64 / 10,000 pop. |
| Connecticut: | 1.02 / 10,000 pop. |
| Litchfield County: | 2.98 / 10,000 pop. |
| Connecticut: | 2.27 / 10,000 pop. |
| This county: | 11.07 / 10,000 pop. |
| State: | 9.19 / 10,000 pop. |
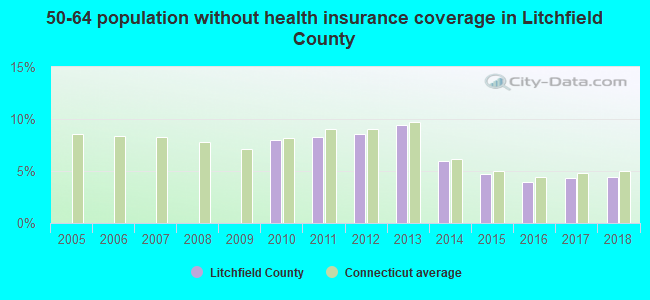
| Litchfield County: | 6.9% |
| Connecticut: | 7.3% |
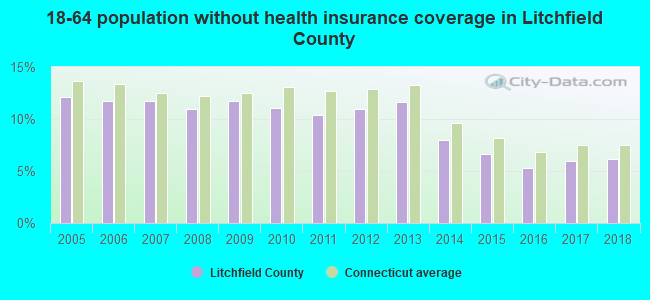
| Litchfield County: | 21.1% |
| State: | 21.5% |
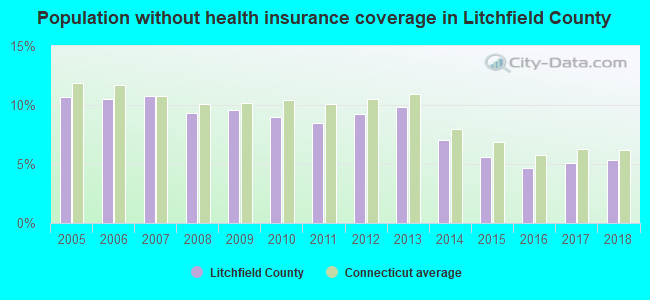
| Here: | 11.8% |
| State: | 15.8% |
Agriculture in Litchfield County:
Average size of farms: 119 acresAverage value of agricultural products sold per farm: $38,141
Average value of crops sold per acre for harvested cropland: $476.85
The value of nursery, greenhouse, floriculture, and sod as a percentage of the total market value of agricultural products sold: 34.83%
The value of livestock, poultry, and their products as a percentage of the total market value of agricultural products sold: 47.67%
Average total farm production expenses per farm: $35,124
Harvested cropland as a percentage of land in farms: 35.29%
Irrigated harvested cropland as a percentage of land in farms: 1.02%
Average market value of all machinery and equipment per farm: $52,327
The percentage of farms operated by a family or individual: 86.95%
Average age of principal farm operators: 55 years
Average number of cattle and calves per 100 acres of all land in farms: 12.39
Milk cows as a percentage of all cattle and calves: 42.70%
Corn for grain: 1614 harvested acres
Vegetables: 770 harvested acres
Land in orchards: 380 acres
Earthquake activity:
Litchfield County-area historical earthquake activity is significantly above Connecticut state average. It is 69% smaller than the overall U.S. average.On 10/7/1983 at 10:18:46, a magnitude 5.3 (5.1 MB, 5.3 LG, 5.1 ML, Class: Moderate, Intensity: VI - VII) earthquake occurred 162.5 miles away from Litchfield County center
On 4/20/2002 at 10:50:47, a magnitude 5.3 (5.3 ML, Depth: 3.0 mi) earthquake occurred 192.3 miles away from the county center
On 4/20/2002 at 10:50:47, a magnitude 5.2 (5.2 MB, 4.2 MS, 5.2 MW, 5.0 MW) earthquake occurred 190.7 miles away from the county center
On 1/19/1982 at 00:14:42, a magnitude 4.7 (4.5 MB, 4.7 MD, 4.5 LG, Class: Light, Intensity: IV - V) earthquake occurred 146.0 miles away from the county center
On 8/23/2011 at 17:51:04, a magnitude 5.8 (5.8 MW, Depth: 3.7 mi) earthquake occurred 365.5 miles away from Litchfield County center
On 10/16/2012 at 23:12:25, a magnitude 4.7 (4.7 ML, Depth: 10.0 mi) earthquake occurred 182.1 miles away from the county center
Magnitude types: regional Lg-wave magnitude (LG), body-wave magnitude (MB), duration magnitude (MD), local magnitude (ML), surface-wave magnitude (MS), moment magnitude (MW)
Most recent natural disasters:
- Connecticut Severe Winter Storm, Incident Period: February 08, 2013 to February 12, 2013, Emergency Declared EM-3361: February 10, 2013, FEMA Id: 3361, Natural disaster type: Winter Storm
- Connecticut Severe Winter Storm and Snowstorm, Incident Period: February 08, 2013 to February 12, 2013, Major Disaster (Presidential) Declared DR-4106: March 21, 2013, FEMA Id: 4106, Natural disaster type: Snowstorm, Winter Storm
- Connecticut Hurricane Sandy, Incident Period: October 27, 2012 to November 08, 2012, Emergency Declared EM-3353: October 28, 2012, FEMA Id: 3353, Natural disaster type: Hurricane
- Connecticut Hurricane Sandy, Incident Period: October 27, 2012 to November 08, 2012, Major Disaster (Presidential) Declared DR-4087: October 30, 2012, FEMA Id: 4087, Natural disaster type: Hurricane
- Connecticut Severe Storm, Incident Period: October 29, 2011 to October 30, 2011, Emergency Declared EM-3342: October 31, 2011, FEMA Id: 3342, Natural disaster type: Storm
- Connecticut Severe Storm, Incident Period: October 29, 2011 to October 30, 2011, Major Disaster (Presidential) Declared DR-4046: November 17, 2011, FEMA Id: 4046, Natural disaster type: Storm
- Connecticut Tropical Storm Irene, Incident Period: August 27, 2011 to September 01, 2011, Major Disaster (Presidential) Declared DR-4023: September 02, 2011, FEMA Id: 4023, Natural disaster type: Tropical Storm
- Connecticut Hurricane Irene, Incident Period: August 26, 2011 to September 01, 2011, Emergency Declared EM-3331: August 27, 2011, FEMA Id: 3331, Natural disaster type: Hurricane
- Connecticut Snowstorm, Incident Period: January 11, 2011 to January 12, 2011, Major Disaster (Presidential) Declared DR-1958: March 03, 2011, FEMA Id: 1958, Natural disaster type: Snowstorm
- Connecticut Severe Storms and Flooding, Incident Period: April 15, 2007 to April 27, 2007, Major Disaster (Presidential) Declared DR-1700: May 11, 2007, FEMA Id: 1700, Natural disaster type: Storm, Flood
- 13 other natural disasters have been reported since 1953.
The number of natural disasters in Litchfield County (23) is greater than the US average (15).
Major Disasters (Presidential) Declared: 13
Emergencies Declared: 10
Causes of natural disasters: Storms: 7, Hurricanes: 5, Floods: 4, Snowstorms: 4, Blizzards: 3, Snows: 2, Tropical Storms: 2, Winter Storms: 2, Snowfall: 1, Tornado: 1, Wind: 1 (Note: some incidents may be assigned to more than one category).
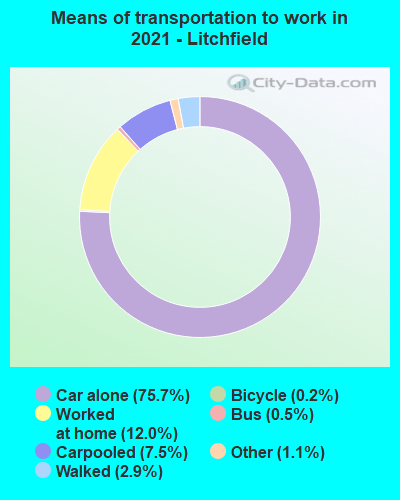
Means of transportation to work:
- Drove a car alone: 50,923 (73.2%)
- Carpooled: 5,520 (7.9%)
- Bus: 249 (0.4%)
- Subway or elevated rail: 51 (0.1%)
- Long-distance train or commuter rail: 46 (0.1%)
- Light rail, streetcar or trolley: 12 (0.0%)
- Taxicab, motorcycle, or other means: 841 (1.2%)
- Bicycle: 114 (0.2%)
- Walked: 1,909 (2.7%)
- Worked at home: 10,947 (15.7%)
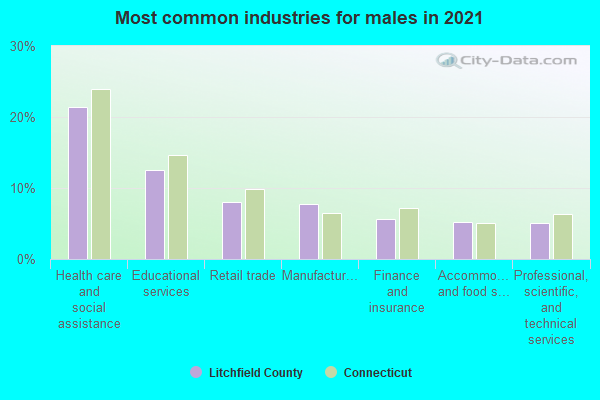
- Health care and social assistance (21%)
- Educational services (14%)
- Retail trade (10%)
- Professional, scientific, and technical services (7%)
- Manufacturing (6%)
- Other services, except public administration (6%)
- Finance and insurance (5%)
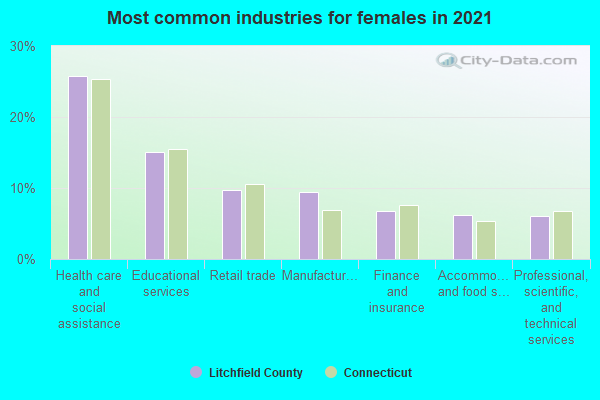
- Health care and social assistance (24%)
- Educational services (16%)
- Retail trade (11%)
- Professional, scientific, and technical services (7%)
- Manufacturing (7%)
- Other services, except public administration (7%)
- Finance and insurance (6%)
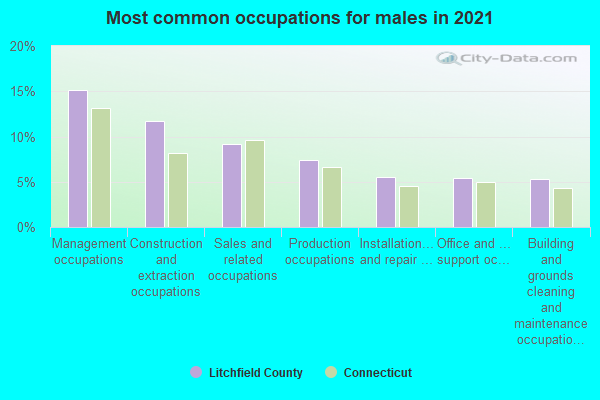
- Management occupations (14%)
- Construction and extraction occupations (11%)
- Sales and related occupations (11%)
- Production occupations (9%)
- Installation, maintenance, and repair occupations (6%)
- Building and grounds cleaning and maintenance occupations (6%)
- Office and administrative support occupations (5%)
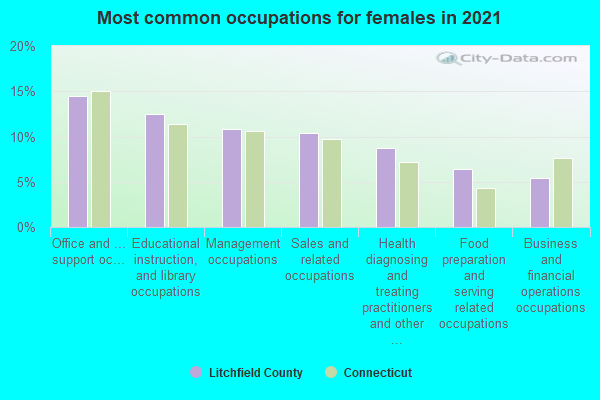
- Office and administrative support occupations (16%)
- Educational instruction, and library occupations (12%)
- Management occupations (11%)
- Sales and related occupations (9%)
- Business and financial operations occupations (7%)
- Health diagnosing and treating practitioners and other technical occupations (7%)
- Healthcare support occupations (7%)
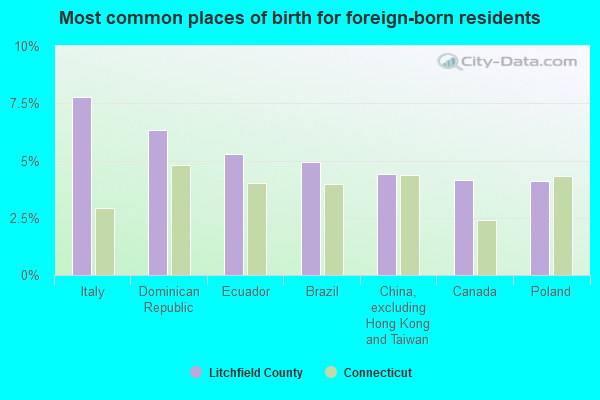
- Italy (9%)
- Ecuador (5%)
- Poland (4%)
- Dominican Republic (4%)
- Mexico (4%)
- India (4%)
- Brazil (4%)
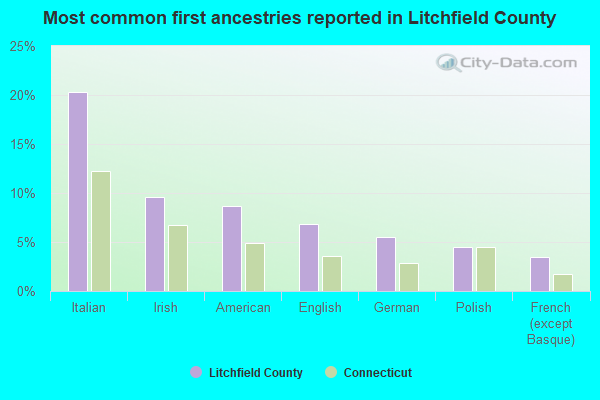
- Italian (20%)
- Irish (9%)
- American (8%)
- English (6%)
- Polish (5%)
- German (5%)
- French Canadian (3%)
People in group quarters in Litchfield County, Connecticut in 2010:
- 1,445 people in nursing facilities/skilled-nursing facilities
- 476 people in workers' group living quarters and job corps centers
- 335 people in group homes intended for adults
- 154 people in college/university student housing
- 117 people in residential treatment centers for adults
- 107 people in other noninstitutional facilities
- 49 people in emergency and transitional shelters (with sleeping facilities) for people experiencing homelessness
- 35 people in group homes for juveniles (non-correctional)
- 31 people in residential treatment centers for juveniles (non-correctional)
- 28 people in correctional residential facilities
- 18 people in residential schools for people with disabilities
- 9 people in correctional facilities intended for juveniles
People in group quarters in Litchfield County, Connecticut in 2000:
- 1,624 people in nursing homes
- 136 people in homes for the mentally retarded
- 136 people in other noninstitutional group quarters
- 129 people in homes or halfway houses for drug/alcohol abuse
- 102 people in other nonhousehold living situations
- 100 people in residential treatment centers for emotionally disturbed children
- 75 people in training schools for juvenile delinquents
- 72 people in religious group quarters
- 57 people in college dormitories (includes college quarters off campus)
- 20 people in unknown juvenile institutions
- 19 people in mental (psychiatric) hospitals or wards
- 17 people in homes for the mentally ill
- 9 people in other workers' dormitories
- 7 people in other group homes
- 6 people in homes for the physically handicapped
- 2 people in agriculture workers' dormitories on farms
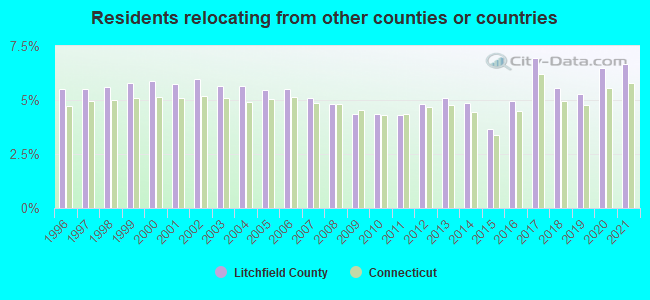
6.66% of this county's 2021 resident taxpayers lived in other counties in 2020 ($144,232 average adjusted gross income)
| Here: | 6.66% |
| Connecticut average: | 5.79% |
10 or fewer of this county's residents moved from foreign countries.
3.68% relocated from other counties in Connecticut ($36,406 average AGI)
2.98% relocated from other states ($107,827 average AGI)
Litchfield County: 2.98% Connecticut average: 3.44%
Top counties from which taxpayers relocated into this county between 2020 and 2021:
| from New Haven County, CT | |
| from Fairfield County, CT | |
| from Hartford County, CT | |
| from New York County, NY | |
| from Kings County, NY | |
| from Westchester County, NY | |
| from Dutchess County, NY |
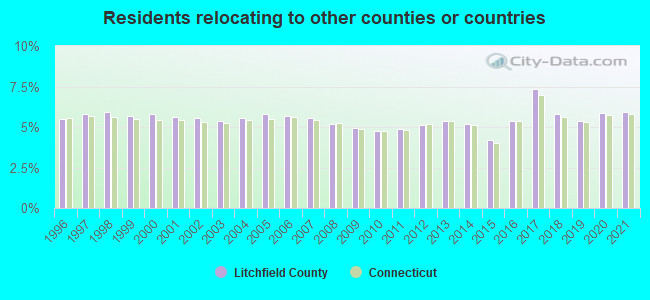
5.94% of this county's 2020 resident taxpayers moved to other counties in 2021 ($121,386 average adjusted gross income)
| Here: | 5.94% |
| Connecticut average: | 5.82% |
10 or fewer of this county's residents moved to foreign countries.
2.99% relocated to other counties in Connecticut ($58,397 average AGI)
2.96% relocated to other states ($62,990 average AGI)
Litchfield County: 2.96% Connecticut average: 3.47%
Top counties to which taxpayers relocated from this county between 2020 and 2021:
| to Hartford County, CT | |
| to New Haven County, CT | |
| to Fairfield County, CT | |
| to New York County, NY | |
| to Middlesex County, CT | |
| to Berkshire County, MA | |
| to New London County, CT |
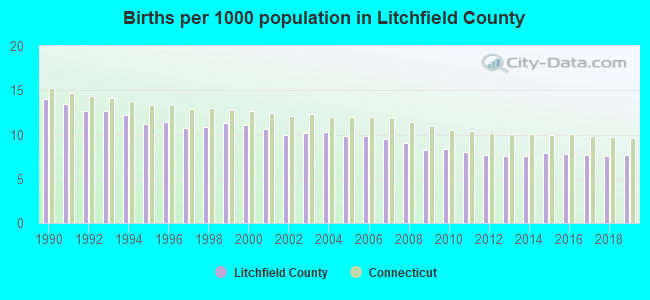
Births per 1000 population from 1990 to 1999: 12.1
Births per 1000 population from 2000 to 2009: 9.9
Births per 1000 population from 2010 to 2022: 6.6
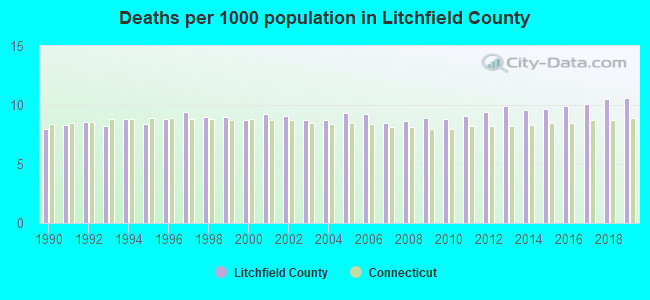
Deaths per 1000 population from 1990 to 1999: 8.7
Deaths per 1000 population from 2000 to 2009: 8.9
Deaths per 1000 population from 2010 to 2020: 10.0
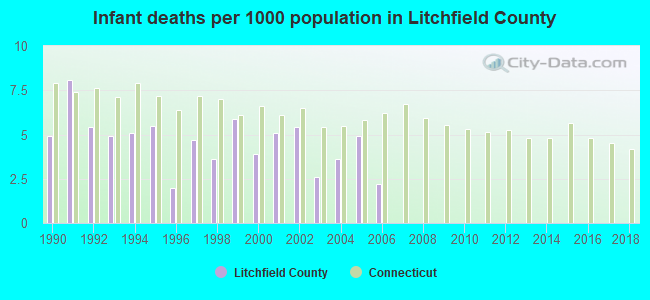
Infant deaths per 1000 live births from 1990 to 1999: 5.0
Infant deaths per 1000 live births from 2000 to 2006: 4.0
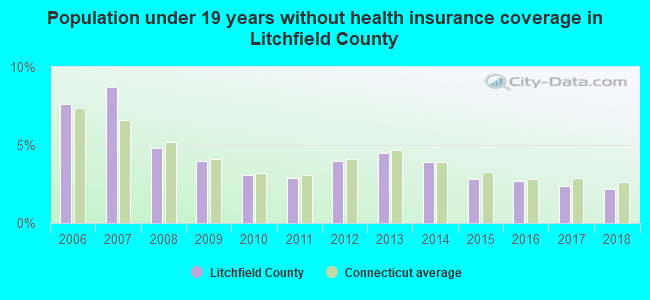
Persons under 19 years old without health insurance coverage in 2018: 2.2%
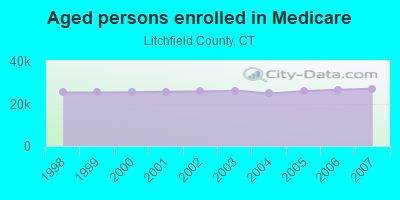
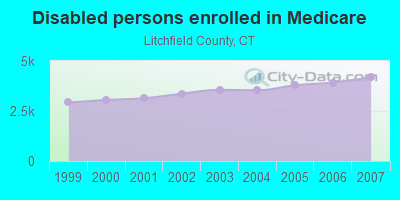
Persons enrolled in hospital insurance and/or supplemental medical insurance (Medicare) in July 1, 2007: 31,143 (26,954 aged, 4,189 disabled)
Children under 18 without health insurance coverage in 2007: 3,325 (8%)

Most common underlying causes of death in Litchfield County, Connecticut in 1999 - 2019:
- Atherosclerotic heart disease (2,472)
- Bronchus or lung, unspecified - Malignant neoplasms (2,066)
- Acute myocardial infarction, unspecified (1,570)
- Cardiac arrest, unspecified (1,523)
- Chronic obstructive pulmonary disease, unspecified (1,514)
- Unspecified dementia (1,374)
- Stroke, not specified as haemorrhage or infarction (1,023)
- Alzheimer disease, unspecified (865)
- Pneumonia, unspecified (848)
- Atherosclerotic cardiovascular disease, so described (810)
Population without health insurance coverage in 2000: 8%
Children under 18 without health insurance coverage in 2000: 6%
Suicides per 1,000,000 population from 2000 to 2006: 100.6. This is less than state average.
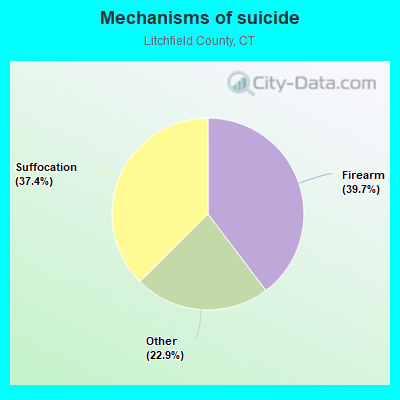
- Firearm - 39.9
- Suffocation - 37.6
- Other - 23.0
Household type by relationship:
Households: 183,211- Male householders: 38,246 (10,403 living alone), Female householders: 37,975 (11,738 living alone)
38,702 spouses (38,076 opposite-sex spouses), 5,569 unmarried partners, (5,385 opposite-sex unmarried partners), 48,201 children (45,166 natural, 1,077 adopted, 1,948 stepchildren), 2,454 grandchildren, 1,082 brothers or sisters, 2,039 parents, 84 foster children, 1,726 other relatives, 4,301 non-relatives
- In group quarters: 2,950
Size of family households: 23,857 2-persons, 10,843 3-persons, 9,586 4-persons, 3,616 5-persons, 999 6-persons, 330 7-or-more-persons.
Size of nonfamily households: 22,109 1-person, 4,313 2-persons, 336 3-persons, 128 4-persons, 50 7-or-more-persons.
23,035 married couples with children.
7,213 single-parent households (2,321 men, 4,892 women).
89.6% of residents of Litchfield speak English at home.
4.3% of residents speak Spanish at home (68% speak English very well, 14% speak English well, 16% speak English not well, 3% don't speak English at all).
4.3% of residents speak other Indo-European language at home (74% speak English very well, 20% speak English well, 5% speak English not well, 1% don't speak English at all).
1.2% of residents speak Asian or Pacific Island language at home (68% speak English very well, 19% speak English well, 12% speak English not well, 1% don't speak English at all).
0.3% of residents speak other language at home (81% speak English very well, 17% speak English well, 2% speak English not well).
In fiscal year 2004:
Federal Government expenditure: $864,931,000 ($4,570 per capita)
Department of Defense expenditure: $42,848,000
Federal direct payments to individuals for retirement and disability: $433,486,000
Federal other direct payments to individuals: $229,296,000
Federal direct payments not to individuals: $1,108,000
Federal grants: $127,325,000
Federal procurement contracts: $43,583,000 ($33,407,000 Department of Defense)
Federal salaries and wages: $30,133,000 ($553,000 Department of Defense)
Federal Government direct loans: $2,236,000
Federal guaranteed/insured loans: $88,639,000
Federal Government insurance: $156,146,000
Population change from April 1, 2000 to July 1, 2005:
Births: 10,035| Here: | 53 per 1000 residents |
| State: | 63 per 1000 residents |
Deaths: 8,621
| Here: | 45 per 1000 residents |
| State: | 44 per 1000 residents |
Net international migration: +1,053
| Here: | +6 per 1000 residents |
| State: | +22 per 1000 residents |
Net internal migration: +5,605
| Here: | |
| State: |
Total withdrawal of fresh water for public supply: 79.65 millions of gallons per day (14% from ground, 86% from surface)
| Here: | 6.5 |
| State: | 6.5 |
| Here: | 4.2 |
| State: | 4.0 |
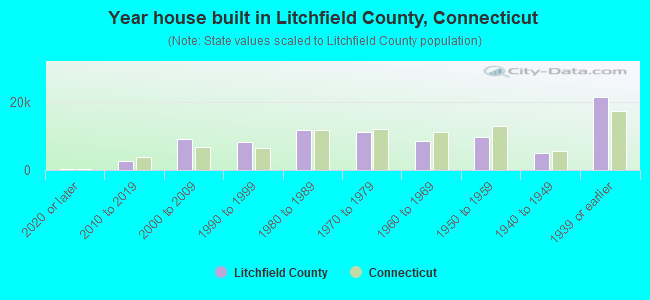
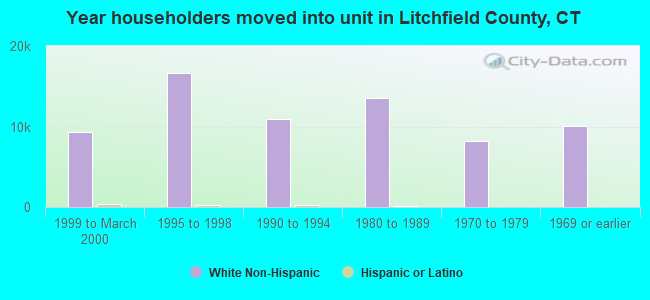
- Year house built in Litchfield County, Connecticut
- 6502014 or later
- 2,1792010 to 2013
- 7,1472000 to 2009
- 7,9391990 to 1999
- 12,5661980 to 1989
- 12,9151970 to 1979
- 9,3541960 to 1969
- 10,6281950 to 1959
- 5,2501940 to 1949
- 20,7111939 or earlier
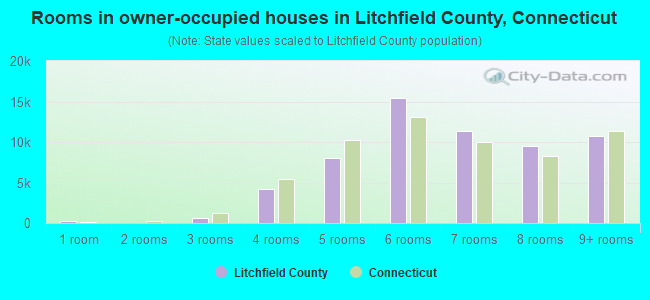
- Rooms in owner-occupied houses in Litchfield County, Connecticut
- 2271 room
- 1542 rooms
- 8263 rooms
- 4,5434 rooms
- 10,1025 rooms
- 13,1046 rooms
- 10,2217 rooms
- 8,7418 rooms
- 10,0729+ rooms
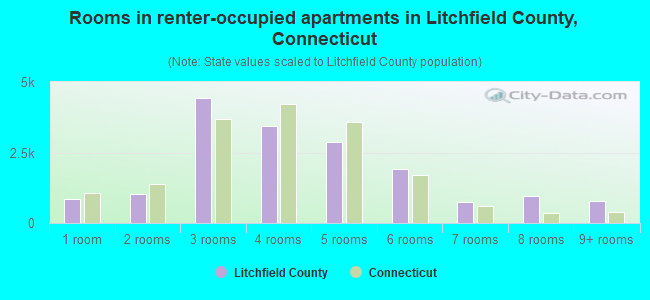
- Rooms in renter-occupied apartments in Litchfield County, Connecticut
- 1,0831 room
- 1,0422 rooms
- 3,6203 rooms
- 4,5254 rooms
- 3,1285 rooms
- 2,8206 rooms
- 1,0537 rooms
- 4358 rooms
- 5189+ rooms
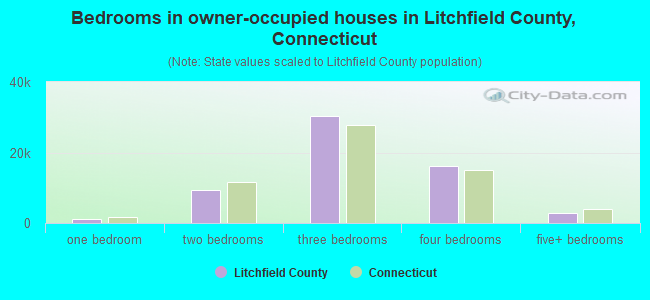
- Bedrooms in owner-occupied houses in Litchfield County, Connecticut
- 256no bedroom
- 1,5471 bedroom
- 10,7742 bedrooms
- 29,4043 bedrooms
- 13,1044 bedrooms
- 2,9725+ bedrooms
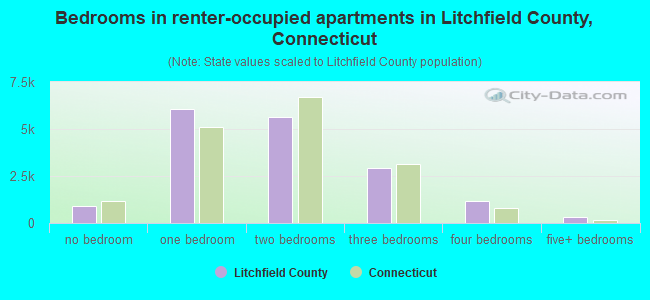
- Bedrooms in renter-occupied apartments in Litchfield County, Connecticut
- 1,161no bedroom
- 5,2451 bedroom
- 6,5762 bedrooms
- 4,0633 bedrooms
- 8314 bedrooms
- 2905+ bedrooms
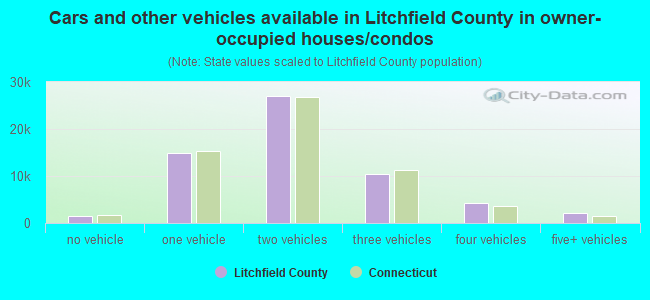
- Cars and other vehicles available in Litchfield County in owner-occupied houses/condos
- 1,076no vehicle
- 14,6951 vehicle
- 24,4922 vehicles
- 11,5883 vehicles
- 3,8084 vehicles
- 2,3275+ vehicles
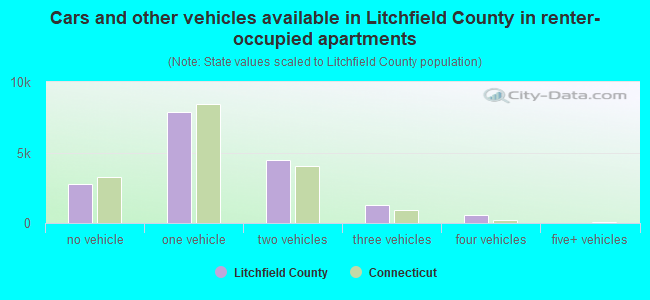
- Cars and other vehicles available in Litchfield County in renter-occupied apartments
- 2,954no vehicle
- 9,1481 vehicle
- 4,7922 vehicles
- 1,0463 vehicles
- 1894 vehicles
- 515+ vehicles
91.4% of Litchfield County residents lived in the same house 1 years ago.
Out of people who lived in different houses, 33% lived in this county.
Out of people who lived in different counties, 52% lived in Connecticut.
| Litchfield County: | 91.4% |
| State average: | 88.4% |
Place of birth for U.S.-born residents:
- This state: 119,013
- Other state: 46,997
- Northeast: 32,661
- Midwest: 5,623
- South: 5,887
- West: 2,835
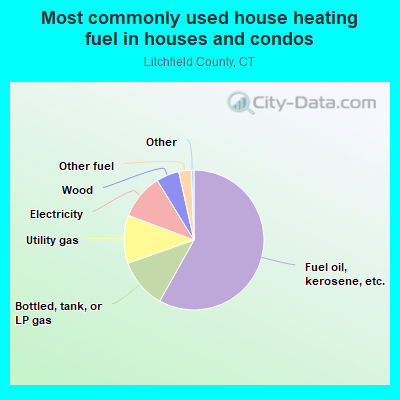
- 62.5%Fuel oil, kerosene, etc.
- 11.7%Utility gas
- 10.2%Electricity
- 7.9%Bottled, tank, or LP gas
- 4.6%Wood
- 1.0%Other fuel
- 0.3%Solar energy
- 0.2%No fuel used
- 0.2%Coal or coke
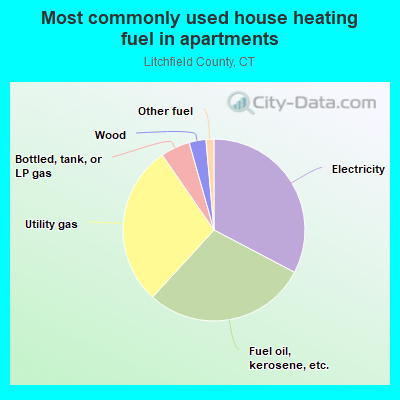
- 36.0%Electricity
- 28.4%Fuel oil, kerosene, etc.
- 23.8%Utility gas
- 7.5%Bottled, tank, or LP gas
- 1.4%Wood
- 1.1%Other fuel
- 0.9%No fuel used
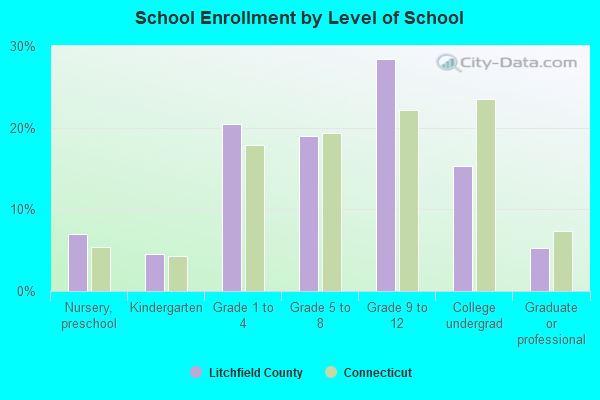
Private vs. public school enrollment:
| Here: | 9.7% |
| Connecticut: | 9.5% |
| Here: | 14.9% |
| Connecticut: | 12.9% |
| Here: | 25.5% |
| Connecticut: | 35.5% |
Supplemental Security Income (SSI) in 2006:
- Total number of recipients: 1,460
- Number of aged recipients: 107
- Number of blind and disabled recipients: 1,353
- Number of recipients under 18: 155
- Number of recipients between 18 and 64: 1,091
- Number of recipients older than 64: 214
- Number of recipients also receiving OASDI: 521
- Amount of payments (thousands of dollars): 705
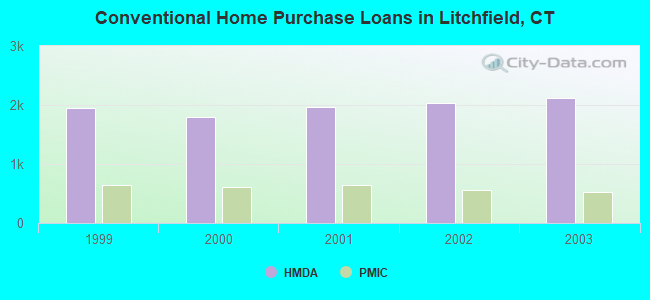
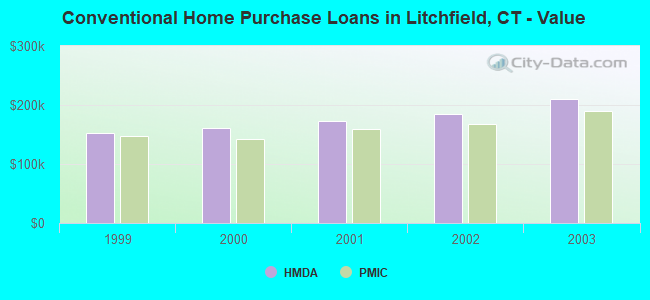
| Home Mortgage Disclosure Act Aggregated Statistics For Year 2003 (Based on 27 full tracts) | ||||||||||||
| A) FHA, FSA/RHS & VA Home Purchase Loans | B) Conventional Home Purchase Loans | C) Refinancings | D) Home Improvement Loans | E) Loans on Dwellings For 5+ Families | F) Non-occupant Loans on < 5 Family Dwellings (A B C & D) | |||||||
|---|---|---|---|---|---|---|---|---|---|---|---|---|
| Number | Average Value | Number | Average Value | Number | Average Value | Number | Average Value | Number | Average Value | Number | Average Value | |
| LOANS ORIGINATED | 229 | $135,777 | 2,115 | $209,604 | 9,031 | $171,789 | 311 | $44,830 | 4 | $255,000 | 473 | $254,628 |
| APPLICATIONS APPROVED, NOT ACCEPTED | 13 | $120,000 | 257 | $221,751 | 1,176 | $163,249 | 90 | $49,900 | 1 | $147,000 | 60 | $311,067 |
| APPLICATIONS DENIED | 19 | $133,421 | 287 | $181,669 | 2,493 | $160,451 | 188 | $40,574 | 1 | $281,000 | 109 | $161,073 |
| APPLICATIONS WITHDRAWN | 14 | $168,286 | 246 | $203,801 | 1,316 | $175,824 | 63 | $38,111 | 0 | $0 | 50 | $215,120 |
| FILES CLOSED FOR INCOMPLETENESS | 3 | $129,667 | 47 | $209,128 | 250 | $185,272 | 10 | $64,800 | 0 | $0 | 19 | $224,947 |
| Private Mortgage Insurance Companies Aggregated Statistics For Year 2003 (Based on 27 full tracts) | ||||||
| A) Conventional Home Purchase Loans | B) Refinancings | C) Non-occupant Loans on < 5 Family Dwellings (A & B) | ||||
|---|---|---|---|---|---|---|
| Number | Average Value | Number | Average Value | Number | Average Value | |
| LOANS ORIGINATED | 526 | $190,447 | 322 | $180,593 | 22 | $144,091 |
| APPLICATIONS APPROVED, NOT ACCEPTED | 72 | $177,569 | 105 | $200,400 | 4 | $157,250 |
| APPLICATIONS DENIED | 14 | $261,429 | 7 | $227,000 | 3 | $354,333 |
| APPLICATIONS WITHDRAWN | 26 | $202,846 | 21 | $179,667 | 5 | $149,200 |
| FILES CLOSED FOR INCOMPLETENESS | 2 | $152,500 | 0 | $0 | 0 | $0 |
| Most common first names in Litchfield County, CT among deceased individuals | ||
| Name | Count | Lived (average) |
|---|---|---|
| John | 1,689 | 76.0 years |
| Mary | 1,633 | 81.2 years |
| Joseph | 1,105 | 76.4 years |
| William | 1,091 | 74.6 years |
| Helen | 817 | 81.3 years |
| Robert | 779 | 71.0 years |
| George | 717 | 76.1 years |
| Anna | 701 | 83.6 years |
| Margaret | 654 | 81.0 years |
| Edward | 639 | 75.0 years |
| Most common last names in Litchfield County, CT among deceased individuals | ||
| Last name | Count | Lived (average) |
|---|---|---|
| Smith | 338 | 78.8 years |
| Johnson | 246 | 77.2 years |
| Anderson | 191 | 78.8 years |
| Miller | 147 | 78.7 years |
| Brown | 147 | 79.3 years |
| Williams | 137 | 76.0 years |
| Clark | 128 | 79.0 years |
| Murphy | 113 | 78.1 years |
| White | 112 | 78.6 years |
| Wilson | 95 | 74.0 years |
| Businesses in Litchfield County, CT | ||||
| Name | Count | Name | Count | |
|---|---|---|---|---|
| 7-Eleven | 1 | MasterBrand Cabinets | 14 | |
| AT&T | 3 | Maurices | 1 | |
| Ace Hardware | 2 | Mazda | 1 | |
| Advance Auto Parts | 4 | McDonald's | 8 | |
| Applebee's | 1 | New Balance | 2 | |
| Arby's | 1 | Nike | 2 | |
| Audi | 1 | Nissan | 1 | |
| AutoZone | 1 | Panera Bread | 1 | |
| BMW | 1 | Payless | 1 | |
| Bed Bath & Beyond | 1 | Penske | 2 | |
| Blockbuster | 2 | PetSmart | 1 | |
| Burger King | 2 | Pizza Hut | 2 | |
| CVS | 7 | Quality | 1 | |
| Chevrolet | 3 | Quiznos | 1 | |
| Curves | 5 | RadioShack | 4 | |
| Dairy Queen | 2 | Rite Aid | 10 | |
| Days Inn | 1 | Ryder Rental & Truck Leasing | 1 | |
| Decora Cabinetry | 2 | Sears | 2 | |
| DressBarn | 1 | Sprint Nextel | 2 | |
| Dressbarn | 1 | Staples | 3 | |
| Dunkin Donuts | 22 | Starbucks | 3 | |
| Famous Footwear | 1 | Stop & Shop | 7 | |
| FedEx | 26 | Subaru | 2 | |
| Ford | 4 | Subway | 18 | |
| GNC | 6 | T-Mobile | 4 | |
| GameStop | 2 | T.J.Maxx | 2 | |
| Goodwill | 2 | Taco Bell | 2 | |
| H&R Block | 6 | Target | 1 | |
| Hilton | 1 | The Room Place | 1 | |
| Home Depot | 3 | Toyota | 3 | |
| Honda | 2 | True Value | 10 | |
| Hyundai | 2 | U-Haul | 7 | |
| JCPenney | 1 | UPS | 27 | |
| KFC | 1 | Volkswagen | 2 | |
| Kincaid | 1 | Walgreens | 2 | |
| Kmart | 2 | Walmart | 2 | |
| Lane Furniture | 2 | Wendy's | 1 | |
| Little Caesars Pizza | 1 | World Gym | 1 | |
| Lowe's | 1 | YMCA | 8 | |
| Marshalls | 1 | |||
Litchfield County on our top lists:
- #7 on the list of "Top 101 counties with the lowest Particulate Matter (PM10) Annual air pollution readings in 2012 (µg/m3)"
- #10 on the list of "Top 101 counties with the lowest number of births per 1000 residents 2007-2013"
- #10 on the list of "Top 101 counties with the lowest number of births per 1000 residents 2007-2013 (pop 50,000+)"
- #21 on the list of "Top 101 counties with the largest decrease in the number of births per 1000 residents 2000-2006 to 2007-2013 (pop 50,000+)"
- #38 on the list of "Top 101 counties with the lowest Particulate Matter (PM2.5) Annual air pollution readings in 2012 (µg/m3)"
- #39 on the list of "Top 101 counties with the highest carbon monoxide air pollution readings in 2012 (ppm)"
- #39 on the list of "Top 101 counties with the lowest Sulfur Oxides Annual air pollution readings in 2012 (µg/m3)"
- #65 on the list of "Top 101 counties with the lowest Nitrogen Dioxide air pollution readings in 2012 (ppm)"
- #83 on the list of "Top 101 counties with the highest surface withdrawal of fresh water for public supply (pop. 50,000+)"
- #88 on the list of "Top 101 counties with the highest surface withdrawal of fresh water for public supply"