Mercer County, Kentucky (KY)
County owner-occupied free and clear houses and condos in 2010: 2,288
County owner-occupied houses and condos in 2000: 6,272
Renter-occupied apartments: 2,283 (it was 2,151 in 2000)
| % of renters here: | 26% |
| State: | 31% |
Land area: 251 sq. mi.
Water area: 2.2 sq. mi.
Population density: 91 people per square mile (average).
Industries providing employment: Educational, health and social services (22.8%), Manufacturing (22.1%).
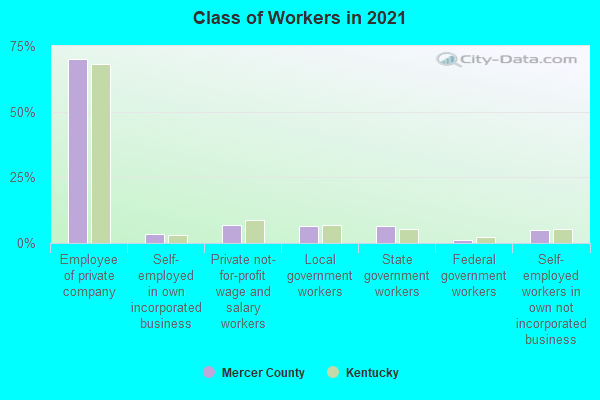
Type of workers:
- Private wage or salary: 80%
- Government: 15%
- Self-employed, not incorporated: 4%
- Unpaid family work: 0%
- OSM Map
- General Map
- Google Map
- MSN Map

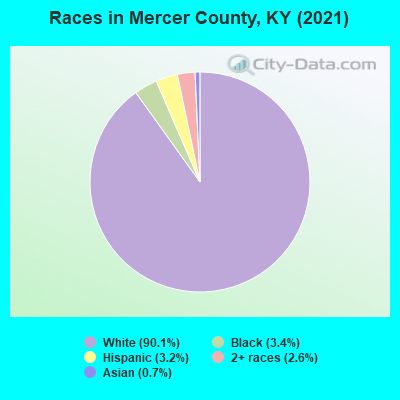
- 20,26189.2%White Non-Hispanic Alone
- 8543.8%Two or more races
- 7753.4%Hispanic or Latino
- 7623.4%Black Non-Hispanic Alone
- 380.2%Asian alone
- 120.05%American Indian and Alaska Native alone
- 30.01%Native Hawaiian and Other
Pacific Islander alone
| Median resident age: | 43.4 years |
| Kentucky median age: | 39.4 years |
| Males: 11,338 | |
| Females: 11,371 |

 | Another hopeful transplant with questions (24 replies) |
| Here we go...again! (8 replies) |
| Looking to move to Kentucky! yay (11 replies) |
| Where in KY would be best for what we're looking for? (23 replies) |
| Home Prices in Central Kentucky (21 replies) |
| Teacher moving to KY (4 replies) |
| Mercer County: | 2.0 people |
| Kentucky: | 2 people |
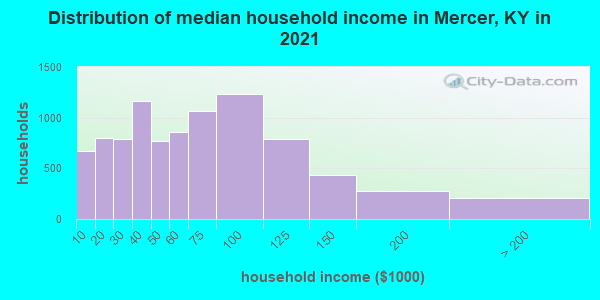
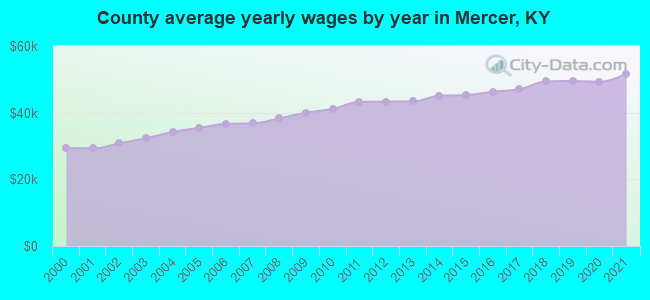
Estimated median household income in 2022: $59,878 ($35,555 in 1999)
| This county: | $59,878 |
| Kentucky: | $59,341 |
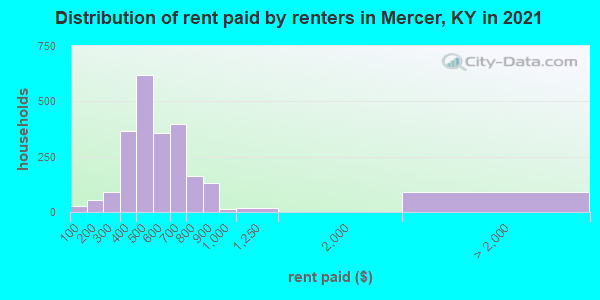
Median contract rent in 2022 for apartments: $546 (lower quartile is $459, upper quartile is $704)
| This county: | $546 |
| State: | $702 |
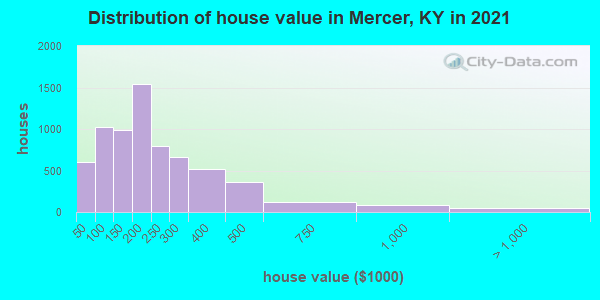
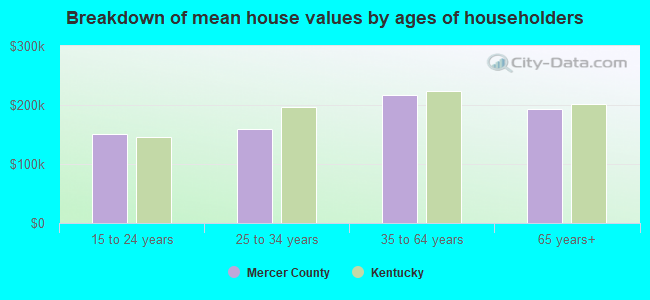
Estimated median house or condo value in 2022: $201,180 (it was $85,000 in 2000)
| Mercer: | $201,180 |
| Kentucky: | $196,300 |
Median monthly housing costs for homes and condos with a mortgage: $1,176
Median monthly housing costs for units without a mortgage: $429
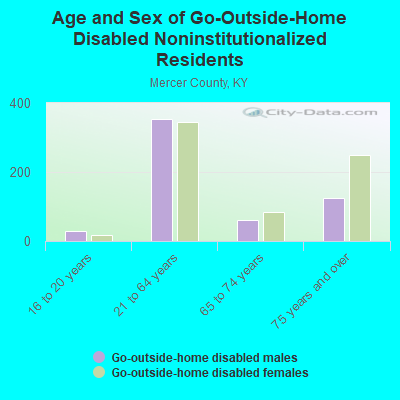
Institutionalized population: 128
Crime in 2021 (reported by the sheriff's office or county police, not the county total):
- Murders: 1
- Rapes: 0
- Robberies: 0
- Assaults: 3
- Burglaries: 8
- Thefts: 9
- Auto thefts: 2
Crime in 2020 (reported by the sheriff's office or county police, not the county total):
- Murders: 0
- Rapes: 0
- Robberies: 1
- Assaults: 1
- Burglaries: 9
- Thefts: 9
- Auto thefts: 2
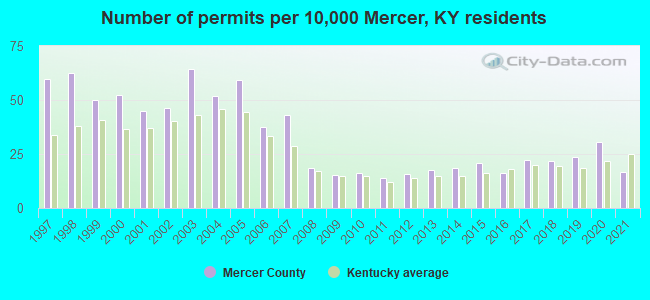
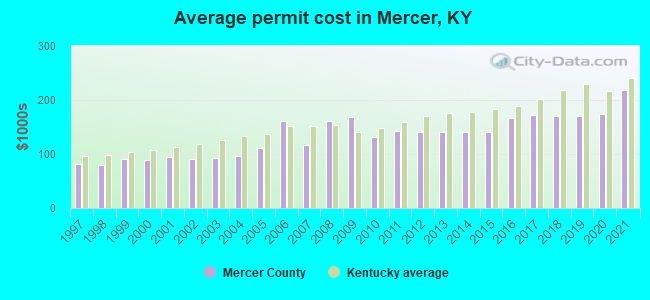
Single-family new house construction building permits:
- 2022: 114 buildings, average cost: $201,800
- 2021: 35 buildings, average cost: $218,700
- 2020: 64 buildings, average cost: $173,600
- 2019: 49 buildings, average cost: $171,100
- 2018: 45 buildings, average cost: $170,300
- 2017: 46 buildings, average cost: $172,200
- 2016: 34 buildings, average cost: $166,000
- 2015: 43 buildings, average cost: $140,200
- 2014: 39 buildings, average cost: $140,200
- 2013: 37 buildings, average cost: $140,200
- 2012: 33 buildings, average cost: $139,600
- 2011: 29 buildings, average cost: $142,100
- 2010: 34 buildings, average cost: $131,800
- 2009: 32 buildings, average cost: $169,300
- 2008: 39 buildings, average cost: $162,100
- 2007: 90 buildings, average cost: $116,300
- 2006: 78 buildings, average cost: $161,000
- 2005: 123 buildings, average cost: $111,800
- 2004: 108 buildings, average cost: $96,400
- 2003: 134 buildings, average cost: $93,000
- 2002: 96 buildings, average cost: $91,200
- 2001: 93 buildings, average cost: $94,300
- 2000: 109 buildings, average cost: $88,200
- 1999: 104 buildings, average cost: $91,000
- 1998: 130 buildings, average cost: $78,800
- 1997: 124 buildings, average cost: $81,300
Median real estate property taxes paid for housing units with mortgages in 2022: $1,671 (0.8%)
Median real estate property taxes paid for housing units with no mortgage in 2022: $1,375 (0.7%)
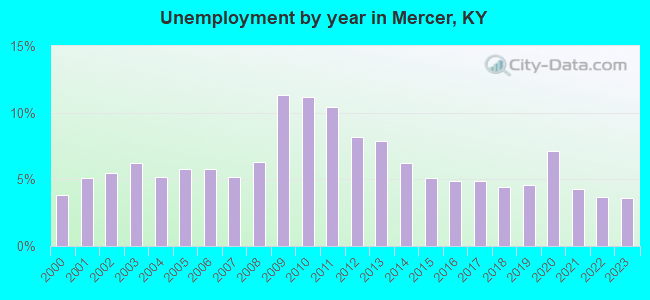
| Mercer County: | 11.4% |
| Kentucky: | 16.5% |
Median age of residents in 2022: 43.4 years old
(Males: 42.5 years old, Females: 44.9 years old)
(Median age for: White residents: 44.5 years old, Black residents: 54.3 years old, American Indian residents: 13.1 years old, Asian residents: 18.1 years old, Hispanic or Latino residents: 29.7 years old, Other race residents: 24.5 years old)
Fair market rent in 2006 for a 1-bedroom apartment in Mercer County is $415 a month.
Fair market rent for a 2-bedroom apartment is $471 a month.
Fair market rent for a 3-bedroom apartment is $620 a month.
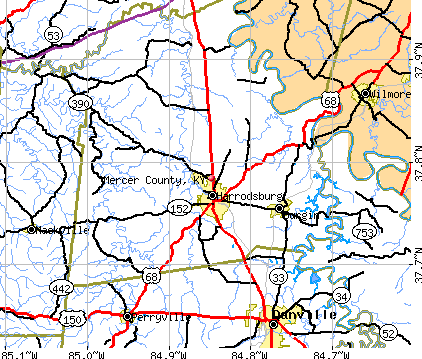
Cities in this county include: Harrodsburg, Salvisa-McAfee, Burgin, Salvisa.
Neighboring counties: Essex County, Virginia  , La Plata County, Colorado
  , Laclede County, Missouri , Lincoln County
  , Pawnee County, Kansas , Spencer County
  .
.
| Here: | 3.7% |
| Kentucky: | 3.8% |
Current college students: 529
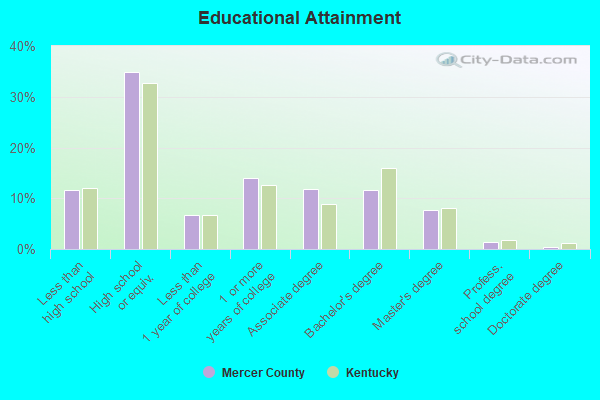
People 25 years of age or older with a high school degree or higher: 90.1%
People 25 years of age or older with a bachelor's degree or higher: 21.7%
Number of foreign born residents: 484 (24.5% naturalized citizens)
| Mercer County: | 2.1% |
| Whole state: | 4.0% |
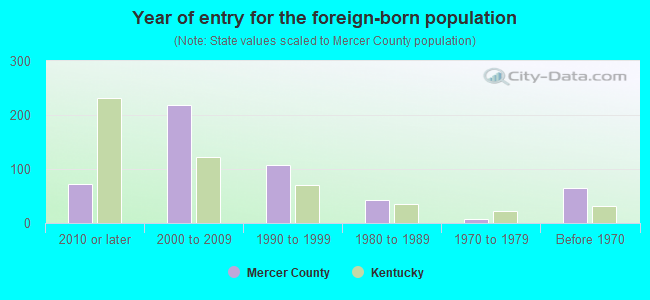
- Year of entry for the foreign-born population
- 1422010 or later
- 1572000 to 2009
- 451990 to 1999
- 431980 to 1989
- 71970 to 1979
- 65Before 1970
Mean travel time to work (commute): minutes
Percentage of county residents living and working in this county: 99.4%
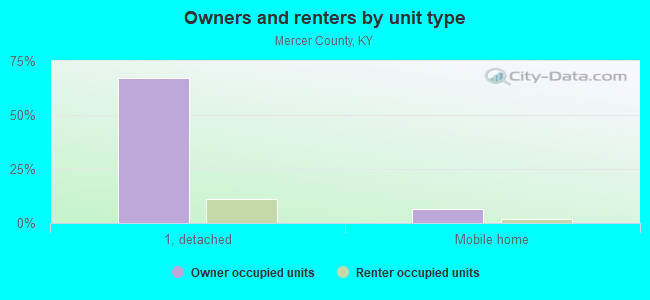
Housing units in structures:
- One, detached: 8,165
- One, attached: 115
- Two: 452
- 3 or 4: 273
- 5 to 9: 295
- 10 to 19: 167
- 20 or more: 54
- Mobile homes: 883
Housing units in Mercer County with a mortgage: 3,903 (420 second mortgage, 0 home equity loan, 387 both second mortgage and home equity loan)
Houses without a mortgage: 136
| Here: | 2.2% with mortgage |
| State: | 96.8% with mortgage |
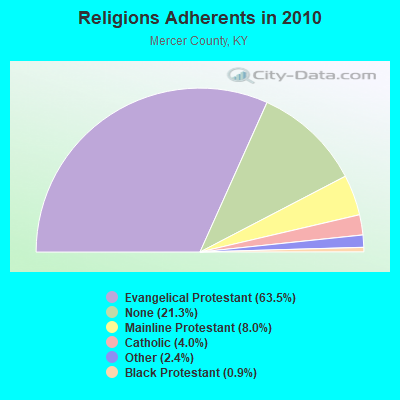
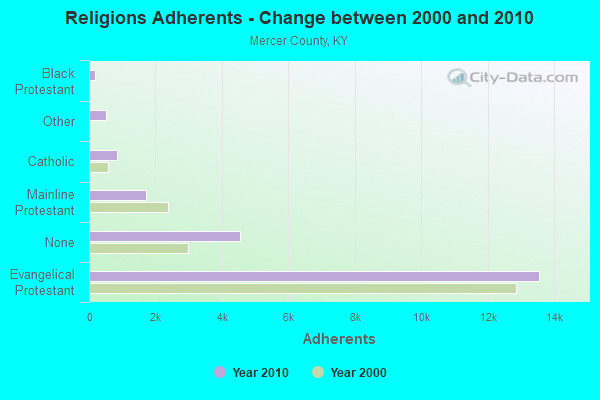
Religion statistics for Mercer County
| Religion | Adherents | Congregations |
|---|---|---|
| Evangelical Protestant | 13,549 | 41 |
| Mainline Protestant | 1,703 | 13 |
| Catholic | 848 | 1 |
| Other | 503 | 2 |
| Black Protestant | 182 | 2 |
| None | 4,546 | - |
Source: Clifford Grammich, Kirk Hadaway, Richard Houseal, Dale E.Jones, Alexei Krindatch, Richie Stanley and Richard H.Taylor. 2012. 2010 U.S.Religion Census: Religious Congregations & Membership Study. Association of Statisticians of American Religious Bodies. Jones, Dale E., et al. 2002. Congregations and Membership in the United States 2000. Nashville, TN: Glenmary Research Center.
Food Environment Statistics:
| Mercer County: | 3.68 / 10,000 pop. |
| State: | 2.19 / 10,000 pop. |
| Mercer County: | 5.05 / 10,000 pop. |
| Kentucky: | 4.36 / 10,000 pop. |
| This county: | 5.05 / 10,000 pop. |
| State: | 5.74 / 10,000 pop. |
| Mercer County: | 12.1% |
| Kentucky: | 11.0% |
| Mercer County: | 30.8% |
| State: | 30.0% |
| Here: | 15.5% |
| State: | 15.9% |
Agriculture in Mercer County:
Average size of farms: 123 acresAverage value of agricultural products sold per farm: $26,611
Average value of crops sold per acre for harvested cropland: $209.69
The value of nursery, greenhouse, floriculture, and sod as a percentage of the total market value of agricultural products sold: 2.74%
The value of livestock, poultry, and their products as a percentage of the total market value of agricultural products sold: 69.04%
Average total farm production expenses per farm: $23,761
Harvested cropland as a percentage of land in farms: 31.91%
Irrigated harvested cropland as a percentage of land in farms: 0.79%
Average market value of all machinery and equipment per farm: $47,025
The percentage of farms operated by a family or individual: 91.80%
Average age of principal farm operators: 54 years
Average number of cattle and calves per 100 acres of all land in farms: 28.75
Milk cows as a percentage of all cattle and calves: 5.22%
Corn for grain: 1224 harvested acres
All wheat for grain: 267 harvested acres
Soybeans for beans: 979 harvested acres
Vegetables: 59 harvested acres
Land in orchards: 22 acres
Earthquake activity:
Mercer County-area historical earthquake activity is significantly above Kentucky state average. It is 89% greater than the overall U.S. average.On 7/27/1980 at 18:52:21, a magnitude 5.2 (5.1 MB, 4.7 MS, 5.0 UK, 5.2 UK, Class: Moderate, Intensity: VI - VII) earthquake occurred 57.3 miles away from Mercer County center
On 4/18/2008 at 09:36:59, a magnitude 5.4 (5.1 MB, 4.8 MS, 5.4 MW, 5.2 MW) earthquake occurred 171.6 miles away from the county center
On 4/18/2008 at 09:36:59, a magnitude 5.2 (5.2 MW, Depth: 8.9 mi) earthquake occurred 171.6 miles away from the county center
On 9/7/1988 at 02:28:09, a magnitude 4.6 (4.5 MB, 4.6 LG, Class: Light, Intensity: IV - V) earthquake occurred 58.5 miles away from the county center
On 6/10/1987 at 23:48:54, a magnitude 5.1 (4.9 MB, 4.4 MS, 4.6 MS, 5.1 LG) earthquake occurred 179.8 miles away from Mercer County center
On 6/18/2002 at 17:37:15, a magnitude 5.0 (4.3 MB, 4.6 MW, 5.0 LG) earthquake occurred 160.6 miles away from the county center
Magnitude types: regional Lg-wave magnitude (LG), body-wave magnitude (MB), surface-wave magnitude (MS), moment magnitude (MW)
Most recent natural disasters:
- Kentucky Covid-19 Pandemic, Incident Period: January 20, 2020, FEMA Id: 4497, Natural disaster type: Other
- Kentucky Severe Storms, Tornadoes, and Flooding, Incident Period: April 12, 2011 to May 20, 2011, Major Disaster (Presidential) Declared DR-1976: May 04, 2011, FEMA Id: 1976, Natural disaster type: Storm, Tornado, Flood
- Kentucky Severe Storms, Flooding, Mudslides, and Tornadoes, Incident Period: May 01, 2010 to June 01, 2010, Major Disaster (Presidential) Declared DR-1912: May 11, 2010, FEMA Id: 1912, Natural disaster type: Storm, Tornado, Mudslide, Flood
- Kentucky Severe Winter Storm, Incident Period: January 27, 2009 to February 05, 2009, Emergency Declared EM-3302: January 28, 2009, FEMA Id: 3302, Natural disaster type: Winter Storm
- Kentucky Severe Winter Storm and Flooding, Incident Period: January 26, 2009 to February 13, 2009, Major Disaster (Presidential) Declared DR-1818: February 05, 2009, FEMA Id: 1818, Natural disaster type: Winter Storm, Flood
- Kentucky Severe Storms, Tornadoes, Straight-line Winds, and Flooding, Incident Period: February 05, 2008 to February 06, 2008, Major Disaster (Presidential) Declared DR-1746: February 21, 2008, FEMA Id: 1746, Natural disaster type: Storm, Tornado, Flood, Wind
- Kentucky Hurricane Katrina Evacuation, Incident Period: August 29, 2005 to October 01, 2005, Emergency Declared EM-3231: September 10, 2005, FEMA Id: 3231, Natural disaster type: Hurricane
- Kentucky Severe Storms, Flooding, Mud and Rock Slides, and Tornadoes, Incident Period: May 04, 2003 to May 27, 2003, Major Disaster (Presidential) Declared DR-1471: June 03, 2003, FEMA Id: 1471, Natural disaster type: Storm, Tornado, Flood
- Kentucky Severe Winter Storms, Incident Period: February 15, 2003 to February 26, 2003, Major Disaster (Presidential) Declared DR-1454: March 14, 2003, FEMA Id: 1454, Natural disaster type: Winter Storm
- Kentucky Severe Winter Storm, Incident Period: February 04, 1998 to February 06, 1998, Major Disaster (Presidential) Declared DR-1207: March 03, 1998, FEMA Id: 1207, Natural disaster type: Winter Storm
- 8 other natural disasters have been reported since 1953.
The number of natural disasters in Mercer County (18) is near the US average (15).
Major Disasters (Presidential) Declared: 14
Emergencies Declared: 3
Causes of natural disasters: Storms: 9, Floods: 8, Tornadoes: 6, Winter Storms: 5, Blizzard: 1, Freeze: 1, Hurricane: 1, Mudslide: 1, Snow: 1, Snowfall: 1, Wind: 1, Other: 1 (Note: some incidents may be assigned to more than one category).
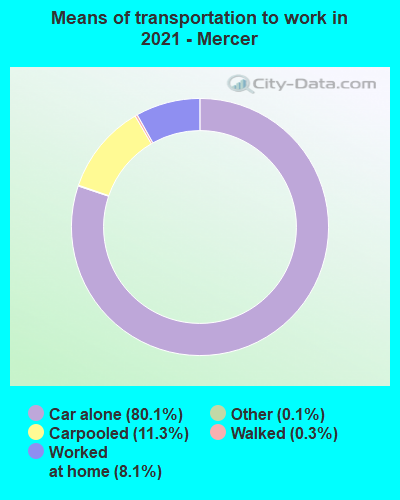
Means of transportation to work:
- Drove a car alone: 6,000 (77.5%)
- Carpooled: 854 (11.0%)
- Taxicab, motorcycle, or other means: 23 (0.3%)
- Walked: 2 (0.0%)
- Worked at home: 907 (11.7%)
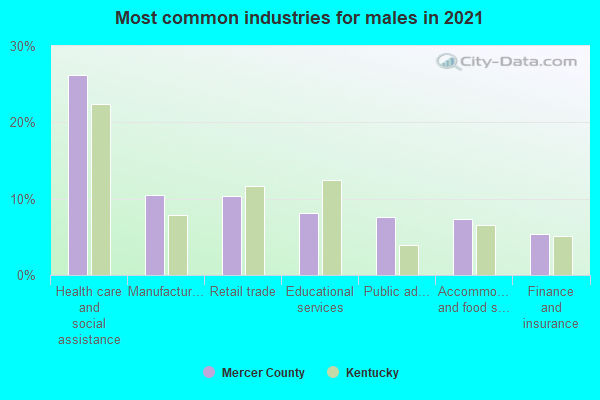
- Health care and social assistance (25%)
- Manufacturing (12%)
- Educational services (10%)
- Retail trade (7%)
- Public administration (6%)
- Accommodation and food services (5%)
- Professional, scientific, and technical services (4%)
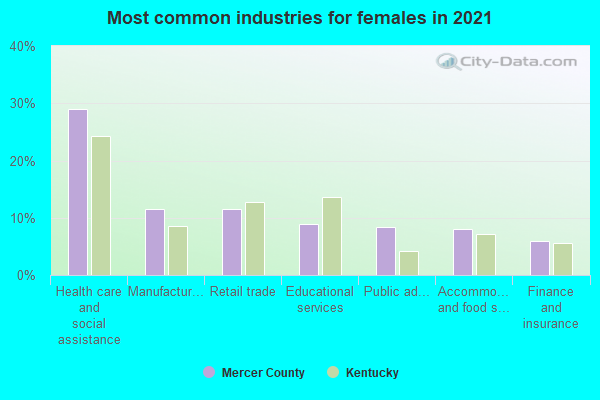
- Health care and social assistance (29%)
- Manufacturing (14%)
- Educational services (11%)
- Retail trade (8%)
- Public administration (7%)
- Accommodation and food services (6%)
- Professional, scientific, and technical services (4%)
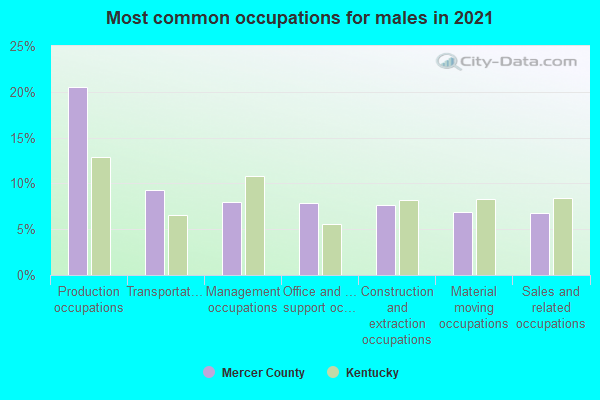
- Production occupations (20%)
- Transportation occupations (10%)
- Office and administrative support occupations (8%)
- Construction and extraction occupations (8%)
- Installation, maintenance, and repair occupations (7%)
- Sales and related occupations (7%)
- Building and grounds cleaning and maintenance occupations (6%)
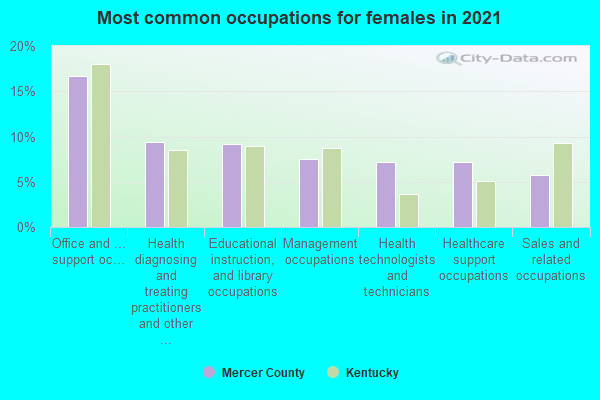
- Office and administrative support occupations (15%)
- Educational instruction, and library occupations (10%)
- Health technologists and technicians (9%)
- Management occupations (8%)
- Production occupations (8%)
- Business and financial operations occupations (7%)
- Health diagnosing and treating practitioners and other technical occupations (7%)
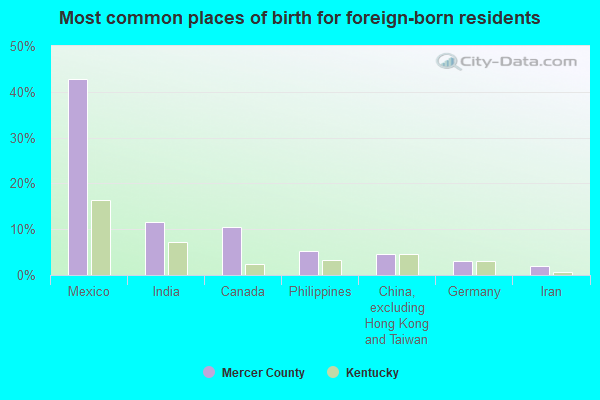
- Mexico (50%)
- Asia, n.e.c. (20%)
- Canada (14%)
- Korea (4%)
- China, excluding Hong Kong and Taiwan (3%)
- England (2%)
- Australia (2%)
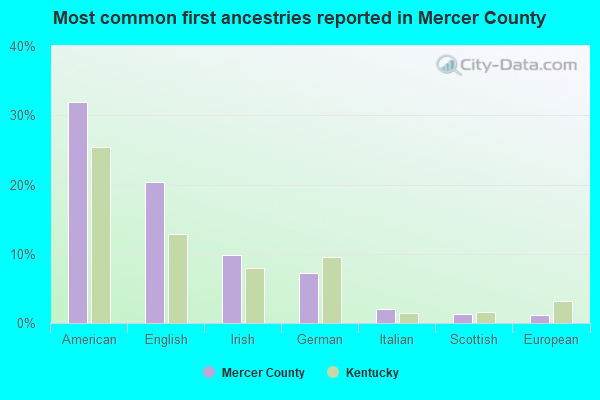
- American (34%)
- English (20%)
- Irish (8%)
- German (6%)
- Italian (2%)
- European (2%)
- Palestinian (2%)
People in group quarters in Mercer County, Kentucky in 2000:
- 113 people in nursing homes
- 30 people in agriculture workers' dormitories on farms
- 3 people in other group homes
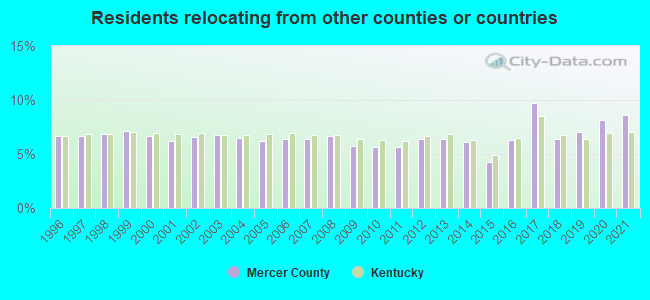
8.58% of this county's 2021 resident taxpayers lived in other counties in 2020 ($46,050 average adjusted gross income)
| Here: | 8.58% |
| Kentucky average: | 7.04% |
10 or fewer of this county's residents moved from foreign countries.
6.80% relocated from other counties in Kentucky ($32,678 average AGI)
1.78% relocated from other states ($13,372 average AGI)
Mercer County: 1.78% Kentucky average: 2.87%
Top counties from which taxpayers relocated into this county between 2020 and 2021:
| from Fayette County, KY | |
| from Boyle County, KY | |
| from Anderson County, KY | |
| from Jessamine County, KY | |
| from Woodford County, KY | |
| from Lincoln County, KY | |
| from Jefferson County, KY |
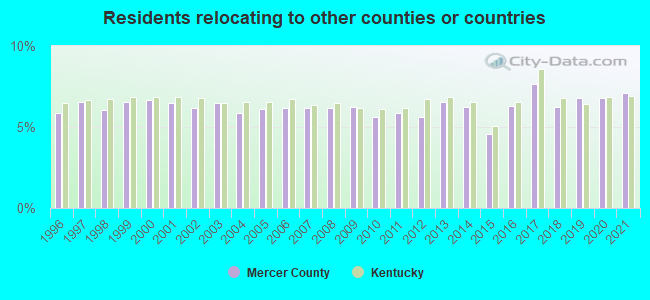
7.11% of this county's 2020 resident taxpayers moved to other counties in 2021 ($48,853 average adjusted gross income)
| Here: | 7.11% |
| Kentucky average: | 6.89% |
10 or fewer of this county's residents moved to foreign countries.
5.84% relocated to other counties in Kentucky ($40,090 average AGI)
1.27% relocated to other states ($8,763 average AGI)
Mercer County: 1.27% Kentucky average: 2.73%
Top counties to which taxpayers relocated from this county between 2020 and 2021:
| to Boyle County, KY | |
| to Fayette County, KY | |
| to Anderson County, KY | |
| to Lincoln County, KY | |
| to Jessamine County, KY | |
| to Jefferson County, KY | |
| to Washington County, KY |
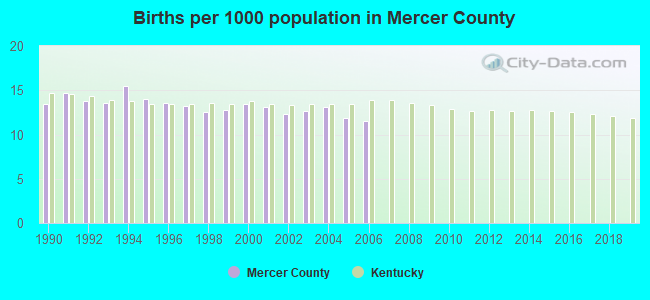
Births per 1000 population from 1990 to 1999: 13.7
Births per 1000 population from 2000 to 2006: 12.6
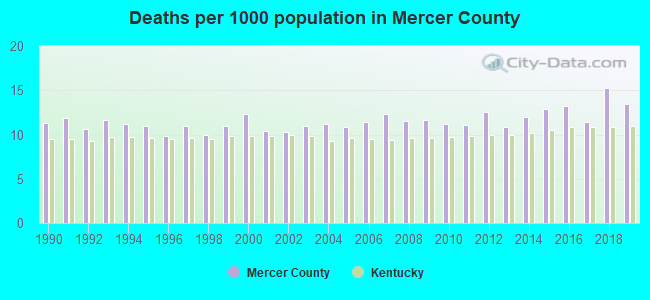
Deaths per 1000 population from 1990 to 1999: 10.9
Deaths per 1000 population from 2000 to 2009: 11.3
Deaths per 1000 population from 2010 to 2020: 12.6
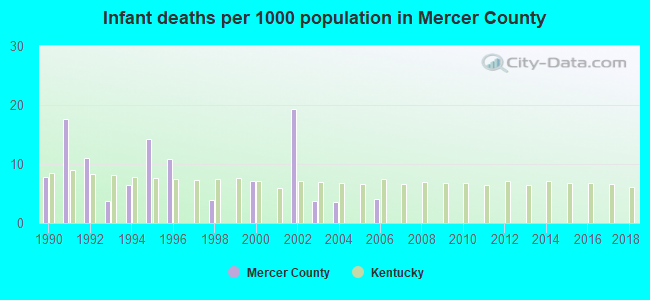
Infant deaths per 1000 live births from 1990 to 1999: 7.6
Infant deaths per 1000 live births from 2000 to 2006: 5.4
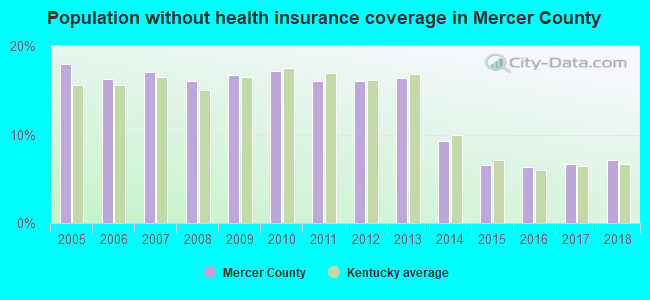
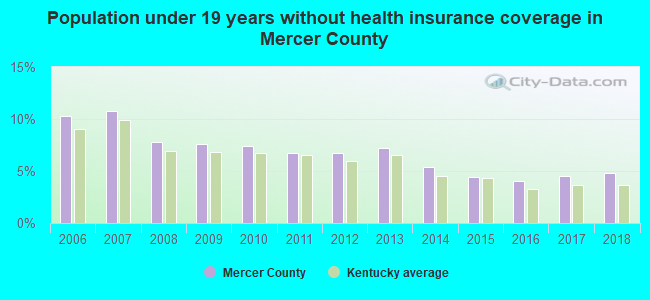
Persons under 19 years old without health insurance coverage in 2018: 4.8%
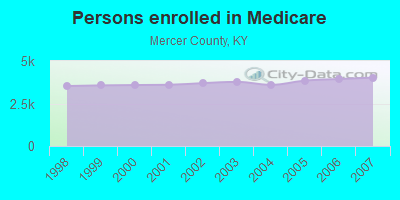
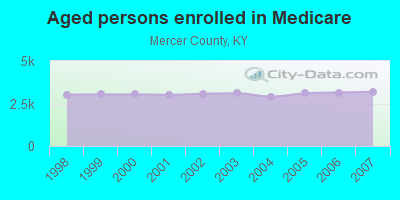
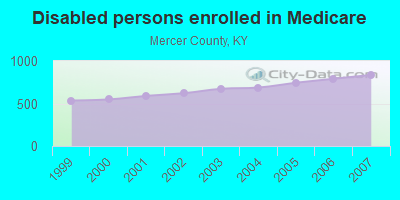
Persons enrolled in hospital insurance and/or supplemental medical insurance (Medicare) in July 1, 2007: 4,024 (3,188 aged, 836 disabled)
Children under 18 without health insurance coverage in 2007: 436 (8%)
Most common underlying causes of death in Mercer County, Kentucky in 1999 - 2019:
- Bronchus or lung, unspecified - Malignant neoplasms (426)
- Acute myocardial infarction, unspecified (261)
- Chronic obstructive pulmonary disease, unspecified (252)
- Atherosclerotic heart disease (214)
- Alzheimer disease, unspecified (108)
- Unspecified dementia (53)
- Congestive heart failure (47)
- Stroke, not specified as haemorrhage or infarction (40)
- Hypertensive heart disease without (congestive) heart failure (11)
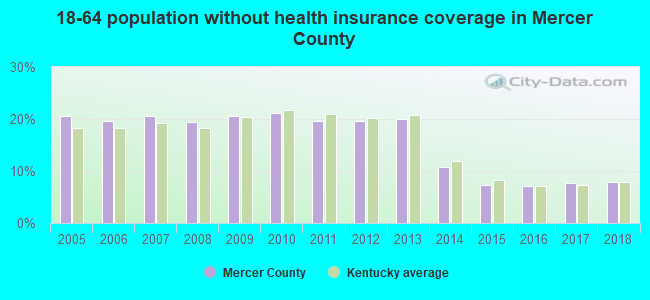
Population without health insurance coverage in 2000: 13%
Children under 18 without health insurance coverage in 2000: 9%
Short term general hospital admissions per 100,000 population in 2004: 3,941
Short term general hospital beds per 100,000 population in 2004: 275
Emergency room visits per 100,000 population in 2004: 38,971
General practice office based MDs per 100,000 population in 2005: 1,268
Medical specialist MDs per 100,000 population in 2005: 972
Dentists per 100,000 population in 1998: 9
Total births per 100,000 population, July 2005 - July 2006 : 24
Total deaths per 100,000 population, July 2005 - July 2006: 65
Limited-service eating places per 100,000 population in 2005 : 9
Suicides per 1,000,000 population from 2000 to 2006: 175.1. This is more than state average.
Household type by relationship:
Households: 22,709- Male householders: 4,703 (1,595 living alone), Female householders: 4,664 (1,652 living alone)
4,681 spouses (4,656 opposite-sex spouses), 404 unmarried partners, (391 opposite-sex unmarried partners), 5,994 children (5,125 natural, 371 adopted, 489 stepchildren), 657 grandchildren, 87 brothers or sisters, 521 parents, 0 foster children, 363 other relatives, 437 non-relatives
- In group quarters: 169
Size of family households: 2,863 2-persons, 1,182 3-persons, 1,110 4-persons, 424 5-persons, 111 6-persons, 130 7-or-more-persons.
Size of nonfamily households: 3,247 1-person, 291 2-persons, 30 3-persons, 4 4-persons.
3,411 married couples with children.
748 single-parent households (237 men, 511 women).
96.1% of residents of Mercer speak English at home.
2.8% of residents speak Spanish at home (44% speak English very well, 20% speak English well, 11% speak English not well, 26% don't speak English at all).
0.6% of residents speak other Indo-European language at home (100% speak English very well).
0.1% of residents speak Asian or Pacific Island language at home (92% speak English very well, 8% speak English well).
0.7% of residents speak other language at home (56% speak English very well, 19% speak English well, 25% speak English not well).
In fiscal year 2004:
Federal Government expenditure: $100,641,000 ($4,683 per capita)
Department of Defense expenditure: $4,371,000
Federal direct payments to individuals for retirement and disability: $55,045,000
Federal other direct payments to individuals: $19,449,000
Federal direct payments not to individuals: $801,000
Federal grants: $19,526,000
Federal procurement contracts: $706,000 ($0,000 Department of Defense)
Federal salaries and wages: $5,115,000 ($2,406,000 Department of Defense)
Federal Government direct loans: $531,000
Federal guaranteed/insured loans: $6,379,000
Federal Government insurance: $4,927,000
Population change from April 1, 2000 to July 1, 2005:
Births: 1,397| Here: | 65 per 1000 residents |
| State: | 69 per 1000 residents |
Deaths: 1,214
| Here: | 56 per 1000 residents |
| State: | 50 per 1000 residents |
Net international migration: +168
| Here: | +8 per 1000 residents |
| State: | +7 per 1000 residents |
Net internal migration: +470
| Here: | +22 per 1000 residents |
| State: | +8 per 1000 residents |
Total withdrawal of fresh water for public supply: 2.72 millions of gallons per day (all from surface)
| Here: | 6.4 |
| State: | 6.4 |
| Here: | 4.6 |
| State: | 4.4 |
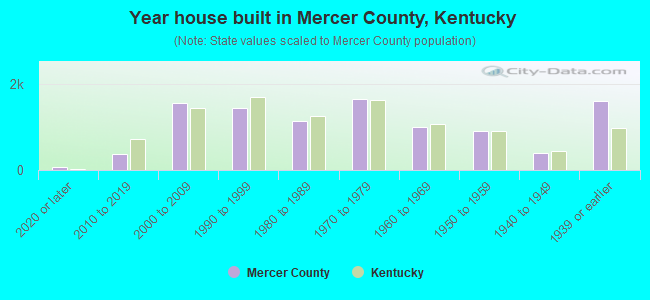
- Year house built in Mercer County, Kentucky
- 1152020 or later
- 4502010 to 2019
- 1,8122000 to 2009
- 1,4151990 to 1999
- 1,0721980 to 1989
- 1,6901970 to 1979
- 9831960 to 1969
- 8071950 to 1959
- 4021940 to 1949
- 1,4901939 or earlier
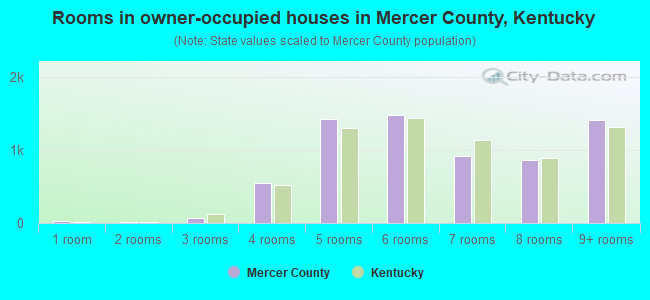
- Rooms in owner-occupied houses in Mercer County, Kentucky
- 211 room
- 82 rooms
- 743 rooms
- 5764 rooms
- 1,4455 rooms
- 1,5886 rooms
- 1,1247 rooms
- 8338 rooms
- 1,3779+ rooms
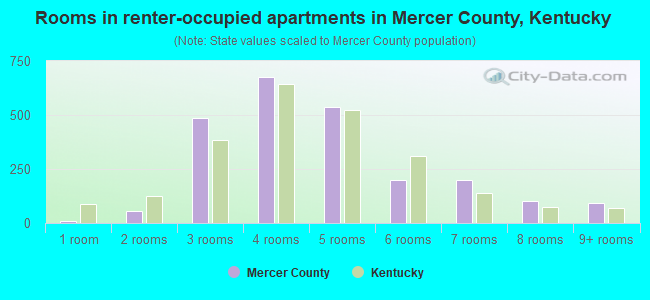
- Rooms in renter-occupied apartments in Mercer County, Kentucky
- 71 room
- 322 rooms
- 3813 rooms
- 6924 rooms
- 5455 rooms
- 2396 rooms
- 2157 rooms
- 1128 rooms
- 1029+ rooms
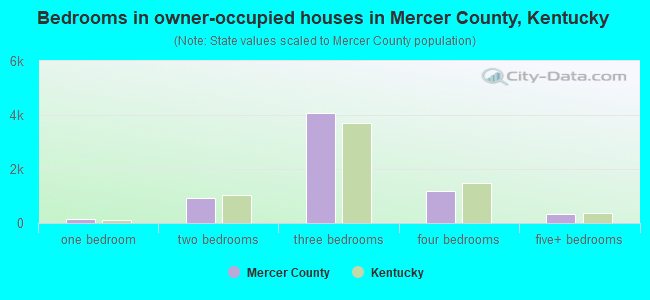
- Bedrooms in owner-occupied houses in Mercer County, Kentucky
- 21no bedroom
- 691 bedroom
- 1,0452 bedrooms
- 4,3943 bedrooms
- 1,1174 bedrooms
- 4045+ bedrooms
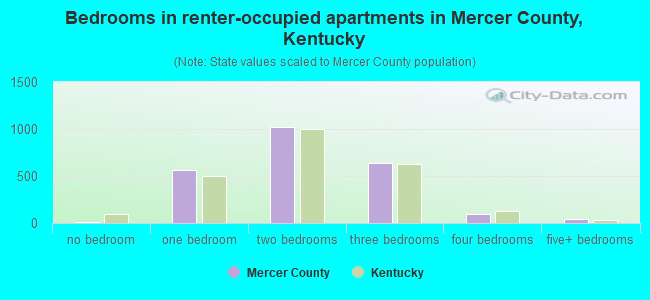
- Bedrooms in renter-occupied apartments in Mercer County, Kentucky
- 7no bedroom
- 4761 bedroom
- 9902 bedrooms
- 6873 bedrooms
- 1404 bedrooms
- 445+ bedrooms
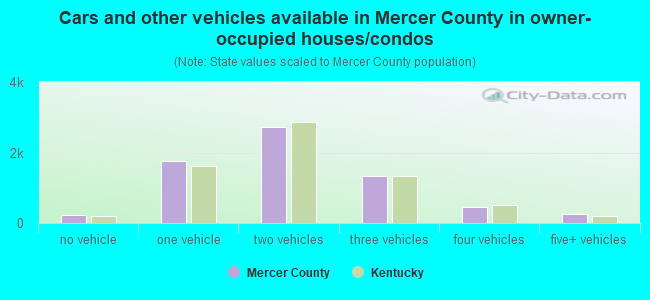
- Cars and other vehicles available in Mercer County in owner-occupied houses/condos
- 241no vehicle
- 1,8941 vehicle
- 2,6542 vehicles
- 1,4913 vehicles
- 5164 vehicles
- 2485+ vehicles
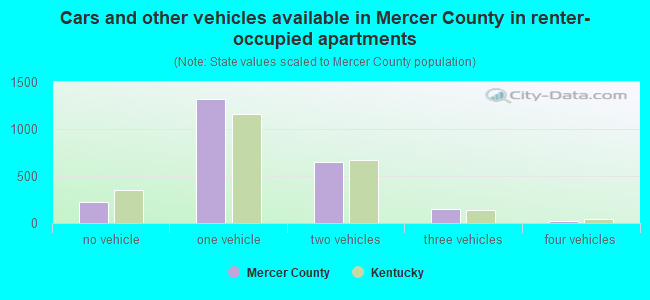
- Cars and other vehicles available in Mercer County in renter-occupied apartments
- 196no vehicle
- 1,2391 vehicle
- 6612 vehicles
- 2523 vehicles
- 124 vehicles
- 05+ vehicles
89.4% of Mercer County residents lived in the same house 1 years ago.
Out of people who lived in different houses, 30% lived in this county.
Out of people who lived in different counties, 77% lived in Kentucky.
| Mercer County: | 89.4% |
| State average: | 87.2% |
Place of birth for U.S.-born residents:
- This state: 17,194
- Other state: 4,944
- Northeast: 875
- Midwest: 1,513
- South: 1,766
- West: 848
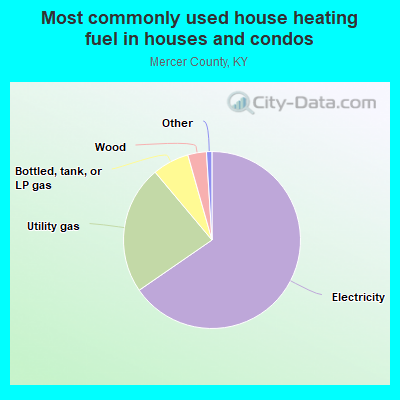
- 66.3%Electricity
- 20.8%Utility gas
- 8.5%Bottled, tank, or LP gas
- 2.7%Wood
- 0.6%Other fuel
- 0.5%No fuel used
- 0.4%Solar energy
- 0.2%Fuel oil, kerosene, etc.
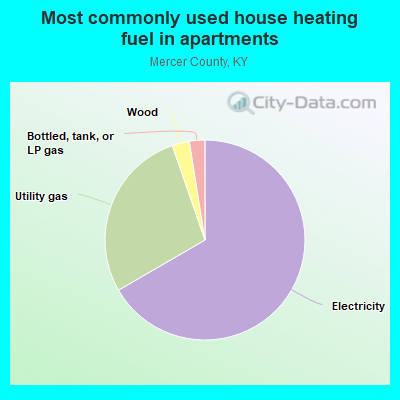
- 65.3%Electricity
- 29.3%Utility gas
- 2.8%Bottled, tank, or LP gas
- 2.7%Wood
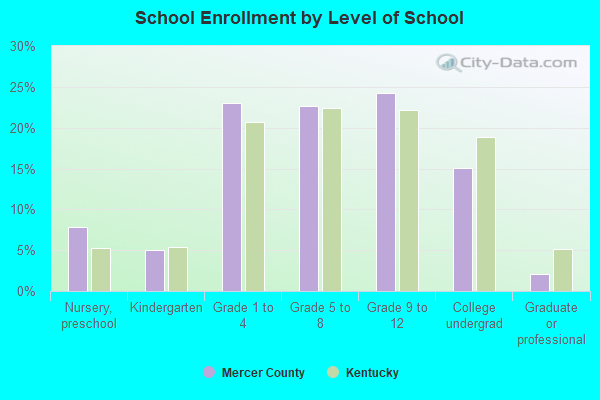
Private vs. public school enrollment:
| Here: | 10.1% |
| Kentucky: | 17.2% |
| Here: | 19.8% |
| Kentucky: | 15.2% |
| Here: | 26.7% |
| Kentucky: | 19.6% |
Mercer County government finances - Expenditure in 2017:
- Bond Funds - Cash and Securities: $948,000
Cash and Securities: $772,000
- Charges - Hospital Public: $3,171,000
Solid Waste Management: $368,000
Hospital Public: $320,000
Solid Waste Management: $241,000
Other: $233,000
Other: $226,000
- Construction - Regular Highways: $266,000
Regular Highways: $251,000
Parks and Recreation: $117,000
Parks and Recreation: $70,000
General - Other: $53,000
General - Other: $3,000
- Current Operations - Health - Other: $4,931,000
General - Other: $2,301,000
Health - Other: $1,973,000
General - Other: $1,419,000
Correctional Institutions: $820,000
Regular Highways: $710,000
Regular Highways: $617,000
Solid Waste Management: $393,000
Solid Waste Management: $363,000
Correctional Institutions: $334,000
Judicial and Legal Services: $289,000
Central Staff Services: $272,000
Judicial and Legal Services: $255,000
Central Staff Services: $248,000
Parks and Recreation: $163,000
General Public Buildings: $148,000
Financial Administration: $146,000
Police Protection: $144,000
Financial Administration: $133,000
Police Protection: $132,000
General Public Buildings: $107,000
Parks and Recreation: $52,000
Protective Inspection and Regulation - Other: $49,000
Protective Inspection and Regulation - Other: $47,000
Sewerage: $35,000
Sewerage: $30,000
Public Welfare - Other: $11,000
Public Welfare - Other: $9,000
Natural Resources - Other: $1,000
Transit Utilities: $1,000
Transit Utilities: $1,000
Natural Resources - Other: $1,000
- Federal Intergovernmental - Health and Hospitals: $849,000
Health and Hospitals: $394,000
Other: $30,000
- General - Interest on Debt: $905,000
- Intergovernmental to Local - Other - Correctional Institutions: $569,000
Other - Regular Highways: $157,000
- Local Intergovernmental - Health and Hospitals: $680,000
Health and Hospitals: $550,000
Other: $50,000
Other: $36,000
Highways: $11,000
Highways: $10,000
- Long Term Debt - Beginning Outstanding - Unspecified Public Purpose: $25,555,000
Outstanding Unspecified Public Purpose: $24,650,000
Beginning Outstanding - Unspecified Public Purpose: $22,635,000
Outstanding Unspecified Public Purpose: $21,510,000
Beginning Outstanding - Public Debt for Private Purpose: $6,641,000
Outstanding Nonguaranteed - Industrial Revenue: $6,641,000
Retired Unspecified Public Purpose: $1,125,000
Retired Unspecified Public Purpose: $905,000
- Miscellaneous - General Revenue - Other: $108,000
Interest Earnings: $102,000
General Revenue - Other: $94,000
Interest Earnings: $19,000
Sale of Property: $16,000
- Other Capital Outlay - Police Protection: $108,000
General - Other: $103,000
Parks and Recreation: $42,000
Regular Highways: $30,000
Police Protection: $19,000
Regular Highways: $14,000
General Public Building: $10,000
Central Staff Services: $4,000
General - Other: $4,000
Financial Administration: $3,000
- Other Funds - Cash and Securities: $6,834,000
Cash and Securities: $4,306,000
- Sinking Funds - Cash and Securities: $6,641,000
Cash and Securities: $240,000
- State Intergovernmental - Other: $1,205,000
Highways: $1,124,000
Highways: $1,087,000
Other: $795,000
Health and Hospitals: $632,000
Health and Hospitals: $331,000
General Local Government Support: $74,000
General Local Government Support: $62,000
- Tax - Property: $1,745,000
Individual Income: $1,615,000
Individual Income: $1,535,000
Property: $1,534,000
Other: $635,000
Public Utilities Sales: $238,000
Public Utilities Sales: $226,000
Documentary and Stock Transfer: $95,000
Documentary and Stock Transfer: $74,000
Corporation License: $55,000
Corporation License: $54,000
- Total Salaries and Wages: $1,640,000
: $1,245,000
Mercer County government finances - Revenue in 2017:
- Bond Funds - Cash and Securities: $948,000
Cash and Securities: $772,000
- Charges - Hospital Public: $3,171,000
Solid Waste Management: $368,000
Hospital Public: $320,000
Solid Waste Management: $241,000
Other: $233,000
Other: $226,000
- Construction - Regular Highways: $266,000
Regular Highways: $251,000
Parks and Recreation: $117,000
Parks and Recreation: $70,000
General - Other: $53,000
General - Other: $3,000
- Current Operations - Health - Other: $4,931,000
General - Other: $2,301,000
Health - Other: $1,973,000
General - Other: $1,419,000
Correctional Institutions: $820,000
Regular Highways: $710,000
Regular Highways: $617,000
Solid Waste Management: $393,000
Solid Waste Management: $363,000
Correctional Institutions: $334,000
Judicial and Legal Services: $289,000
Central Staff Services: $272,000
Judicial and Legal Services: $255,000
Central Staff Services: $248,000
Parks and Recreation: $163,000
General Public Buildings: $148,000
Financial Administration: $146,000
Police Protection: $144,000
Financial Administration: $133,000
Police Protection: $132,000
General Public Buildings: $107,000
Parks and Recreation: $52,000
Protective Inspection and Regulation - Other: $49,000
Protective Inspection and Regulation - Other: $47,000
Sewerage: $35,000
Sewerage: $30,000
Public Welfare - Other: $11,000
Public Welfare - Other: $9,000
Natural Resources - Other: $1,000
Transit Utilities: $1,000
Transit Utilities: $1,000
Natural Resources - Other: $1,000
- Federal Intergovernmental - Health and Hospitals: $849,000
Health and Hospitals: $394,000
Other: $30,000
- General - Interest on Debt: $905,000
- Intergovernmental to Local - Other - Correctional Institutions: $569,000
Other - Regular Highways: $157,000
- Local Intergovernmental - Health and Hospitals: $680,000
Health and Hospitals: $550,000
Other: $50,000
Other: $36,000
Highways: $11,000
Highways: $10,000
- Long Term Debt - Beginning Outstanding - Unspecified Public Purpose: $25,555,000
Outstanding Unspecified Public Purpose: $24,650,000
Beginning Outstanding - Unspecified Public Purpose: $22,635,000
Outstanding Unspecified Public Purpose: $21,510,000
Beginning Outstanding - Public Debt for Private Purpose: $6,641,000
Outstanding Nonguaranteed - Industrial Revenue: $6,641,000
Retired Unspecified Public Purpose: $1,125,000
Retired Unspecified Public Purpose: $905,000
- Miscellaneous - General Revenue - Other: $108,000
Interest Earnings: $102,000
General Revenue - Other: $94,000
Interest Earnings: $19,000
Sale of Property: $16,000
- Other Capital Outlay - Police Protection: $108,000
General - Other: $103,000
Parks and Recreation: $42,000
Regular Highways: $30,000
Police Protection: $19,000
Regular Highways: $14,000
General Public Building: $10,000
Central Staff Services: $4,000
General - Other: $4,000
Financial Administration: $3,000
- Other Funds - Cash and Securities: $6,834,000
Cash and Securities: $4,306,000
- Sinking Funds - Cash and Securities: $6,641,000
Cash and Securities: $240,000
- State Intergovernmental - Other: $1,205,000
Highways: $1,124,000
Highways: $1,087,000
Other: $795,000
Health and Hospitals: $632,000
Health and Hospitals: $331,000
General Local Government Support: $74,000
General Local Government Support: $62,000
- Tax - Property: $1,745,000
Individual Income: $1,615,000
Individual Income: $1,535,000
Property: $1,534,000
Other: $635,000
Public Utilities Sales: $238,000
Public Utilities Sales: $226,000
Documentary and Stock Transfer: $95,000
Documentary and Stock Transfer: $74,000
Corporation License: $55,000
Corporation License: $54,000
- Total Salaries and Wages: $1,640,000
: $1,245,000
Mercer County government finances - Debt in 2017:
- Bond Funds - Cash and Securities: $948,000
Cash and Securities: $772,000
- Charges - Hospital Public: $3,171,000
Solid Waste Management: $368,000
Hospital Public: $320,000
Solid Waste Management: $241,000
Other: $233,000
Other: $226,000
- Construction - Regular Highways: $266,000
Regular Highways: $251,000
Parks and Recreation: $117,000
Parks and Recreation: $70,000
General - Other: $53,000
General - Other: $3,000
- Current Operations - Health - Other: $4,931,000
General - Other: $2,301,000
Health - Other: $1,973,000
General - Other: $1,419,000
Correctional Institutions: $820,000
Regular Highways: $710,000
Regular Highways: $617,000
Solid Waste Management: $393,000
Solid Waste Management: $363,000
Correctional Institutions: $334,000
Judicial and Legal Services: $289,000
Central Staff Services: $272,000
Judicial and Legal Services: $255,000
Central Staff Services: $248,000
Parks and Recreation: $163,000
General Public Buildings: $148,000
Financial Administration: $146,000
Police Protection: $144,000
Financial Administration: $133,000
Police Protection: $132,000
General Public Buildings: $107,000
Parks and Recreation: $52,000
Protective Inspection and Regulation - Other: $49,000
Protective Inspection and Regulation - Other: $47,000
Sewerage: $35,000
Sewerage: $30,000
Public Welfare - Other: $11,000
Public Welfare - Other: $9,000
Natural Resources - Other: $1,000
Transit Utilities: $1,000
Transit Utilities: $1,000
Natural Resources - Other: $1,000
- Federal Intergovernmental - Health and Hospitals: $849,000
Health and Hospitals: $394,000
Other: $30,000
- General - Interest on Debt: $905,000
- Intergovernmental to Local - Other - Correctional Institutions: $569,000
Other - Regular Highways: $157,000
- Local Intergovernmental - Health and Hospitals: $680,000
Health and Hospitals: $550,000
Other: $50,000
Other: $36,000
Highways: $11,000
Highways: $10,000
- Long Term Debt - Beginning Outstanding - Unspecified Public Purpose: $25,555,000
Outstanding Unspecified Public Purpose: $24,650,000
Beginning Outstanding - Unspecified Public Purpose: $22,635,000
Outstanding Unspecified Public Purpose: $21,510,000
Beginning Outstanding - Public Debt for Private Purpose: $6,641,000
Outstanding Nonguaranteed - Industrial Revenue: $6,641,000
Retired Unspecified Public Purpose: $1,125,000
Retired Unspecified Public Purpose: $905,000
- Miscellaneous - General Revenue - Other: $108,000
Interest Earnings: $102,000
General Revenue - Other: $94,000
Interest Earnings: $19,000
Sale of Property: $16,000
- Other Capital Outlay - Police Protection: $108,000
General - Other: $103,000
Parks and Recreation: $42,000
Regular Highways: $30,000
Police Protection: $19,000
Regular Highways: $14,000
General Public Building: $10,000
Central Staff Services: $4,000
General - Other: $4,000
Financial Administration: $3,000
- Other Funds - Cash and Securities: $6,834,000
Cash and Securities: $4,306,000
- Sinking Funds - Cash and Securities: $6,641,000
Cash and Securities: $240,000
- State Intergovernmental - Other: $1,205,000
Highways: $1,124,000
Highways: $1,087,000
Other: $795,000
Health and Hospitals: $632,000
Health and Hospitals: $331,000
General Local Government Support: $74,000
General Local Government Support: $62,000
- Tax - Property: $1,745,000
Individual Income: $1,615,000
Individual Income: $1,535,000
Property: $1,534,000
Other: $635,000
Public Utilities Sales: $238,000
Public Utilities Sales: $226,000
Documentary and Stock Transfer: $95,000
Documentary and Stock Transfer: $74,000
Corporation License: $55,000
Corporation License: $54,000
- Total Salaries and Wages: $1,640,000
: $1,245,000
Mercer County government finances - Cash and Securities in 2017:
- Bond Funds - Cash and Securities: $948,000
Cash and Securities: $772,000
- Charges - Hospital Public: $3,171,000
Solid Waste Management: $368,000
Hospital Public: $320,000
Solid Waste Management: $241,000
Other: $233,000
Other: $226,000
- Construction - Regular Highways: $266,000
Regular Highways: $251,000
Parks and Recreation: $117,000
Parks and Recreation: $70,000
General - Other: $53,000
General - Other: $3,000
- Current Operations - Health - Other: $4,931,000
General - Other: $2,301,000
Health - Other: $1,973,000
General - Other: $1,419,000
Correctional Institutions: $820,000
Regular Highways: $710,000
Regular Highways: $617,000
Solid Waste Management: $393,000
Solid Waste Management: $363,000
Correctional Institutions: $334,000
Judicial and Legal Services: $289,000
Central Staff Services: $272,000
Judicial and Legal Services: $255,000
Central Staff Services: $248,000
Parks and Recreation: $163,000
General Public Buildings: $148,000
Financial Administration: $146,000
Police Protection: $144,000
Financial Administration: $133,000
Police Protection: $132,000
General Public Buildings: $107,000
Parks and Recreation: $52,000
Protective Inspection and Regulation - Other: $49,000
Protective Inspection and Regulation - Other: $47,000
Sewerage: $35,000
Sewerage: $30,000
Public Welfare - Other: $11,000
Public Welfare - Other: $9,000
Natural Resources - Other: $1,000
Transit Utilities: $1,000
Transit Utilities: $1,000
Natural Resources - Other: $1,000
- Federal Intergovernmental - Health and Hospitals: $849,000
Health and Hospitals: $394,000
Other: $30,000
- General - Interest on Debt: $905,000
- Intergovernmental to Local - Other - Correctional Institutions: $569,000
Other - Regular Highways: $157,000
- Local Intergovernmental - Health and Hospitals: $680,000
Health and Hospitals: $550,000
Other: $50,000
Other: $36,000
Highways: $11,000
Highways: $10,000
- Long Term Debt - Beginning Outstanding - Unspecified Public Purpose: $25,555,000
Outstanding Unspecified Public Purpose: $24,650,000
Beginning Outstanding - Unspecified Public Purpose: $22,635,000
Outstanding Unspecified Public Purpose: $21,510,000
Beginning Outstanding - Public Debt for Private Purpose: $6,641,000
Outstanding Nonguaranteed - Industrial Revenue: $6,641,000
Retired Unspecified Public Purpose: $1,125,000
Retired Unspecified Public Purpose: $905,000
- Miscellaneous - General Revenue - Other: $108,000
Interest Earnings: $102,000
General Revenue - Other: $94,000
Interest Earnings: $19,000
Sale of Property: $16,000
- Other Capital Outlay - Police Protection: $108,000
General - Other: $103,000
Parks and Recreation: $42,000
Regular Highways: $30,000
Police Protection: $19,000
Regular Highways: $14,000
General Public Building: $10,000
Central Staff Services: $4,000
General - Other: $4,000
Financial Administration: $3,000
- Other Funds - Cash and Securities: $6,834,000
Cash and Securities: $4,306,000
- Sinking Funds - Cash and Securities: $6,641,000
Cash and Securities: $240,000
- State Intergovernmental - Other: $1,205,000
Highways: $1,124,000
Highways: $1,087,000
Other: $795,000
Health and Hospitals: $632,000
Health and Hospitals: $331,000
General Local Government Support: $74,000
General Local Government Support: $62,000
- Tax - Property: $1,745,000
Individual Income: $1,615,000
Individual Income: $1,535,000
Property: $1,534,000
Other: $635,000
Public Utilities Sales: $238,000
Public Utilities Sales: $226,000
Documentary and Stock Transfer: $95,000
Documentary and Stock Transfer: $74,000
Corporation License: $55,000
Corporation License: $54,000
- Total Salaries and Wages: $1,640,000
: $1,245,000
Supplemental Security Income (SSI) in 2006:
- Total number of recipients: 714
- Number of aged recipients: 83
- Number of blind and disabled recipients: 631
- Number of recipients under 18: 122
- Number of recipients between 18 and 64: 415
- Number of recipients older than 64: 177
- Number of recipients also receiving OASDI: 321
- Amount of payments (thousands of dollars): 291
| Most common first names in Mercer County, KY among deceased individuals | ||
| Name | Count | Lived (average) |
|---|---|---|
| William | 197 | 74.0 years |
| James | 188 | 73.4 years |
| Mary | 153 | 80.2 years |
| John | 136 | 74.4 years |
| Robert | 100 | 71.2 years |
| Charles | 76 | 71.7 years |
| George | 71 | 74.8 years |
| Margaret | 57 | 77.0 years |
| Thomas | 55 | 72.8 years |
| Elizabeth | 48 | 78.1 years |
| Most common last names in Mercer County, KY among deceased individuals | ||
| Last name | Count | Lived (average) |
|---|---|---|
| Smith | 73 | 74.2 years |
| Taylor | 67 | 72.4 years |
| Robinson | 63 | 76.9 years |
| Sims | 59 | 77.3 years |
| Devine | 57 | 72.9 years |
| Watts | 51 | 76.6 years |
| Dean | 49 | 77.0 years |
| Phillips | 49 | 72.8 years |
| Sallee | 47 | 72.1 years |
| Brown | 47 | 76.8 years |
| Businesses in Mercer County, KY | ||||
| Name | Count | Name | Count | |
|---|---|---|---|---|
| AT&T | 1 | Little Caesars Pizza | 1 | |
| Arby's | 1 | Long John Silver's | 1 | |
| AutoZone | 1 | McDonald's | 1 | |
| CVS | 1 | Pizza Hut | 1 | |
| Chevrolet | 1 | SONIC Drive-In | 1 | |
| DHL | 1 | Subway | 2 | |
| Dairy Queen | 1 | T-Mobile | 1 | |
| Days Inn | 1 | Taco Bell | 1 | |
| FedEx | 2 | U-Haul | 1 | |
| H&R Block | 1 | UPS | 1 | |
| Jimmy John's | 6 | Walmart | 1 | |
| KFC | 1 | Wendy's | 1 | |
| Kroger | 1 | YMCA | 1 | |
| Lane Furniture | 1 | |||