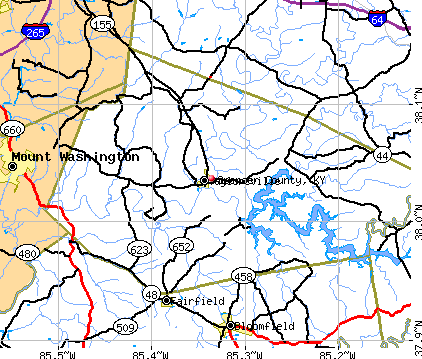
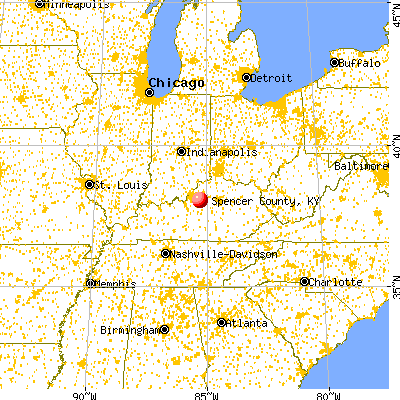
Spencer County, Kentucky (KY)
County owner-occupied free and clear houses and condos in 2010: 1,097
County owner-occupied houses and condos in 2000: 3,511
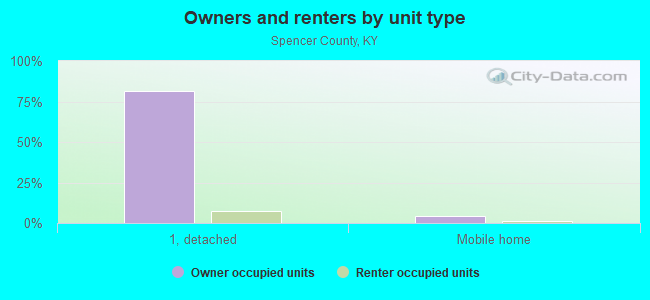
Renter-occupied apartments: 993 (it was 740 in 2000)
| % of renters here: | 17% |
| State: | 31% |
Land area: 186 sq. mi.
Water area: 5.9 sq. mi.
Population density: 105 people per square mile (average).
Industries providing employment: Educational, health and social services (23.4%), Manufacturing (18.4%), Retail trade (11.4%).
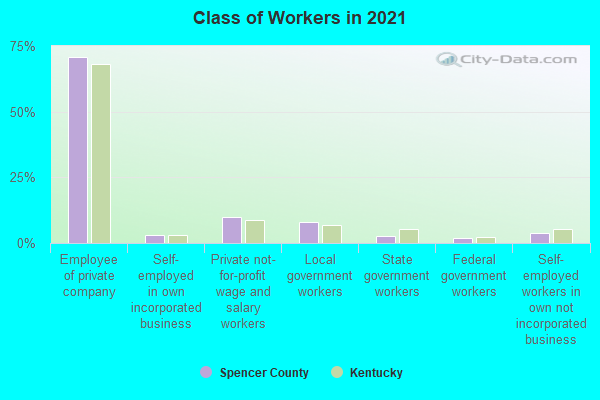
Type of workers:
- Private wage or salary: 85%
- Government: 11%
- Self-employed, not incorporated: 4%
- Unpaid family work: 0%
- OSM Map
- General Map
- Google Map
- MSN Map

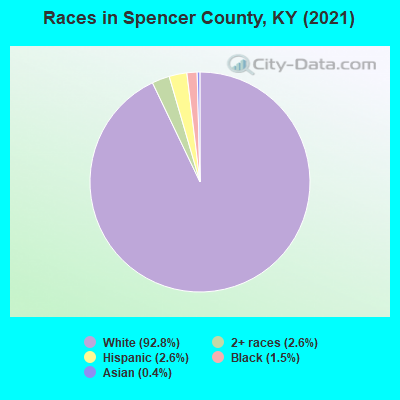
- 18,07892.7%White Non-Hispanic Alone
- 5332.7%Hispanic or Latino
- 4322.2%Two or more races
- 3291.7%Black Non-Hispanic Alone
- 780.4%Asian alone
- 320.2%Some other race alone
- 160.08%American Indian and Alaska Native alone
| Median resident age: | 43.2 years |
| Kentucky median age: | 39.4 years |
| Males: 9,873 | |
| Females: 9,716 |

 | New Albany? What's it like to live there? (18 replies) |
| Louisville Metro a bad idea. (182 replies) |
| I'm thinking of moving my family to Kentucky (15 replies) |
| Moving to Louisville, need some advise for places (8 replies) |
| Spencer County (2 replies) |
| You must be the proudest happiest people Ive met.... (118 replies) |
| Spencer County: | 2.0 people |
| Kentucky: | 2 people |
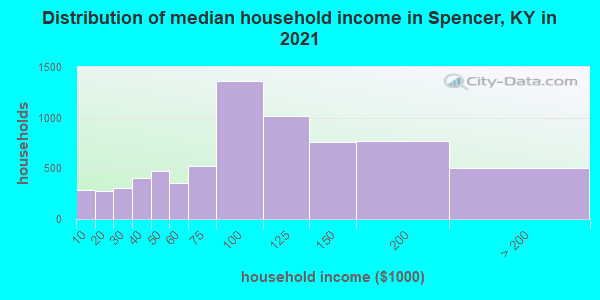
Estimated median household income in 2022: $99,703 ($47,042 in 1999)
| This county: | $99,703 |
| Kentucky: | $59,341 |
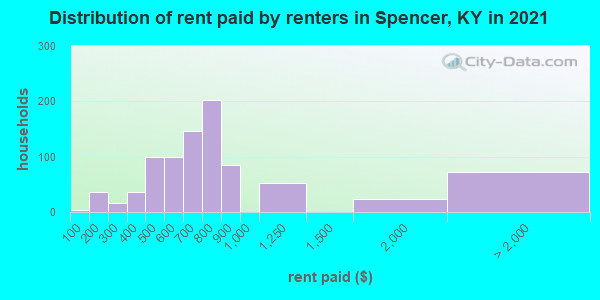
Median contract rent in 2022 for apartments: $740 (lower quartile is $597, upper quartile is $819)
| This county: | $740 |
| State: | $702 |
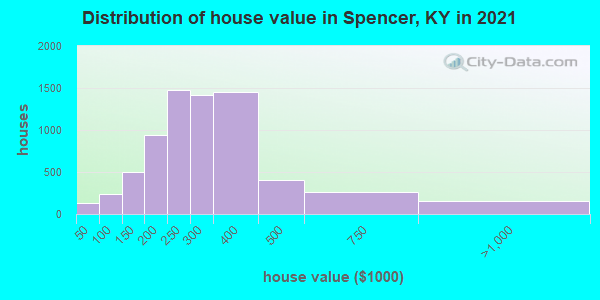
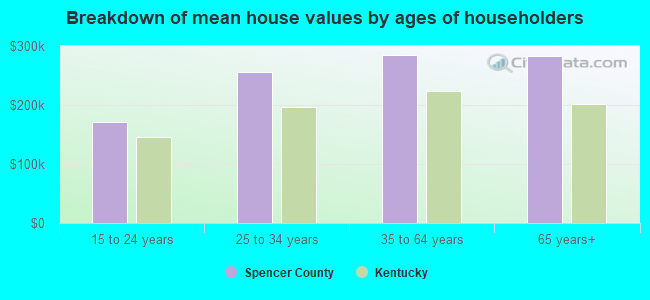
Estimated median house or condo value in 2022: $319,625 (it was $114,200 in 2000)
| Spencer: | $319,625 |
| Kentucky: | $196,300 |
Mean price in 2022:
Median monthly housing costs for homes and condos with a mortgage: $1,539Detached houses: $348,832
Here: $348,832 State: $256,452 Townhouses or other attached units: $190,751
Here: $190,751 State: $264,090 In 2-unit structures: $86,360
Here: $86,360 State: $211,203 Mobile homes: $156,762
Here: $156,762 State: $84,635
Median monthly housing costs for units without a mortgage: $485
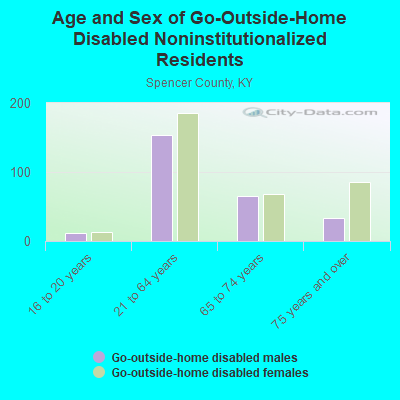
Institutionalized population: 110
Crime in 2021 (reported by the sheriff's office or county police, not the county total):
- Murders: 0
- Rapes: 2
- Robberies: 0
- Assaults: 3
- Burglaries: 13
- Thefts: 25
- Auto thefts: 8
Crime in 2020 (reported by the sheriff's office or county police, not the county total):
- Murders: 0
- Rapes: 0
- Robberies: 1
- Assaults: 2
- Burglaries: 12
- Thefts: 36
- Auto thefts: 7
Health of residents in Spencer County based on CDC Behavioral Risk Factor Surveillance System Survey Questionnaires from 2013 to 2021:
General health status score of residents in this county from 1 (poor) to 5 (excellent) is 3.2. This is significantly worse than average.66.5% of residents exercised in the past month. This is less than average.
46.5% of residents smoked 100+ cigarettes in their lives. This is about average.
43.4% of adult residents drank alcohol in the past 30 days. This is less than average.
65.5% of residents visited a dentist within the past year. This is less than average.
Average weight of males is 200 pounds. This is more than average.
Average weight of females is 170 pounds. This is more than average.
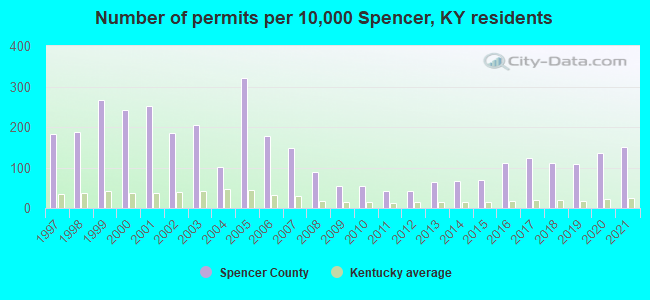
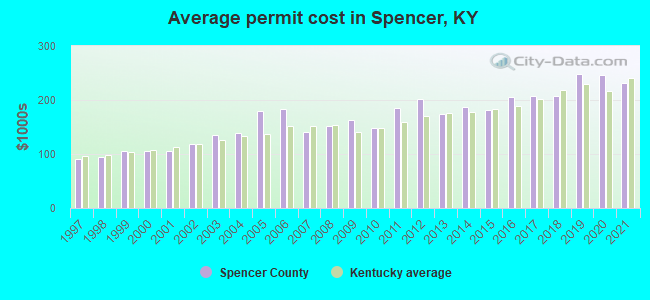
Single-family new house construction building permits:
- 2022: 83 buildings, average cost: $336,500
- 2021: 177 buildings, average cost: $230,900
- 2020: 161 buildings, average cost: $247,000
- 2019: 127 buildings, average cost: $248,800
- 2018: 132 buildings, average cost: $208,300
- 2017: 146 buildings, average cost: $207,100
- 2016: 132 buildings, average cost: $205,000
- 2015: 81 buildings, average cost: $182,100
- 2014: 79 buildings, average cost: $186,600
- 2013: 75 buildings, average cost: $175,100
- 2012: 48 buildings, average cost: $202,300
- 2011: 49 buildings, average cost: $184,500
- 2010: 65 buildings, average cost: $148,800
- 2009: 64 buildings, average cost: $162,900
- 2008: 106 buildings, average cost: $152,100
- 2007: 175 buildings, average cost: $139,800
- 2006: 210 buildings, average cost: $183,300
- 2005: 376 buildings, average cost: $180,000
- 2004: 119 buildings, average cost: $138,100
- 2003: 240 buildings, average cost: $135,300
- 2002: 217 buildings, average cost: $118,600
- 2001: 298 buildings, average cost: $106,100
- 2000: 284 buildings, average cost: $106,100
- 1999: 314 buildings, average cost: $106,100
- 1998: 221 buildings, average cost: $95,100
- 1997: 214 buildings, average cost: $89,600
Median real estate property taxes paid for housing units with mortgages in 2022: $2,267 (0.7%)
Median real estate property taxes paid for housing units with no mortgage in 2022: $1,903 (0.7%)
| Spencer County: | 8.5% |
| Kentucky: | 16.5% |
Median age of residents in 2022: 43.2 years old
(Males: 44.0 years old, Females: 42.8 years old)
(Median age for: White residents: 43.6 years old, Black residents: 62.1 years old, American Indian residents: 20.9 years old, Asian residents: 30.8 years old, Hispanic or Latino residents: 15.2 years old, Other race residents: 28.2 years old)
Area name: Louisville, KY-IN HUD Metro FMR Area
Fair market rent in 2006 for a 1-bedroom apartment in Spencer County is $473 a month.
Fair market rent for a 2-bedroom apartment is $563 a month.
Fair market rent for a 3-bedroom apartment is $785 a month.
Cities in this county include: Taylorsville.
Neighboring counties: Henderson County  , Lincoln County
  , Livingston County
  , Pawnee County, Kansas , Sullivan County, Indiana
  , Mercer County
  , Nicholas County
  .
.
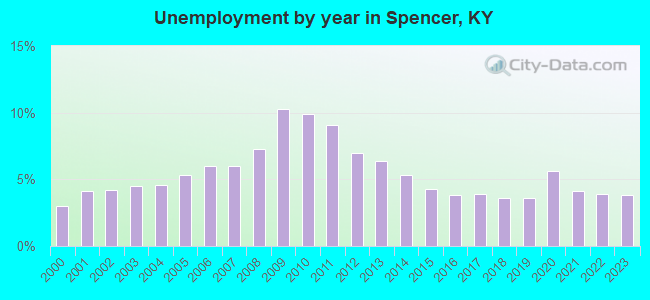
| Here: | 3.3% |
| Kentucky: | 3.8% |
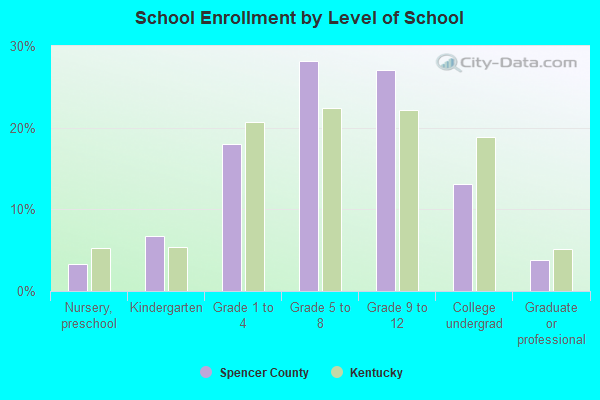
Current college students: 307
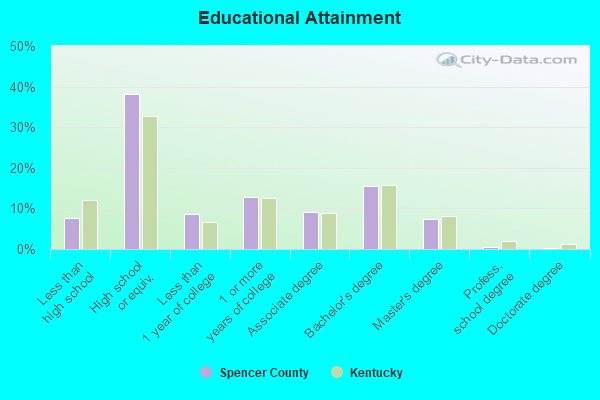
People 25 years of age or older with a high school degree or higher: 92.6%
People 25 years of age or older with a bachelor's degree or higher: 22.1%
Number of foreign born residents: 158 (57.4% naturalized citizens)
| Spencer County: | 0.8% |
| Whole state: | 4.0% |
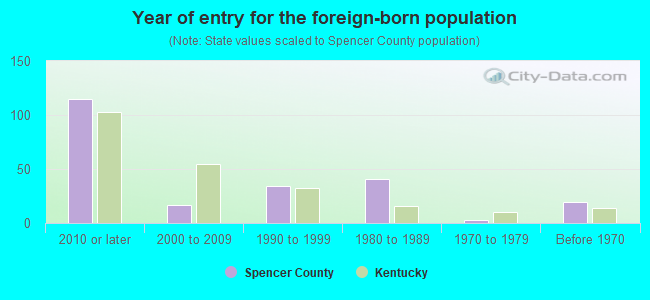
- Year of entry for the foreign-born population
- 922010 or later
- 112000 to 2009
- 301990 to 1999
- 411980 to 1989
- 31970 to 1979
- 19Before 1970
Mean travel time to work (commute): minutes
Percentage of county residents living and working in this county: 99.8%
Housing units in structures:
- One, detached: 6,637
- One, attached: 7
- Two: 23
- 3 or 4: 107
- 5 to 9: 90
- 10 to 19: 47
- 20 or more: 65
- Mobile homes: 533
Housing units in Spencer County with a mortgage: 4,499 (768 second mortgage, 45 home equity loan, 620 both second mortgage and home equity loan)
Houses without a mortgage: 302
| Here: | 1.3% with mortgage |
| State: | 96.8% with mortgage |
Religion statistics for Spencer County
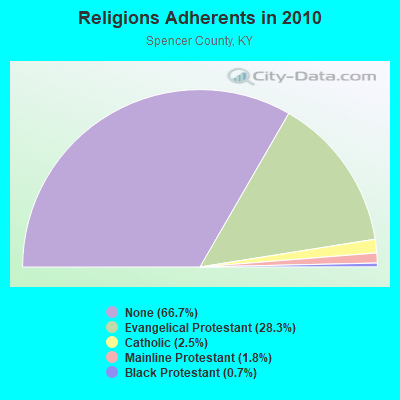
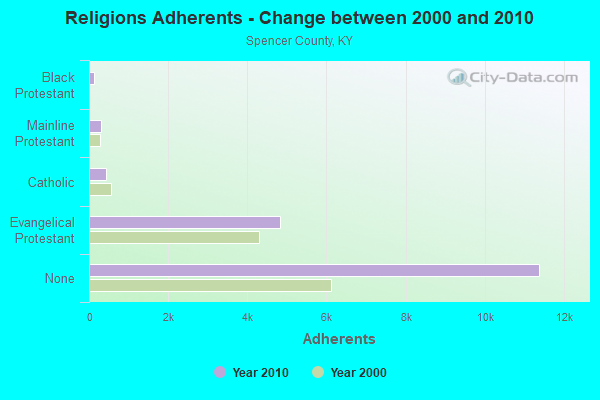
| Religion | Adherents | Congregations |
|---|---|---|
| Evangelical Protestant | 4,831 | 19 |
| Catholic | 420 | 1 |
| Mainline Protestant | 304 | 2 |
| Black Protestant | 124 | 1 |
| Other | 1 | - |
| None | 11,381 | - |
Source: Clifford Grammich, Kirk Hadaway, Richard Houseal, Dale E.Jones, Alexei Krindatch, Richie Stanley and Richard H.Taylor. 2012. 2010 U.S.Religion Census: Religious Congregations & Membership Study. Association of Statisticians of American Religious Bodies. Jones, Dale E., et al. 2002. Congregations and Membership in the United States 2000. Nashville, TN: Glenmary Research Center.
Food Environment Statistics:
| Spencer County: | 0.60 / 10,000 pop. |
| State: | 2.19 / 10,000 pop. |
| Spencer County: | 1.79 / 10,000 pop. |
| Kentucky: | 4.36 / 10,000 pop. |
| This county: | 1.79 / 10,000 pop. |
| State: | 5.74 / 10,000 pop. |
| Spencer County: | 9.8% |
| Kentucky: | 11.0% |
| Spencer County: | 30.4% |
| State: | 30.0% |
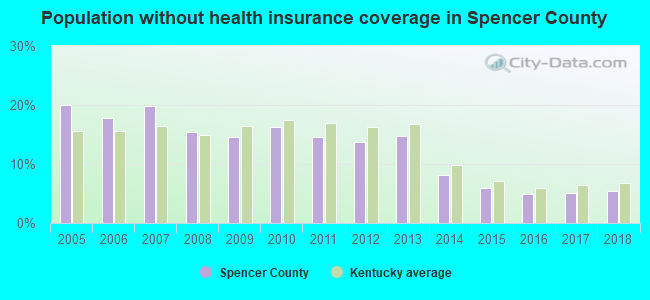
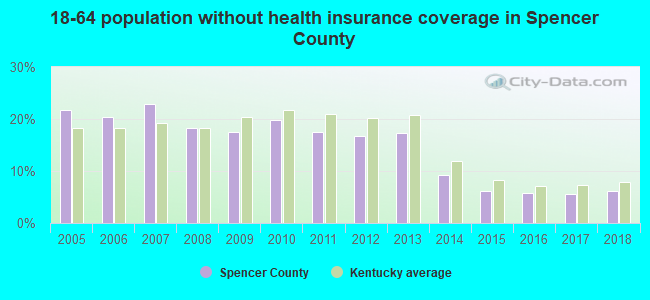
| Here: | 17.3% |
| State: | 15.9% |
Agriculture in Spencer County:
Average size of farms: 124 acresAverage value of agricultural products sold per farm: $18,268
Average value of crops sold per acre for harvested cropland: $253.44
The value of nursery, greenhouse, floriculture, and sod as a percentage of the total market value of agricultural products sold: 11.82%
The value of livestock, poultry, and their products as a percentage of the total market value of agricultural products sold: 38.76%
Average total farm production expenses per farm: $20,233
Harvested cropland as a percentage of land in farms: 35.47%
Irrigated harvested cropland as a percentage of land in farms: 2.83%
Average market value of all machinery and equipment per farm: $37,571
The percentage of farms operated by a family or individual: 87.96%
Average age of principal farm operators: 56 years
Average number of cattle and calves per 100 acres of all land in farms: 17.52
Milk cows as a percentage of all cattle and calves: 7.96%
Corn for grain: 2793 harvested acres
All wheat for grain: 755 harvested acres
Soybeans for beans: 3912 harvested acres
Vegetables: 164 harvested acres
Land in orchards: 89 acres
Earthquake activity:
Spencer County-area historical earthquake activity is significantly above Kentucky state average. It is 102% greater than the overall U.S. average.On 7/27/1980 at 18:52:21, a magnitude 5.2 (5.1 MB, 4.7 MS, 5.0 UK, 5.2 UK, Class: Moderate, Intensity: VI - VII) earthquake occurred 76.7 miles away from Spencer County center
On 4/18/2008 at 09:36:59, a magnitude 5.4 (5.1 MB, 4.8 MS, 5.4 MW, 5.2 MW) earthquake occurred 141.4 miles away from the county center
On 4/18/2008 at 09:36:59, a magnitude 5.2 (5.2 MW, Depth: 8.9 mi) earthquake occurred 141.4 miles away from the county center
On 6/10/1987 at 23:48:54, a magnitude 5.1 (4.9 MB, 4.4 MS, 4.6 MS, 5.1 LG) earthquake occurred 148.4 miles away from the county center
On 6/18/2002 at 17:37:15, a magnitude 5.0 (4.3 MB, 4.6 MW, 5.0 LG) earthquake occurred 133.2 miles away from Spencer County center
On 9/7/1988 at 02:28:09, a magnitude 4.6 (4.5 MB, 4.6 LG, Class: Light, Intensity: IV - V) earthquake occurred 79.8 miles away from the county center
Magnitude types: regional Lg-wave magnitude (LG), body-wave magnitude (MB), surface-wave magnitude (MS), moment magnitude (MW)
Most recent natural disasters:
- Kentucky Covid-19 Pandemic, Incident Period: January 20, 2020, FEMA Id: 4497, Natural disaster type: Other
- Kentucky Severe Storms, Tornadoes, Flooding, Landslides, And Mudslides, Incident Period: February 21, 2018 - March 21, 2018, FEMA Id: 4361, Natural disaster type: Storm, Tornado, Mudslide, Landslide, Flood
- Kentucky Severe Storms, Tornadoes, Straight-line Winds, Flooding, Landslides, and Mudslides, Incident Period: July 11, 2015 to July 20, 2015, Major Disaster (Presidential) Declared DR-4239: August 12, 2015, FEMA Id: 4239, Natural disaster type: Storm, Tornado, Mudslide, Landslide, Flood, Wind
- Kentucky Severe Storms, Tornadoes, Flooding, Landslides, and Mudslides, Incident Period: April 02, 2015 to April 17, 2015, Major Disaster (Presidential) Declared DR-4217: May 01, 2015, FEMA Id: 4217, Natural disaster type: Storm, Tornado, Mudslide, Landslide, Flood
- Kentucky Severe Winter Storm, Snowstorm, Flooding, Landslides, and Mudslides, Incident Period: March 03, 2015 to March 09, 2015, Major Disaster (Presidential) Declared DR-4218: May 12, 2015, FEMA Id: 4218, Natural disaster type: Snowstorm, Winter Storm, Mudslide, Landslide, Flood
- Kentucky Severe Storms, Tornadoes, and Flooding, Incident Period: April 12, 2011 to May 20, 2011, Major Disaster (Presidential) Declared DR-1976: May 04, 2011, FEMA Id: 1976, Natural disaster type: Storm, Tornado, Flood
- Kentucky Severe Winter Storm, Incident Period: January 27, 2009 to February 05, 2009, Emergency Declared EM-3302: January 28, 2009, FEMA Id: 3302, Natural disaster type: Winter Storm
- Kentucky Severe Winter Storm and Flooding, Incident Period: January 26, 2009 to February 13, 2009, Major Disaster (Presidential) Declared DR-1818: February 05, 2009, FEMA Id: 1818, Natural disaster type: Winter Storm, Flood
- Kentucky Severe Storms, Tornadoes, Flooding, Mudslides, and Landslides, Incident Period: April 03, 2008 to April 04, 2008, Major Disaster (Presidential) Declared DR-1757: May 19, 2008, FEMA Id: 1757, Natural disaster type: Storm, Tornado, Mudslide, Landslide, Flood
- Kentucky Severe Storms, Tornadoes, Straight-line Winds, and Flooding, Incident Period: February 05, 2008 to February 06, 2008, Major Disaster (Presidential) Declared DR-1746: February 21, 2008, FEMA Id: 1746, Natural disaster type: Storm, Tornado, Flood, Wind
- 9 other natural disasters have been reported since 1953.
The number of natural disasters in Spencer County (19) is greater than the US average (15).
Major Disasters (Presidential) Declared: 15
Emergencies Declared: 2
Causes of natural disasters: Floods: 11, Storms: 11, Tornadoes: 10, Mudslides: 6, Landslides: 5, Winter Storms: 4, Winds: 2, Blizzard: 1, Flash Flood: 1, Hurricane: 1, Snowstorm: 1, Other: 1 (Note: some incidents may be assigned to more than one category).
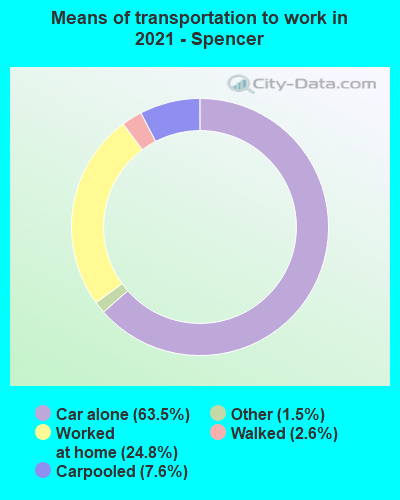
Means of transportation to work:
- Drove a car alone: 1,844 (59.0%)
- Carpooled: 176 (5.6%)
- Taxicab, motorcycle, or other means: 107 (3.4%)
- Walked: 81 (2.6%)
- Worked at home: 1,146 (36.6%)
- Health care and social assistance (25%)
- Educational services (13%)
- Retail trade (9%)
- Finance and insurance (9%)
- Manufacturing (8%)
- Other services, except public administration (5%)
- Accommodation and food services (4%)
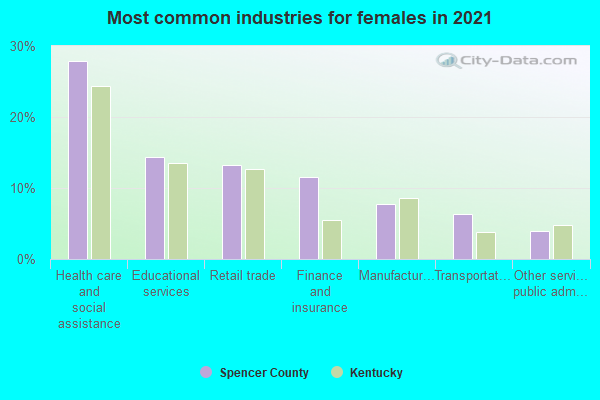
- Health care and social assistance (28%)
- Educational services (15%)
- Retail trade (11%)
- Finance and insurance (10%)
- Manufacturing (9%)
- Other services, except public administration (5%)
- Accommodation and food services (5%)
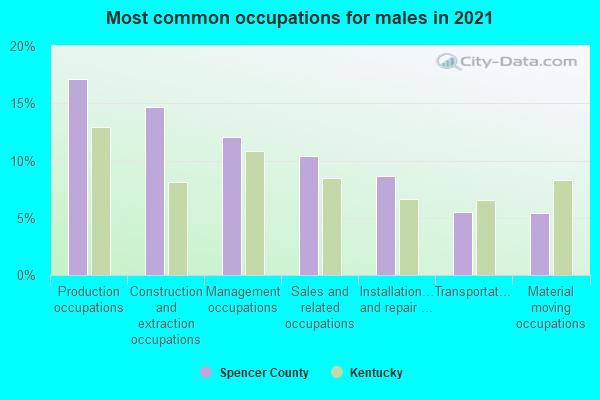
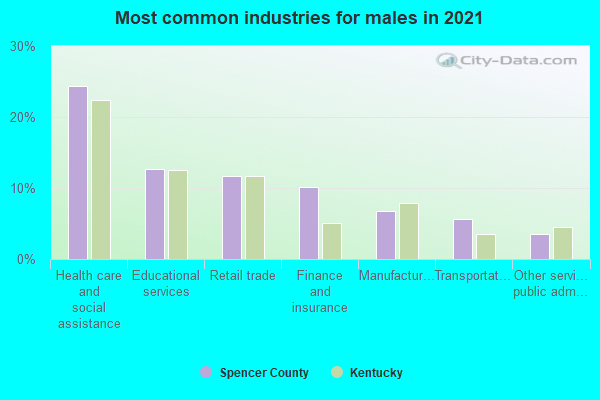
- Production occupations (15%)
- Construction and extraction occupations (14%)
- Management occupations (11%)
- Sales and related occupations (10%)
- Installation, maintenance, and repair occupations (9%)
- Transportation occupations (6%)
- Building and grounds cleaning and maintenance occupations (5%)
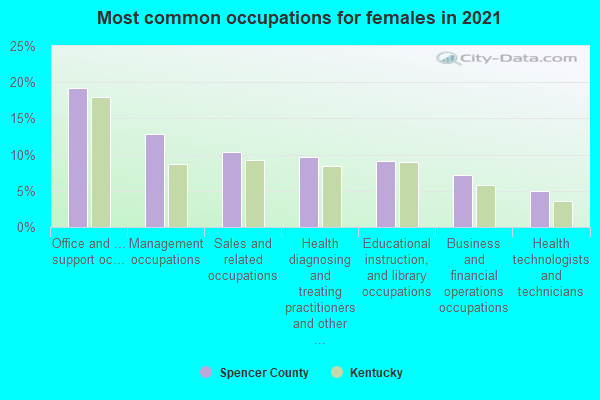
- Office and administrative support occupations (19%)
- Management occupations (13%)
- Health diagnosing and treating practitioners and other technical occupations (12%)
- Sales and related occupations (11%)
- Business and financial operations occupations (8%)
- Educational instruction, and library occupations (7%)
- Health technologists and technicians (4%)
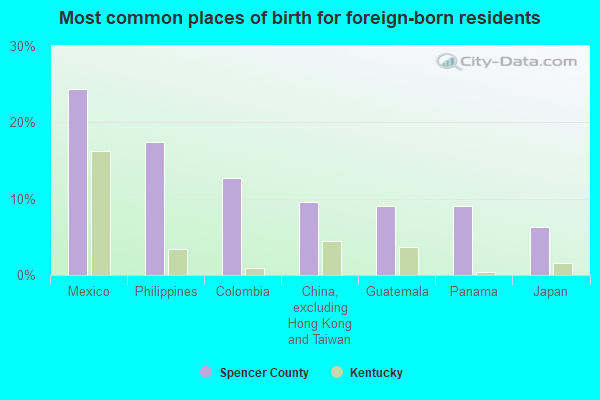
- Philippines (20%)
- China, excluding Hong Kong and Taiwan (20%)
- Brazil (18%)
- Colombia (17%)
- Panama (10%)
- Japan (9%)
- India (6%)
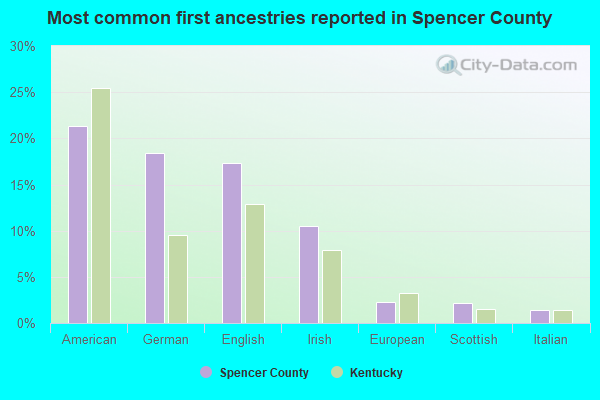
- American (22%)
- English (19%)
- German (17%)
- Irish (9%)
- Scottish (2%)
- European (2%)
- Italian (2%)
3 people in group homes intended for adults
111 people in nursing homes
8 people in other group homes
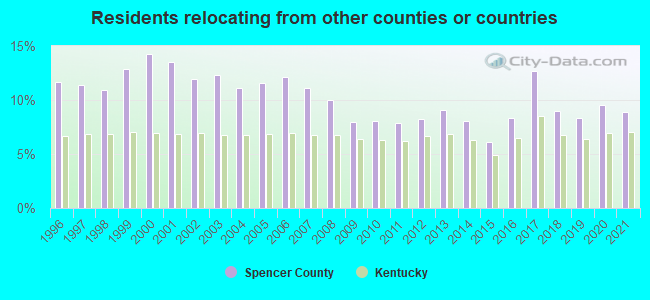
8.93% of this county's 2021 resident taxpayers lived in other counties in 2020 ($70,098 average adjusted gross income)
| Here: | 8.93% |
| Kentucky average: | 7.04% |
10 or fewer of this county's residents moved from foreign countries.
7.98% relocated from other counties in Kentucky ($60,969 average AGI)
0.96% relocated from other states ($9,130 average AGI)
Spencer County: 0.96% Kentucky average: 2.87%
Top counties from which taxpayers relocated into this county between 2020 and 2021:
| from Jefferson County, KY | |
| from Bullitt County, KY | |
| from Shelby County, KY | |
| from Nelson County, KY |
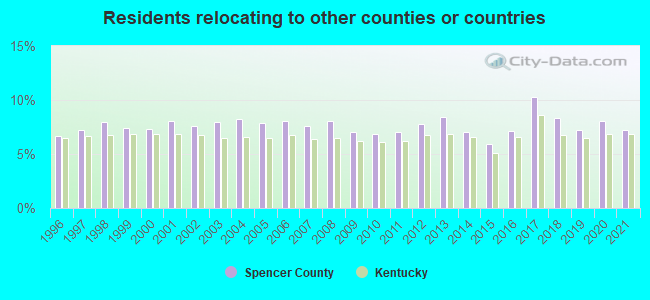
7.20% of this county's 2020 resident taxpayers moved to other counties in 2021 ($60,804 average adjusted gross income)
| Here: | 7.20% |
| Kentucky average: | 6.89% |
10 or fewer of this county's residents moved to foreign countries.
5.97% relocated to other counties in Kentucky ($47,296 average AGI)
1.23% relocated to other states ($13,508 average AGI)
Spencer County: 1.23% Kentucky average: 2.73%
Top counties to which taxpayers relocated from this county between 2020 and 2021:
| to Jefferson County, KY | |
| to Shelby County, KY | |
| to Bullitt County, KY | |
| to Nelson County, KY |
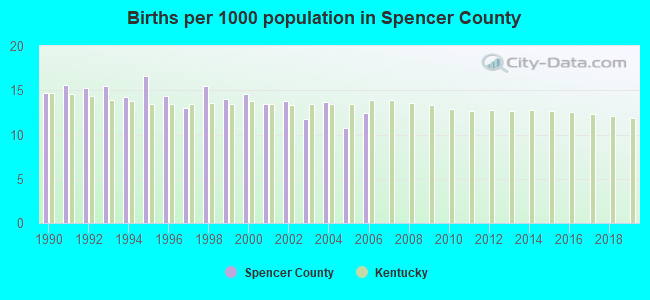
Births per 1000 population from 1990 to 1999: 14.9
Births per 1000 population from 2000 to 2006: 12.9
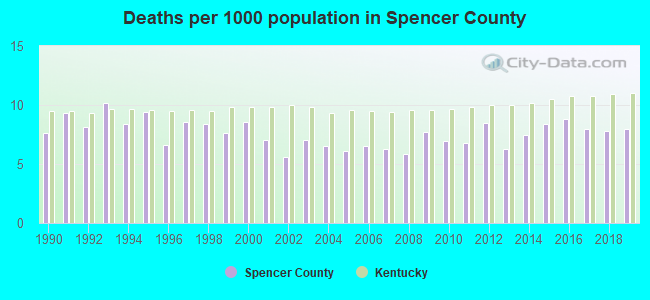
Deaths per 1000 population from 1990 to 1999: 8.4
Deaths per 1000 population from 2000 to 2009: 6.7
Deaths per 1000 population from 2010 to 2020: 7.9
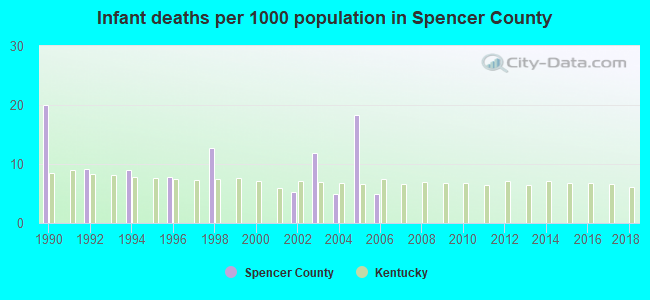
Infant deaths per 1000 live births from 1990 to 1999: 5.9
Infant deaths per 1000 live births from 2000 to 2006: 6.5
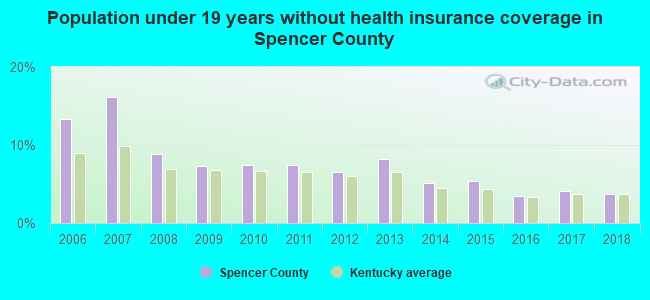
Persons under 19 years old without health insurance coverage in 2018: 3.7%
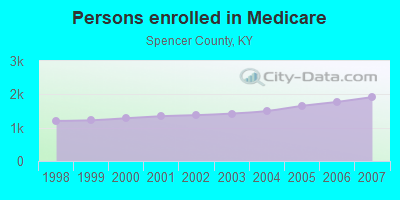
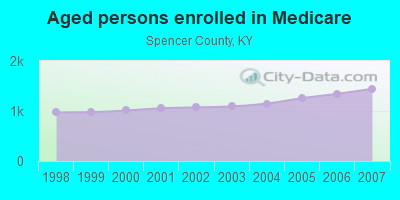
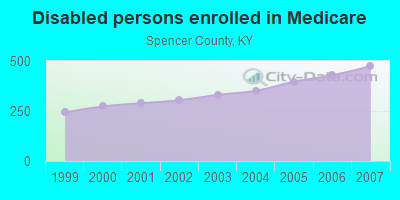
Persons enrolled in hospital insurance and/or supplemental medical insurance (Medicare) in July 1, 2007: 1,917 (1,443 aged, 474 disabled)
Children under 18 without health insurance coverage in 2007: 574 (12%)
Most common underlying causes of death in Spencer County, Kentucky in 1999 - 2019:
- Acute myocardial infarction, unspecified (80)
- Bronchus or lung, unspecified - Malignant neoplasms (79)
- Chronic obstructive pulmonary disease, unspecified (49)
- Chronic ischaemic heart disease, unspecified (23)
- Unspecified dementia (14)
- Atherosclerotic heart disease (10)
Population without health insurance coverage in 2000: 10%
Children under 18 without health insurance coverage in 2000: 6%
Medical specialist MDs per 100,000 population in 2005: 684
Total births per 100,000 population, July 2005 - July 2006 : 52
Total deaths per 100,000 population, July 2005 - July 2006: 32
Household type by relationship:
Households: 19,589- Male householders: 3,753 (602 living alone), Female householders: 3,371 (495 living alone)
4,666 spouses (4,623 opposite-sex spouses), 576 unmarried partners, (520 opposite-sex unmarried partners), 5,239 children (4,779 natural, 130 adopted, 329 stepchildren), 687 grandchildren, 65 brothers or sisters, 273 parents, 22 foster children, 261 other relatives, 537 non-relatives
- In group quarters: 102
Size of family households: 2,725 2-persons, 1,178 3-persons, 1,111 4-persons, 466 5-persons, 229 6-persons, 54 7-or-more-persons.
Size of nonfamily households: 1,097 1-person, 159 2-persons, 58 3-persons, 23 4-persons, 12 7-or-more-persons.
2,891 married couples with children.
772 single-parent households (400 men, 372 women).
98.3% of residents of Spencer speak English at home.
0.9% of residents speak Spanish at home (98% speak English very well, 2% speak English well).
0.1% of residents speak other Indo-European language at home (44% speak English very well, 56% speak English not well).
0.3% of residents speak Asian or Pacific Island language at home (66% speak English very well, 5% speak English well, 29% speak English not well).
In fiscal year 2004:
Federal Government expenditure: $41,774,000 ($2,818 per capita)
Department of Defense expenditure: $1,336,000
Federal direct payments to individuals for retirement and disability: $23,662,000
Federal other direct payments to individuals: $8,537,000
Federal direct payments not to individuals: $405,000
Federal grants: $6,787,000
Federal procurement contracts: $544,000 ($97,000 Department of Defense)
Federal salaries and wages: $1,840,000 ($143,000 Department of Defense)
Federal Government direct loans: $616,000
Federal guaranteed/insured loans: $11,375,000
Federal Government insurance: $3,460,000
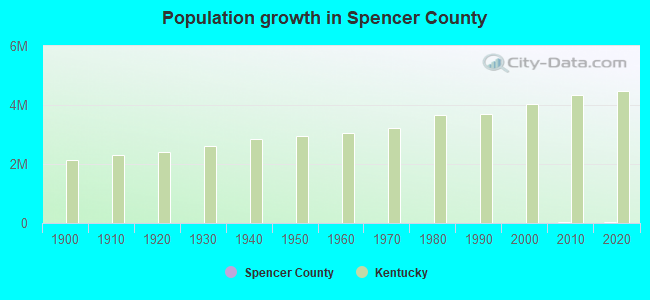
Population change from April 1, 2000 to July 1, 2005:
Births: 915| Here: | 58 per 1000 residents |
| State: | 69 per 1000 residents |
Deaths: 501
| Here: | 32 per 1000 residents |
| State: | 50 per 1000 residents |
Net international migration: +21
| Here: | +1 per 1000 residents |
| State: | +7 per 1000 residents |
Net internal migration: +3,485
| Here: | +223 per 1000 residents |
| State: | +8 per 1000 residents |
Total withdrawal of fresh water for public supply: 0.00 millions of gallons per day (all from surface)
| Here: | 6.7 |
| State: | 6.4 |
| Here: | 5.2 |
| State: | 4.4 |
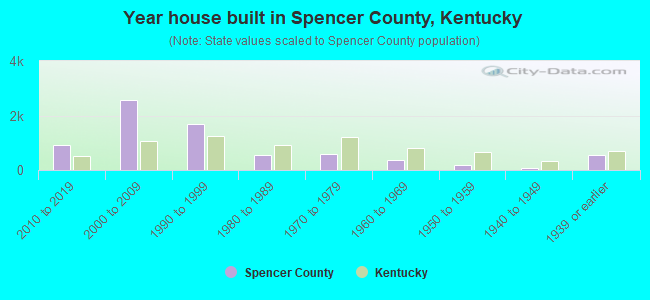
- Year house built in Spencer County, Kentucky
- 462020 or later
- 1,0552010 to 2019
- 2,4102000 to 2009
- 1,8681990 to 1999
- 6041980 to 1989
- 4871970 to 1979
- 3701960 to 1969
- 1581950 to 1959
- 501940 to 1949
- 6341939 or earlier
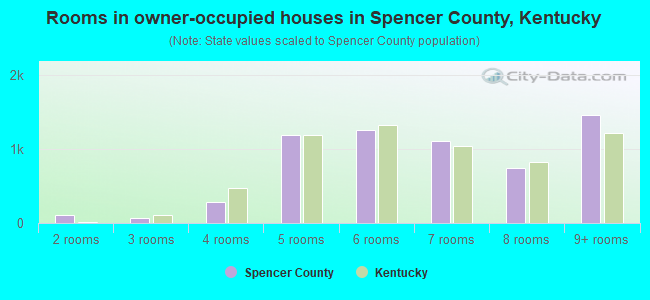
- Rooms in owner-occupied houses in Spencer County, Kentucky
- 01 room
- 1272 rooms
- 563 rooms
- 2674 rooms
- 1,1815 rooms
- 1,1766 rooms
- 1,2227 rooms
- 7298 rooms
- 1,4639+ rooms
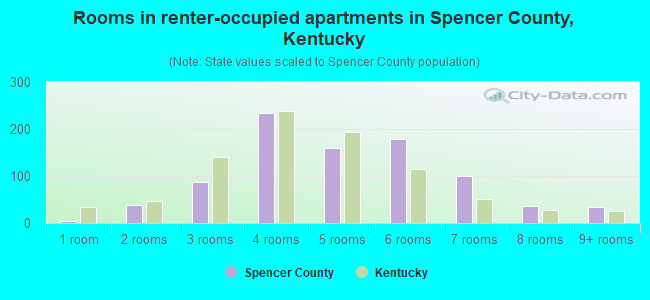
- Rooms in renter-occupied apartments in Spencer County, Kentucky
- 41 room
- 162 rooms
- 893 rooms
- 2534 rooms
- 1825 rooms
- 1786 rooms
- 1757 rooms
- 118 rooms
- 439+ rooms
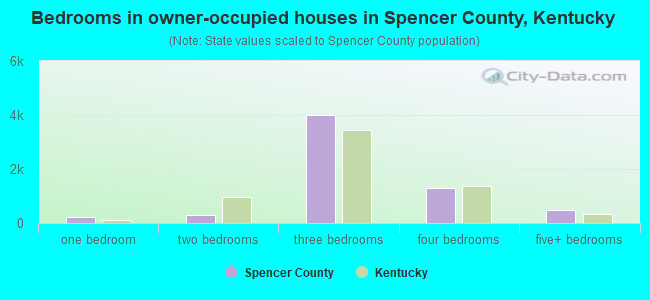
- Bedrooms in owner-occupied houses in Spencer County, Kentucky
- 0no bedroom
- 1781 bedroom
- 2502 bedrooms
- 3,9563 bedrooms
- 1,2844 bedrooms
- 5405+ bedrooms
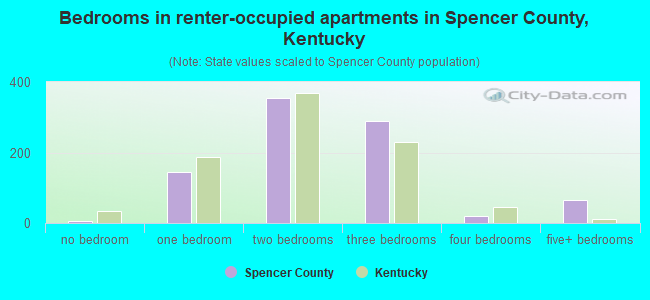
- Bedrooms in renter-occupied apartments in Spencer County, Kentucky
- 4no bedroom
- 1301 bedroom
- 3972 bedrooms
- 3123 bedrooms
- 744 bedrooms
- 355+ bedrooms
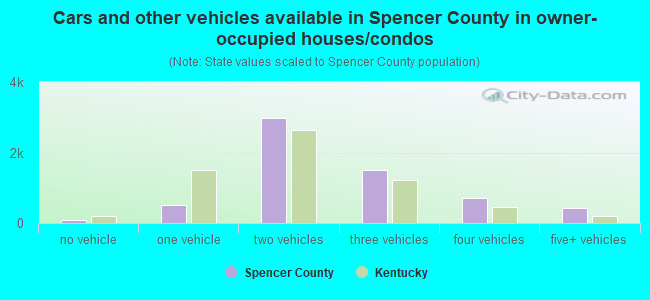
- Cars and other vehicles available in Spencer County in owner-occupied houses/condos
- 128no vehicle
- 5951 vehicle
- 2,8042 vehicles
- 1,4563 vehicles
- 7134 vehicles
- 4745+ vehicles
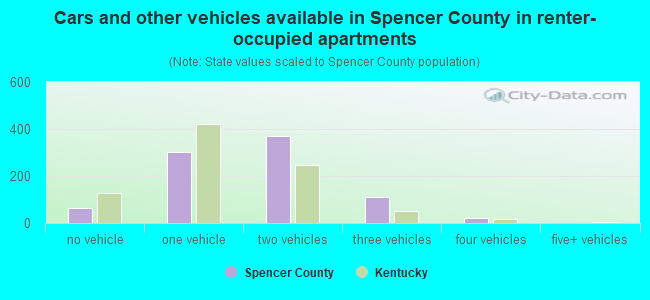
- Cars and other vehicles available in Spencer County in renter-occupied apartments
- 57no vehicle
- 3761 vehicle
- 3652 vehicles
- 1293 vehicles
- 334 vehicles
- 05+ vehicles
92.8% of Spencer County residents lived in the same house 1 years ago.
Out of people who lived in different houses, 29% lived in this county.
Out of people who lived in different counties, 64% lived in Kentucky.
| Spencer County: | 92.8% |
| State average: | 87.2% |
Place of birth for U.S.-born residents:
- This state: 15,020
- Other state: 4,328
- Northeast: 455
- Midwest: 2,120
- South: 1,368
- West: 382
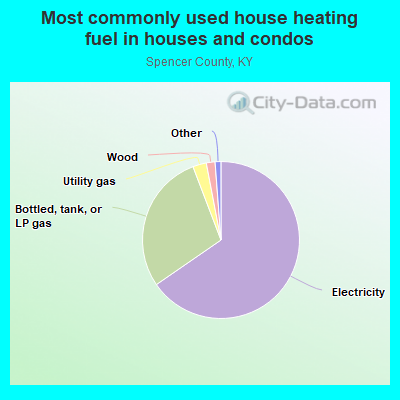
- 64.3%Electricity
- 28.7%Bottled, tank, or LP gas
- 2.3%Utility gas
- 2.0%Wood
- 1.1%Other fuel
- 1.1%Fuel oil, kerosene, etc.
- 0.5%No fuel used
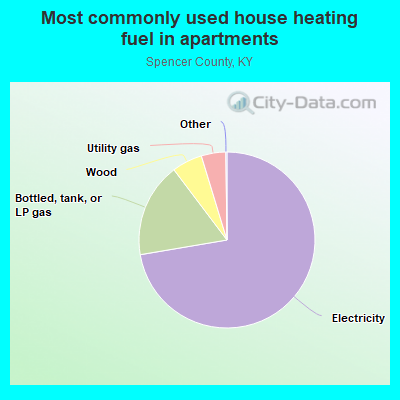
- 72.0%Electricity
- 18.5%Bottled, tank, or LP gas
- 4.9%Utility gas
- 4.5%Wood
Private vs. public school enrollment:
| Here: | 14.3% |
| Kentucky: | 17.2% |
| Here: | 10.0% |
| Kentucky: | 15.2% |
| Here: | 51.0% |
| Kentucky: | 19.6% |
Spencer County government finances - Expenditure in 2018:
- Bond Funds - Cash and Securities: $518,000
- Charges - Other: $457,000
Solid Waste Management: $37,000
Regular Highways: $2,000
- Construction - Regular Highways: $411,000
Natural Resources - Other: $59,000
- Current Operations - General - Other: $1,263,000
Regular Highways: $1,165,000
Health - Other: $1,004,000
Police Protection: $909,000
Central Staff Services: $803,000
General Public Buildings: $312,000
Financial Administration: $188,000
Parks and Recreation: $130,000
Correctional Institutions: $67,000
Judicial and Legal Services: $62,000
Solid Waste Management: $61,000
Public Welfare - Other: $29,000
Natural Resources - Other: $1,000
- Federal Intergovernmental - Health and Hospitals: $4,000
- Intergovernmental to Local - Other - Correctional Institutions: $322,000
- Local Intergovernmental - Other: $55,000
Highways: $16,000
- Miscellaneous - General Revenue - Other: $239,000
Rents: $4,000
Interest Earnings: $2,000
- Other Capital Outlay - General - Other: $166,000
Health - Other: $162,000
Solid Waste Management: $44,000
General Public Building: $20,000
Police Protection: $17,000
- Other Funds - Cash and Securities: $427,000
- State Intergovernmental - Other: $1,599,000
Highways: $1,057,000
General Local Government Support: $34,000
- Tax - Property: $1,045,000
Insurance Premiums Sales: $740,000
Individual Income: $548,000
Public Utilities Sales: $201,000
Occupation and Business License - Other: $120,000
Documentary and Stock Transfer: $112,000
Other License: $81,000
Corporation License: $25,000
Other Selective Sales: $9,000
Alcoholic Beverage License: $6,000
Other: $4,000
- Total Salaries and Wages: $2,535,000
Spencer County government finances - Revenue in 2018:
- Bond Funds - Cash and Securities: $518,000
- Charges - Other: $457,000
Solid Waste Management: $37,000
Regular Highways: $2,000
- Construction - Regular Highways: $411,000
Natural Resources - Other: $59,000
- Current Operations - General - Other: $1,263,000
Regular Highways: $1,165,000
Health - Other: $1,004,000
Police Protection: $909,000
Central Staff Services: $803,000
General Public Buildings: $312,000
Financial Administration: $188,000
Parks and Recreation: $130,000
Correctional Institutions: $67,000
Judicial and Legal Services: $62,000
Solid Waste Management: $61,000
Public Welfare - Other: $29,000
Natural Resources - Other: $1,000
- Federal Intergovernmental - Health and Hospitals: $4,000
- Intergovernmental to Local - Other - Correctional Institutions: $322,000
- Local Intergovernmental - Other: $55,000
Highways: $16,000
- Miscellaneous - General Revenue - Other: $239,000
Rents: $4,000
Interest Earnings: $2,000
- Other Capital Outlay - General - Other: $166,000
Health - Other: $162,000
Solid Waste Management: $44,000
General Public Building: $20,000
Police Protection: $17,000
- Other Funds - Cash and Securities: $427,000
- State Intergovernmental - Other: $1,599,000
Highways: $1,057,000
General Local Government Support: $34,000
- Tax - Property: $1,045,000
Insurance Premiums Sales: $740,000
Individual Income: $548,000
Public Utilities Sales: $201,000
Occupation and Business License - Other: $120,000
Documentary and Stock Transfer: $112,000
Other License: $81,000
Corporation License: $25,000
Other Selective Sales: $9,000
Alcoholic Beverage License: $6,000
Other: $4,000
- Total Salaries and Wages: $2,535,000
Spencer County government finances - Debt in 2018:
- Bond Funds - Cash and Securities: $518,000
- Charges - Other: $457,000
Solid Waste Management: $37,000
Regular Highways: $2,000
- Construction - Regular Highways: $411,000
Natural Resources - Other: $59,000
- Current Operations - General - Other: $1,263,000
Regular Highways: $1,165,000
Health - Other: $1,004,000
Police Protection: $909,000
Central Staff Services: $803,000
General Public Buildings: $312,000
Financial Administration: $188,000
Parks and Recreation: $130,000
Correctional Institutions: $67,000
Judicial and Legal Services: $62,000
Solid Waste Management: $61,000
Public Welfare - Other: $29,000
Natural Resources - Other: $1,000
- Federal Intergovernmental - Health and Hospitals: $4,000
- Intergovernmental to Local - Other - Correctional Institutions: $322,000
- Local Intergovernmental - Other: $55,000
Highways: $16,000
- Miscellaneous - General Revenue - Other: $239,000
Rents: $4,000
Interest Earnings: $2,000
- Other Capital Outlay - General - Other: $166,000
Health - Other: $162,000
Solid Waste Management: $44,000
General Public Building: $20,000
Police Protection: $17,000
- Other Funds - Cash and Securities: $427,000
- State Intergovernmental - Other: $1,599,000
Highways: $1,057,000
General Local Government Support: $34,000
- Tax - Property: $1,045,000
Insurance Premiums Sales: $740,000
Individual Income: $548,000
Public Utilities Sales: $201,000
Occupation and Business License - Other: $120,000
Documentary and Stock Transfer: $112,000
Other License: $81,000
Corporation License: $25,000
Other Selective Sales: $9,000
Alcoholic Beverage License: $6,000
Other: $4,000
- Total Salaries and Wages: $2,535,000
Spencer County government finances - Cash and Securities in 2018:
- Bond Funds - Cash and Securities: $518,000
- Charges - Other: $457,000
Solid Waste Management: $37,000
Regular Highways: $2,000
- Construction - Regular Highways: $411,000
Natural Resources - Other: $59,000
- Current Operations - General - Other: $1,263,000
Regular Highways: $1,165,000
Health - Other: $1,004,000
Police Protection: $909,000
Central Staff Services: $803,000
General Public Buildings: $312,000
Financial Administration: $188,000
Parks and Recreation: $130,000
Correctional Institutions: $67,000
Judicial and Legal Services: $62,000
Solid Waste Management: $61,000
Public Welfare - Other: $29,000
Natural Resources - Other: $1,000
- Federal Intergovernmental - Health and Hospitals: $4,000
- Intergovernmental to Local - Other - Correctional Institutions: $322,000
- Local Intergovernmental - Other: $55,000
Highways: $16,000
- Miscellaneous - General Revenue - Other: $239,000
Rents: $4,000
Interest Earnings: $2,000
- Other Capital Outlay - General - Other: $166,000
Health - Other: $162,000
Solid Waste Management: $44,000
General Public Building: $20,000
Police Protection: $17,000
- Other Funds - Cash and Securities: $427,000
- State Intergovernmental - Other: $1,599,000
Highways: $1,057,000
General Local Government Support: $34,000
- Tax - Property: $1,045,000
Insurance Premiums Sales: $740,000
Individual Income: $548,000
Public Utilities Sales: $201,000
Occupation and Business License - Other: $120,000
Documentary and Stock Transfer: $112,000
Other License: $81,000
Corporation License: $25,000
Other Selective Sales: $9,000
Alcoholic Beverage License: $6,000
Other: $4,000
- Total Salaries and Wages: $2,535,000
Supplemental Security Income (SSI) in 2006:
- Total number of recipients: 306
- Number of aged recipients: 30
- Number of blind and disabled recipients: 276
- Number of recipients under 18: 40
- Number of recipients between 18 and 64: 196
- Number of recipients older than 64: 70
- Number of recipients also receiving OASDI: 133
- Amount of payments (thousands of dollars): 115
| Most common first names in Spencer County, KY among deceased individuals | ||
| Name | Count | Lived (average) |
|---|---|---|
| William | 55 | 71.8 years |
| James | 53 | 72.5 years |
| John | 37 | 73.0 years |
| Mary | 36 | 78.3 years |
| Robert | 35 | 66.4 years |
| Charles | 31 | 69.1 years |
| Thomas | 25 | 68.0 years |
| Roy | 19 | 72.5 years |
| Margaret | 19 | 83.0 years |
| Ruby | 16 | 78.4 years |
| Most common last names in Spencer County, KY among deceased individuals | ||
| Last name | Count | Lived (average) |
|---|---|---|
| Goodlett | 33 | 69.0 years |
| Smith | 29 | 68.3 years |
| Hardin | 24 | 69.4 years |
| Chesser | 22 | 69.1 years |
| Nation | 22 | 65.0 years |
| Jewell | 22 | 72.8 years |
| Rogers | 21 | 75.4 years |
| Snider | 21 | 82.4 years |
| Mckinley | 18 | 73.0 years |
| Martin | 17 | 78.2 years |