Red River County, Texas (TX)
County owner-occupied free and clear houses and condos in 2010: 2,482
County owner-occupied houses and condos in 2000: 4,368
Renter-occupied apartments: 1,450 (it was 1,459 in 2000)
| % of renters here: | 25% |
| State: | 36% |
Land area: 1050 sq. mi.
Water area: 7.4 sq. mi.
Population density: 11 people per square mile (low).
Industries providing employment: Educational, health and social services (21.4%), Manufacturing (13.7%).
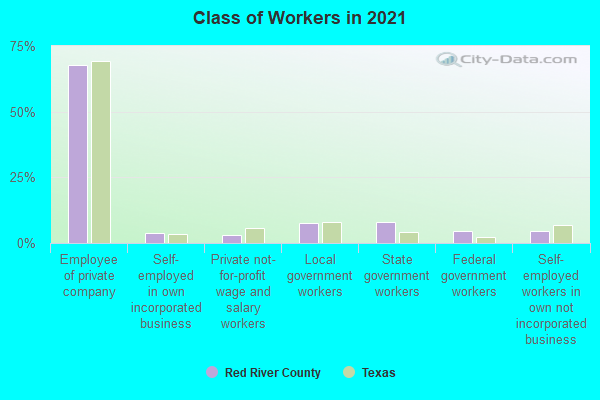
Type of workers:
- Private wage or salary: 78%
- Government: 18%
- Self-employed, not incorporated: 4%
- Unpaid family work: 0%
- OSM Map
- General Map
- Google Map
- MSN Map

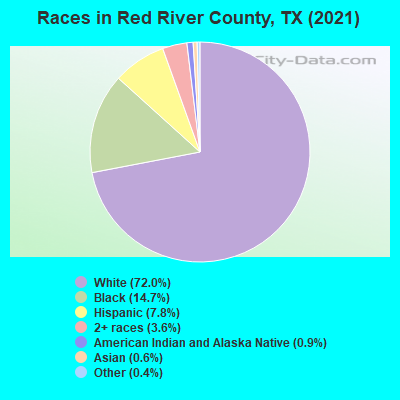
- 8,47272.2%White Non-Hispanic Alone
- 1,84715.7%Black Non-Hispanic Alone
- 9338.0%Hispanic or Latino
- 3102.6%Two or more races
- 890.8%American Indian and Alaska Native alone
- 410.3%Asian alone
- 340.3%Some other race alone
- 20.02%Native Hawaiian and Other
Pacific Islander alone
| Median resident age: | 49.5 years |
| Texas median age: | 35.6 years |
| Males: 5,809 | |
| Females: 6,130 |

 | New County Population Estimates from the Census Bureau for Jluy 1, 2016 posted this morning about 9 A. M. (13 replies) |
| red river county (6 replies) |
| I.S.O. Land in Red River County (0 replies) |
| FAVORITE town in East Texas? (73 replies) |
| best small towns in tx? (44 replies) |
| Mount pleasant texas (3 replies) |
| Red River County: | 2.0 people |
| Texas: | 3 people |
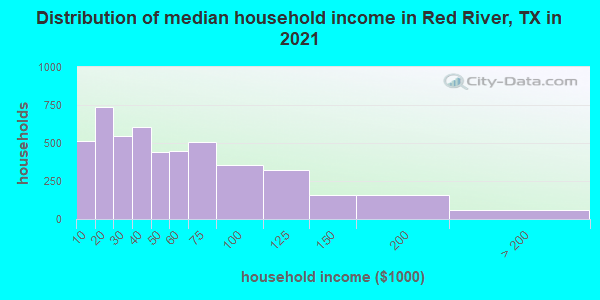
Estimated median household income in 2022: $44,124 ($27,558 in 1999)
| This county: | $44,124 |
| Texas: | $72,284 |
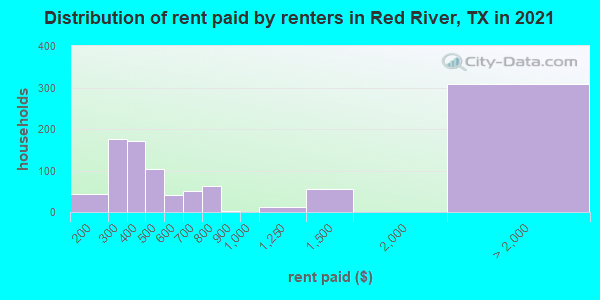
Median contract rent in 2022 for apartments: $406 (lower quartile is $303, upper quartile is $623)
| This county: | $406 |
| State: | $1117 |
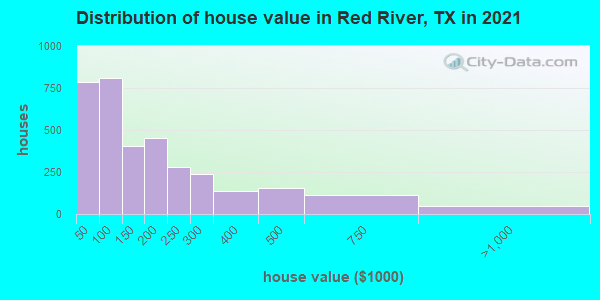
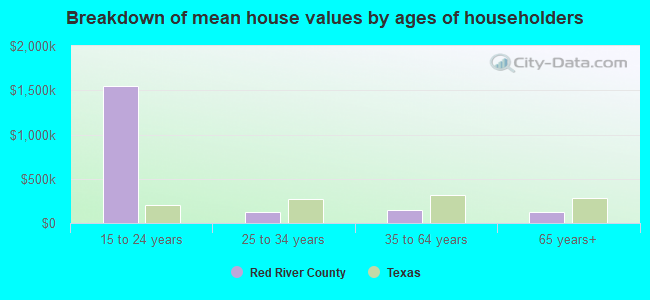
Estimated median house or condo value in 2022: $131,451 (it was $38,100 in 2000)
| Red River: | $131,451 |
| Texas: | $275,400 |
Mean price in 2022:
Median monthly housing costs for homes and condos with a mortgage: $1,137Detached houses: $155,301
Here: $155,301 State: $369,058 Mobile homes: $98,537
Here: $98,537 State: $124,413
Median monthly housing costs for units without a mortgage: $449
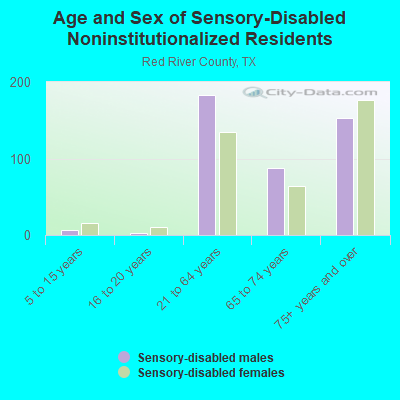
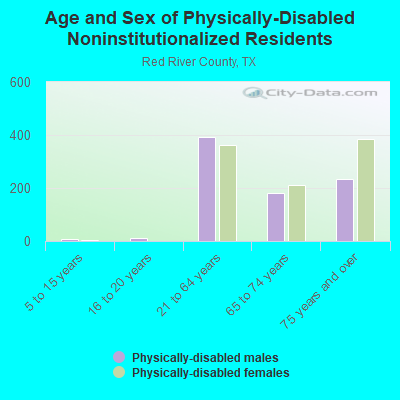
Institutionalized population: 189
Crime in 2021 (reported by the sheriff's office or county police, not the county total):
- Murders: 0
- Rapes: 5
- Robberies: 0
- Assaults: 13
- Burglaries: 22
- Thefts: 20
- Auto thefts: 7
Crime in 2020 (reported by the sheriff's office or county police, not the county total):
- Murders: 1
- Rapes: 3
- Robberies: 1
- Assaults: 25
- Burglaries: 33
- Thefts: 28
- Auto thefts: 5
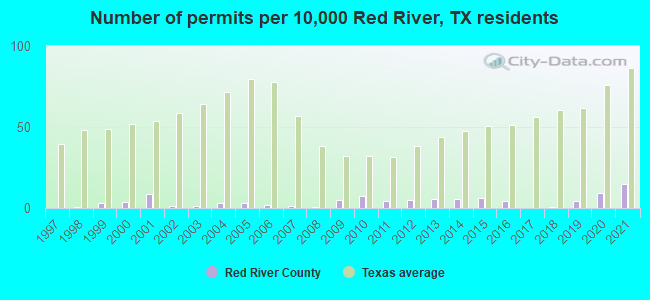
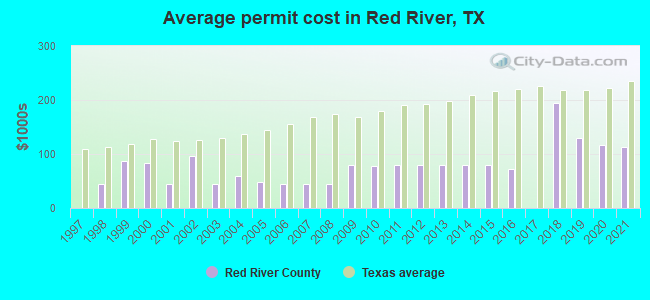
Single-family new house construction building permits:
- 2022: 13 buildings, average cost: $100,000
- 2021: 21 buildings, average cost: $112,600
- 2020: 13 buildings, average cost: $115,900
- 2019: 6 buildings, average cost: $129,500
- 2018: 1 building, cost: $195,200
- 2017: 0 buildings
- 2016: 6 buildings, average cost: $72,100
- 2015: 9 buildings, average cost: $78,600
- 2014: 8 buildings, average cost: $78,600
- 2013: 8 buildings, average cost: $78,600
- 2012: 7 buildings, average cost: $78,600
- 2011: 6 buildings, average cost: $78,600
- 2010: 11 buildings, average cost: $76,900
- 2009: 7 buildings, average cost: $78,600
- 2008: 1 building, cost: $44,800
- 2007: 2 buildings, average cost: $44,800
- 2006: 3 buildings, average cost: $44,800
- 2005: 4 buildings, average cost: $48,600
- 2004: 4 buildings, average cost: $59,900
- 2003: 2 buildings, average cost: $44,800
- 2002: 2 buildings, average cost: $96,800
- 2001: 12 buildings, average cost: $44,000
- 2000: 5 buildings, average cost: $83,800
- 1999: 4 buildings, average cost: $87,300
- 1998: 1 building, cost: $44,400
- 1997: 0 buildings
Median real estate property taxes paid for housing units with mortgages in 2022: $1,902 (1.0%)
Median real estate property taxes paid for housing units with no mortgage in 2022: $1,094 (1.0%)
| Red River County: | 20.3% |
| Texas: | 14.0% |
Median age of residents in 2022: 49.5 years old
(Males: 48.1 years old, Females: 50.6 years old)
(Median age for: White residents: 49.4 years old, Black residents: 51.8 years old, American Indian residents: 3.9 years old, Asian residents: 38.5 years old, Hispanic or Latino residents: 37.0 years old, Other race residents: 14.5 years old)
Fair market rent in 2006 for a 1-bedroom apartment in Red River County is $416 a month.
Fair market rent for a 2-bedroom apartment is $502 a month.
Fair market rent for a 3-bedroom apartment is $615 a month.
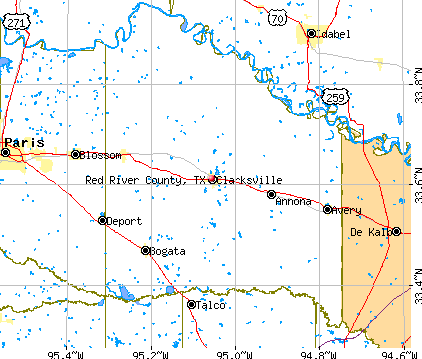
Cities in this county include: Clarksville, Bogata, Manchester, Detroit, Avery, Annona.
Neighboring counties: Yuma County, Arizona  , Lincoln County, New Mexico , Howard County, Arkansas
  , Ventura County, California , Hockley County , Putnam County, Georgia
  .
.
| Here: | 4.0% |
| Texas: | 3.5% |
Current college students: 306
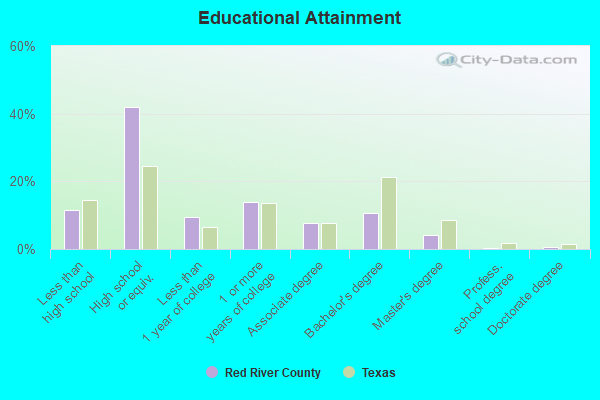
People 25 years of age or older with a high school degree or higher: 85.1%
People 25 years of age or older with a bachelor's degree or higher: 14.0%
Number of foreign born residents: 416 (33.1% naturalized citizens)
| Red River County: | 3.5% |
| Whole state: | 17.2% |
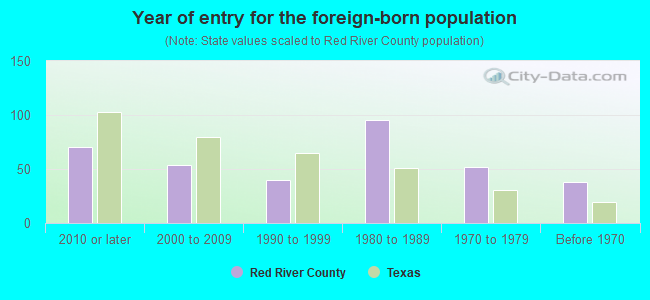
- Year of entry for the foreign-born population
- 1282010 or later
- 852000 to 2009
- 491990 to 1999
- 951980 to 1989
- 521970 to 1979
- 38Before 1970
Mean travel time to work (commute): minutes
Percentage of county residents living and working in this county: 96.0%
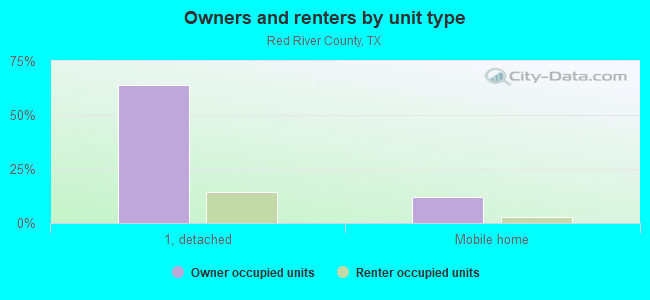
Housing units in structures:
- One, detached: 4,912
- One, attached: 57
- Two: 107
- 3 or 4: 141
- 5 to 9: 19
- 10 to 19: 59
- 20 to 49: 119
- 50 or more: 31
- Mobile homes: 935
Housing units in Red River County with a mortgage: 1,109 (3 second mortgage, 0 home equity loan, 4 both second mortgage and home equity loan)
Houses without a mortgage: 0
| Here: | 100.0% with mortgage |
| State: | 98.4% with mortgage |
Religion statistics for Red River County
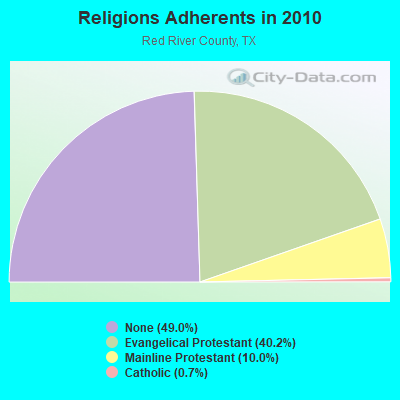
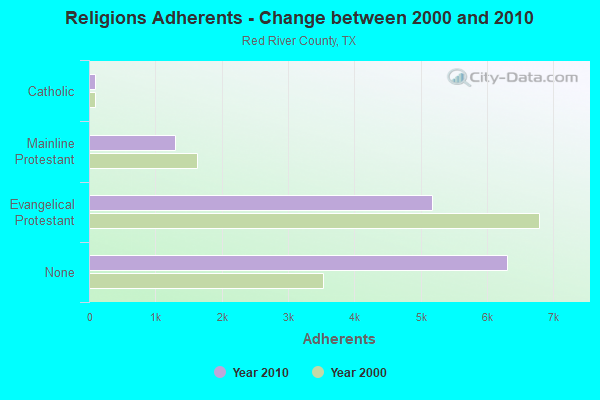
| Religion | Adherents | Congregations |
|---|---|---|
| Evangelical Protestant | 5,169 | 40 |
| Mainline Protestant | 1,291 | 17 |
| Catholic | 92 | 1 |
| Other | 1 | 1 |
| None | 6,307 | - |
Source: Clifford Grammich, Kirk Hadaway, Richard Houseal, Dale E.Jones, Alexei Krindatch, Richie Stanley and Richard H.Taylor. 2012. 2010 U.S.Religion Census: Religious Congregations & Membership Study. Association of Statisticians of American Religious Bodies. Jones, Dale E., et al. 2002. Congregations and Membership in the United States 2000. Nashville, TN: Glenmary Research Center.
Food Environment Statistics:
| Red River County: | 3.82 / 10,000 pop. |
| State: | 1.47 / 10,000 pop. |
| This county: | 1.53 / 10,000 pop. |
| Texas: | 1.11 / 10,000 pop. |
| Red River County: | 6.88 / 10,000 pop. |
| Texas: | 3.95 / 10,000 pop. |
| This county: | 6.88 / 10,000 pop. |
| State: | 6.13 / 10,000 pop. |
| Red River County: | 12.0% |
| Texas: | 8.9% |
| Red River County: | 27.3% |
| State: | 26.6% |
| Here: | 15.0% |
| State: | 15.7% |
Agriculture in Red River County:
Average size of farms: 347 acresAverage value of agricultural products sold per farm: $25,352
Average value of crops sold per acre for harvested cropland: $72.24
The value of livestock, poultry, and their products as a percentage of the total market value of agricultural products sold: 85.94%
Average total farm production expenses per farm: $30,068
Harvested cropland as a percentage of land in farms: 14.21%
Average market value of all machinery and equipment per farm: $26,116
The percentage of farms operated by a family or individual: 94.17%
Average age of principal farm operators: 56 years
Average number of cattle and calves per 100 acres of all land in farms: 18.53
Milk cows as a percentage of all cattle and calves: 0.78%
Corn for grain: 5901 harvested acres
All wheat for grain: 2328 harvested acres
Soybeans for beans: 4403 harvested acres
Vegetables: 75 harvested acres
Land in orchards: 711 acres
Tornado activity:
Red River County historical area-adjusted tornado activity is significantly below Texas state average. It is 26185725.4 times below overall U.S. average.Tornadoes in this county have caused one injury recorded between 1950 and 2004.
On 4/30/1954, a category 3 (max. wind speeds 158-206 mph) tornado injured one person and caused between $5000 and $50,000 in damages.
Earthquake activity:
Red River County-area historical earthquake activity is significantly above Texas state average. It is 513% greater than the overall U.S. average.On 11/6/2011 at 03:53:10, a magnitude 5.7 (5.7 MW, Depth: 3.2 mi, Class: Moderate, Intensity: VI - VII) earthquake occurred 164.6 miles away from Red River County center
On 9/3/2016 at 12:02:44, a magnitude 5.8 (5.8 MW, Depth: 3.5 mi) earthquake occurred 221.6 miles away from the county center
On 5/17/2012 at 08:12:00, a magnitude 4.8 (4.8 MW, Depth: 3.1 mi, Class: Light, Intensity: IV - V) earthquake occurred 123.3 miles away from the county center
On 11/7/2016 at 01:44:24, a magnitude 5.0 (5.0 MW, Depth: 2.8 mi) earthquake occurred 192.1 miles away from the county center
On 11/8/2011 at 02:46:57, a magnitude 4.8 (4.8 MW, Depth: 3.1 mi) earthquake occurred 165.3 miles away from Red River County center
On 11/5/2011 at 07:12:45, a magnitude 4.8 (4.8 MW, Depth: 1.9 mi) earthquake occurred 165.6 miles away from the county center
Magnitude types: moment magnitude (MW)
Most recent natural disasters:
- Texas Covid-19 Pandemic, Incident Period: January 20, 2020, FEMA Id: 4485, Natural disaster type: Other
- Texas Severe Winter Storms, Tornadoes, Straight-line Winds, and Flooding, Incident Period: December 26, 2016 to January 21, 2016, Major Disaster (Presidential) Declared DR-4255: February 09, 2016, FEMA Id: 4255, Natural disaster type: Winter Storm, Tornado, Flood, Wind
- Texas Severe Storms, Tornadoes, and Flooding, Incident Period: March 07, 2016 to March 29, 2016, Major Disaster (Presidential) Declared DR-4266: March 19, 2016, FEMA Id: 4266, Natural disaster type: Storm, Tornado, Flood
- Texas Severe Storms, Tornadoes, Straight-line Winds, and Flooding, Incident Period: May 04, 2015 to June 23, 2015, Major Disaster (Presidential) Declared DR-4223: May 29, 2015, FEMA Id: 4223, Natural disaster type: Storm, Tornado, Flood, Wind
- Texas Wildfires, Incident Period: March 14, 2008 to September 01, 2008, Emergency Declared EM-3284: March 14, 2008, FEMA Id: 3284, Natural disaster type: Fire
- Texas Hurricane Rita, Incident Period: September 23, 2005 to October 14, 2005, Major Disaster (Presidential) Declared DR-1606: September 24, 2005, FEMA Id: 1606, Natural disaster type: Hurricane
- Texas Hurricane Rita, Incident Period: September 20, 2005 to October 14, 2005, Emergency Declared EM-3261: September 21, 2005, FEMA Id: 3261, Natural disaster type: Hurricane
- Texas Hurricane Katrina, Incident Period: August 29, 2005 to October 01, 2005, Emergency Declared EM-3216: September 02, 2005, FEMA Id: 3216, Natural disaster type: Hurricane
- Texas Severe Winter Storm, Incident Period: December 12, 2000 to January 15, 2001, Major Disaster (Presidential) Declared DR-1356: January 08, 2001, FEMA Id: 1356, Natural disaster type: Winter Storm
- Texas Extreme Fire Hazards, Incident Period: August 01, 1999 to December 10, 1999, Emergency Declared EM-3142: September 01, 1999, FEMA Id: 3142, Natural disaster type: Fire
- 6 other natural disasters have been reported since 1953.
The number of natural disasters in Red River County (16) is near the US average (15).
Major Disasters (Presidential) Declared: 11
Emergencies Declared: 4
Causes of natural disasters: Floods: 8, Storms: 7, Tornadoes: 6, Hurricanes: 3, Fires: 2, Winds: 2, Winter Storms: 2, Heavy Rain: 1, Other: 1 (Note: some incidents may be assigned to more than one category).
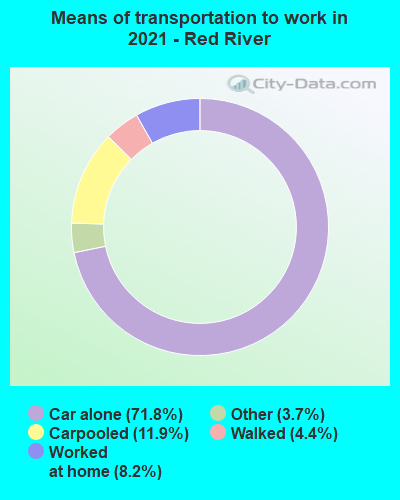
Means of transportation to work:
- Drove a car alone: 1,746 (65.1%)
- Carpooled: 387 (14.4%)
- Bus: 7 (0.3%)
- Taxicab, motorcycle, or other means: 55 (2.0%)
- Walked: 97 (3.6%)
- Worked at home: 415 (15.5%)
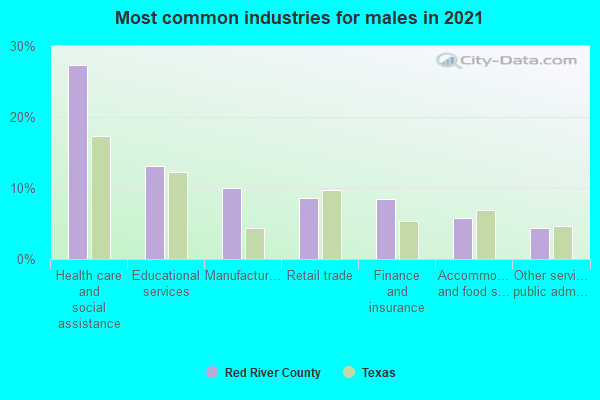
- Health care and social assistance (21%)
- Educational services (11%)
- Retail trade (10%)
- Finance and insurance (9%)
- Manufacturing (8%)
- Professional, scientific, and technical services (5%)
- Accommodation and food services (5%)

- Health care and social assistance (25%)
- Educational services (13%)
- Retail trade (11%)
- Finance and insurance (11%)
- Manufacturing (10%)
- Professional, scientific, and technical services (6%)
- Accommodation and food services (5%)
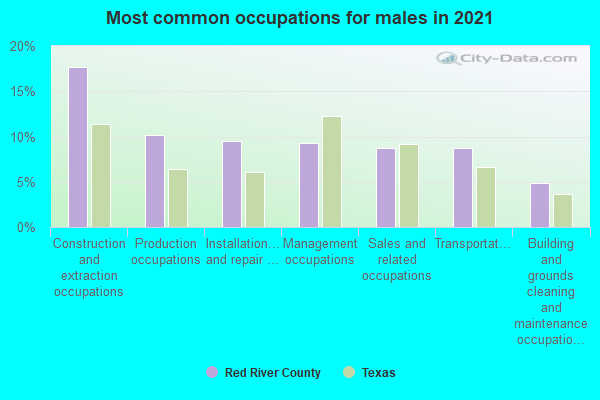
- Construction and extraction occupations (17%)
- Production occupations (13%)
- Installation, maintenance, and repair occupations (11%)
- Transportation occupations (11%)
- Sales and related occupations (10%)
- Management occupations (9%)
- Building and grounds cleaning and maintenance occupations (5%)
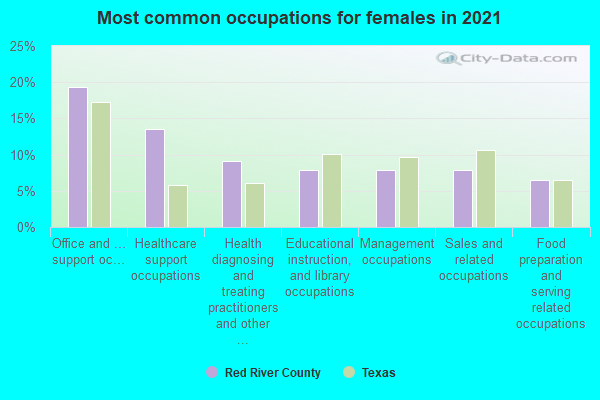
- Office and administrative support occupations (19%)
- Healthcare support occupations (12%)
- Management occupations (11%)
- Health diagnosing and treating practitioners and other technical occupations (8%)
- Sales and related occupations (8%)
- Educational instruction, and library occupations (7%)
- Food preparation and serving related occupations (7%)
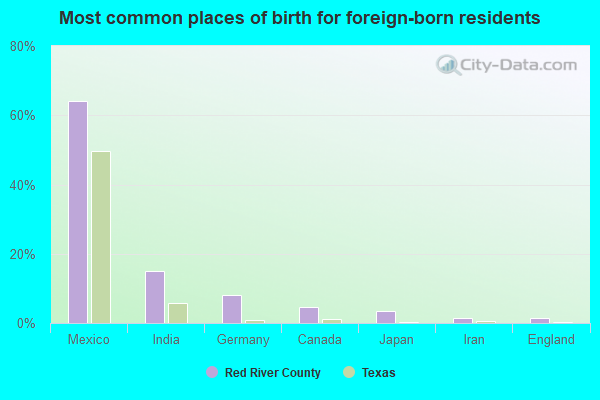
- Mexico (53%)
- Peru (19%)
- India (7%)
- Germany (6%)
- Canada (3%)
- Iran (2%)
- Japan (1%)
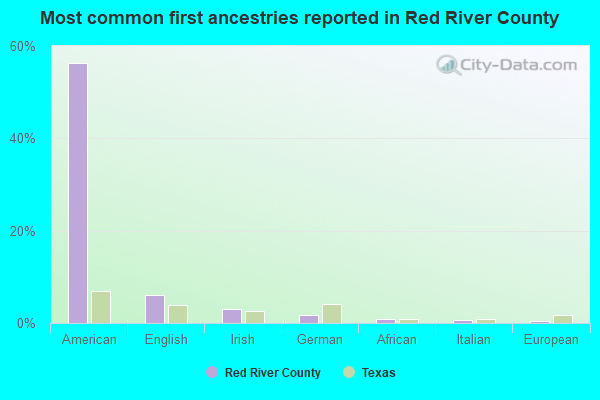
- American (51%)
- English (7%)
- German (3%)
- Irish (3%)
- European (1%)
- African (1%)
- Italian (1%)
28 people in local jails and other municipal confinement facilities
236 people in nursing homes
37 people in local jails and other confinement facilities (including police lockups)
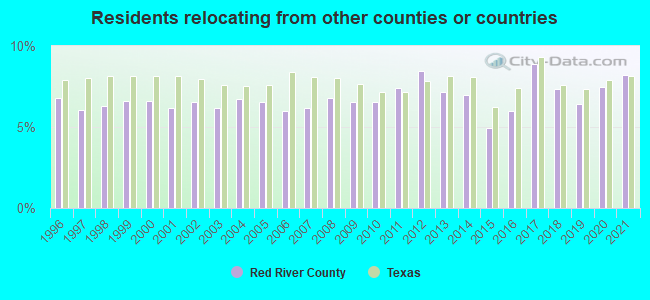
8.21% of this county's 2021 resident taxpayers lived in other counties in 2020 ($43,508 average adjusted gross income)
| Here: | 8.21% |
| Texas average: | 8.12% |
10 or fewer of this county's residents moved from foreign countries.
6.63% relocated from other counties in Texas ($35,791 average AGI)
1.58% relocated from other states ($7,720 average AGI)
Red River County: 1.58% Texas average: 2.83%
Top counties from which taxpayers relocated into this county between 2020 and 2021:
| from Lamar County, TX | |
| from Bowie County, TX |
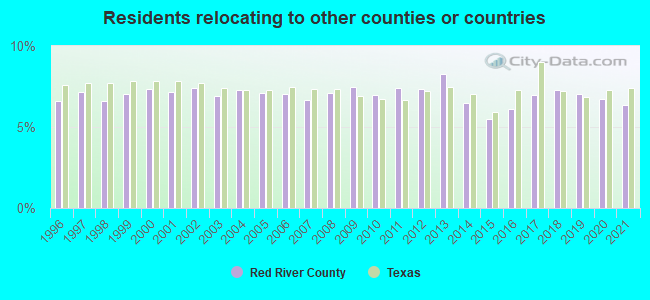
6.35% of this county's 2020 resident taxpayers moved to other counties in 2021 ($50,416 average adjusted gross income)
| Here: | 6.35% |
| Texas average: | 7.40% |
10 or fewer of this county's residents moved to foreign countries.
5.37% relocated to other counties in Texas ($46,455 average AGI)
0.98% relocated to other states ($3,961 average AGI)
Red River County: 0.98% Texas average: 2.08%
Top counties to which taxpayers relocated from this county between 2020 and 2021:
| to Lamar County, TX | |
| to Bowie County, TX |
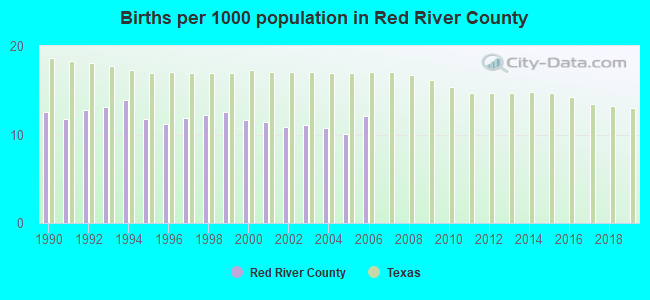
Births per 1000 population from 1990 to 1999: 12.4
Births per 1000 population from 2000 to 2006: 11.1
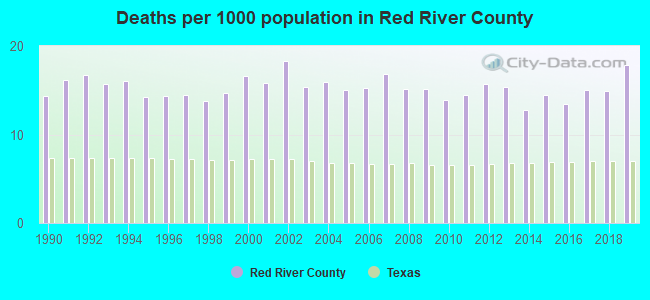
Deaths per 1000 population from 1990 to 1999: 15.1
Deaths per 1000 population from 2000 to 2009: 15.9
Deaths per 1000 population from 2010 to 2020: 15.4
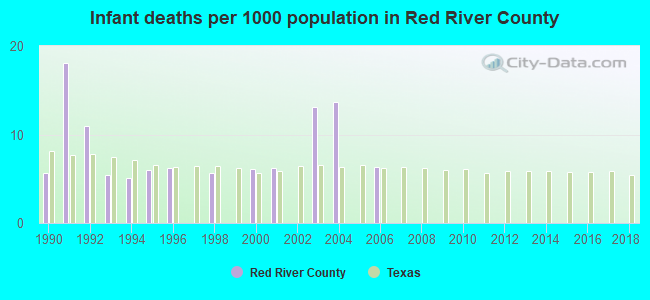
Infant deaths per 1000 live births from 1990 to 1999: 6.3
Infant deaths per 1000 live births from 2000 to 2006: 6.5
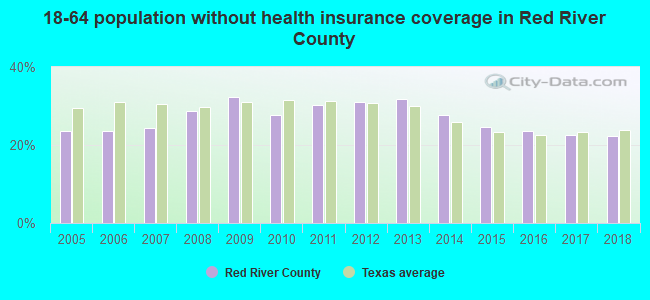
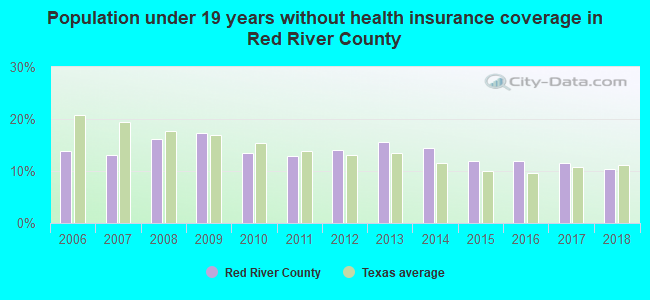
Persons under 19 years old without health insurance coverage in 2018: 10.3%
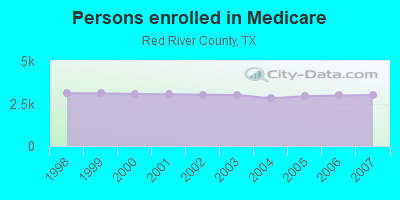
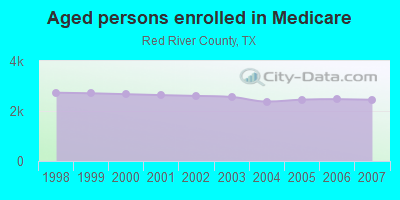
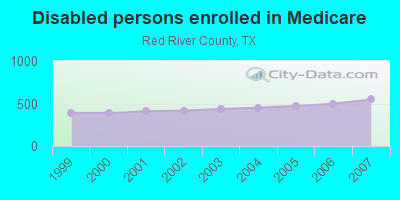
Persons enrolled in hospital insurance and/or supplemental medical insurance (Medicare) in July 1, 2007: 2,999 (2,450 aged, 549 disabled)
Children under 18 without health insurance coverage in 2007: 335 (12%)
Most common underlying causes of death in Red River County, Texas in 1999 - 2019:
- Acute myocardial infarction, unspecified (641)
- Atherosclerotic heart disease (361)
- Bronchus or lung, unspecified - Malignant neoplasms (254)
- Chronic obstructive pulmonary disease, unspecified (127)
- Stroke, not specified as haemorrhage or infarction (81)
- Congestive heart failure (21)
- Pneumonia, unspecified (12)
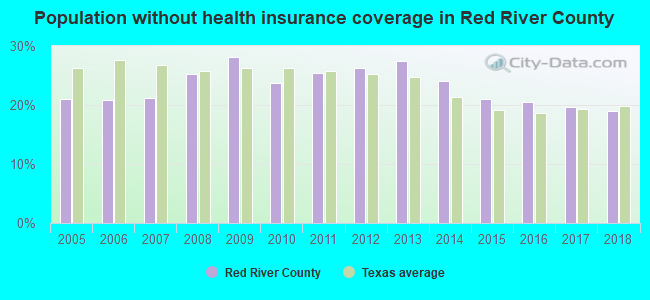
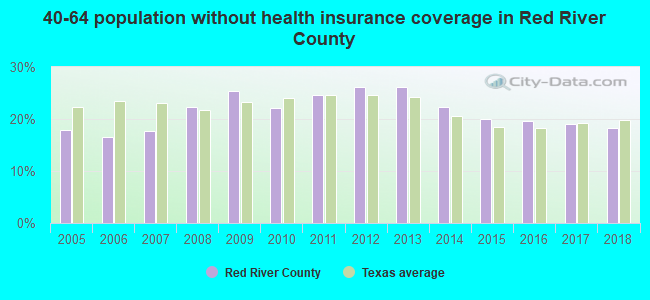
Population without health insurance coverage in 2000: 22%
Children under 18 without health insurance coverage in 2000: 20%
Short term general hospital admissions per 100,000 population in 2004: 13,853
Short term general hospital beds per 100,000 population in 2004: 264
Emergency room visits per 100,000 population in 2004: 48,110
General practice office based MDs per 100,000 population in 2005: 1,068
Medical specialist MDs per 100,000 population in 2005: 1,761
Dentists per 100,000 population in 1998: 29
Total births per 100,000 population, July 2005 - July 2006 : 29
Total deaths per 100,000 population, July 2005 - July 2006: 52
Limited-service eating places per 100,000 population in 2005 : 7
Crimes per 100,000 population in 1996: 1
Household type by relationship:
Households: 11,939- Male householders: 2,484 (727 living alone), Female householders: 2,442 (861 living alone)
2,632 spouses (2,629 opposite-sex spouses), 76 unmarried partners, (76 opposite-sex unmarried partners), 2,752 children (2,462 natural, 94 adopted, 197 stepchildren), 857 grandchildren, 116 brothers or sisters, 103 parents, 4 foster children, 132 other relatives, 193 non-relatives
- In group quarters: 190
Size of family households: 1,855 2-persons, 519 3-persons, 462 4-persons, 304 5-persons, 93 6-persons, 9 7-or-more-persons.
Size of nonfamily households: 1,589 1-person, 104 2-persons, 4 4-persons.
1,378 married couples with children.
345 single-parent households (16 men, 329 women).
95.4% of residents of Red River speak English at home.
4.0% of residents speak Spanish at home (40% speak English very well, 20% speak English well, 17% speak English not well, 23% don't speak English at all).
0.8% of residents speak other Indo-European language at home (80% speak English very well, 20% speak English well).
0.1% of residents speak Asian or Pacific Island language at home (100% speak English very well).
In fiscal year 2004:
Federal Government expenditure: $123,722,000 ($9,064 per capita)
Department of Defense expenditure: $1,370,000
Federal direct payments to individuals for retirement and disability: $41,137,000
Federal other direct payments to individuals: $28,009,000
Federal direct payments not to individuals: $3,269,000
Federal grants: $47,877,000
Federal procurement contracts: $736,000 ($23,000 Department of Defense)
Federal salaries and wages: $2,694,000 ($0,000 Department of Defense)
Federal Government direct loans: $257,000
Federal guaranteed/insured loans: $2,079,000
Federal Government insurance: $2,376,000
Population change from April 1, 2000 to July 1, 2005:
Births: 830| Here: | 61 per 1000 residents |
| State: | 85 per 1000 residents |
Deaths: 1,178
| Here: | 87 per 1000 residents |
| State: | 35 per 1000 residents |
Net international migration: +51
| Here: | +4 per 1000 residents |
| State: | +29 per 1000 residents |
Net internal migration: -429
| Here: | |
| State: |
Total withdrawal of fresh water for public supply: 1.93 millions of gallons per day (51% from ground, 49% from surface)
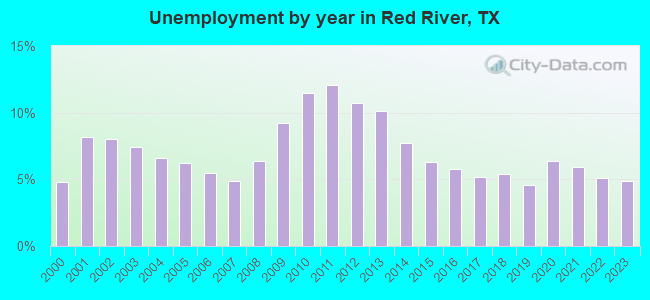
| Here: | 5.7 |
| State: | 6.3 |
| Here: | 4.9 |
| State: | 4.0 |
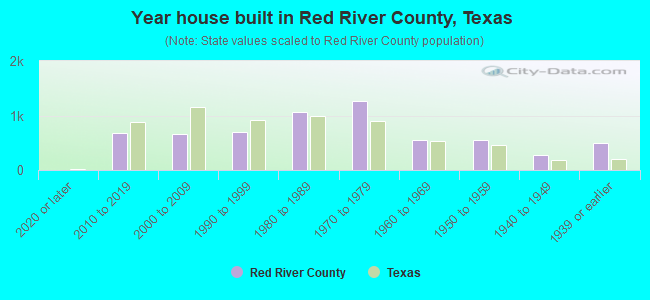
- Year house built in Red River County, Texas
- 162020 or later
- 6892010 to 2019
- 6662000 to 2009
- 6971990 to 1999
- 1,0041980 to 1989
- 1,2471970 to 1979
- 5751960 to 1969
- 4991950 to 1959
- 2171940 to 1949
- 5371939 or earlier
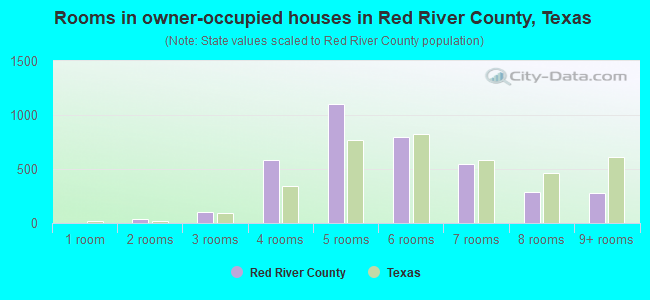
- Rooms in owner-occupied houses in Red River County, Texas
- 01 room
- 482 rooms
- 1273 rooms
- 6104 rooms
- 9465 rooms
- 8506 rooms
- 4657 rooms
- 3518 rooms
- 3119+ rooms
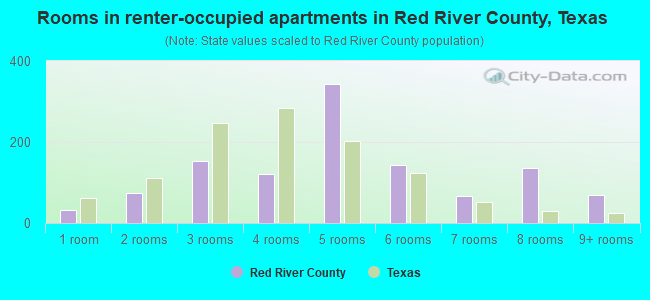
- Rooms in renter-occupied apartments in Red River County, Texas
- 711 room
- 432 rooms
- 1533 rooms
- 1924 rooms
- 3245 rooms
- 1936 rooms
- 807 rooms
- 1038 rooms
- 649+ rooms
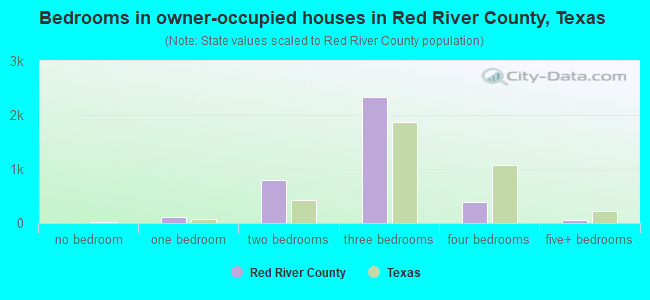
- Bedrooms in owner-occupied houses in Red River County, Texas
- 3no bedroom
- 1361 bedroom
- 7732 bedrooms
- 2,3003 bedrooms
- 3994 bedrooms
- 645+ bedrooms
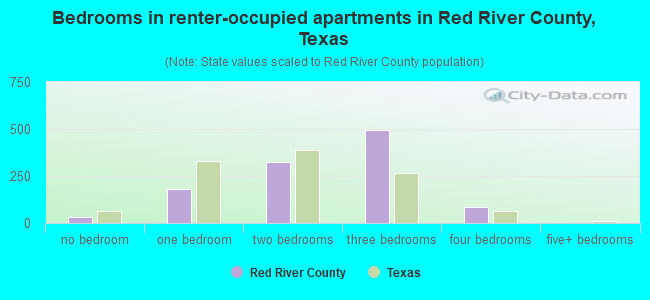
- Bedrooms in renter-occupied apartments in Red River County, Texas
- 71no bedroom
- 1521 bedroom
- 3622 bedrooms
- 5293 bedrooms
- 1094 bedrooms
- 05+ bedrooms
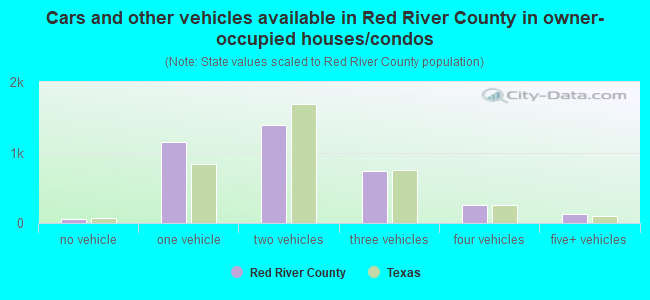
- Cars and other vehicles available in Red River County in owner-occupied houses/condos
- 74no vehicle
- 1,0681 vehicle
- 1,4072 vehicles
- 7503 vehicles
- 2484 vehicles
- 1595+ vehicles
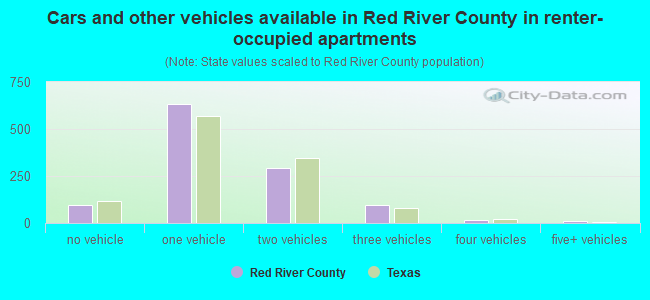
- Cars and other vehicles available in Red River County in renter-occupied apartments
- 100no vehicle
- 6291 vehicle
- 4282 vehicles
- 553 vehicles
- 74 vehicles
- 105+ vehicles
90.9% of Red River County residents lived in the same house 1 years ago.
Out of people who lived in different houses, 26% lived in this county.
Out of people who lived in different counties, 86% lived in Texas.
| Red River County: | 90.9% |
| State average: | 85.7% |
Place of birth for U.S.-born residents:
- This state: 8,992
- Other state: 2,378
- Northeast: 83
- Midwest: 488
- South: 1,088
- West: 721
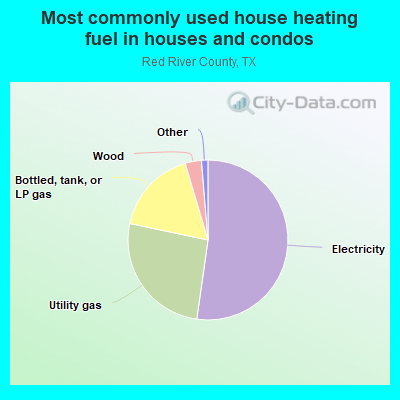
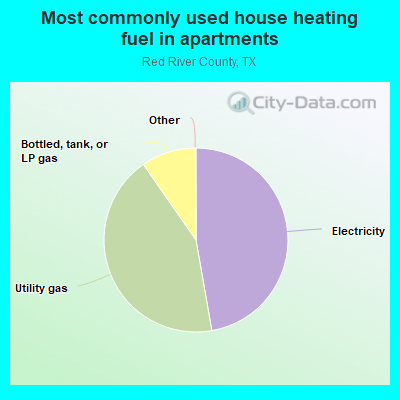
- 56.2%Electricity
- 23.2%Utility gas
- 16.1%Bottled, tank, or LP gas
- 3.3%Wood
- 0.7%Other fuel
- 0.4%Fuel oil, kerosene, etc.
- 0.1%No fuel used
- 53.1%Electricity
- 37.3%Utility gas
- 9.6%Bottled, tank, or LP gas
Private vs. public school enrollment:
| Here: | 2.4% |
| Texas: | 8.8% |
| Here: | 4.0% |
| Texas: | 8.0% |
| Here: | 9.5% |
| Texas: | 16.2% |
Red River County government finances - Expenditure in 2017:
- Charges - Other: $325,000
- Construction - Regular Highways: $215,000
- Current Operations - Regular Highways: $1,364,000
Correctional Institutions: $776,000
General Public Buildings: $647,000
Police Protection: $578,000
Central Staff Services: $529,000
Judicial and Legal Services: $487,000
Financial Administration: $388,000
Public Welfare, Vendor Payments for Medical Care: $266,000
Housing and Community Development: $192,000
Corrections - Other: $177,000
Natural Resources - Other: $125,000
Parks and Recreation: $97,000
Health - Other: $8,000
- General - Interest on Debt: $8,000
- Intergovernmental to Local - Other - General - Other: $8,000
- Long Term Debt - Beginning Outstanding - Unspecified Public Purpose: $229,000
Outstanding Unspecified Public Purpose: $184,000
Retired Unspecified Public Purpose: $45,000
- Miscellaneous - General Revenue - Other: $842,000
Fines and Forfeits: $152,000
Interest Earnings: $20,000
- Other Capital Outlay - General - Other: $52,000
Health - Other: $6,000
- Other Funds - Cash and Securities: $4,464,000
- Sinking Funds - Cash and Securities: $99,000
- State Intergovernmental - Highways: $671,000
Other: $308,000
Housing and Community Development: $192,000
Public Welfare: $27,000
- Tax - Property: $3,338,000
Motor Vehicle License: $489,000
General Sales and Gross Receipts: $353,000
Red River County government finances - Revenue in 2017:
- Charges - Other: $325,000
- Construction - Regular Highways: $215,000
- Current Operations - Regular Highways: $1,364,000
Correctional Institutions: $776,000
General Public Buildings: $647,000
Police Protection: $578,000
Central Staff Services: $529,000
Judicial and Legal Services: $487,000
Financial Administration: $388,000
Public Welfare, Vendor Payments for Medical Care: $266,000
Housing and Community Development: $192,000
Corrections - Other: $177,000
Natural Resources - Other: $125,000
Parks and Recreation: $97,000
Health - Other: $8,000
- General - Interest on Debt: $8,000
- Intergovernmental to Local - Other - General - Other: $8,000
- Long Term Debt - Beginning Outstanding - Unspecified Public Purpose: $229,000
Outstanding Unspecified Public Purpose: $184,000
Retired Unspecified Public Purpose: $45,000
- Miscellaneous - General Revenue - Other: $842,000
Fines and Forfeits: $152,000
Interest Earnings: $20,000
- Other Capital Outlay - General - Other: $52,000
Health - Other: $6,000
- Other Funds - Cash and Securities: $4,464,000
- Sinking Funds - Cash and Securities: $99,000
- State Intergovernmental - Highways: $671,000
Other: $308,000
Housing and Community Development: $192,000
Public Welfare: $27,000
- Tax - Property: $3,338,000
Motor Vehicle License: $489,000
General Sales and Gross Receipts: $353,000
Red River County government finances - Debt in 2017:
- Charges - Other: $325,000
- Construction - Regular Highways: $215,000
- Current Operations - Regular Highways: $1,364,000
Correctional Institutions: $776,000
General Public Buildings: $647,000
Police Protection: $578,000
Central Staff Services: $529,000
Judicial and Legal Services: $487,000
Financial Administration: $388,000
Public Welfare, Vendor Payments for Medical Care: $266,000
Housing and Community Development: $192,000
Corrections - Other: $177,000
Natural Resources - Other: $125,000
Parks and Recreation: $97,000
Health - Other: $8,000
- General - Interest on Debt: $8,000
- Intergovernmental to Local - Other - General - Other: $8,000
- Long Term Debt - Beginning Outstanding - Unspecified Public Purpose: $229,000
Outstanding Unspecified Public Purpose: $184,000
Retired Unspecified Public Purpose: $45,000
- Miscellaneous - General Revenue - Other: $842,000
Fines and Forfeits: $152,000
Interest Earnings: $20,000
- Other Capital Outlay - General - Other: $52,000
Health - Other: $6,000
- Other Funds - Cash and Securities: $4,464,000
- Sinking Funds - Cash and Securities: $99,000
- State Intergovernmental - Highways: $671,000
Other: $308,000
Housing and Community Development: $192,000
Public Welfare: $27,000
- Tax - Property: $3,338,000
Motor Vehicle License: $489,000
General Sales and Gross Receipts: $353,000
Red River County government finances - Cash and Securities in 2017:
- Charges - Other: $325,000
- Construction - Regular Highways: $215,000
- Current Operations - Regular Highways: $1,364,000
Correctional Institutions: $776,000
General Public Buildings: $647,000
Police Protection: $578,000
Central Staff Services: $529,000
Judicial and Legal Services: $487,000
Financial Administration: $388,000
Public Welfare, Vendor Payments for Medical Care: $266,000
Housing and Community Development: $192,000
Corrections - Other: $177,000
Natural Resources - Other: $125,000
Parks and Recreation: $97,000
Health - Other: $8,000
- General - Interest on Debt: $8,000
- Intergovernmental to Local - Other - General - Other: $8,000
- Long Term Debt - Beginning Outstanding - Unspecified Public Purpose: $229,000
Outstanding Unspecified Public Purpose: $184,000
Retired Unspecified Public Purpose: $45,000
- Miscellaneous - General Revenue - Other: $842,000
Fines and Forfeits: $152,000
Interest Earnings: $20,000
- Other Capital Outlay - General - Other: $52,000
Health - Other: $6,000
- Other Funds - Cash and Securities: $4,464,000
- Sinking Funds - Cash and Securities: $99,000
- State Intergovernmental - Highways: $671,000
Other: $308,000
Housing and Community Development: $192,000
Public Welfare: $27,000
- Tax - Property: $3,338,000
Motor Vehicle License: $489,000
General Sales and Gross Receipts: $353,000
Supplemental Security Income (SSI) in 2006:
- Total number of recipients: 538
- Number of aged recipients: 109
- Number of blind and disabled recipients: 429
- Number of recipients under 18: 58
- Number of recipients between 18 and 64: 282
- Number of recipients older than 64: 198
- Number of recipients also receiving OASDI: 279
- Amount of payments (thousands of dollars): 189
| Most common first names in Red River County, TX among deceased individuals | ||
| Name | Count | Lived (average) |
|---|---|---|
| William | 193 | 76.4 years |
| James | 191 | 74.1 years |
| John | 165 | 75.7 years |
| Mary | 140 | 81.9 years |
| Robert | 96 | 74.8 years |
| George | 88 | 78.3 years |
| Willie | 75 | 80.3 years |
| Charles | 71 | 72.9 years |
| Joe | 53 | 76.6 years |
| Ruby | 51 | 78.9 years |
| Most common last names in Red River County, TX among deceased individuals | ||
| Last name | Count | Lived (average) |
|---|---|---|
| Smith | 153 | 76.6 years |
| Williams | 90 | 73.1 years |
| Jones | 70 | 77.6 years |
| Johnson | 64 | 77.8 years |
| Jackson | 57 | 76.5 years |
| Davis | 52 | 75.9 years |
| Moore | 49 | 76.4 years |
| Peek | 48 | 79.6 years |
| Ward | 41 | 74.2 years |
| Lewis | 41 | 75.2 years |
| Businesses in Red River County, TX | ||||
| Name | Count | Name | Count | |
|---|---|---|---|---|
| Chevrolet | 1 | RadioShack | 1 | |
| FedEx | 1 | SONIC Drive-In | 1 | |
| H&R Block | 1 | Subway | 1 | |
| McDonald's | 1 | U-Haul | 2 | |
| Pizza Hut | 1 | |||
Red River County on our top lists:
- #57 on the list of "Top 101 counties with the highest number of deaths per 1000 residents 2007-2013"