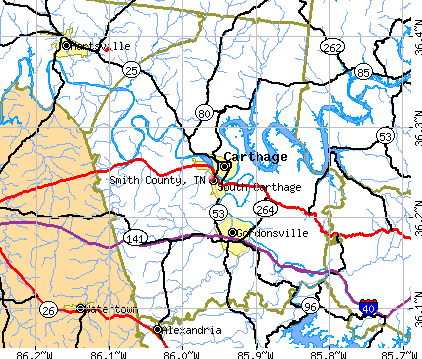
Smith County, Tennessee (TN)
County owner-occupied free and clear houses and condos in 2010: 2,298
County owner-occupied houses and condos in 2000: 5,420
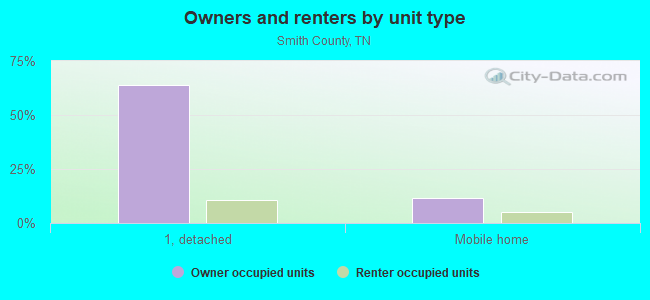
Renter-occupied apartments: 1,743 (it was 1,458 in 2000)
| % of renters here: | 21% |
| State: | 32% |
Land area: 314 sq. mi.
Water area: 10.9 sq. mi.
Population density: 65 people per square mile (average).
Industries providing employment: Manufacturing (17.9%), Educational, health and social services (17.8%), Retail trade (13.9%), Construction (10.3%).
Type of workers:
- Private wage or salary: 78%
- Government: 14%
- Self-employed, not incorporated: 8%
- Unpaid family work: 0%
- OSM Map
- General Map
- Google Map
- MSN Map

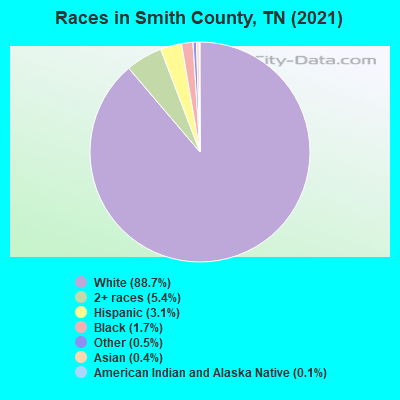
- 18,29689.2%White Non-Hispanic Alone
- 1,0245.0%Two or more races
- 6853.3%Hispanic or Latino
- 3281.6%Black Non-Hispanic Alone
- 930.5%Asian alone
- 660.3%Some other race alone
- 120.06%American Indian and Alaska Native alone
| Median resident age: | 40.8 years |
| Tennessee median age: | 39.2 years |
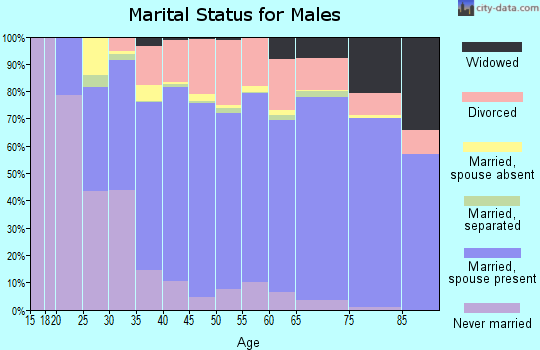
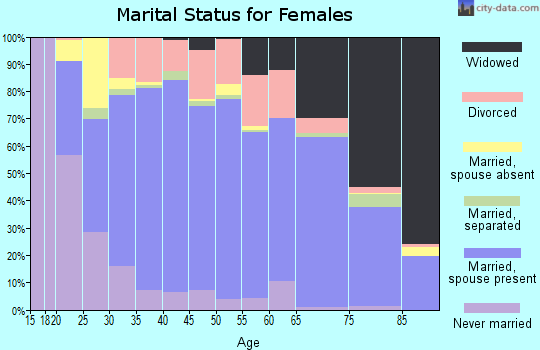
| Males: 10,346 | |
| Females: 10,057 |

 | Restaurants in the Cookeville Area (1029 replies) |
| Wish You Were Here (24 replies) |
| COVID-19 in Tennessee (237 replies) |
| Back to the drawing board: which would you choose? (18 replies) |
| Interstates 75 and 40 Through TN (25 replies) |
| Interracial couple looking for new home (7 replies) |
| Smith County: | 2.0 people |
| Tennessee: | 2 people |
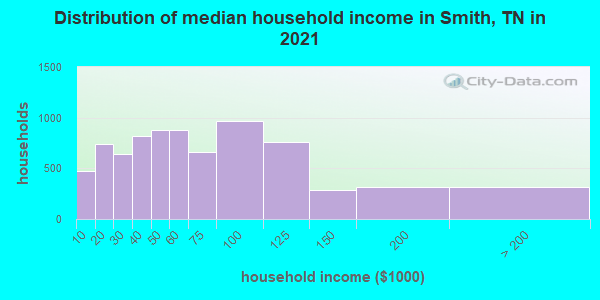
Estimated median household income in 2022: $58,774 ($35,625 in 1999)
| This county: | $58,774 |
| Tennessee: | $65,254 |
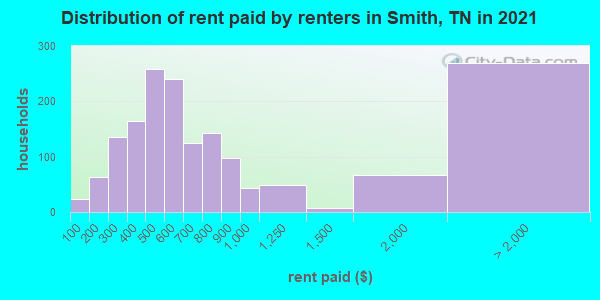
Median contract rent in 2022 for apartments: $613 (lower quartile is $476, upper quartile is $856)
| This county: | $613 |
| State: | $884 |
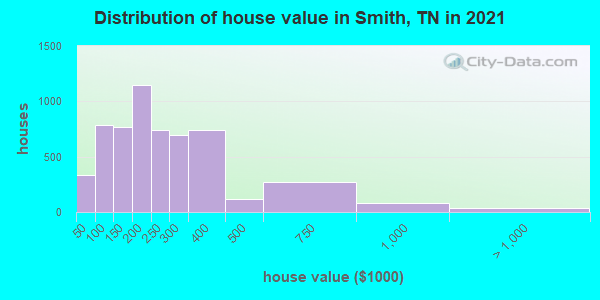
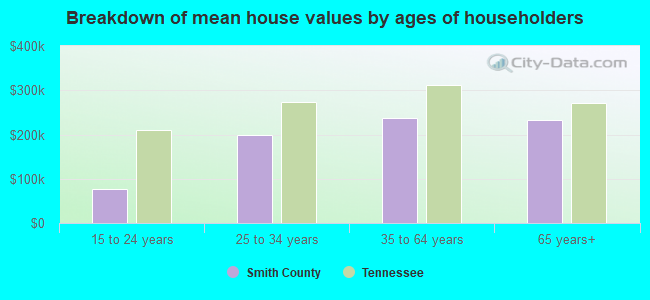
Estimated median house or condo value in 2022: $246,025 (it was $86,800 in 2000)
| Smith: | $246,025 |
| Tennessee: | $284,800 |
Median monthly housing costs for homes and condos with a mortgage: $1,242
Median monthly housing costs for units without a mortgage: $430
Institutionalized population: 156
Crime in 2021 (reported by the sheriff's office or county police, not the county total):
- Murders: 0
- Rapes: 4
- Robberies: 0
- Assaults: 17
- Burglaries: 30
- Thefts: 67
- Auto thefts: 10
Crime in 2020 (reported by the sheriff's office or county police, not the county total):
- Murders: 1
- Rapes: 0
- Robberies: 0
- Assaults: 37
- Burglaries: 27
- Thefts: 77
- Auto thefts: 16
Health of residents in Smith County based on CDC Behavioral Risk Factor Surveillance System Survey Questionnaires from 2013 to 2021:
General health status score of residents in this county from 1 (poor) to 5 (excellent) is 3.5. This is about average.69.9% of residents exercised in the past month. This is less than average.
42.1% of residents smoked 100+ cigarettes in their lives. This is about average.
48.0% of adult residents drank alcohol in the past 30 days. This is less than average.
65.5% of residents visited a dentist within the past year. This is less than average.
Average weight of males is 202 pounds. This is more than average.
Average weight of females is 168 pounds. This is more than average.
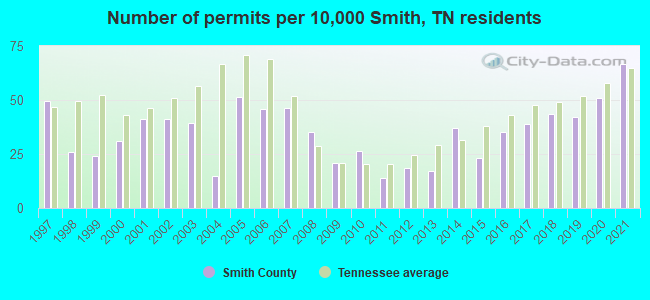
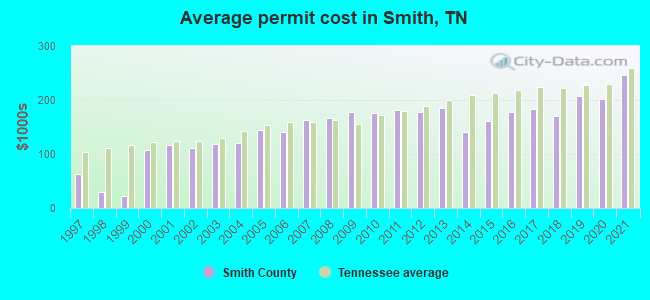
Single-family new house construction building permits:
- 2022: 110 buildings, average cost: $230,600
- 2021: 118 buildings, average cost: $245,800
- 2020: 90 buildings, average cost: $200,600
- 2019: 75 buildings, average cost: $208,000
- 2018: 77 buildings, average cost: $171,200
- 2017: 69 buildings, average cost: $183,300
- 2016: 62 buildings, average cost: $177,200
- 2015: 41 buildings, average cost: $161,900
- 2014: 66 buildings, average cost: $140,200
- 2013: 30 buildings, average cost: $185,100
- 2012: 33 buildings, average cost: $177,100
- 2011: 25 buildings, average cost: $181,100
- 2010: 47 buildings, average cost: $176,300
- 2009: 37 buildings, average cost: $177,400
- 2008: 62 buildings, average cost: $167,200
- 2007: 82 buildings, average cost: $163,300
- 2006: 81 buildings, average cost: $141,200
- 2005: 91 buildings, average cost: $143,500
- 2004: 26 buildings, average cost: $121,300
- 2003: 70 buildings, average cost: $119,400
- 2002: 73 buildings, average cost: $111,800
- 2001: 73 buildings, average cost: $116,500
- 2000: 55 buildings, average cost: $106,800
- 1999: 43 buildings, average cost: $23,400
- 1998: 46 buildings, average cost: $29,900
- 1997: 88 buildings, average cost: $62,500
Median real estate property taxes paid for housing units with mortgages in 2022: $1,005 (0.4%)
Median real estate property taxes paid for housing units with no mortgage in 2022: $1,010 (0.4%)
| Smith County: | 14.1% |
| Tennessee: | 13.3% |
Median age of residents in 2022: 40.8 years old
(Males: 40.0 years old, Females: 41.8 years old)
(Median age for: White residents: 41.0 years old, Black residents: 50.2 years old, American Indian residents: 57.9 years old, Asian residents: 53.6 years old, Hispanic or Latino residents: 27.4 years old, Other race residents: 31.1 years old)
Fair market rent in 2006 for a 1-bedroom apartment in Smith County is $396 a month.
Fair market rent for a 2-bedroom apartment is $474 a month.
Fair market rent for a 3-bedroom apartment is $632 a month.
Cities in this county include: Carthage, Forks of the River, South Carthage, Gordonsville.
Neighboring counties: Apache County, Arizona  , Alleghany County, North Carolina
  , Creek County, Oklahoma , Hancock County , Logan County, Oklahoma , Washington County, Oklahoma , Rowan County, North Carolina .
| Here: | 2.8% |
| Tennessee: | 3.0% |
Current college students: 391
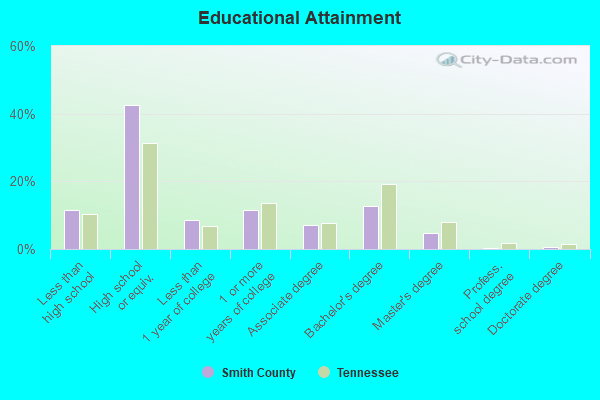
People 25 years of age or older with a high school degree or higher: 86.6%
People 25 years of age or older with a bachelor's degree or higher: 16.9%
Number of foreign born residents: 335 (31.2% naturalized citizens)
| Smith County: | 1.6% |
| Whole state: | 5.6% |
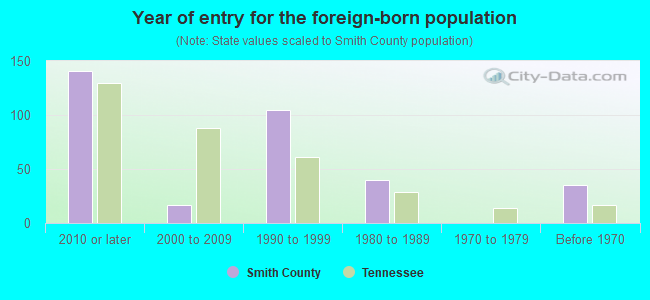
- Year of entry for the foreign-born population
- 1042010 or later
- 882000 to 2009
- 971990 to 1999
- 401980 to 1989
- 01970 to 1979
- 35Before 1970
Mean travel time to work (commute): minutes
Percentage of county residents living and working in this county: 99.0%
Housing units in structures:
- One, detached: 6,500
- One, attached: 103
- Two: 72
- 3 or 4: 104
- 5 to 9: 253
- 10 to 19: 27
- 20 to 49: 28
- 50 or more: 3
- Mobile homes: 1,653
- Boats, RVs, vans, etc.: 14
Housing units in Smith County with a mortgage: 3,036 (174 second mortgage, 0 home equity loan, 137 both second mortgage and home equity loan)
Houses without a mortgage: 62
| Here: | 4.6% with mortgage |
| State: | 97.8% with mortgage |
Religion statistics for Smith County
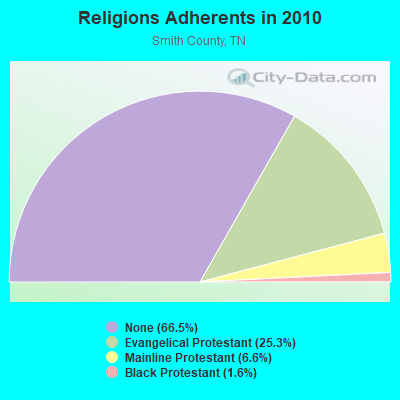
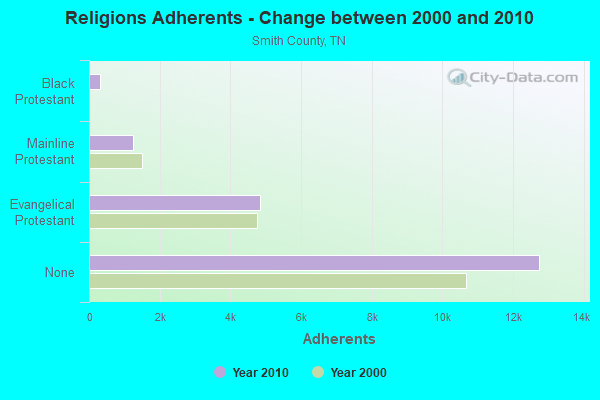
| Religion | Adherents | Congregations |
|---|---|---|
| Evangelical Protestant | 4,853 | 29 |
| Mainline Protestant | 1,256 | 14 |
| Black Protestant | 307 | 2 |
| Other | 1 | 1 |
| Catholic | - | - |
| None | 12,749 | - |
Source: Clifford Grammich, Kirk Hadaway, Richard Houseal, Dale E.Jones, Alexei Krindatch, Richie Stanley and Richard H.Taylor. 2012. 2010 U.S.Religion Census: Religious Congregations & Membership Study. Association of Statisticians of American Religious Bodies. Jones, Dale E., et al. 2002. Congregations and Membership in the United States 2000. Nashville, TN: Glenmary Research Center.
Food Environment Statistics:
| Smith County: | 3.19 / 10,000 pop. |
| State: | 1.99 / 10,000 pop. |
| This county: | 0.53 / 10,000 pop. |
| Tennessee: | 0.65 / 10,000 pop. |
| Smith County: | 6.92 / 10,000 pop. |
| Tennessee: | 5.16 / 10,000 pop. |
| This county: | 6.38 / 10,000 pop. |
| State: | 6.56 / 10,000 pop. |
| Smith County: | 11.5% |
| Tennessee: | 11.4% |
| Smith County: | 28.1% |
| State: | 30.2% |
| Here: | 14.0% |
| State: | 13.5% |
Agriculture in Smith County:
Average size of farms: 126 acresAverage value of agricultural products sold per farm: $9,879
Average value of crops sold per acre for harvested cropland: $157.20
The value of nursery, greenhouse, floriculture, and sod as a percentage of the total market value of agricultural products sold: 1.29%
The value of livestock, poultry, and their products as a percentage of the total market value of agricultural products sold: 60.34%
Average total farm production expenses per farm: $10,250
Harvested cropland as a percentage of land in farms: 19.85%
Irrigated harvested cropland as a percentage of land in farms: 0.64%
Average market value of all machinery and equipment per farm: $34,697
The percentage of farms operated by a family or individual: 93.87%
Average age of principal farm operators: 54 years
Average number of cattle and calves per 100 acres of all land in farms: 20.83
Milk cows as a percentage of all cattle and calves: 1.77%
Corn for grain: 2405 harvested acres
All wheat for grain: 175 harvested acres
Soybeans for beans: 2013 harvested acres
Vegetables: 27 harvested acres
Land in orchards: 40 acres
Earthquake activity:
Smith County-area historical earthquake activity is significantly above Tennessee state average. It is 155% greater than the overall U.S. average.On 4/18/2008 at 09:36:59, a magnitude 5.4 (5.1 MB, 4.8 MS, 5.4 MW, 5.2 MW, Class: Moderate, Intensity: VI - VII) earthquake occurred 185.9 miles away from Smith County center
On 7/27/1980 at 18:52:21, a magnitude 5.2 (5.1 MB, 4.7 MS, 5.0 UK, 5.2 UK) earthquake occurred 175.5 miles away from the county center
On 4/29/2003 at 08:59:39, a magnitude 4.9 (4.4 MB, 4.6 MW, 4.9 LG, Class: Light, Intensity: IV - V) earthquake occurred 122.4 miles away from the county center
On 4/18/2008 at 09:36:59, a magnitude 5.2 (5.2 MW, Depth: 8.9 mi) earthquake occurred 185.9 miles away from the county center
On 6/18/2002 at 17:37:15, a magnitude 5.0 (4.3 MB, 4.6 MW, 5.0 LG) earthquake occurred 156.9 miles away from Smith County center
On 11/30/1973 at 07:48:41, a magnitude 4.7 (4.7 MB, 4.6 ML) earthquake occurred 116.0 miles away from the county center
Magnitude types: regional Lg-wave magnitude (LG), body-wave magnitude (MB), local magnitude (ML), surface-wave magnitude (MS), moment magnitude (MW)
Most recent natural disasters:
- Tennessee Severe Storms, Tornadoes, Straight-line Winds, And Flooding, Incident Period: March 3, 2020, FEMA Id: 4476, Natural disaster type: Storm, Tornado, Flood, Wind
- Tennessee Covid-19 Pandemic, Incident Period: January 20, 2020, FEMA Id: 4514, Natural disaster type: Other
- Tennessee Severe Storms, Flooding, Landslides, And Mudslides, Incident Period: February 19, 2019 - March 30, 2019, FEMA Id: 4427, Natural disaster type: Storm, Mudslide, Landslide, Flood
- Tennessee Severe Storms, Straight-line Winds, And Flooding, Incident Period: May 27, 2017 - May 28, 2017, FEMA Id: 4320, Natural disaster type: Storm, Flood, Wind
- Tennessee Severe Storms, Tornadoes, Straight-line Winds, and Associated Flooding, Incident Period: April 25, 2011 to April 28, 2011, Major Disaster (Presidential) Declared DR-1974: May 01, 2011, FEMA Id: 1974, Natural disaster type: Storm, Tornado, Flood, Wind
- Tennessee Severe Storms and Flooding, Incident Period: August 17, 2010 to August 21, 2010, Major Disaster (Presidential) Declared DR-1937: September 15, 2010, FEMA Id: 1937, Natural disaster type: Storm, Flood
- Tennessee Severe Storms, Flooding, Straight-Line Winds, and Tornadoes, Incident Period: April 30, 2010 to May 18, 2010, Major Disaster (Presidential) Declared DR-1909: May 04, 2010, FEMA Id: 1909, Natural disaster type: Storm, Tornado, Flood, Wind
- Tennessee Hurricane Katrina Evacuation, Incident Period: August 29, 2005 to October 01, 2005, Emergency Declared EM-3217: September 05, 2005, FEMA Id: 3217, Natural disaster type: Hurricane
- Tennessee Severe Storms, Tornadoes and Flooding, Incident Period: May 04, 2003 to May 30, 2003, Major Disaster (Presidential) Declared DR-1464: May 08, 2003, FEMA Id: 1464, Natural disaster type: Storm, Tornado, Flood
- Tennessee Severe Storms/Tornadoes, Incident Period: March 28, 1997 to March 29, 1997, Major Disaster (Presidential) Declared DR-1171: April 02, 1997, FEMA Id: 1171, Natural disaster type: Storm, Tornado
- 5 other natural disasters have been reported since 1953.
The number of natural disasters in Smith County (15) is near the US average (15).
Major Disasters (Presidential) Declared: 9
Emergencies Declared: 2
Causes of natural disasters: Storms: 11, Floods: 10, Tornadoes: 6, Winds: 4, Winter Storms: 2, Flash Flood: 1, Hurricane: 1, Ice Storm: 1, Landslide: 1, Mudslide: 1, Snowfall: 1, Other: 1 (Note: some incidents may be assigned to more than one category).
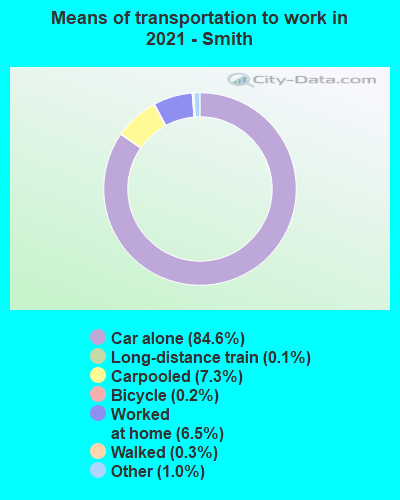
Means of transportation to work:
- Drove a car alone: 5,854 (78.7%)
- Carpooled: 383 (5.1%)
- Long-distance train or commuter rail: 7 (0.1%)
- Taxicab, motorcycle, or other means: 224 (3.0%)
- Bicycle: 11 (0.1%)
- Walked: 11 (0.1%)
- Worked at home: 947 (12.7%)
- Health care and social assistance (17%)
- Retail trade (13%)
- Educational services (10%)
- Manufacturing (6%)
- Professional, scientific, and technical services (6%)
- Finance and insurance (5%)
- Public administration (5%)
- Health care and social assistance (21%)
- Retail trade (16%)
- Educational services (12%)
- Manufacturing (8%)
- Professional, scientific, and technical services (8%)
- Finance and insurance (6%)
- Public administration (6%)
- Production occupations (19%)
- Construction and extraction occupations (11%)
- Installation, maintenance, and repair occupations (10%)
- Sales and related occupations (8%)
- Material moving occupations (7%)
- Management occupations (6%)
- Office and administrative support occupations (6%)
- Office and administrative support occupations (18%)
- Sales and related occupations (13%)
- Educational instruction, and library occupations (8%)
- Production occupations (7%)
- Business and financial operations occupations (7%)
- Management occupations (7%)
- Health technologists and technicians (7%)
- Mexico (30%)
- Korea (16%)
- Iran (9%)
- India (9%)
- Germany (8%)
- Cuba (7%)
- Colombia (5%)
- American (47%)
- English (19%)
- German (4%)
- Irish (4%)
- Scottish (2%)
- Italian (2%)
- Scotch-Irish (1%)
People in group quarters in Smith County, Tennessee in 2010:
- 117 people in nursing facilities/skilled-nursing facilities
- 39 people in local jails and other municipal confinement facilities
- 2 people in group homes intended for adults
People in group quarters in Smith County, Tennessee in 2000:
- 115 people in nursing homes
- 24 people in local jails and other confinement facilities (including police lockups)
- 9 people in homes for the mentally retarded
8.81% of this county's 2021 resident taxpayers lived in other counties in 2020 ($47,934 average adjusted gross income)
| Here: | 8.81% |
| Tennessee average: | 8.49% |
10 or fewer of this county's residents moved from foreign countries.
6.74% relocated from other counties in Tennessee ($36,545 average AGI)
2.07% relocated from other states ($11,389 average AGI)
Smith County: 2.07% Tennessee average: 4.34%
Top counties from which taxpayers relocated into this county between 2020 and 2021:
| from Wilson County, TN | |
| from Davidson County, TN | |
| from Putnam County, TN | |
| from Rutherford County, TN | |
| from DeKalb County, TN | |
| from Macon County, TN | |
| from Sumner County, TN |
6.70% of this county's 2020 resident taxpayers moved to other counties in 2021 ($42,986 average adjusted gross income)
| Here: | 6.70% |
| Tennessee average: | 7.40% |
10 or fewer of this county's residents moved to foreign countries.
5.75% relocated to other counties in Tennessee ($38,202 average AGI)
0.95% relocated to other states ($4,784 average AGI)
Smith County: 0.95% Tennessee average: 3.20%
Top counties to which taxpayers relocated from this county between 2020 and 2021:
| to Wilson County, TN | |
| to Putnam County, TN | |
| to Rutherford County, TN | |
| to DeKalb County, TN | |
| to Trousdale County, TN | |
| to Davidson County, TN | |
| to Macon County, TN |
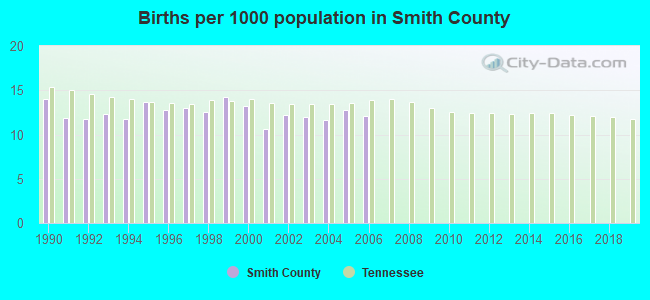
Births per 1000 population from 1990 to 1999: 12.8
Births per 1000 population from 2000 to 2006: 12.1
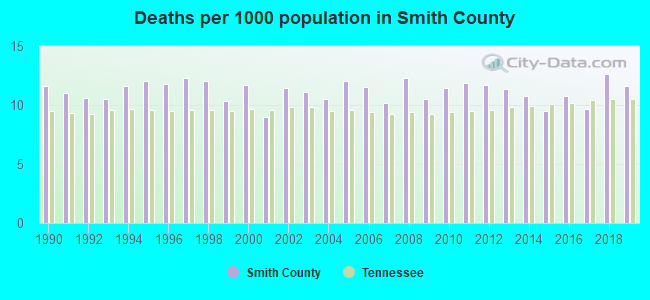
Deaths per 1000 population from 1990 to 1999: 11.4
Deaths per 1000 population from 2000 to 2009: 11.0
Deaths per 1000 population from 2010 to 2020: 11.3
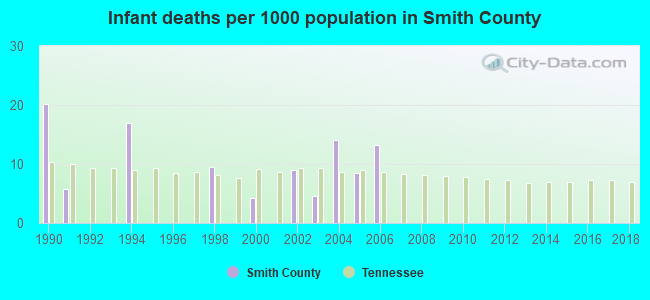
Infant deaths per 1000 live births from 1990 to 1999: 5.2
Infant deaths per 1000 live births from 2000 to 2006: 7.7
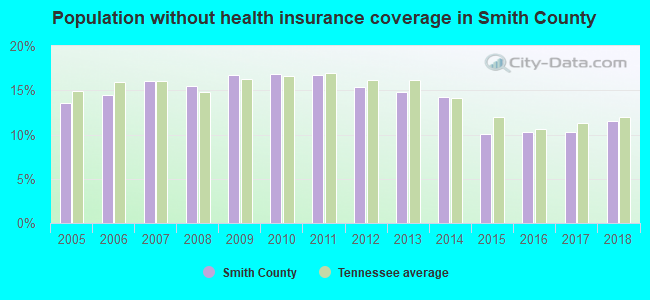
Persons under 19 years old without health insurance coverage in 2018: 4.9%
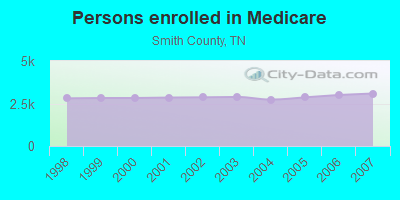
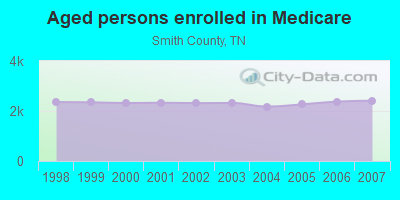
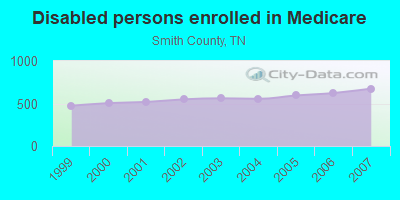
Persons enrolled in hospital insurance and/or supplemental medical insurance (Medicare) in July 1, 2007: 3,088 (2,413 aged, 675 disabled)
Children under 18 without health insurance coverage in 2007: 385 (8%)
Most common underlying causes of death in Smith County, Tennessee in 1999 - 2019:
- Acute myocardial infarction, unspecified (326)
- Bronchus or lung, unspecified - Malignant neoplasms (288)
- Atherosclerotic heart disease (204)
- Chronic obstructive pulmonary disease, unspecified (118)
- Stroke, not specified as haemorrhage or infarction (56)
- Alzheimer disease, unspecified (39)
- Unspecified dementia (27)
- Pneumonia, unspecified (11)
- Atherosclerotic cardiovascular disease, so described (10)
Population without health insurance coverage in 2000: 12%
Children under 18 without health insurance coverage in 2000: 6%
Short term general hospital admissions per 100,000 population in 2004: 12,127
Short term general hospital beds per 100,000 population in 2004: 478
Emergency room visits per 100,000 population in 2004: 46,293
General practice office based MDs per 100,000 population in 2005: 1,153
Medical specialist MDs per 100,000 population in 2005: 1,115
Total births per 100,000 population, July 2005 - July 2006 : 12
Total deaths per 100,000 population, July 2005 - July 2006: 38
Limited-service eating places per 100,000 population in 2005 : 5
Crimes per 100,000 population in 1996: 1
Household type by relationship:
Households: 20,403- Male householders: 3,792 (924 living alone), Female householders: 4,258 (1,119 living alone)
4,426 spouses (4,426 opposite-sex spouses), 439 unmarried partners, (411 opposite-sex unmarried partners), 5,446 children (4,903 natural, 98 adopted, 432 stepchildren), 910 grandchildren, 124 brothers or sisters, 148 parents, 0 foster children, 498 other relatives, 254 non-relatives
- In group quarters: 172
Size of family households: 2,567 2-persons, 1,442 3-persons, 864 4-persons, 403 5-persons, 308 6-persons, 161 7-or-more-persons.
Size of nonfamily households: 2,044 1-person, 214 2-persons, 16 3-persons, 16 4-persons.
2,507 married couples with children.
1,121 single-parent households (476 men, 645 women).
96.1% of residents of Smith speak English at home.
2.3% of residents speak Spanish at home (64% speak English very well, 21% speak English well, 15% speak English not well).
0.6% of residents speak other Indo-European language at home (54% speak English very well, 37% speak English well, 9% speak English not well).
0.6% of residents speak Asian or Pacific Island language at home (42% speak English very well, 17% speak English well, 41% speak English not well).
0.1% of residents speak other language at home (96% speak English very well, 4% speak English well).
In fiscal year 2004:
Federal Government expenditure: $102,460,000 ($5,565 per capita)
Department of Defense expenditure: $5,012,000
Federal direct payments to individuals for retirement and disability: $40,902,000
Federal other direct payments to individuals: $31,619,000
Federal direct payments not to individuals: $1,123,000
Federal grants: $21,740,000
Federal procurement contracts: $1,592,000 ($861,000 Department of Defense)
Federal salaries and wages: $5,485,000 ($2,656,000 Department of Defense)
Federal Government direct loans: $118,000
Federal guaranteed/insured loans: $3,975,000
Federal Government insurance: $15,547,000
Population change from April 1, 2000 to July 1, 2005:
Births: 1,140| Here: | 61 per 1000 residents |
| State: | 69 per 1000 residents |
Deaths: 1,015
| Here: | 54 per 1000 residents |
| State: | 50 per 1000 residents |
Net international migration: +40
| Here: | +2 per 1000 residents |
| State: | +8 per 1000 residents |
Net internal migration: +799
| Here: | +43 per 1000 residents |
| State: | +18 per 1000 residents |
Total withdrawal of fresh water for public supply: 1.72 millions of gallons per day (all from surface)
| Here: | 6.5 |
| State: | 6.5 |
| Here: | 5.0 |
| State: | 4.4 |
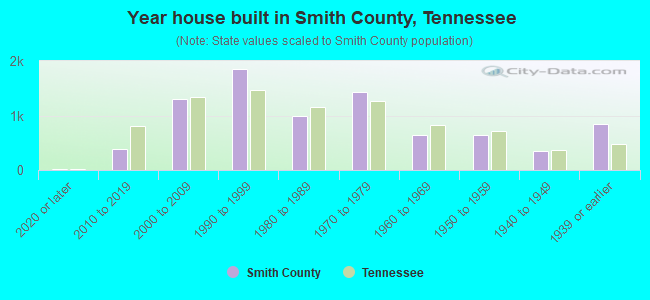
- Year house built in Smith County, Tennessee
- 402020 or later
- 4402010 to 2019
- 1,1642000 to 2009
- 1,7771990 to 1999
- 1,0321980 to 1989
- 1,4181970 to 1979
- 6911960 to 1969
- 5811950 to 1959
- 4151940 to 1949
- 9231939 or earlier
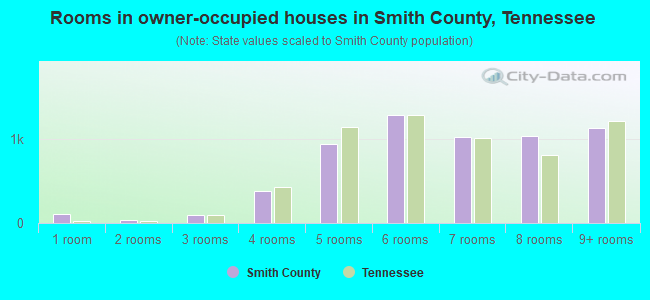
- Rooms in owner-occupied houses in Smith County, Tennessee
- 521 room
- 292 rooms
- 1573 rooms
- 4634 rooms
- 8975 rooms
- 1,3756 rooms
- 1,0207 rooms
- 9538 rooms
- 1,0989+ rooms
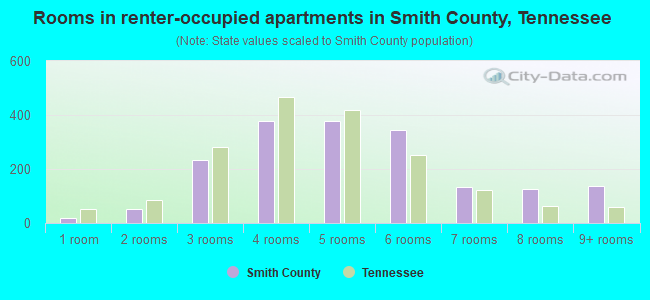
- Rooms in renter-occupied apartments in Smith County, Tennessee
- 01 room
- 262 rooms
- 2223 rooms
- 4804 rooms
- 4985 rooms
- 3146 rooms
- 1857 rooms
- 1258 rooms
- 1499+ rooms
- Bedrooms in owner-occupied houses in Smith County, Tennessee
- 78no bedroom
- 1141 bedroom
- 9252 bedrooms
- 3,3953 bedrooms
- 1,2514 bedrooms
- 2745+ bedrooms
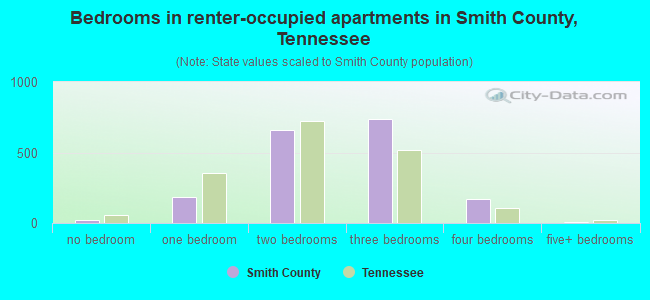
- Bedrooms in renter-occupied apartments in Smith County, Tennessee
- 0no bedroom
- 1321 bedroom
- 8002 bedrooms
- 9083 bedrooms
- 1434 bedrooms
- 105+ bedrooms
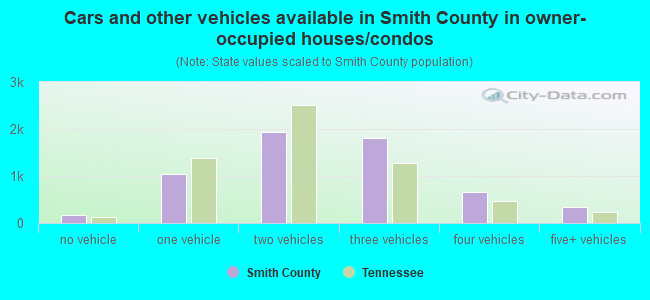
- Cars and other vehicles available in Smith County in owner-occupied houses/condos
- 183no vehicle
- 9711 vehicle
- 2,0312 vehicles
- 1,8053 vehicles
- 6234 vehicles
- 4045+ vehicles
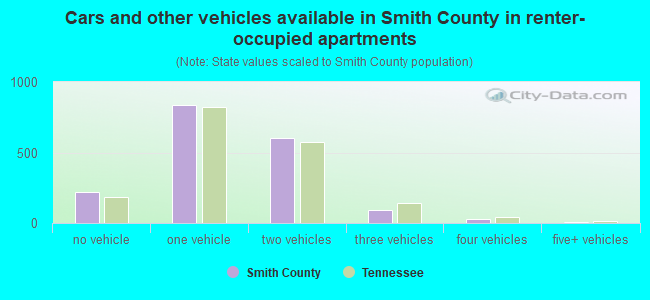
- Cars and other vehicles available in Smith County in renter-occupied apartments
- 224no vehicle
- 9621 vehicle
- 6172 vehicles
- 1033 vehicles
- 584 vehicles
- 565+ vehicles
91.7% of Smith County residents lived in the same house 1 years ago.
Out of people who lived in different houses, 24% lived in this county.
Out of people who lived in different counties, 90% lived in Tennessee.
| Smith County: | 91.7% |
| State average: | 87.0% |
Place of birth for U.S.-born residents:
- This state: 14,665
- Other state: 5,168
- Northeast: 750
- Midwest: 1,658
- South: 2,051
- West: 717
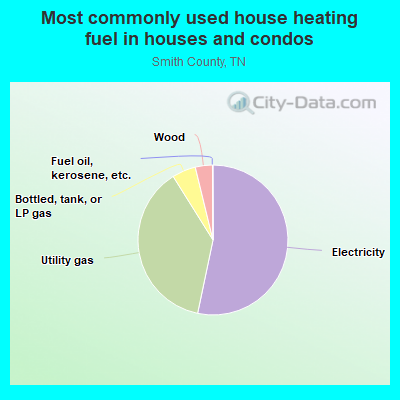
- 52.3%Electricity
- 37.5%Utility gas
- 5.4%Bottled, tank, or LP gas
- 4.6%Wood
- 0.1%No fuel used
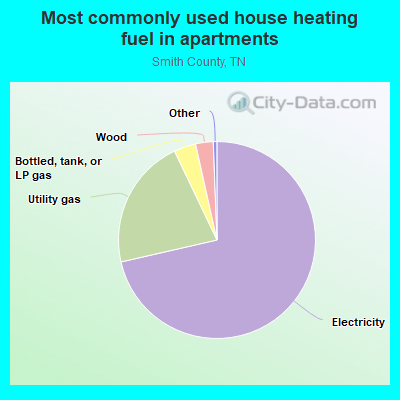
- 75.1%Electricity
- 17.6%Utility gas
- 4.5%Bottled, tank, or LP gas
- 2.1%Wood
- 0.5%Fuel oil, kerosene, etc.
- 0.2%No fuel used
Private vs. public school enrollment:
| Here: | 7.8% |
| Tennessee: | 15.0% |
| Here: | 19.9% |
| Tennessee: | 16.2% |
| Here: | 19.2% |
| Tennessee: | 23.5% |
Smith County government finances - Expenditure in 2017:
- Bond Funds - Cash and Securities: $27,000
- Charges - Solid Waste Management: $4,467,000
Other: $2,261,000
Other: $1,886,000
Solid Waste Management: $1,549,000
Elementary and Secondary Education - Other: $1,499,000
Elementary and Secondary Education - Other: $1,402,000
Elementary and Secondary Education School Lunch: $524,000
Elementary and Secondary Education School Lunch: $401,000
Parks and Recreation: $12,000
Elementary and Secondary Education School Tuition and Transportation: $4,000
- Construction - Judicial and Legal Services: $2,156,000
Health - Other: $859,000
General - Other: $607,000
Elementary and Secondary Education: $255,000
Parks and Recreation: $118,000
- Current Operations - Elementary and Secondary Education: $28,679,000
Elementary and Secondary Education: $25,336,000
Solid Waste Management: $4,931,000
Regular Highways: $2,731,000
Police Protection: $2,425,000
Regular Highways: $2,375,000
General - Other: $2,293,000
Police Protection: $2,241,000
Health - Other: $1,669,000
Health - Other: $1,380,000
Solid Waste Management: $1,288,000
Correctional Institutions: $1,260,000
General - Other: $1,238,000
Correctional Institutions: $1,199,000
Public Welfare - Other: $1,002,000
Judicial and Legal Services: $799,000
Judicial and Legal Services: $748,000
Central Staff Services: $738,000
Financial Administration: $658,000
Financial Administration: $592,000
General Public Buildings: $586,000
General Public Buildings: $507,000
Central Staff Services: $411,000
Natural Resources - Other: $326,000
Local Fire Protection: $167,000
Local Fire Protection: $138,000
Natural Resources - Other: $121,000
Libraries: $114,000
Libraries: $102,000
Protective Inspection and Regulation - Other: $102,000
Public Welfare - Other: $71,000
Parks and Recreation: $56,000
Parks and Recreation: $19,000
Protective Inspection and Regulation - Other: $4,000
- Federal Intergovernmental - Public Welfare: $93,000
Other: $80,000
- General - Interest on Debt: $1,082,000
Interest on Debt: $307,000
- Intergovernmental to Local - Other - General - Other: $1,137,000
Other - Elementary and Secondary Education: $71,000
Other - Financial Administration: $10,000
Other - Protective Inspection and Regulations: $8,000
Other - Elementary and Secondary Education: $3,000
- Intergovernmental to State - Health - Other: $14,000
- Local Intergovernmental - General Local Government Support: $486,000
Education: $30,000
Education: $24,000
Highways: $8,000
- Long Term Debt - Beginning Outstanding - Unspecified Public Purpose: $27,046,000
Outstanding Unspecified Public Purpose: $24,234,000
Beginning Outstanding - Unspecified Public Purpose: $14,478,000
Outstanding Unspecified Public Purpose: $13,233,000
Retired Unspecified Public Purpose: $2,812,000
Retired Unspecified Public Purpose: $1,280,000
Outstanding Nonguaranteed - Industrial Revenue: $1,100,000
Beginning Outstanding - Public Debt for Private Purpose: $1,100,000
Issue, Unspecified Public Purpose: $35,000
- Miscellaneous - General Revenue - Other: $1,043,000
General Revenue - Other: $884,000
Interest Earnings: $395,000
Rents: $339,000
Fines and Forfeits: $180,000
Donations From Private Sources: $145,000
Interest Earnings: $145,000
Rents: $128,000
Fines and Forfeits: $61,000
Donations From Private Sources: $35,000
Sale of Property: $30,000
Sale of Property: $13,000
- Other Capital Outlay - Solid Waste Management: $1,019,000
Elementary and Secondary Education: $680,000
Elementary and Secondary Education: $678,000
Police Protection: $314,000
Health - Other: $192,000
Regular Highways: $153,000
Regular Highways: $100,000
Financial Administration: $25,000
Local Fire Protection: $24,000
Judicial and Legal Services: $19,000
Central Staff Services: $17,000
General - Other: $12,000
Parks and Recreation: $11,000
General Public Building: $8,000
Protective Inspection and Regulation - Other: $2,000
Libraries: $1,000
- Other Funds - Cash and Securities: $7,359,000
- Sinking Funds - Cash and Securities: $2,091,000
Cash and Securities: $1,100,000
- State Intergovernmental - Education: $21,809,000
Education: $20,559,000
Other: $2,438,000
Highways: $2,204,000
Highways: $1,604,000
General Local Government Support: $740,000
Other: $694,000
Public Welfare: $607,000
General Local Government Support: $592,000
Public Welfare: $16,000
Health and Hospitals: $4,000
- Tax - Property: $7,680,000
Property: $5,970,000
General Sales and Gross Receipts: $3,399,000
Motor Vehicle License: $1,035,000
General Sales and Gross Receipts: $1,025,000
Motor Vehicle License: $297,000
Other Selective Sales: $251,000
Occupation and Business License - Other: $159,000
Occupation and Business License - Other: $119,000
Severance: $113,000
Alcoholic Beverage Sales: $113,000
Other Selective Sales: $105,000
Other License: $89,000
Alcoholic Beverage Sales: $50,000
Public Utilities Sales: $44,000
Other License: $36,000
Public Utility License: $17,000
Alcoholic Beverage License: $2,000
- Total Salaries and Wages: $17,276,000
: $16,993,000
Smith County government finances - Revenue in 2017:
- Bond Funds - Cash and Securities: $27,000
- Charges - Solid Waste Management: $4,467,000
Other: $2,261,000
Other: $1,886,000
Solid Waste Management: $1,549,000
Elementary and Secondary Education - Other: $1,499,000
Elementary and Secondary Education - Other: $1,402,000
Elementary and Secondary Education School Lunch: $524,000
Elementary and Secondary Education School Lunch: $401,000
Parks and Recreation: $12,000
Elementary and Secondary Education School Tuition and Transportation: $4,000
- Construction - Judicial and Legal Services: $2,156,000
Health - Other: $859,000
General - Other: $607,000
Elementary and Secondary Education: $255,000
Parks and Recreation: $118,000
- Current Operations - Elementary and Secondary Education: $28,679,000
Elementary and Secondary Education: $25,336,000
Solid Waste Management: $4,931,000
Regular Highways: $2,731,000
Police Protection: $2,425,000
Regular Highways: $2,375,000
General - Other: $2,293,000
Police Protection: $2,241,000
Health - Other: $1,669,000
Health - Other: $1,380,000
Solid Waste Management: $1,288,000
Correctional Institutions: $1,260,000
General - Other: $1,238,000
Correctional Institutions: $1,199,000
Public Welfare - Other: $1,002,000
Judicial and Legal Services: $799,000
Judicial and Legal Services: $748,000
Central Staff Services: $738,000
Financial Administration: $658,000
Financial Administration: $592,000
General Public Buildings: $586,000
General Public Buildings: $507,000
Central Staff Services: $411,000
Natural Resources - Other: $326,000
Local Fire Protection: $167,000
Local Fire Protection: $138,000
Natural Resources - Other: $121,000
Libraries: $114,000
Libraries: $102,000
Protective Inspection and Regulation - Other: $102,000
Public Welfare - Other: $71,000
Parks and Recreation: $56,000
Parks and Recreation: $19,000
Protective Inspection and Regulation - Other: $4,000
- Federal Intergovernmental - Public Welfare: $93,000
Other: $80,000
- General - Interest on Debt: $1,082,000
Interest on Debt: $307,000
- Intergovernmental to Local - Other - General - Other: $1,137,000
Other - Elementary and Secondary Education: $71,000
Other - Financial Administration: $10,000
Other - Protective Inspection and Regulations: $8,000
Other - Elementary and Secondary Education: $3,000
- Intergovernmental to State - Health - Other: $14,000
- Local Intergovernmental - General Local Government Support: $486,000
Education: $30,000
Education: $24,000
Highways: $8,000
- Long Term Debt - Beginning Outstanding - Unspecified Public Purpose: $27,046,000
Outstanding Unspecified Public Purpose: $24,234,000
Beginning Outstanding - Unspecified Public Purpose: $14,478,000
Outstanding Unspecified Public Purpose: $13,233,000
Retired Unspecified Public Purpose: $2,812,000
Retired Unspecified Public Purpose: $1,280,000
Outstanding Nonguaranteed - Industrial Revenue: $1,100,000
Beginning Outstanding - Public Debt for Private Purpose: $1,100,000
Issue, Unspecified Public Purpose: $35,000
- Miscellaneous - General Revenue - Other: $1,043,000
General Revenue - Other: $884,000
Interest Earnings: $395,000
Rents: $339,000
Fines and Forfeits: $180,000
Donations From Private Sources: $145,000
Interest Earnings: $145,000
Rents: $128,000
Fines and Forfeits: $61,000
Donations From Private Sources: $35,000
Sale of Property: $30,000
Sale of Property: $13,000
- Other Capital Outlay - Solid Waste Management: $1,019,000
Elementary and Secondary Education: $680,000
Elementary and Secondary Education: $678,000
Police Protection: $314,000
Health - Other: $192,000
Regular Highways: $153,000
Regular Highways: $100,000
Financial Administration: $25,000
Local Fire Protection: $24,000
Judicial and Legal Services: $19,000
Central Staff Services: $17,000
General - Other: $12,000
Parks and Recreation: $11,000
General Public Building: $8,000
Protective Inspection and Regulation - Other: $2,000
Libraries: $1,000
- Other Funds - Cash and Securities: $7,359,000
- Sinking Funds - Cash and Securities: $2,091,000
Cash and Securities: $1,100,000
- State Intergovernmental - Education: $21,809,000
Education: $20,559,000
Other: $2,438,000
Highways: $2,204,000
Highways: $1,604,000
General Local Government Support: $740,000
Other: $694,000
Public Welfare: $607,000
General Local Government Support: $592,000
Public Welfare: $16,000
Health and Hospitals: $4,000
- Tax - Property: $7,680,000
Property: $5,970,000
General Sales and Gross Receipts: $3,399,000
Motor Vehicle License: $1,035,000
General Sales and Gross Receipts: $1,025,000
Motor Vehicle License: $297,000
Other Selective Sales: $251,000
Occupation and Business License - Other: $159,000
Occupation and Business License - Other: $119,000
Severance: $113,000
Alcoholic Beverage Sales: $113,000
Other Selective Sales: $105,000
Other License: $89,000
Alcoholic Beverage Sales: $50,000
Public Utilities Sales: $44,000
Other License: $36,000
Public Utility License: $17,000
Alcoholic Beverage License: $2,000
- Total Salaries and Wages: $17,276,000
: $16,993,000
Smith County government finances - Debt in 2017:
- Bond Funds - Cash and Securities: $27,000
- Charges - Solid Waste Management: $4,467,000
Other: $2,261,000
Other: $1,886,000
Solid Waste Management: $1,549,000
Elementary and Secondary Education - Other: $1,499,000
Elementary and Secondary Education - Other: $1,402,000
Elementary and Secondary Education School Lunch: $524,000
Elementary and Secondary Education School Lunch: $401,000
Parks and Recreation: $12,000
Elementary and Secondary Education School Tuition and Transportation: $4,000
- Construction - Judicial and Legal Services: $2,156,000
Health - Other: $859,000
General - Other: $607,000
Elementary and Secondary Education: $255,000
Parks and Recreation: $118,000
- Current Operations - Elementary and Secondary Education: $28,679,000
Elementary and Secondary Education: $25,336,000
Solid Waste Management: $4,931,000
Regular Highways: $2,731,000
Police Protection: $2,425,000
Regular Highways: $2,375,000
General - Other: $2,293,000
Police Protection: $2,241,000
Health - Other: $1,669,000
Health - Other: $1,380,000
Solid Waste Management: $1,288,000
Correctional Institutions: $1,260,000
General - Other: $1,238,000
Correctional Institutions: $1,199,000
Public Welfare - Other: $1,002,000
Judicial and Legal Services: $799,000
Judicial and Legal Services: $748,000
Central Staff Services: $738,000
Financial Administration: $658,000
Financial Administration: $592,000
General Public Buildings: $586,000
General Public Buildings: $507,000
Central Staff Services: $411,000
Natural Resources - Other: $326,000
Local Fire Protection: $167,000
Local Fire Protection: $138,000
Natural Resources - Other: $121,000
Libraries: $114,000
Libraries: $102,000
Protective Inspection and Regulation - Other: $102,000
Public Welfare - Other: $71,000
Parks and Recreation: $56,000
Parks and Recreation: $19,000
Protective Inspection and Regulation - Other: $4,000
- Federal Intergovernmental - Public Welfare: $93,000
Other: $80,000
- General - Interest on Debt: $1,082,000
Interest on Debt: $307,000
- Intergovernmental to Local - Other - General - Other: $1,137,000
Other - Elementary and Secondary Education: $71,000
Other - Financial Administration: $10,000
Other - Protective Inspection and Regulations: $8,000
Other - Elementary and Secondary Education: $3,000
- Intergovernmental to State - Health - Other: $14,000
- Local Intergovernmental - General Local Government Support: $486,000
Education: $30,000
Education: $24,000
Highways: $8,000
- Long Term Debt - Beginning Outstanding - Unspecified Public Purpose: $27,046,000
Outstanding Unspecified Public Purpose: $24,234,000
Beginning Outstanding - Unspecified Public Purpose: $14,478,000
Outstanding Unspecified Public Purpose: $13,233,000
Retired Unspecified Public Purpose: $2,812,000
Retired Unspecified Public Purpose: $1,280,000
Outstanding Nonguaranteed - Industrial Revenue: $1,100,000
Beginning Outstanding - Public Debt for Private Purpose: $1,100,000
Issue, Unspecified Public Purpose: $35,000
- Miscellaneous - General Revenue - Other: $1,043,000
General Revenue - Other: $884,000
Interest Earnings: $395,000
Rents: $339,000
Fines and Forfeits: $180,000
Donations From Private Sources: $145,000
Interest Earnings: $145,000
Rents: $128,000
Fines and Forfeits: $61,000
Donations From Private Sources: $35,000
Sale of Property: $30,000
Sale of Property: $13,000
- Other Capital Outlay - Solid Waste Management: $1,019,000
Elementary and Secondary Education: $680,000
Elementary and Secondary Education: $678,000
Police Protection: $314,000
Health - Other: $192,000
Regular Highways: $153,000
Regular Highways: $100,000
Financial Administration: $25,000
Local Fire Protection: $24,000
Judicial and Legal Services: $19,000
Central Staff Services: $17,000
General - Other: $12,000
Parks and Recreation: $11,000
General Public Building: $8,000
Protective Inspection and Regulation - Other: $2,000
Libraries: $1,000
- Other Funds - Cash and Securities: $7,359,000
- Sinking Funds - Cash and Securities: $2,091,000
Cash and Securities: $1,100,000
- State Intergovernmental - Education: $21,809,000
Education: $20,559,000
Other: $2,438,000
Highways: $2,204,000
Highways: $1,604,000
General Local Government Support: $740,000
Other: $694,000
Public Welfare: $607,000
General Local Government Support: $592,000
Public Welfare: $16,000
Health and Hospitals: $4,000
- Tax - Property: $7,680,000
Property: $5,970,000
General Sales and Gross Receipts: $3,399,000
Motor Vehicle License: $1,035,000
General Sales and Gross Receipts: $1,025,000
Motor Vehicle License: $297,000
Other Selective Sales: $251,000
Occupation and Business License - Other: $159,000
Occupation and Business License - Other: $119,000
Severance: $113,000
Alcoholic Beverage Sales: $113,000
Other Selective Sales: $105,000
Other License: $89,000
Alcoholic Beverage Sales: $50,000
Public Utilities Sales: $44,000
Other License: $36,000
Public Utility License: $17,000
Alcoholic Beverage License: $2,000
- Total Salaries and Wages: $17,276,000
: $16,993,000
Smith County government finances - Cash and Securities in 2017:
- Bond Funds - Cash and Securities: $27,000
- Charges - Solid Waste Management: $4,467,000
Other: $2,261,000
Other: $1,886,000
Solid Waste Management: $1,549,000
Elementary and Secondary Education - Other: $1,499,000
Elementary and Secondary Education - Other: $1,402,000
Elementary and Secondary Education School Lunch: $524,000
Elementary and Secondary Education School Lunch: $401,000
Parks and Recreation: $12,000
Elementary and Secondary Education School Tuition and Transportation: $4,000
- Construction - Judicial and Legal Services: $2,156,000
Health - Other: $859,000
General - Other: $607,000
Elementary and Secondary Education: $255,000
Parks and Recreation: $118,000
- Current Operations - Elementary and Secondary Education: $28,679,000
Elementary and Secondary Education: $25,336,000
Solid Waste Management: $4,931,000
Regular Highways: $2,731,000
Police Protection: $2,425,000
Regular Highways: $2,375,000
General - Other: $2,293,000
Police Protection: $2,241,000
Health - Other: $1,669,000
Health - Other: $1,380,000
Solid Waste Management: $1,288,000
Correctional Institutions: $1,260,000
General - Other: $1,238,000
Correctional Institutions: $1,199,000
Public Welfare - Other: $1,002,000
Judicial and Legal Services: $799,000
Judicial and Legal Services: $748,000
Central Staff Services: $738,000
Financial Administration: $658,000
Financial Administration: $592,000
General Public Buildings: $586,000
General Public Buildings: $507,000
Central Staff Services: $411,000
Natural Resources - Other: $326,000
Local Fire Protection: $167,000
Local Fire Protection: $138,000
Natural Resources - Other: $121,000
Libraries: $114,000
Libraries: $102,000
Protective Inspection and Regulation - Other: $102,000
Public Welfare - Other: $71,000
Parks and Recreation: $56,000
Parks and Recreation: $19,000
Protective Inspection and Regulation - Other: $4,000
- Federal Intergovernmental - Public Welfare: $93,000
Other: $80,000
- General - Interest on Debt: $1,082,000
Interest on Debt: $307,000
- Intergovernmental to Local - Other - General - Other: $1,137,000
Other - Elementary and Secondary Education: $71,000
Other - Financial Administration: $10,000
Other - Protective Inspection and Regulations: $8,000
Other - Elementary and Secondary Education: $3,000
- Intergovernmental to State - Health - Other: $14,000
- Local Intergovernmental - General Local Government Support: $486,000
Education: $30,000
Education: $24,000
Highways: $8,000
- Long Term Debt - Beginning Outstanding - Unspecified Public Purpose: $27,046,000
Outstanding Unspecified Public Purpose: $24,234,000
Beginning Outstanding - Unspecified Public Purpose: $14,478,000
Outstanding Unspecified Public Purpose: $13,233,000
Retired Unspecified Public Purpose: $2,812,000
Retired Unspecified Public Purpose: $1,280,000
Outstanding Nonguaranteed - Industrial Revenue: $1,100,000
Beginning Outstanding - Public Debt for Private Purpose: $1,100,000
Issue, Unspecified Public Purpose: $35,000
- Miscellaneous - General Revenue - Other: $1,043,000
General Revenue - Other: $884,000
Interest Earnings: $395,000
Rents: $339,000
Fines and Forfeits: $180,000
Donations From Private Sources: $145,000
Interest Earnings: $145,000
Rents: $128,000
Fines and Forfeits: $61,000
Donations From Private Sources: $35,000
Sale of Property: $30,000
Sale of Property: $13,000
- Other Capital Outlay - Solid Waste Management: $1,019,000
Elementary and Secondary Education: $680,000
Elementary and Secondary Education: $678,000
Police Protection: $314,000
Health - Other: $192,000
Regular Highways: $153,000
Regular Highways: $100,000
Financial Administration: $25,000
Local Fire Protection: $24,000
Judicial and Legal Services: $19,000
Central Staff Services: $17,000
General - Other: $12,000
Parks and Recreation: $11,000
General Public Building: $8,000
Protective Inspection and Regulation - Other: $2,000
Libraries: $1,000
- Other Funds - Cash and Securities: $7,359,000
- Sinking Funds - Cash and Securities: $2,091,000
Cash and Securities: $1,100,000
- State Intergovernmental - Education: $21,809,000
Education: $20,559,000
Other: $2,438,000
Highways: $2,204,000
Highways: $1,604,000
General Local Government Support: $740,000
Other: $694,000
Public Welfare: $607,000
General Local Government Support: $592,000
Public Welfare: $16,000
Health and Hospitals: $4,000
- Tax - Property: $7,680,000
Property: $5,970,000
General Sales and Gross Receipts: $3,399,000
Motor Vehicle License: $1,035,000
General Sales and Gross Receipts: $1,025,000
Motor Vehicle License: $297,000
Other Selective Sales: $251,000
Occupation and Business License - Other: $159,000
Occupation and Business License - Other: $119,000
Severance: $113,000
Alcoholic Beverage Sales: $113,000
Other Selective Sales: $105,000
Other License: $89,000
Alcoholic Beverage Sales: $50,000
Public Utilities Sales: $44,000
Other License: $36,000
Public Utility License: $17,000
Alcoholic Beverage License: $2,000
- Total Salaries and Wages: $17,276,000
: $16,993,000
Supplemental Security Income (SSI) in 2006:
- Total number of recipients: 482
- Number of aged recipients: 66
- Number of blind and disabled recipients: 416
- Number of recipients under 18: 48
- Number of recipients between 18 and 64: 308
- Number of recipients older than 64: 126
- Number of recipients also receiving OASDI: 237
- Amount of payments (thousands of dollars): 185
| Most common first names in Smith County, TN among deceased individuals | ||
| Name | Count | Lived (average) |
|---|---|---|
| James | 94 | 68.7 years |
| Mary | 68 | 80.1 years |
| William | 66 | 76.0 years |
| John | 59 | 76.4 years |
| Robert | 43 | 74.3 years |
| Willie | 42 | 77.0 years |
| Ruby | 28 | 79.3 years |
| Thomas | 27 | 72.2 years |
| Charles | 26 | 73.4 years |
| George | 24 | 73.2 years |
| Most common last names in Smith County, TN among deceased individuals | ||
| Last name | Count | Lived (average) |
|---|---|---|
| Smith | 59 | 73.5 years |
| Bennett | 37 | 77.3 years |
| Williams | 36 | 78.1 years |
| Kemp | 35 | 78.2 years |
| Woodard | 34 | 79.2 years |
| Hackett | 32 | 83.2 years |
| Agee | 30 | 75.0 years |
| West | 30 | 78.8 years |
| Thompson | 29 | 76.3 years |
| Silcox | 27 | 70.6 years |
| Businesses in Smith County, TN | ||||
| Name | Count | Name | Count | |
|---|---|---|---|---|
| Advance Auto Parts | 1 | McDonald's | 2 | |
| Arby's | 1 | Pizza Hut | 1 | |
| Comfort Inn | 1 | SONIC Drive-In | 1 | |
| Curves | 1 | Subway | 2 | |
| Dunkin Donuts | 1 | Taco Bell | 1 | |
| FedEx | 2 | U-Haul | 3 | |
| H&R Block | 1 | UPS | 2 | |
| Hardee's | 1 | Waffle House | 1 | |
| KFC | 1 | Walmart | 1 | |
| La-Z-Boy | 1 | Wendy's | 1 | |