Crime rate in Boca Raton, Florida (FL): murders, rapes, robberies, assaults, burglaries, thefts, auto thefts, arson, law enforcement employees, police officers, crime map
Crime rate in Boca Raton, FL
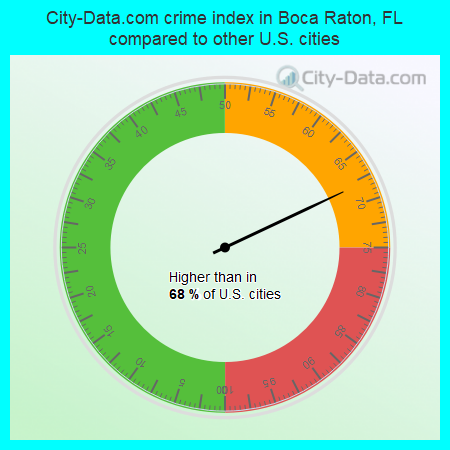
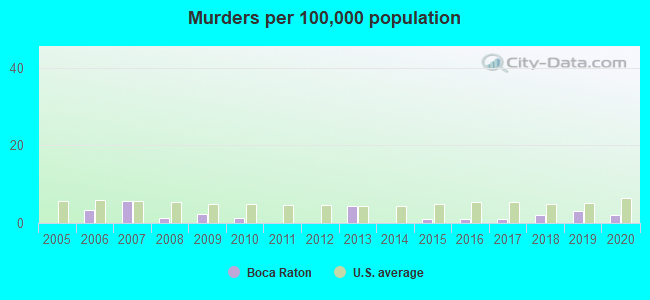
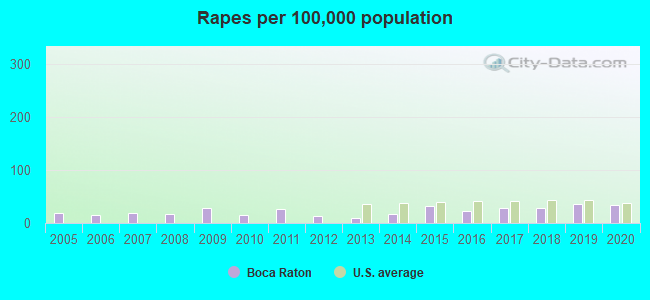
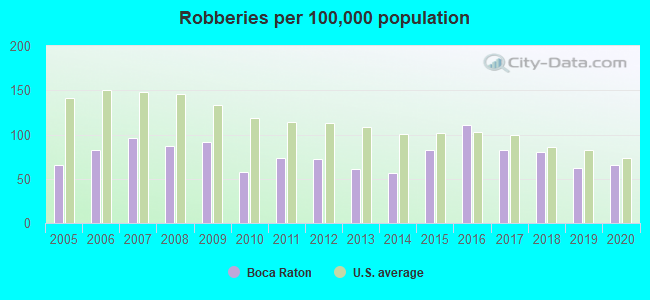
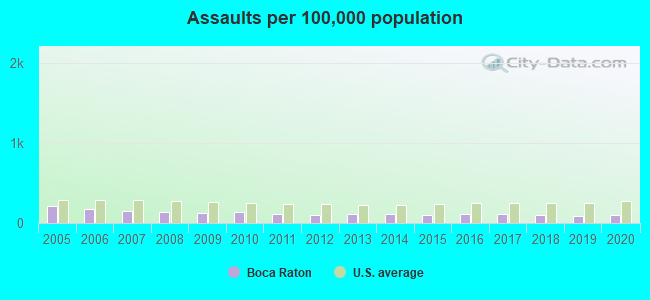
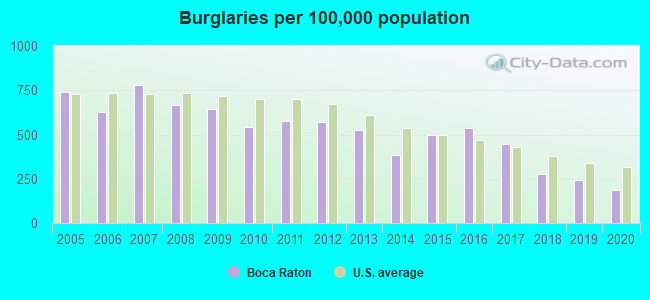
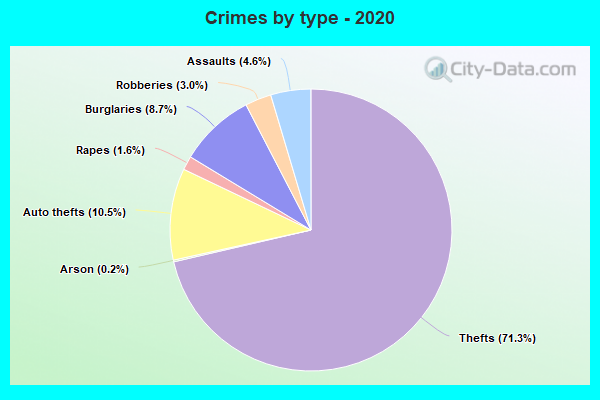
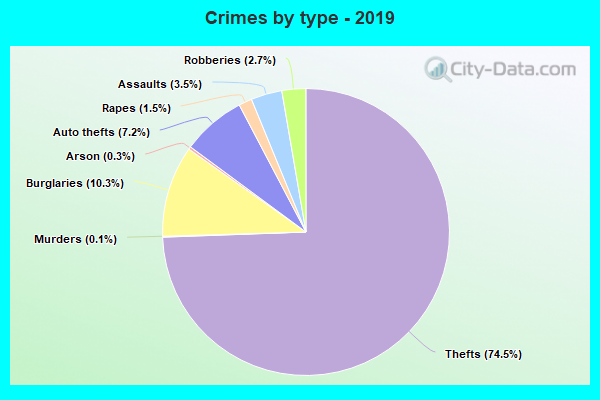
The 2020 crime rate in Boca Raton, FL is 165 (City-Data.com crime index), which is 1.5 times smaller than the U.S. average. It was higher than in 68.0% U.S. cities. The 2020 Boca Raton crime rate fell by 3% compared to 2019. The number of homicides stood at 2 - a decrease of 1 compared to 2019. In the last 5 years Boca Raton has seen decreasing violent crime and decreasing property crime.See how dangerous Boca Raton, FL is compared to the nearest cities:
(Note: Higher means more crime)
(Note: Higher means more crime)
| Boca Raton: | 164.7 |
| Highland Beach: | 18.2 |
| Deerfield Beach: | 191.2 |
| Hillsboro Beach: | 29.9 |
| Delray Beach: | 323.3 |
| Lighthouse Point: | 94.0 |
| Coconut Creek: | 90.8 |
| Gulf Stream: | 67.4 |
| Pompano Beach: | 370.5 |
The City-Data.com crime index weighs serious crimes and violent crimes more heavily. Higher means more crime, U.S. average is 246.1. It adjusts for the number of visitors and daily workers commuting into cities.
- means the value is smaller than the state average.- means the value is about the same as the state average.
- means the value is bigger than the state average.
According to our research of Florida and other state lists, there were 104 registered sex offenders living in Boca Raton, Florida as of April 27, 2024.
The ratio of all residents to sex offenders in Boca Raton is 910 to 1.
The ratio of registered sex offenders to all residents in this city is lower than the state average.
Violent crime rate in 2020
| Boca Raton: | 121.6 |
| U.S. Average: | 228.2 |
Violent crime rate in 2019
| Boca Raton: | 114.2 |
| U.S. Average: | 219.9 |
Violent crime rate in 2018
| Boca Raton: | 119.3 |
| U.S. Average: | 221.2 |
Violent crime rate in 2017
| Boca Raton: | 129.0 |
| U.S. Average: | 226.2 |
Violent crime rate in 2016
| Boca Raton: | 139.0 |
| U.S. Average: | 227.3 |
Violent crime rate in 2015
| Boca Raton: | 127.0 |
| U.S. Average: | 219.3 |
Violent crime rate in 2014
| Boca Raton: | 101.1 |
| U.S. Average: | 211.1 |
Violent crime rate in 2013
| Boca Raton: | 104.2 |
| U.S. Average: | 214.2 |
Violent crime rate in 2012
| Boca Raton: | 101.7 |
| U.S. Average: | 187.4 |
Violent crime rate in 2011
| Boca Raton: | 117.5 |
| U.S. Average: | 187.1 |
Violent crime rate in 2010
| Boca Raton: | 113.8 |
| U.S. Average: | 195.7 |
Violent crime rate in 2009
| Boca Raton: | 143.7 |
| U.S. Average: | 208.9 |
Violent crime rate in 2008
| Boca Raton: | 134.7 |
| U.S. Average: | 222.5 |
Violent crime rate in 2007
| Boca Raton: | 114.6 |
| U.S. Average: | 229.1 |
Violent crime rate in 2006
| Boca Raton: | 110.0 |
| U.S. Average: | 232.6 |
Violent crime rate in 2005
| Boca Raton: | 119.5 |
| U.S. Average: | 227.0 |
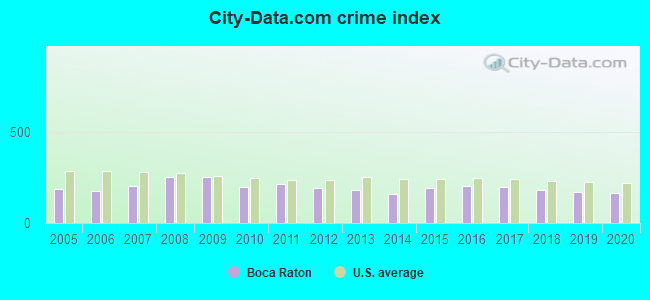
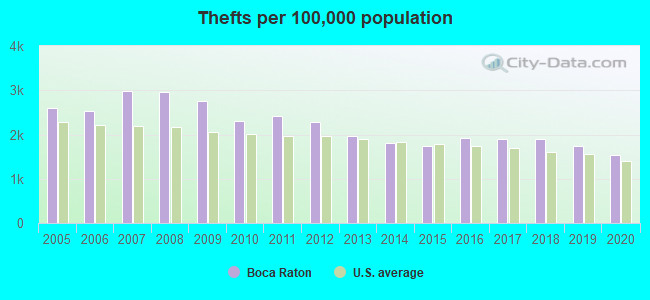
Property crime rate in 2020
| Boca Raton: | 149.3 |
| U.S. Average: | 169.6 |
Property crime rate in 2019
| Boca Raton: | 160.9 |
| U.S. Average: | 179.7 |
Property crime rate in 2018
| Boca Raton: | 178.3 |
| U.S. Average: | 190.2 |
Property crime rate in 2017
| Boca Raton: | 214.2 |
| U.S. Average: | 206.4 |
Property crime rate in 2016
| Boca Raton: | 228.1 |
| U.S. Average: | 216.6 |
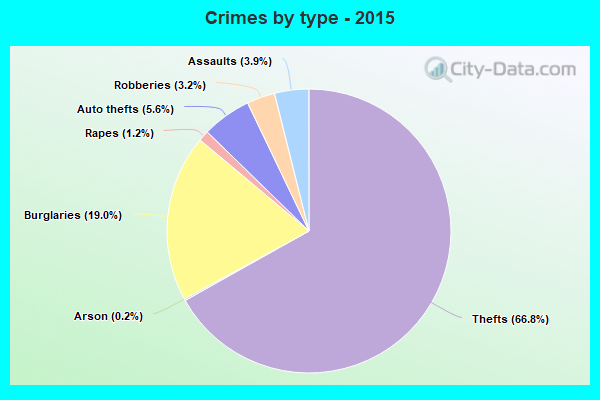
Property crime rate in 2015
| Boca Raton: | 208.4 |
| U.S. Average: | 221.5 |
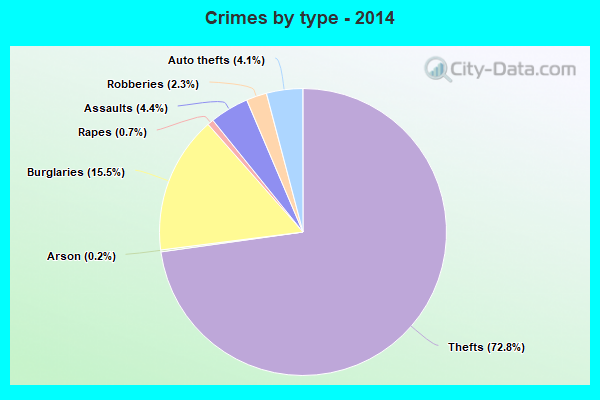
Property crime rate in 2014
| Boca Raton: | 181.7 |
| U.S. Average: | 230.8 |
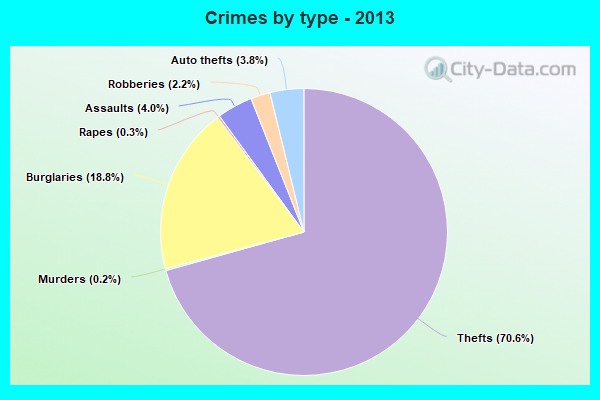
Property crime rate in 2013
| Boca Raton: | 218.7 |
| U.S. Average: | 250.4 |
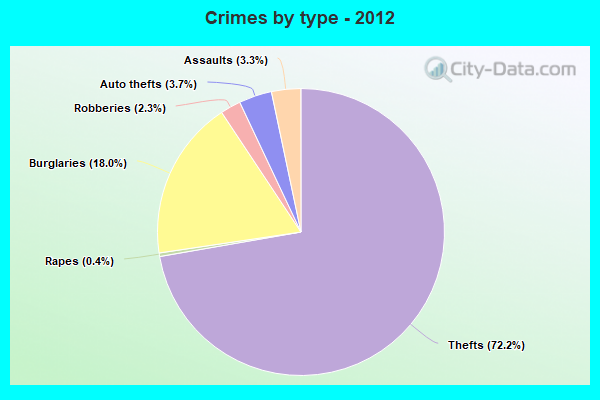
Property crime rate in 2012
| Boca Raton: | 244.6 |
| U.S. Average: | 267.3 |
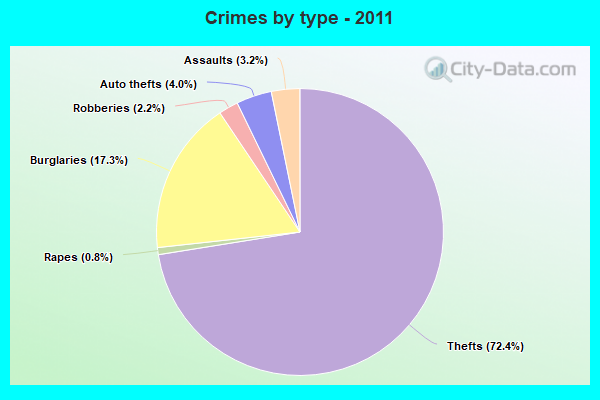
Property crime rate in 2011
| Boca Raton: | 256.5 |
| U.S. Average: | 273.5 |
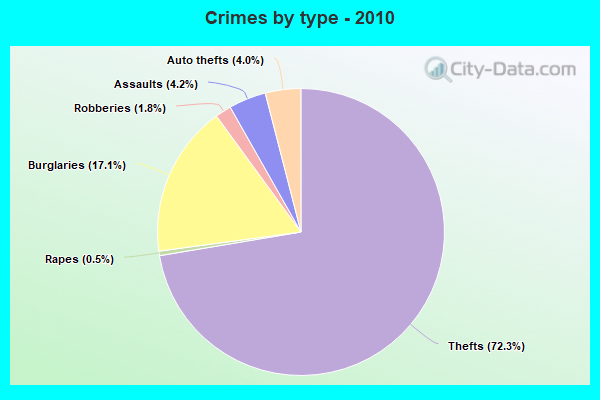
Property crime rate in 2010
| Boca Raton: | 242.9 |
| U.S. Average: | 276.4 |
Property crime rate in 2009
| Boca Raton: | 294.6 |
| U.S. Average: | 285.6 |
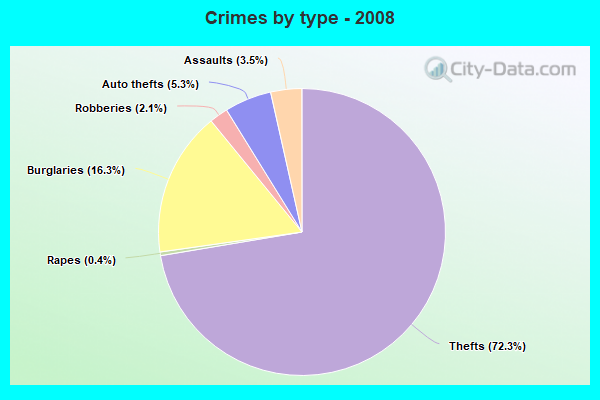
Property crime rate in 2008
| Boca Raton: | 314.1 |
| U.S. Average: | 302.2 |
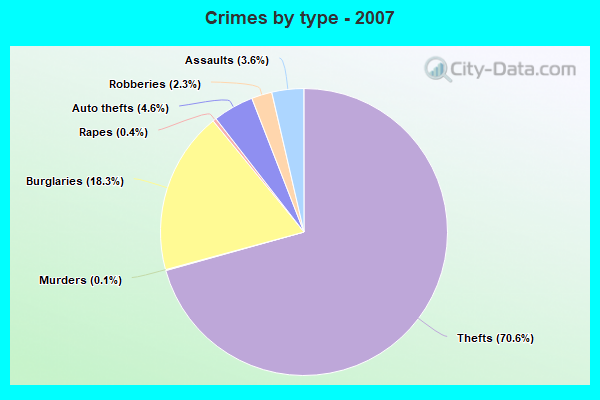
Property crime rate in 2007
| Boca Raton: | 249.1 |
| U.S. Average: | 309.2 |
Property crime rate in 2006
| Boca Raton: | 209.0 |
| U.S. Average: | 317.3 |
Property crime rate in 2005
| Boca Raton: | 232.6 |
| U.S. Average: | 322.3 |
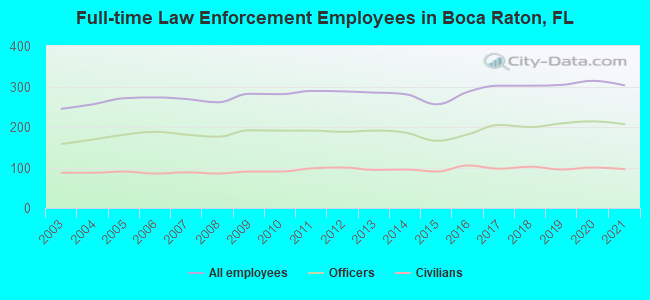
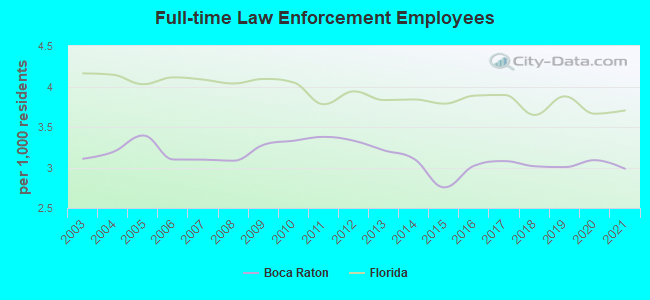
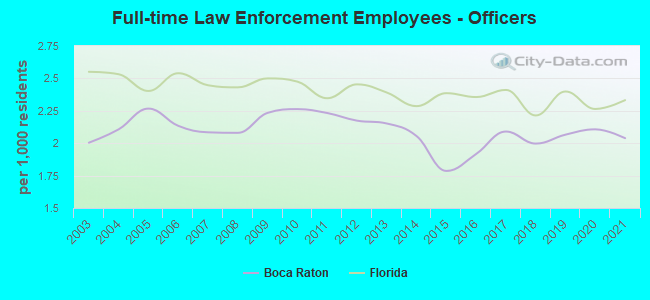
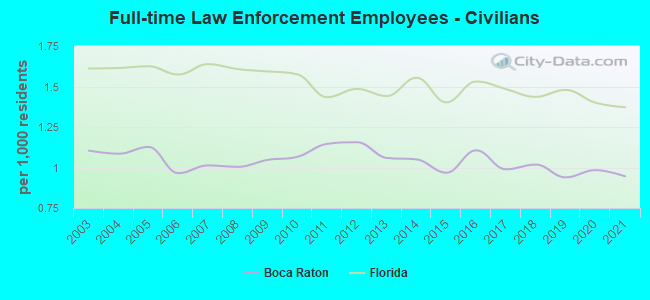
Full-time law enforcement employees in 2021, including police officers: 303 (207 officers - 166 male; 41 female).
| Officers per 1,000 residents here: | 2.04 |
| Florida average: | 2.33 |
Full-time law enforcement employees in 2020, including police officers: 314 (214 officers - 173 male; 41 female).
| Officers per 1,000 residents here: | 2.11 |
| Florida average: | 2.26 |
Full-time law enforcement employees in 2019, including police officers: 304 (209 officers - 168 male; 41 female).
| Officers per 1,000 residents here: | 2.07 |
| Florida average: | 2.40 |
Full-time law enforcement employees in 2018, including police officers: 302 (200 officers - 161 male; 39 female).
| Officers per 1,000 residents here: | 2.00 |
| Florida average: | 2.21 |
Full-time law enforcement employees in 2017, including police officers: 302 (205 officers - 168 male; 37 female).
| Officers per 1,000 residents here: | 2.09 |
| Florida average: | 2.41 |
Full-time law enforcement employees in 2016, including police officers: 287 (182 officers - 149 male; 33 female).
| Officers per 1,000 residents here: | 1.92 |
| Florida average: | 2.36 |
Full-time law enforcement employees in 2015, including police officers: 256 (166 officers - 144 male; 22 female).
| Officers per 1,000 residents here: | 1.79 |
| Florida average: | 2.39 |
Full-time law enforcement employees in 2014, including police officers: 281 (186 officers - 152 male; 34 female).
| Officers per 1,000 residents here: | 2.06 |
| Florida average: | 2.29 |
Full-time law enforcement employees in 2013, including police officers: 285 (191 officers - 155 male; 36 female).
| Officers per 1,000 residents here: | 2.15 |
| Florida average: | 2.39 |
Full-time law enforcement employees in 2012, including police officers: 288 (188 officers - 153 male; 35 female).
| Officers per 1,000 residents here: | 2.17 |
| Florida average: | 2.45 |
Full-time law enforcement employees in 2011, including police officers: 289 (191 officers - 155 male; 36 female).
| Officers per 1,000 residents here: | 2.23 |
| Florida average: | 2.35 |
Full-time law enforcement employees in 2010, including police officers: 281 (191 officers - 157 male; 34 female).
| Officers per 1,000 residents here: | 2.26 |
| Florida average: | 2.47 |
Full-time law enforcement employees in 2009, including police officers: 282 (192 officers - 158 male; 34 female).
| Officers per 1,000 residents here: | 2.23 |
| Florida average: | 2.50 |
Full-time law enforcement employees in 2008, including police officers: 261 (176 officers - 146 male; 30 female).
| Officers per 1,000 residents here: | 2.08 |
| Florida average: | 2.43 |
Full-time law enforcement employees in 2007, including police officers: 269 (181 officers - 149 male; 32 female).
| Officers per 1,000 residents here: | 2.08 |
| Florida average: | 2.45 |
Full-time law enforcement employees in 2006, including police officers: 273 (188 officers - 155 male; 33 female).
| Officers per 1,000 residents here: | 2.13 |
| Florida average: | 2.54 |
Full-time law enforcement employees in 2005, including police officers: 271 (181 officers - 150 male; 31 female).
| Officers per 1,000 residents here: | 2.27 |
| Florida average: | 2.40 |
Full-time law enforcement employees in 2004, including police officers: 256 (169 officers - 142 male; 27 female).
| Officers per 1,000 residents here: | 2.11 |
| Florida average: | 2.53 |
Full-time law enforcement employees in 2003, including police officers: 245 (158 officers - 134 male; 24 female).
| Officers per 1,000 residents here: | 2.00 |
| Florida average: | 2.55 |


Zip codes: 33431, 33432, 33433, 33434, 33444, 33445, 33486, 33487, 33496.