Crime rate in Burbank, California (CA): murders, rapes, robberies, assaults, burglaries, thefts, auto thefts, arson, law enforcement employees, police officers, crime map
Crime rate in Burbank, CA
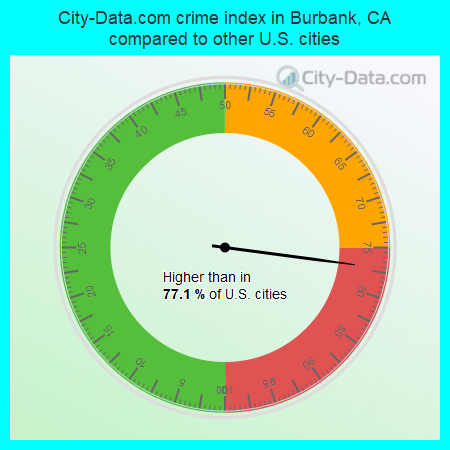
The 2022 crime rate in Burbank, CA is 212 (City-Data.com crime index), which is comparable to the U.S. average. It was higher than in 77.1% U.S. cities. The 2022 Burbank crime rate rose by 1077% compared to 2021. In the last 5 years Burbank has seen rise of violent crime and rise of property crime.See how dangerous Burbank, CA is compared to the nearest cities:
(Note: Higher means more crime)
(Note: Higher means more crime)
| Burbank: | 212.3 |
| Glendale: | 132.2 |
| West Hollywood: | 574.1 |
| Los Angeles: | 388.8 |
| La Canada Flintridge: | 123.5 |
| Beverly Hills: | 347.8 |
| San Fernando: | 204.9 |
| South Pasadena: | 147.3 |
| Pasadena: | 221.2 |
The City-Data.com crime index weighs serious crimes and violent crimes more heavily. Higher means more crime, U.S. average is 246.1. It adjusts for the number of visitors and daily workers commuting into cities.
- means the value is smaller than the state average.- means the value is about the same as the state average.
- means the value is bigger than the state average.
- means the value is much bigger than the state average.
According to our research of California and other state lists, there were 58 registered sex offenders living in Burbank, California as of April 27, 2024.
The ratio of all residents to sex offenders in Burbank is 1,818 to 1.
The ratio of registered sex offenders to all residents in this city is lower than the state average.
Violent crime rate in 2022
| Burbank: | 166.6 |
| U.S. Average: | 219.8 |
Violent crime rate in 2021
| Burbank: | 10.8 |
| U.S. Average: | 224.8 |
Violent crime rate in 2020
| Burbank: | 92.3 |
| U.S. Average: | 228.2 |
Violent crime rate in 2019
| Burbank: | 97.8 |
| U.S. Average: | 219.9 |
Violent crime rate in 2018
| Burbank: | 117.6 |
| U.S. Average: | 221.2 |
Violent crime rate in 2017
| Burbank: | 130.5 |
| U.S. Average: | 226.2 |
Violent crime rate in 2016
| Burbank: | 110.7 |
| U.S. Average: | 227.3 |
Violent crime rate in 2015
| Burbank: | 81.2 |
| U.S. Average: | 219.3 |
Violent crime rate in 2014
| Burbank: | 79.5 |
| U.S. Average: | 211.1 |
Violent crime rate in 2013
| Burbank: | 87.8 |
| U.S. Average: | 214.2 |
Violent crime rate in 2012
| Burbank: | 129.9 |
| U.S. Average: | 187.4 |
Violent crime rate in 2011
| Burbank: | 100.9 |
| U.S. Average: | 187.1 |
Violent crime rate in 2010
| Burbank: | 113.2 |
| U.S. Average: | 195.7 |
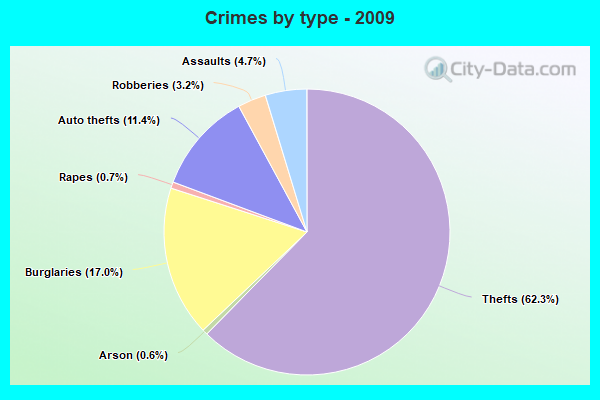
Violent crime rate in 2009
| Burbank: | 134.6 |
| U.S. Average: | 208.9 |
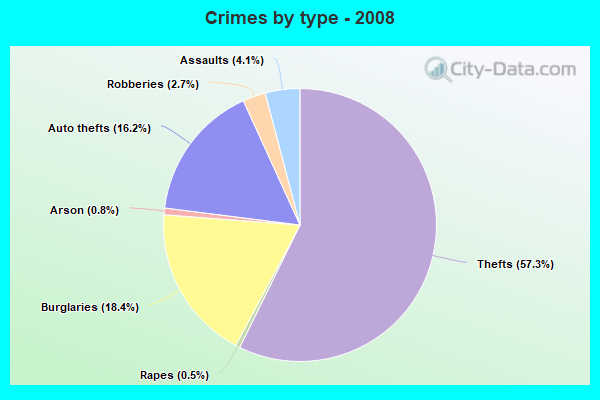
Violent crime rate in 2008
| Burbank: | 124.5 |
| U.S. Average: | 222.5 |
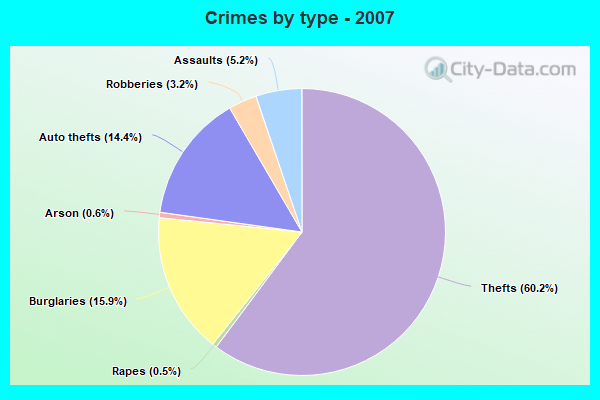
Violent crime rate in 2007
| Burbank: | 120.6 |
| U.S. Average: | 229.1 |
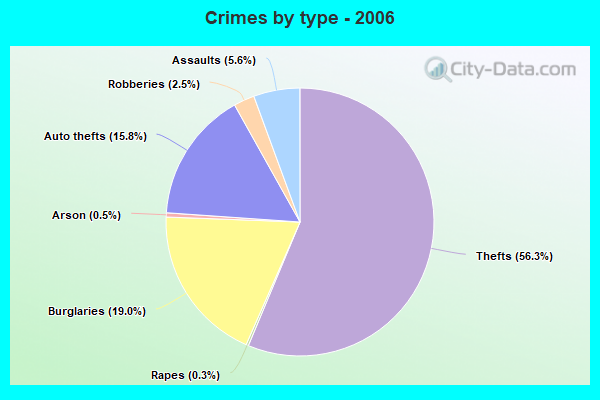
Violent crime rate in 2006
| Burbank: | 107.4 |
| U.S. Average: | 232.6 |
Violent crime rate in 2005
| Burbank: | 108.9 |
| U.S. Average: | 227.0 |
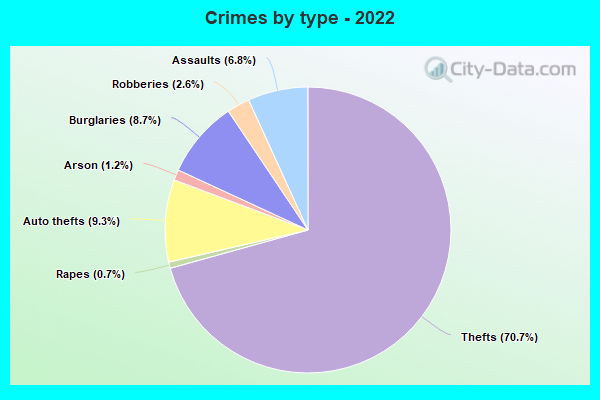
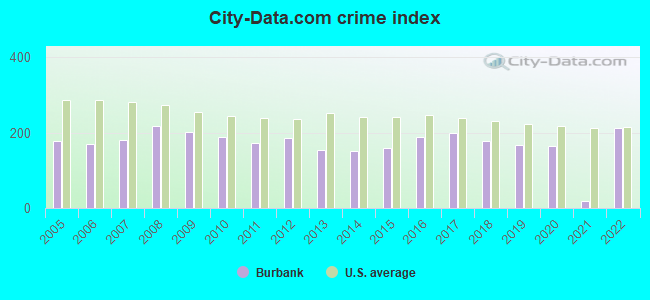
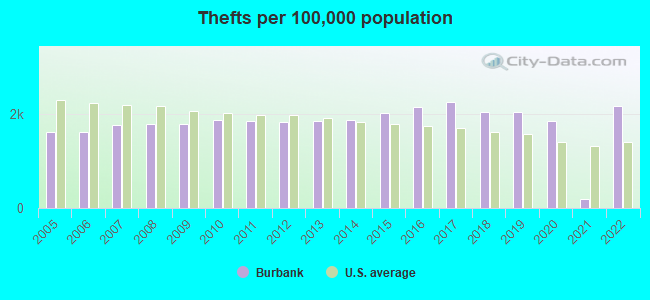
Property crime rate in 2022
| Burbank: | 204.9 |
| U.S. Average: | 166.5 |
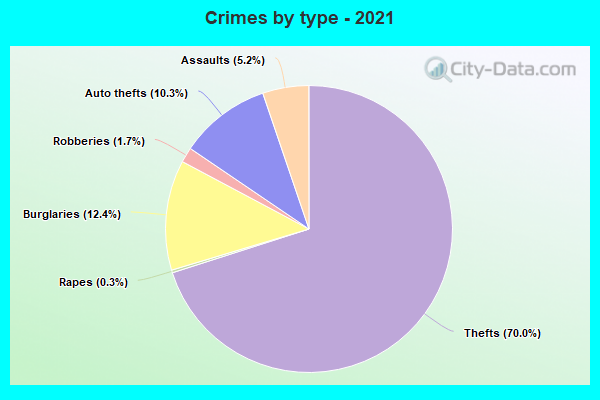
Property crime rate in 2021
| Burbank: | 21.5 |
| U.S. Average: | 157.8 |
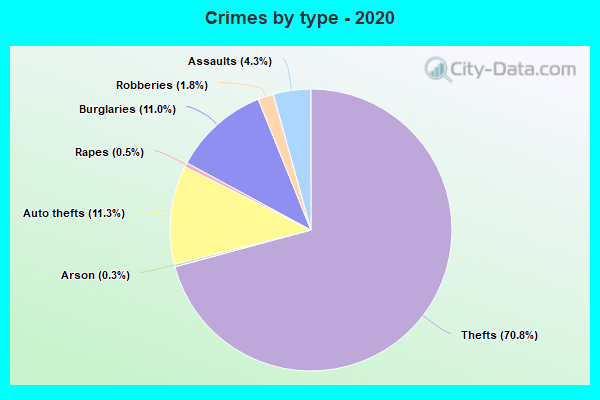
Property crime rate in 2020
| Burbank: | 193.1 |
| U.S. Average: | 169.6 |
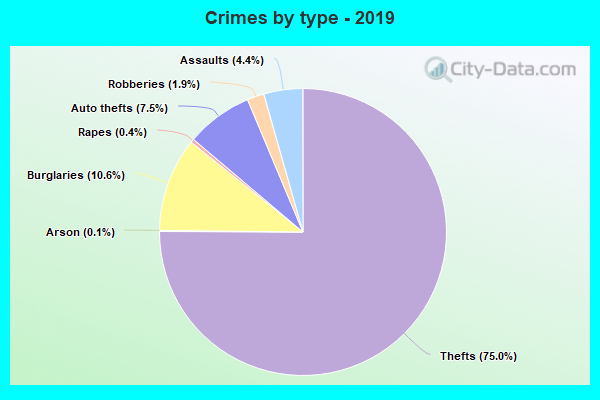
Property crime rate in 2019
| Burbank: | 189.7 |
| U.S. Average: | 179.7 |
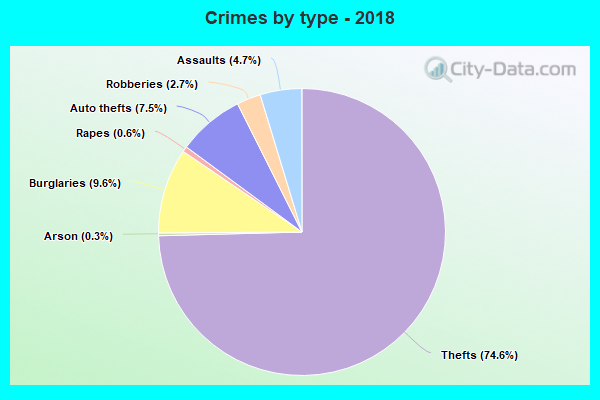
Property crime rate in 2018
| Burbank: | 184.7 |
| U.S. Average: | 190.2 |
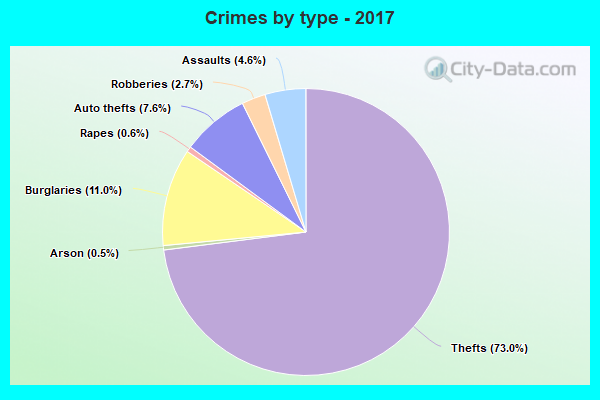
Property crime rate in 2017
| Burbank: | 215.0 |
| U.S. Average: | 206.4 |
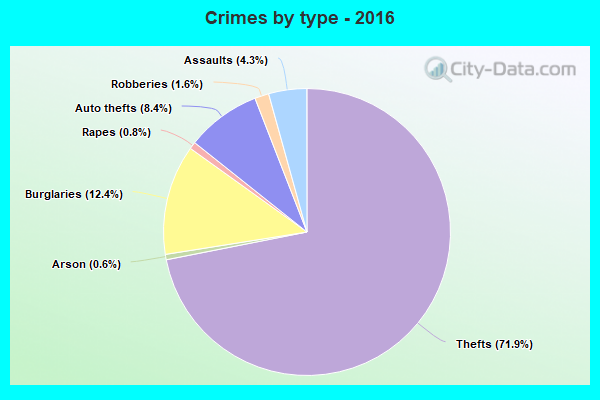
Property crime rate in 2016
| Burbank: | 219.2 |
| U.S. Average: | 216.6 |
Property crime rate in 2015
| Burbank: | 188.6 |
| U.S. Average: | 221.5 |
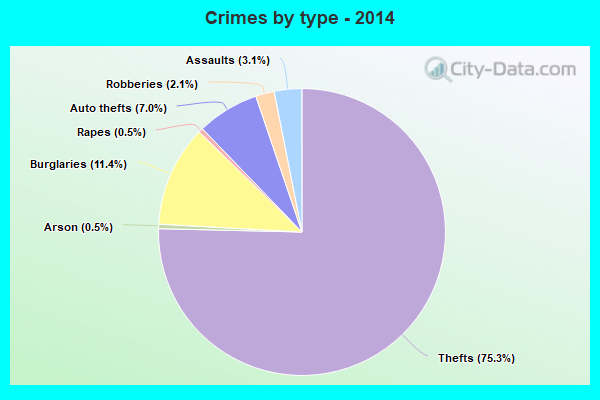
Property crime rate in 2014
| Burbank: | 175.1 |
| U.S. Average: | 230.8 |
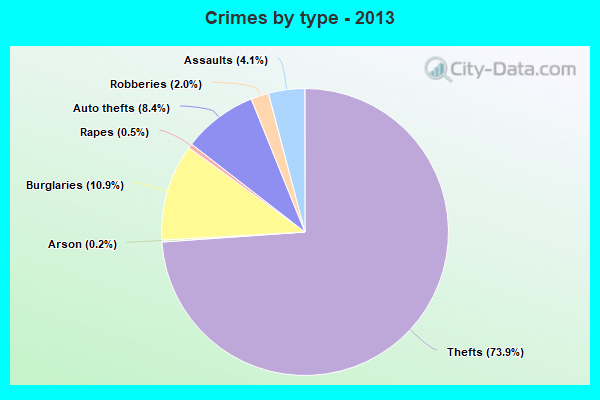
Property crime rate in 2013
| Burbank: | 177.7 |
| U.S. Average: | 250.4 |
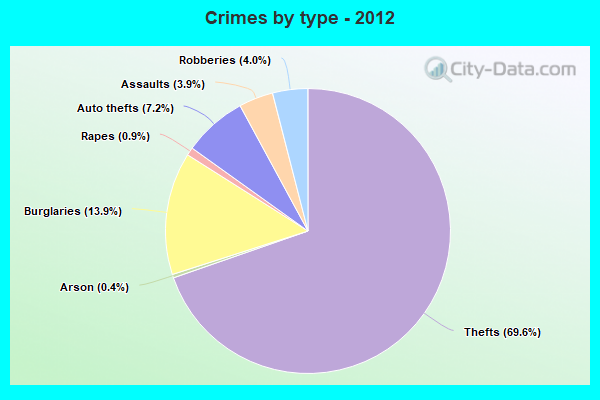
Property crime rate in 2012
| Burbank: | 192.3 |
| U.S. Average: | 267.3 |
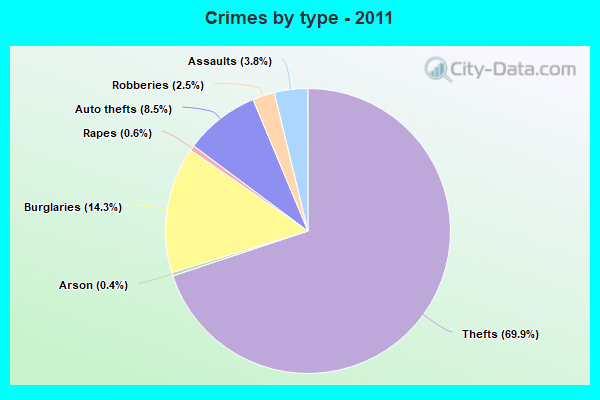
Property crime rate in 2011
| Burbank: | 201.2 |
| U.S. Average: | 273.5 |
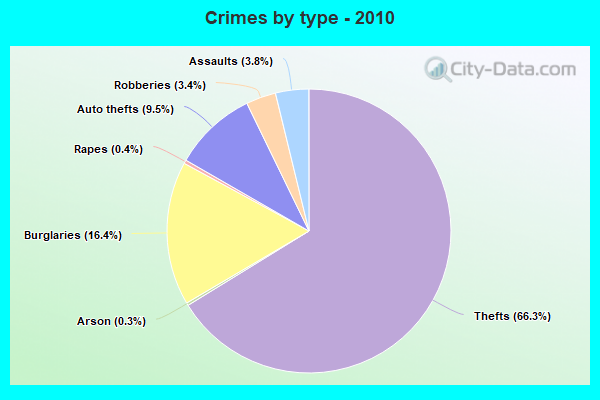
Property crime rate in 2010
| Burbank: | 226.1 |
| U.S. Average: | 276.4 |
Property crime rate in 2009
| Burbank: | 233.9 |
| U.S. Average: | 285.6 |
Property crime rate in 2008
| Burbank: | 277.1 |
| U.S. Average: | 302.2 |
Property crime rate in 2007
| Burbank: | 207.3 |
| U.S. Average: | 309.2 |
Property crime rate in 2006
| Burbank: | 217.4 |
| U.S. Average: | 317.3 |
Property crime rate in 2005
| Burbank: | 224.2 |
| U.S. Average: | 322.3 |
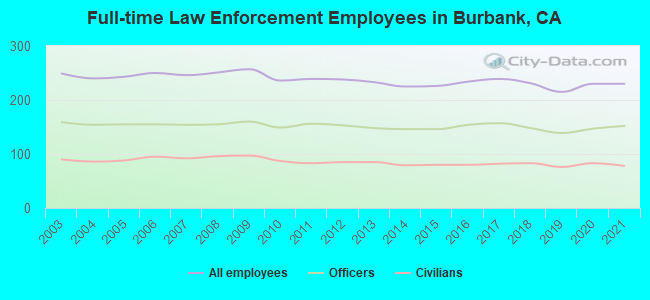
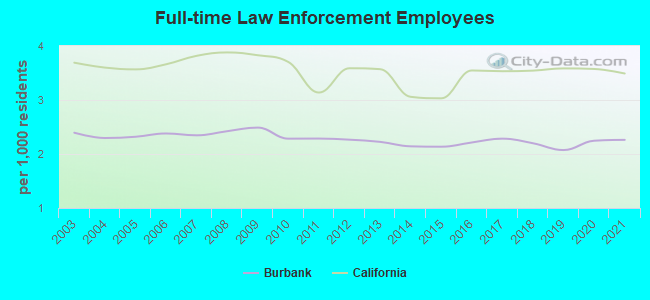
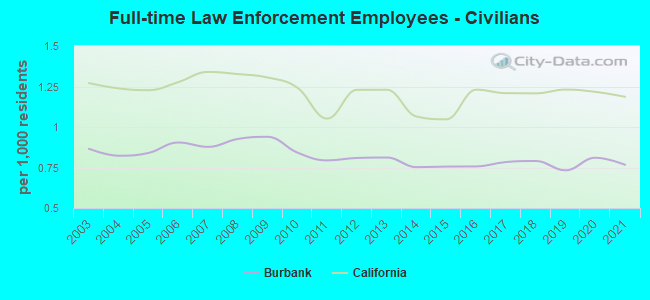
Full-time law enforcement employees in 2021, including police officers: 230 (152 officers - 134 male; 18 female).
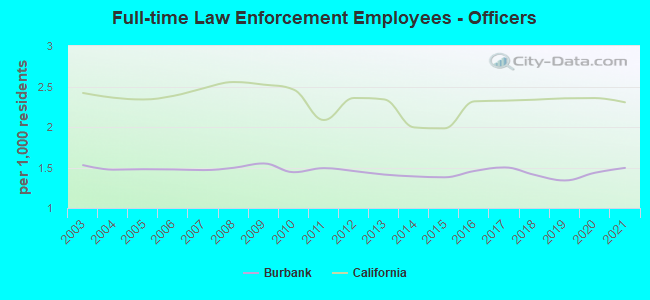
| Officers per 1,000 residents here: | 1.49 |
| California average: | 2.30 |
Full-time law enforcement employees in 2020, including police officers: 230 (147 officers - 127 male; 20 female).
| Officers per 1,000 residents here: | 1.44 |
| California average: | 2.36 |
Full-time law enforcement employees in 2019, including police officers: 215 (139 officers - 120 male; 19 female).
| Officers per 1,000 residents here: | 1.34 |
| California average: | 2.35 |
Full-time law enforcement employees in 2018, including police officers: 231 (148 officers - 128 male; 20 female).
| Officers per 1,000 residents here: | 1.41 |
| California average: | 2.34 |
Full-time law enforcement employees in 2017, including police officers: 239 (157 officers - 136 male; 21 female).
| Officers per 1,000 residents here: | 1.50 |
| California average: | 2.32 |
Full-time law enforcement employees in 2016, including police officers: 234 (154 officers - 137 male; 17 female).
| Officers per 1,000 residents here: | 1.46 |
| California average: | 2.32 |
Full-time law enforcement employees in 2015, including police officers: 226 (146 officers - 127 male; 19 female).
| Officers per 1,000 residents here: | 1.38 |
| California average: | 1.98 |
Full-time law enforcement employees in 2014, including police officers: 225 (146 officers - 131 male; 15 female).
| Officers per 1,000 residents here: | 1.39 |
| California average: | 2.00 |
Full-time law enforcement employees in 2013, including police officers: 233 (148 officers - 134 male; 14 female).
| Officers per 1,000 residents here: | 1.41 |
| California average: | 2.34 |
Full-time law enforcement employees in 2012, including police officers: 238 (153 officers - 138 male; 15 female).
| Officers per 1,000 residents here: | 1.46 |
| California average: | 2.36 |
Full-time law enforcement employees in 2011, including police officers: 239 (156 officers - 141 male; 15 female).
| Officers per 1,000 residents here: | 1.49 |
| California average: | 2.09 |
Full-time law enforcement employees in 2010, including police officers: 236 (149 officers - 138 male; 11 female).
| Officers per 1,000 residents here: | 1.44 |
| California average: | 2.46 |
Full-time law enforcement employees in 2009, including police officers: 257 (160 officers - 150 male; 10 female).
| Officers per 1,000 residents here: | 1.55 |
| California average: | 2.52 |
Full-time law enforcement employees in 2008, including police officers: 251 (155 officers - 143 male; 12 female).
| Officers per 1,000 residents here: | 1.50 |
| California average: | 2.55 |
Full-time law enforcement employees in 2007, including police officers: 246 (154 officers - 141 male; 13 female).
| Officers per 1,000 residents here: | 1.47 |
| California average: | 2.48 |
Full-time law enforcement employees in 2006, including police officers: 250 (155 officers - 144 male; 11 female).
| Officers per 1,000 residents here: | 1.48 |
| California average: | 2.38 |
Full-time law enforcement employees in 2005, including police officers: 243 (155 officers - 143 male; 12 female).
| Officers per 1,000 residents here: | 1.48 |
| California average: | 2.34 |
Full-time law enforcement employees in 2004, including police officers: 240 (154 officers - 142 male; 12 female).
| Officers per 1,000 residents here: | 1.47 |
| California average: | 2.36 |
Full-time law enforcement employees in 2003, including police officers: 249 (159 officers - 148 male; 11 female).
| Officers per 1,000 residents here: | 1.53 |
| California average: | 2.42 |