Estimated zip code population in 2022: 31,889 Zip code population in 2010: 30,778 Zip code population in 2000: 29,235
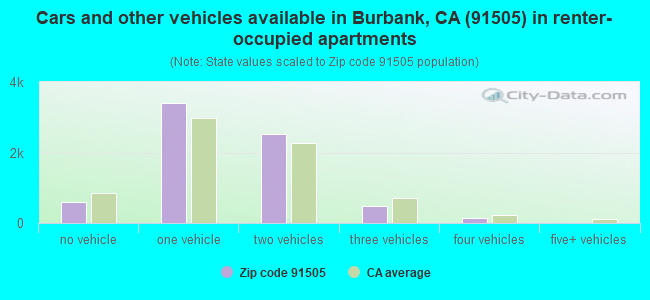
Houses and condos: 14,419 Renter-occupied apartments: 7,138
% of renters here:
54%
State:
44%
March 2022 cost of living index in zip code 91505: 137.5 (high, U.S. average is 100)
Land area: 5.0 sq. mi. Water area: 0.0 sq. mi.
Population density: 6,327 people per square mile
(high).
OSM Map
General Map
Google Map
MSN Map
OSM Map
General Map
Google Map
MSN Map
OSM Map
General Map
Google Map
MSN Map
OSM Map
General Map
Google Map
MSN Map
Please wait while loading the map...
Real estate property taxes paid for housing units in 2022:
This zip code:
0.5% ($5,030)
California:
0.7% ($4,831)
Median real estate property taxes paid for housing units with mortgages in 2022: $5,895 (0.6%) Median real estate property taxes paid for housing units with no mortgage in 2022: $3,354 (0.3%)
Estimated median house/condo value in 2022: $1,006,799
91505:
$1,006,799
California:
$715,900
According to our research of California and other state lists, there were 15 registered sex offenders living in 91505 zip code as of April 27, 2024. The ratio of all residents to sex offenders in zip code 91505 is 2,095 to 1. The ratio of registered sex offenders to all residents in this zip code is much lower than the state average.
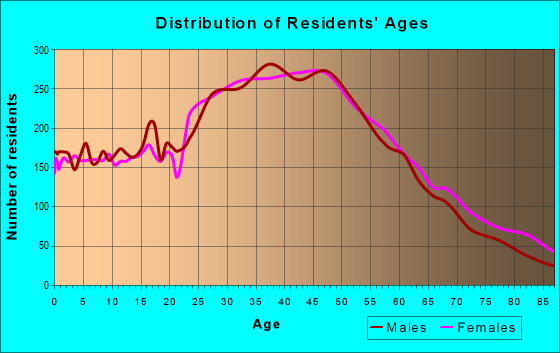
Median resident age:
This zip code:
40.0 years
California median age:
37.9 years
Average household size:
This zip code:
2.4 people
California:
2.8 people
Averages for the 2020 tax year for zip code 91505, filed in 2021:
Average Adjusted Gross Income (AGI) in 2020: $99,585 (Individual Income Tax Returns)
Here:
$99,585
State:
$95,910
Salary/wage: $87,050 (reported on 80.7% of returns)
Here:
$87,050
State:
$77,331
(% of AGI for various income ranges: 1058.9% for AGIs below $25k, 4002.3% for AGIs $25k-50k, 7230.1% for AGIs $50k-75k, 10988.7% for AGIs $75k-100k, 22077.8% for AGIs $100k-200k, 89101.3% for AGIs over 200k)
Taxable interest for individuals: $1,578 (reported on 43.0% of returns)
This zip code:
$1,578
California:
$2,294
(% of AGI for various income ranges: 27.9% for AGIs below $25k, 28.1% for AGIs $25k-50k, 72.8% for AGIs $50k-75k, 93.7% for AGIs $75k-100k, 160.2% for AGIs $100k-200k, 997.1% for AGIs over 200k)
Ordinary dividends: $6,404 (reported on 25.5% of returns)
Here:
$6,404
State:
$10,949
(% of AGI for various income ranges: 41.2% for AGIs below $25k, 53.4% for AGIs $25k-50k, 98.4% for AGIs $50k-75k, 179.1% for AGIs $75k-100k, 377.3% for AGIs $100k-200k, 2926.5% for AGIs over 200k)
Net capital gain/loss in AGI: +$17,861 (reported on 23.8% of returns)
Here:
+$17,861
State:
+$49,306
(% of AGI for various income ranges: 21.1% for AGIs below $25k, 52.5% for AGIs $25k-50k, 111.5% for AGIs $50k-75k, 214.1% for AGIs $75k-100k, 568.8% for AGIs $100k-200k, 10574.0% for AGIs over 200k)
Profit/loss from business: +$11,654 (reported on 26.3% of returns)
Here:
+$11,654
State:
+$15,671
(% of AGI for various income ranges: 240.1% for AGIs below $25k, 349.5% for AGIs $25k-50k, 412.4% for AGIs $50k-75k, 474.1% for AGIs $75k-100k, 662.4% for AGIs $100k-200k, 2954.4% for AGIs over 200k)
Taxable individual retirement arrangement distribution: $18,024 (reported on 7.3% of returns)
91505:
$18,024
California:
$23,505
(% of AGI for various income ranges: 69.6% for AGIs below $25k, 101.9% for AGIs $25k-50k, 145.9% for AGIs $50k-75k, 324.6% for AGIs $75k-100k, 413.0% for AGIs $100k-200k, 1087.6% for AGIs over 200k)
Self-employed (Keogh) retirement plans: $21,227 (reported on 0.9% of returns)
91505:
$21,227
California:
$30,163
(% of AGI for various income ranges: 23.9% for AGIs $50k-75k, 34.0% for AGIs $100k-200k, 404.2% for AGIs over 200k)
Total itemized deductions: $36,870 (reported on 19.5% of returns)
Here:
$36,870
State:
$39,517
(% of AGI for various income ranges: 139.8% for AGIs below $25k, 250.6% for AGIs $25k-50k, 589.3% for AGIs $50k-75k, 1032.3% for AGIs $75k-100k, 2319.6% for AGIs $100k-200k, 10033.5% for AGIs over 200k)
Charity contributions: $7,023 (reported on 16.6% of returns)
Here:
$7,023
State:
$12,598
(% of AGI for various income ranges: 4.8% for AGIs below $25k, 22.2% for AGIs $25k-50k, 60.0% for AGIs $50k-75k, 113.1% for AGIs $75k-100k, 288.5% for AGIs $100k-200k, 2254.0% for AGIs over 200k)
Taxes paid: $8,865 (reported on 19.4% of returns)
91505:
$8,865
State:
$8,807
(% of AGI for various income ranges: 24.8% for AGIs below $25k, 56.1% for AGIs $25k-50k, 147.1% for AGIs $50k-75k, 319.6% for AGIs $75k-100k, 722.3% for AGIs $100k-200k, 1789.5% for AGIs over 200k)
Earned income credit: $1,209 (reported on 8.6% of returns)
Here:
$1,209
State:
$2,074
(% of AGI for various income ranges: 43.7% for AGIs below $25k, 31.3% for AGIs $25k-50k)
Percentage of individuals using paid preparers for their 2020 taxes: 93.2%
Here:
93%
State:
92%
(% for various income ranges: 90.9% for AGIs below $25k, 93.4% for AGIs $25k-50k, 94.1% for AGIs $50k-75k, 93.7% for AGIs $75k-100k, 94.0% for AGIs $100k-200k, 95.7% for AGIs over 200k)
Averages for the 2012 tax year for zip code 91505, filed in 2013:
Average Adjusted Gross Income (AGI) in 2012: $74,647 (Individual Income Tax Returns)
Here:
$74,647
State:
$72,726
Salary/wage: $65,442 (reported on 83.5% of returns)
Here:
$65,442
State:
$59,079
(% of AGI for various income ranges: 67.6% for AGIs below $25k, 79.1% for AGIs $25k-50k, 80.3% for AGIs $50k-75k, 81.9% for AGIs $75k-100k, 83.8% for AGIs $100k-200k, 53.9% for AGIs over 200k)
Taxable interest for individuals: $1,509 (reported on 41.1% of returns)
This zip code:
$1,509
California:
$2,146
(% of AGI for various income ranges: 1.4% for AGIs below $25k, 0.7% for AGIs $25k-50k, 0.5% for AGIs $50k-75k, 0.5% for AGIs $75k-100k, 0.4% for AGIs $100k-200k, 1.5% for AGIs over 200k)
Ordinary dividends: $7,134 (reported on 20.7% of returns)
Here:
$7,134
State:
$9,308
(% of AGI for various income ranges: 2.0% for AGIs below $25k, 1.0% for AGIs $25k-50k, 1.0% for AGIs $50k-75k, 0.9% for AGIs $75k-100k, 0.8% for AGIs $100k-200k, 4.5% for AGIs over 200k)
Net capital gain/loss in AGI: +$29,660 (reported on 16.9% of returns)
Here:
+$29,660
State:
+$30,460
(% of AGI for various income ranges: 0.3% for AGIs $50k-75k, 0.2% for AGIs $75k-100k, 0.8% for AGIs $100k-200k, 22.3% for AGIs over 200k)
Profit/loss from business: +$12,213 (reported on 25.1% of returns)
Here:
+$12,213
State:
+$17,064
(% of AGI for various income ranges: 14.1% for AGIs below $25k, 6.4% for AGIs $25k-50k, 3.3% for AGIs $50k-75k, 3.3% for AGIs $75k-100k, 3.1% for AGIs $100k-200k, 3.2% for AGIs over 200k)
Taxable individual retirement arrangement distribution: $14,316 (reported on 8.0% of returns)
91505:
$14,316
California:
$19,557
(% of AGI for various income ranges: 3.0% for AGIs below $25k, 1.9% for AGIs $25k-50k, 1.9% for AGIs $50k-75k, 1.6% for AGIs $75k-100k, 1.4% for AGIs $100k-200k, 1.1% for AGIs over 200k)
Self-employment retirement plans: $16,243 (reported on 0.9% of returns)
91505:
$16,243
California:
$24,530
(% of AGI for various income ranges: 0.3% for AGIs $50k-75k, 0.2% for AGIs $100k-200k, 0.3% for AGIs over 200k)
Total itemized deductions: $30,016 (24% of AGI, reported on 43.6% of returns)
Here:
$30,016
State:
$34,004
Here:
23.7% of AGI
State:
22.7% of AGI
(% of AGI for various income ranges: 15.4% for AGIs below $25k, 14.2% for AGIs $25k-50k, 15.7% for AGIs $50k-75k, 18.4% for AGIs $75k-100k, 19.8% for AGIs $100k-200k, 17.3% for AGIs over 200k)
Charity contributions: $3,810 (reported on 36.3% of returns)
Here:
$3,810
State:
$4,659
(% of AGI for various income ranges: 0.7% for AGIs below $25k, 1.0% for AGIs $25k-50k, 1.4% for AGIs $50k-75k, 1.6% for AGIs $75k-100k, 1.6% for AGIs $100k-200k, 2.9% for AGIs over 200k)
Taxes paid: $11,522 (reported on 43.6% of returns)
91505:
$11,522
State:
$14,448
(% of AGI for various income ranges: 2.7% for AGIs below $25k, 2.9% for AGIs $25k-50k, 4.3% for AGIs $50k-75k, 6.1% for AGIs $75k-100k, 7.6% for AGIs $100k-200k, 9.4% for AGIs over 200k)
Earned income credit: $1,551 (reported on 11.0% of returns)
Here:
$1,551
State:
$2,286
(% of AGI for various income ranges: 3.4% for AGIs below $25k, 0.5% for AGIs $25k-50k)
Percentage of individuals using paid preparers for their 2012 taxes: 67.0%
Here:
67%
State:
64%
(% for various income ranges: 61.6% for AGIs below $25k, 64.3% for AGIs $25k-50k, 66.4% for AGIs $50k-75k, 71.1% for AGIs $75k-100k, 74.3% for AGIs $100k-200k, 86.2% for AGIs over 200k)
Averages for the 2004 tax year for zip code 91505, filed in 2005:
Average Adjusted Gross Income (AGI) in 2004: $55,291 (Individual Income Tax Returns)
Here:
$55,291
State:
$58,600
Salary/wage: $51,186 (reported on 83.6% of returns)
Here:
$51,186
State:
$49,455
(% of AGI for various income ranges: 163.5% for AGIs below $10k, 70.7% for AGIs $10k-25k, 83.8% for AGIs $25k-50k, 85.1% for AGIs $50k-75k, 86.0% for AGIs $75k-100k, 67.9% for AGIs over 100k)
Taxable interest for individuals: $1,413 (reported on 51.8% of returns)
This zip code:
$1,413
California:
$2,365
(% of AGI for various income ranges: 12.3% for AGIs below $10k, 2.9% for AGIs $10k-25k, 1.2% for AGIs $25k-50k, 1.1% for AGIs $50k-75k, 1.2% for AGIs $75k-100k, 1.1% for AGIs over 100k)
Taxable dividends: $2,922 (reported on 23.9% of returns)
Here:
$2,922
State:
$4,746
(% of AGI for various income ranges: 8.1% for AGIs below $10k, 1.7% for AGIs $10k-25k, 0.8% for AGIs $25k-50k, 0.7% for AGIs $50k-75k, 0.7% for AGIs $75k-100k, 1.8% for AGIs over 100k)
Net capital gain/loss: +$11,921 (reported on 19.9% of returns)
Here:
+$11,921
State:
+$23,418
(% of AGI for various income ranges: -2.5% for AGIs below $10k, -0.5% for AGIs $10k-25k, 0.1% for AGIs $25k-50k, 0.3% for AGIs $50k-75k, 1.0% for AGIs $75k-100k, 9.8% for AGIs over 100k)
Profit/loss from business: +$10,708 (reported on 23.7% of returns)
Here:
+$10,708
State:
+$16,826
(% of AGI for various income ranges: 13.1% for AGIs below $10k, 10.1% for AGIs $10k-25k, 5.2% for AGIs $25k-50k, 3.3% for AGIs $50k-75k, 3.0% for AGIs $75k-100k, 4.6% for AGIs over 100k)
IRA payment deduction: $2,900 (reported on 3.4% of returns)
91505:
$2,900
California:
$3,192
(% of AGI for various income ranges: 0.9% for AGIs below $10k, 0.3% for AGIs $10k-25k, 0.3% for AGIs $25k-50k, 0.2% for AGIs $50k-75k, 0.2% for AGIs $75k-100k, 0.1% for AGIs over 100k)
Self-employed pension: $13,126 (reported on 1.0% of returns)
Here:
$13,126
California:
$17,688
(% of AGI for various income ranges: 0.1% for AGIs $10k-25k, 0.1% for AGIs $25k-50k, 0.1% for AGIs $50k-75k, 0.2% for AGIs $75k-100k, 0.4% for AGIs over 100k)
Total itemized deductions: $24,119 (27% of AGI, reported on 45.0% of returns)
Here:
$24,119
State:
$28,113
Here:
26.8% of AGI
State:
25.3% of AGI
(% of AGI for various income ranges: 47.0% for AGIs below $10k, 16.9% for AGIs $10k-25k, 16.2% for AGIs $25k-50k, 20.8% for AGIs $50k-75k, 22.3% for AGIs $75k-100k, 19.6% for AGIs over 100k)
Charity contributions deductions: $3,010 (3% of AGI, reported on 40.4% of returns)
Here:
$3,010
State:
$3,923
Here:
3.2% of AGI
State:
3.3% of AGI
(% of AGI for various income ranges: 2.6% for AGIs below $10k, 1.2% for AGIs $10k-25k, 1.6% for AGIs $25k-50k, 2.2% for AGIs $50k-75k, 2.3% for AGIs $75k-100k, 2.5% for AGIs over 100k)
Total tax: $8,182 (reported on 82.6% of returns)
91505:
$8,182
State:
$10,761
(% of AGI for various income ranges: 8.5% for AGIs below $10k, 5.3% for AGIs $10k-25k, 8.3% for AGIs $25k-50k, 10.1% for AGIs $50k-75k, 10.8% for AGIs $75k-100k, 16.4% for AGIs over 100k)
Earned income credit: $1,293 (reported on 10.1% of returns)
Here:
$1,293
State:
$1,763
Percentage of individuals using paid preparers for their 2004 taxes: 69.9%
Here:
70%
State:
66%
(% for various income ranges: 62.3% for AGIs below $10k, 68.1% for AGIs $10k-25k, 66.8% for AGIs $25k-50k, 71.2% for AGIs $50k-75k, 77.3% for AGIs $75k-100k, 82.0% for AGIs over 100k)
Likely homosexual households (counted as self-reported same-sex unmarried-partner households)
Lesbian couples: 0.3% of all households
Gay men: 0.4% of all households
Household received Food Stamps/SNAP in the past 12 months: 767 Household did not receive Food Stamps/SNAP in the past 12 months: 12,282
Women who had a birth in the past 12 months: 159 (135 now married, 24 unmarried) Women who did not have a birth in the past 12 months: 7,715 (3,052 now married, 4,663 unmarried)
Housing units in zip code 91505 with a mortgage: 4,216 (555 second mortgage, 20 home equity loan, 463 both second mortgage and home equity loan) Houses without a mortgage: 40
Median monthly owner costs for units with a mortgage: $3,161 Median monthly owner costs for units without a mortgage: $682
Residents with income below the poverty level in 2022:
This zip code:
9.0%
Whole state:
12.2%
Residents with income below 50% of the poverty level in 2022:
This zip code:
3.6%
Whole state:
6.2%
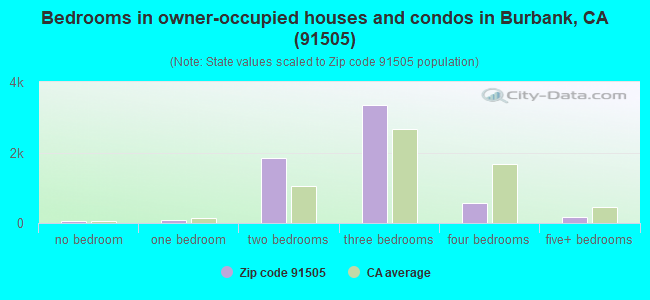
Median number of rooms in houses and condos:
Here:
5.9
State:
6.0
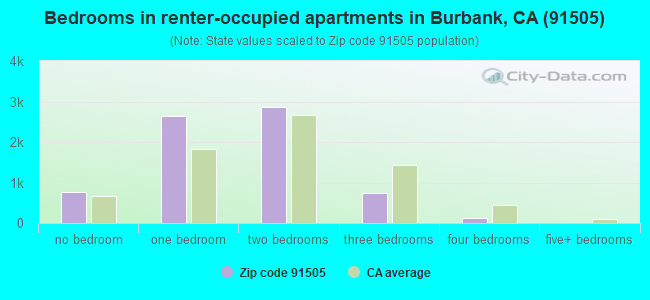
Median number of rooms in apartments:
Here:
3.4
State:
3.9
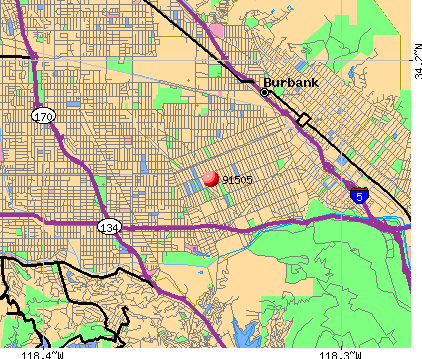
Notable locations in this zip code not listed on our city pages
Notable locations in zip code 91505: Jefferson Avenue Pumping Station (A), City of Burbank Valley Pumping Plant (B), Columbia Ranch (C), Warner Brothers Studios (D), NBC-TV Studios (E), Northwest Park Branch Burbank Public Library (F), Buena Vista Branch Burbank Public Library (G), Warner Brothers Studios Fire Department (H), Bob Hope Airport Fire Department (I), City of Burbank Fire Department Station 12 (J). Display/hide their locations on the map
Churches in zip code 91505 include: Magnolia Park Community Methodist Church (A), Second Church of Christ Scientist (B), Westminster Presbyterian Church (C), Church of Christ (D), Kingdom Hall of Jehovahs Witnesses (E), Little White Chapel (F), Victory United Brethren In Christ Church (G), Village Church (H), American Lutheran Church (I). Display/hide their locations on the map
Parks in zip code 91505 include: Pacific Park (1), Valley Park (2), Verdugo Recreation Center (3), Buena Vista Park (4), Johnny Carson Park (5), Ralph Foy Park (6), Whitnall Highway Park (7). Display/hide their locations on the map
4,716 married couples with children.
995 single-parent households (343 men, 652 women).
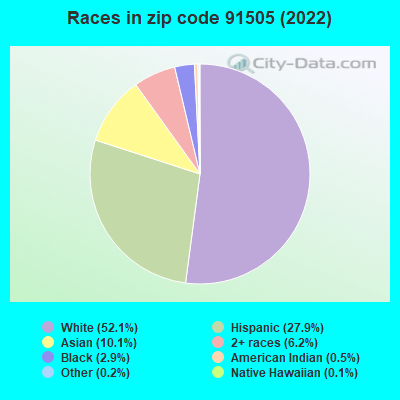
73.4% of residents of 91505 zip code speak English at home.
12.8% of residents speak Spanish at home (70% very well, 19% well, 8% not well, 3% not at all).
5.6% of residents speak other Indo-European language at home (67% very well, 20% well, 7% not well, 7% not at all).
7.5% of residents speak Asian or Pacific Island language at home (65% very well, 28% well, 7% not well).
0.4% of residents speak other language at home (66% very well, 3% well, 23% not well, 7% not at all).
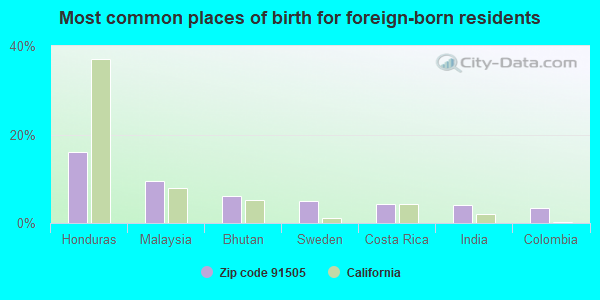
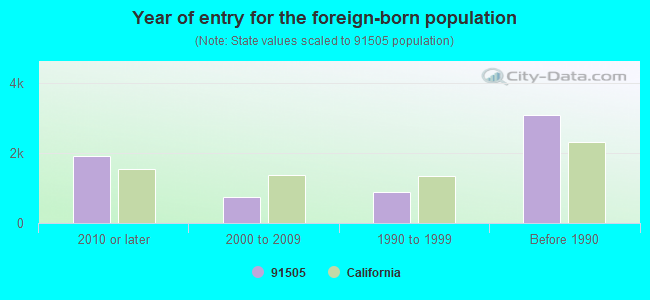
Foreign born population: 6,093 (19.1%) (63.7% of them are naturalized citizens)
Major facilities with environmental interests located in this zip code:
LOCKHEED CALIF COMPANY (2555 N HOLLYWOOD WAY in BURBANK, CA) . Federal Facility. UNDETERMINED OR UNKNOWN AGENCY AFFILIATION
STATE MASTER (California - Hazardous Waste Tracking) - HAZARDOU WASTE PROGRAM (Integrated Compliance Information System) - ICIS-09-1991-0016, FORMAL ENFORCEMENT ACTION COMPLIANCE ACTIVITY (Tracking inspections of insecticide, fungicide, and rodenticide, and toxic substances) CRITERIA AND HAZARDOUS AIR POLLUTANT INVENTORY (Inventory of air pollution sources) HAZARDOUS WASTE BIENNIAL REPORTER (Resource Conservation and Recovery Act (tracking hazardous waste)) Large Quantity Generators, more that 1000 kg of hazardous waste/month (Resource Conservation and Recovery Act (tracking hazardous waste)) TRI REPORTER (Tracking of toxic chemicals releasing facilities) Business SIC classification: AIRCRAFT; AIRCRAFT PARTS AND AUXILIARY EQUIPMENT; LIBRARIES Alternative names: LOCKHEED ADVANCED DEVELOPMENT CO., LOCKHEED AERONAUTICAL SYSTEMS, LOCKHEED MARTIN
FOTO KEM FOTO TRONICS (2800 W OLIVE AVE in BURBANK, CA)
AIR MINOR (AIRS/AFS) STATE MASTER (California - Hazardous Waste Tracking) - HAZARDOU WASTE PROGRAM CRITERIA AND HAZARDOUS AIR POLLUTANT INVENTORY (Inventory of air pollution sources) Large Quantity Generators, more that 1000 kg of hazardous waste/month (Resource Conservation and Recovery Act (tracking hazardous waste)) Business SIC classification: PHOTOFINISHING LABORATORIES Business NAICS classification: COMMERCIAL, INDUSTRIAL, AND INSTITUTIONAL ELECTRIC LIGHTING FIXTURE MANUFACTURING. Alternative names: FOTO KEM INDUSTRIES, INC
EQUILON ENTERPRISES (550 N HOLLYWOOD WY in BURBANK, CA) . Federal Facility
STATE MASTER (California - Hazardous Waste Tracking) - HAZARDOU WASTE PROGRAM Large Quantity Generators, more that 1000 kg of hazardous waste/month (Resource Conservation and Recovery Act (tracking hazardous waste)) Organizations: SHELL OIL PRODUCTS US (CONTACT/OPERATOR)
, EQUILON ENTERPRISES LLC (CONTACT/OWNER)
Alternative names: SHELL OIL CO
AGFA CORPORATION (3800 WEST VANOWEN STREET in BURBANK, CA)
STATE MASTER (California - Hazardous Waste Tracking) - HAZARDOU WASTE PROGRAM HAZARDOUS WASTE BIENNIAL REPORTER (Resource Conservation and Recovery Act (tracking hazardous waste)) Small Quantity Generators, between 100 kg and 1000 kg of hazardous waste/month (Resource Conservation and Recovery Act (tracking hazardous waste)) Business NAICS classification: COMMERCIAL LITHOGRAPHIC PRINTING.; DIGITAL PRINTING. Organizations: LAGRAPHICO (CONTACT/OPERATOR)
Alternative names: AGFA DIVISION, LA GRAPHICO INC
LOCKHEED MARTIN CORP (2960 N HOLLYWOOD WY in BURBANK, CA)
STATE MASTER (California - Hazardous Waste Tracking) - HAZARDOU WASTE PROGRAM Large Quantity Generators, more that 1000 kg of hazardous waste/month (Resource Conservation and Recovery Act (tracking hazardous waste)) - notification
MILT & EDIE'S DRYCLEANERS (4021 W ALAMEDA in BURBANK, CA) . Federal Facility
STATE MASTER (California - Hazardous Waste Tracking) - HAZARDOU WASTE PROGRAM CRITERIA AND HAZARDOUS AIR POLLUTANT INVENTORY (Inventory of air pollution sources) Small Quantity Generators, between 100 kg and 1000 kg of hazardous waste/month (Resource Conservation and Recovery Act (tracking hazardous waste)) - notification Business SIC classification: DRYCLEANING PLANTS, EXCEPT RUG CLEANING Organizations: MILTON CHORTKOFF (CONTACT/OWNER)
Alternative names: MILT AND MICHAEL CLEANERS
HYDRA-ELECTRIC CO (3151 KENWOOD ST in BURBANK, CA)
STATE MASTER (California - Hazardous Waste Tracking) - HAZARDOU WASTE PROGRAM Small Quantity Generators, between 100 kg and 1000 kg of hazardous waste/month (Resource Conservation and Recovery Act (tracking hazardous waste)) - notification Business NAICS classification: SWITCHGEAR AND SWITCHBOARD APPARATUS MANUFACTURING. Organizations: ALLEN V DAVIS (CONTACT/OWNER)
4MC BURBANK INCORPORATED STUDIO SERVICE (2820 WEST OLIVE AVENUE in BURBANK, CA)
STATE MASTER (California - Hazardous Waste Tracking) - HAZARDOU WASTE PROGRAM CRITERIA AND HAZARDOUS AIR POLLUTANT INVENTORY (Inventory of air pollution sources) Small Quantity Generators, between 100 kg and 1000 kg of hazardous waste/month (Resource Conservation and Recovery Act (tracking hazardous waste)) - notification Business SIC classification: SERVICES ALLIED TO MOTION PICTURE PRODUCTION
F P I INC (3125 DAMON WAY in BURBANK, CA)
STATE MASTER (California - Hazardous Waste Tracking) - HAZARDOU WASTE PROGRAM Small Quantity Generators, between 100 kg and 1000 kg of hazardous waste/month (Resource Conservation and Recovery Act (tracking hazardous waste)) - notification Business NAICS classification: OTHER METAL VALVE AND PIPE FITTING MANUFACTURING.
MILLION AIR (2800 NORTH CLYBOURN AVE in BURBANK, CA)
STATE MASTER (California - Hazardous Waste Tracking) - HAZARDOU WASTE PROGRAM Small Quantity Generators, between 100 kg and 1000 kg of hazardous waste/month (Resource Conservation and Recovery Act (tracking hazardous waste)) Business NAICS classification: NONSCHEDULED CHARTERED PASSENGER AIR TRANSPORTATION. Organizations: MILLION AIR BURBANK (CONTACT/OPERATOR)
, VAN NUYS SKYWAYS DBA MILLION AIR BURBANK (CONTACT/OWNER)
J L FISHER INC (1000 ISABEL ST in BURBANK, CA)
STATE MASTER (California - Hazardous Waste Tracking) - HAZARDOU WASTE PROGRAM Small Quantity Generators, between 100 kg and 1000 kg of hazardous waste/month (Resource Conservation and Recovery Act (tracking hazardous waste)) - notification Organizations: JAMES L FISHER (CONTACT/OWNER)
EARTH STAR INC (3000 N CLYBOURN AVE in BURBANK, CA)
STATE MASTER (California - Hazardous Waste Tracking) - HAZARDOU WASTE PROGRAM Small Quantity Generators, between 100 kg and 1000 kg of hazardous waste/month (Resource Conservation and Recovery Act (tracking hazardous waste)) - notification
CHEVRON STATION NO 92860 (3701 W RIVERSIDE DR in BURBANK, CA)
STATE MASTER (California - Hazardous Waste Tracking) - HAZARDOU WASTE PROGRAM Small Quantity Generators, between 100 kg and 1000 kg of hazardous waste/month (Resource Conservation and Recovery Act (tracking hazardous waste)) - notification Organizations: CHEVRON PRODUCTS CO (CONTACT/OWNER)
Housing units lacking complete plumbing facilities: 0.2% Housing units lacking complete kitchen facilities: 1.2%
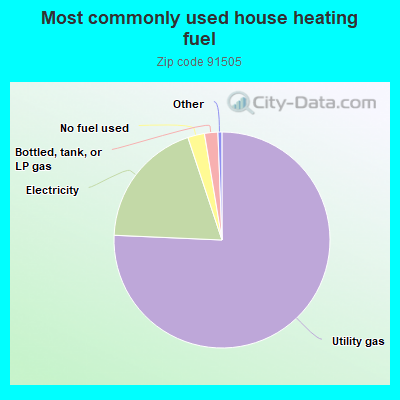
75.7%Utility gas
19.2%Electricity
2.5%No fuel used
2.0%Bottled, tank, or LP gas
Population in 1990: 27,676. Population change in the 1990s: +1,559 (+5.6%).
Place of birth for U.S.-born residents:
This state: 17,815
Northeast: 2,308
Midwest: 2,222
South: 1,901
West: 990
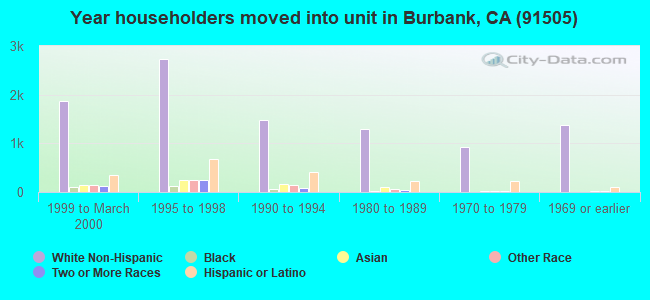
56% of the 91505 zip code residents lived in the same house 5 years ago. Out of people who lived in different houses, 77% lived in this county. Out of people who lived in different counties, 50% lived in California.
89% of the 91505 zip code residents lived in the same house 1 year ago. Out of people who lived in different houses, 54% moved from this county. Out of people who lived in different houses, 10% moved from different county within same state. Out of people who lived in different houses, 20% moved from different state. Out of people who lived in different houses, 19% moved from abroad.
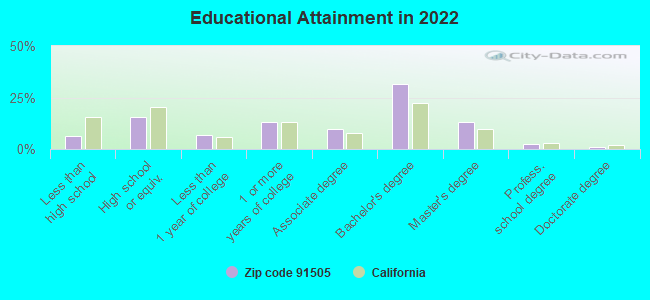
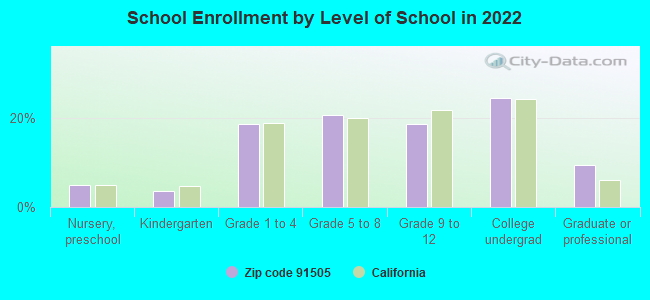
Private vs. public school enrollment:
Students in private schools in grades 1 to 8 (elementary and middle school): 376
Here:
13.1%
California:
10.5%
Students in private schools in grades 9 to 12 (high school): 139
Here:
10.3%
California:
8.5%
Students in private undergraduate colleges: 392
Here:
21.9%
California:
15.9%
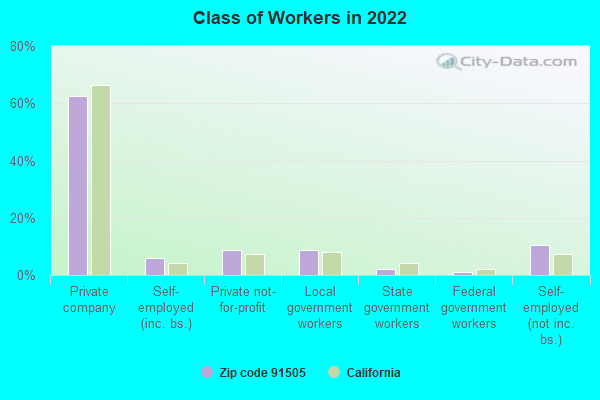
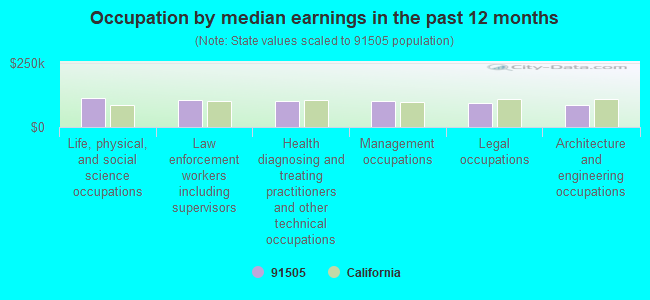
Occupation by median earnings in the past 12 months ($)
113,860Life, physical, and social science occupations
105,937Law enforcement workers including supervisors
102,369Health diagnosing and treating practitioners and other technical occupations
100,798Management occupations
93,951Legal occupations
87,007Architecture and engineering occupations
Companies with biggest federal contracts located in this zip code (BURBANK, CA):
HYDRA-ELECTRIC COMPANY INC (3151 N KENWOOD ST; small business) : $11,994,602 in 491 contractsfrom 1999 to 2006
Contracts for Switches, Miscellaneous Items, Aircraft Hydraulic, Vacuum, and De-icing System Components, Pressure, Temperature, and Humidity Measuring and Controlling Instruments, and moreby Defense Logistics Agency, Navy, Army, U.S. Coast Guard, and others Signed by year:2000: $1,950,868; 2001: $1,159,540; 2002: $1,549,335; 2003: $822,995; 2004: $1,982,541; 2005: $2,771,974; 2006: $1,204,384.
Biggest contracts:
$425,581 with Defense Logistics Agency for Switches. Signed on 2005-06-08. Completion date: 2007-03-10.
$216,089, same as above.Signed on 2002-07-10. Completion date: 2004-07-29.
$212,195, same as above.Signed on 2000-11-22. Completion date: 2003-02-12.
$134,244, same as above.Signed on 2001-09-30. Completion date: 2002-01-08.
KARAGOZIAN & CASE (2550 N HOLLYWOOD WAY STE 5; small business) : $5,893,903 in 33 contractsfrom 1999 to 2006
Contracts for Other Defense -- Applied Research and Exploratory Development (R&D), Weapons -- Management and Support (R&D), Services -- Basic Research (R&D), Other Research and Development -- Applied Research and Exploratory Development (R&D), and moreby Department of Defense, Air Force, Army, Defense Threat Reduction Agency, and others Signed by year:2000: $323,137; 2001: $0; 2002: $1,544,800; 2003: $259,040; 2004: $929,595; 2005: $719,058; 2006: $1,612,273.
Biggest contracts:
$1,445,000 with Department of Defense for Other Defense -- Applied Research and Exploratory Development (R&D). Signed on 2002-09-23. Completion date: 2003-05-30.
$789,634 with Air Force for Weapons -- Management and Support (R&D). Signed on 2004-04-26. Completion date: 2006-08-31.
$406,000 with Department of Defense for Other Defense -- Applied Research and Exploratory Development (R&D). Signed on 1999-11-24. Completion date: 2000-11-30.
$374,997 with Air Force for Weapons -- Management and Support (R&D). Signed on 2006-04-24. Completion date: 2008-07-25.
YANG/MARTINEZ A JOINT VENTURE (847 N HOLLYWOOD WAY STE 10; small business) : $1,904,644 in 26 contractsfrom 2003 to 2006
Contracts for Architect - Engineer Services (including landscaping, interior layout, and designing), Administrative and Service Buildings by Navy Signed by year:2000: $0; 2001: $0; 2002: $0; 2003: $273,840; 2004: $554,959; 2005: $1,051,017; 2006: $24,828.
Biggest contracts:
$515,485 with Navy for Architect - Engineer Services (including landscaping, interior layout, and designing). Signed on 2005-09-13. Completion date: 2006-08-09.
$234,933, same as above.Signed on 2005-09-15. Completion date: 2006-03-15.
$158,843 with Navy for Administrative and Service Buildings. Signed on 2003-09-04. Completion date: 2004-01-28.
$138,521 with Navy for Architect - Engineer Services (including landscaping, interior layout, and designing). Signed on 2004-06-28. Completion date: 2005-01-14.
BARRY WRIGHT CORPORATION (4510 W VANOWEN ST; small business) : $1,560,981 in 15 contractsfrom 2000 to 2006
Contracts for Hardware, Commercial, Hardware, Weapon System, Electrical Hardware and Supplies, Miscellaneous Engine Accessories, Aircraft, and moreby Defense Logistics Agency, Navy Signed by year:2000: $224,961; 2001: $228,102; 2002: $293,389; 2003: $0; 2004: $288,386; 2005: $54,093; 2006: $472,050.
Biggest contracts:
$472,050 with Defense Logistics Agency for Hardware, Commercial. Signed on 2006-02-10. Completion date: 2006-10-08.
$202,774 with Defense Logistics Agency for Hardware, Weapon System. Signed on 2004-11-02. Completion date: 2005-07-05.
$99,994 with Defense Logistics Agency for Hardware, Commercial. Signed on 2002-02-14. Completion date: 2012-03-31.
$99,705, same as above.Signed on 2002-06-03. Completion date: 2004-02-08.
NBC ENTERPRISES, INC (3500 WEST OLIVE AVE 15TH F) : $1,201,430 in 34 contractsfrom 1999 to 2005
Contracts for Miscellaneous Items by American Forces Information Service, Department of Defense Signed by year:2000: $122,976; 2001: $179,256; 2002: $156,351; 2003: $152,642; 2004: $133,116; 2005: $336,525; 2006: $0.
Biggest contracts:
$133,116 with American Forces Information Service for Miscellaneous Items. Signed on 2004-10-14. Completion date: 2002-09-30.
$130,500, same as above.Signed on 2003-10-28. Completion date: 2002-09-30.
$127,944 with Department of Defense for Miscellaneous Items. Signed on 2002-10-08. Completion date: 2002-09-30.
$122,976, same as above.Signed on 2000-10-12. Completion date: 2001-09-30.
GLOBAL EMEDICINE, LLC (2710 WEST BURBANK BOULEVAR; small business) : $1,045,902 in 4 contractsfrom 2002 to 2003
$748,687 with Navy for Other Defense -- Management and Support (R&D). Signed on 2003-09-30. Completion date: 2005-09-30.
$99,802 with Navy for Services -- Basic Research (R&D). Signed on 2003-03-27. Completion date: 2003-09-23.
$99,480 with Air Force for Other Research and Development -- Basic Research (R&D). Taking place in UT. Signed on 2003-01-21. Completion date: 2003-07-28.
$97,933 with Navy for Other Defense -- Operational Systems Development (R&D). Signed on 2002-01-25. Completion date: 2002-06-30.
STILLMAN SEAL CORPORATION (4510 VANOWEN ST; small business) 1000 employees, $0 revenue. : $872,379 in 62 contractsfrom 1999 to 2006
Contracts for Packing and Gasket Materials, Gas Turbines and Jet Engines, Aircraft; Prime Moving, and Components, Airframe Structural Components, Gas Turbines and Jet Engines, Non-Aircraft; and Components, and moreby Defense Logistics Agency, Navy Signed by year:2000: $121,856; 2001: $25,453; 2002: $194,208; 2003: $31,883; 2004: $155,375; 2005: $192,153; 2006: $61,073.
Biggest contracts:
$99,986 with Defense Logistics Agency for Packing and Gasket Materials. Signed on 2002-08-21. Completion date: 2003-02-05.
$90,378 with Defense Logistics Agency for Gas Turbines and Jet Engines, Aircraft; Prime Moving, and Components. Signed on 1999-10-15. Completion date: 2000-02-12.
$45,850, same as above.Signed on 2000-06-21. Completion date: 2000-09-13.
$40,344 with Defense Logistics Agency for Airframe Structural Components. Signed on 2002-07-29. Completion date: 2003-07-22.
ESPN INC (3800 W ALAMEDA AVE # 1750) : $390,000 in 7 contractsfrom 1999 to 2001
Contracts for Miscellaneous Items by Department of Defense Signed by year:2000: $130,000; 2001: $132,500; 2002: $0; 2003: $0; 2004: $0; 2005: $0; 2006: $0.
Biggest contracts:
$130,000 with Department of Defense for Miscellaneous Items. Taking place in NY. Signed on 2000-10-12. Completion date: 2002-09-30.
$127,500, same as above.Signed on 1999-10-25. Completion date: 1999-09-30.
$99,998, same as above.Signed on 2001-11-29. Completion date: 2002-09-30.
$65,000, same as above.Signed on 2000-12-18. Completion date: 2002-09-30.
TELEX COMMUNICATIONS, INC (2550 N HOLLYWOOD WAY STE 2) : $238,574 in 6 contractsfrom 2000 to 2005
Contracts for Communications Security Equipment and Components, Miscellaneous Communication Equipment, Intercommunication and Public Address Systems, Except Airborne, Radio and Television Communication Equipment, Except Airborne, and moreby Air Force, Broadcasting Board of Governors, American Forces Information Service Signed by year:2000: $70,000; 2001: $0; 2002: $0; 2003: $104,482; 2004: $42,595; 2005: $21,497; 2006: $0.
Biggest contracts:
$104,482 with Air Force for Communications Security Equipment and Components. Signed on 2003-05-16. Completion date: 2003-07-16.
$70,000 with Broadcasting Board of Governors for Miscellaneous Communication Equipment. Signed on 2000-02-15. Completion date: 2000-02-15.
$37,109 with Air Force for Intercommunication and Public Address Systems, Except Airborne. Signed on 2004-09-30. Completion date: 2004-11-26.
$11,453 with American Forces Information Service for Radio and Television Communication Equipment, Except Airborne. Signed on 2005-04-13. Completion date: 2005-05-16.
FPI INC (3125 N DAMON WAY; small business) : $230,945 in 9 contractsfrom 2000 to 2004
Contracts for Valves, Powered, Hose, Pipe, Tube, Lubrication, and Railing Fittings, Valves, Nonpowered, Gas Turbines and Jet Engines, Non-Aircraft; and Components, and moreby NASA, Navy, Defense Logistics Agency Signed by year:2000: $74,994; 2001: $29,000; 2002: $40,000; 2003: $45,916; 2004: $41,035; 2005: $0; 2006: $0.
Biggest contracts:
$46,000 with NASA for Valves, Powered. Signed on 2000-07-15. Completion date: 2000-12-15.
$45,916 with Navy for Hose, Pipe, Tube, Lubrication, and Railing Fittings. Signed on 2003-09-11. Completion date: 2004-03-11.
$40,000 with NASA for Valves, Nonpowered. Signed on 2002-05-15. Completion date: 2002-08-15.
$36,000 with Defense Logistics Agency for Valves, Nonpowered. Signed on 2004-02-03. Completion date: 2004-06-01.
Top industries in this zip code by the number of employees in 2005:
Information: Motion Picture and Video Production (over 1000: 2, 500-999: 1, 250-499: 1, 100-249: 3, 50-99: 4, 20-49: 7, 10-19: 6, 5-9: 8, 1-4: 51)
Educational Services: Colleges, Universities, and Professional Schools (over 1000: 1, 50-99: 1)
Professional, Scientific, and Technical Services: Administrative Management and General Management Consulting Services (over 1000: 1, 20-49: 1, 10-19: 1, 1-4: 4)
Information: Teleproduction and Other Postproduction Services (250-499: 1, 100-249: 3, 50-99: 4, 20-49: 8, 10-19: 5, 5-9: 4, 1-4: 15)
Arts, Entertainment, and Recreation: All Other Amusement and Recreation Industries (over 1000: 1, 1-4: 2)
Administrative and Support and Waste Management and Remediation Services: Security Guards and Patrol Services (250-499: 1, 100-249: 3, 50-99: 1, 1-4: 1)
2005 - 2018 National Fire Incident Reporting System (NFIRS) incidents
Based on the data from the years 2005 - 2018 the average number of fire incidents per year is 49. The highest number of reported fires - 65 took place in 2016, and the least - 28 in 2010. The data has a declining trend.
When looking into fire subcategories, the most reports belonged to: Structure Fires (49.4%), and Mobile Property/Vehicle Fires (22.9%).
Fire incident types reported to NFIRS in Zip Code 91505


 Nearest zip codes: 91506, 91601, 91602, 91608, 91504, 91502.
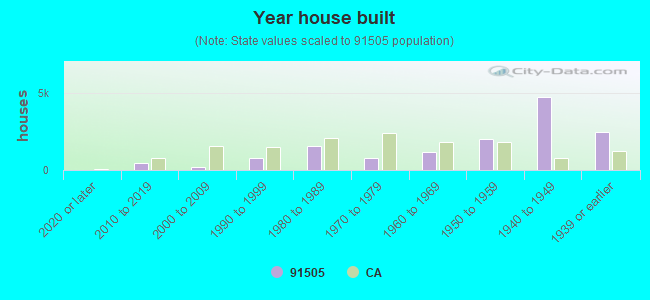


 . Federal Facility. UNDETERMINED OR UNKNOWN AGENCY AFFILIATION
 Based on the data from the years 2005 - 2018 the average number of fire incidents per year is 49. The highest number of reported fires - 65 took place in 2016, and the least - 28 in 2010. The data has a declining trend.
 When looking into fire subcategories, the most reports belonged to: Structure Fires (49.4%), and Mobile Property/Vehicle Fires (22.9%).