Estimated zip code population in 2022: 19,396 Zip code population in 2010: 18,904 Zip code population in 2000: 18,530
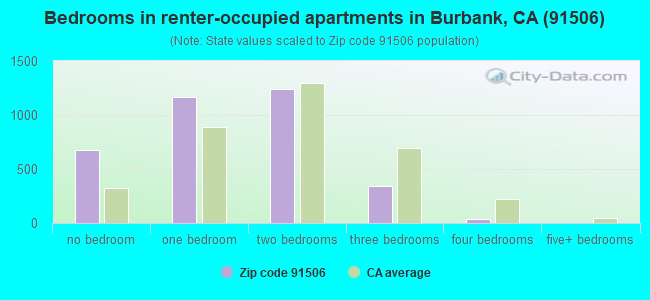
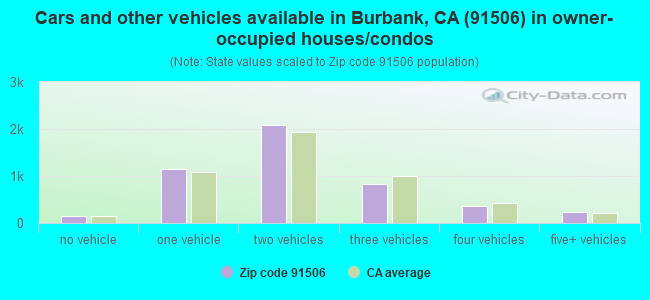
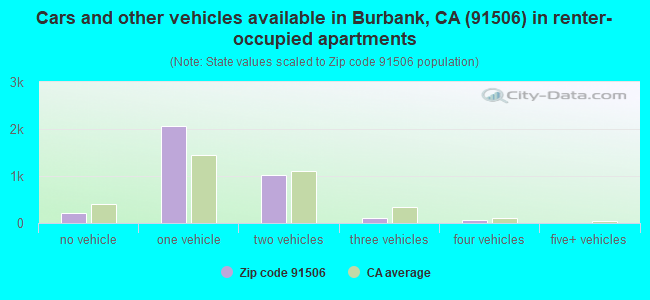
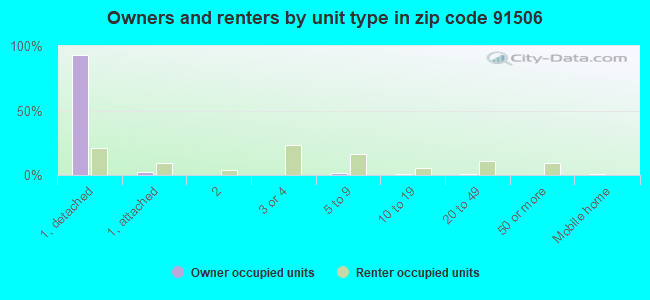
Houses and condos: 8,811 Renter-occupied apartments: 3,449
% of renters here:
42%
State:
44%
March 2022 cost of living index in zip code 91506: 137.3 (high, U.S. average is 100)
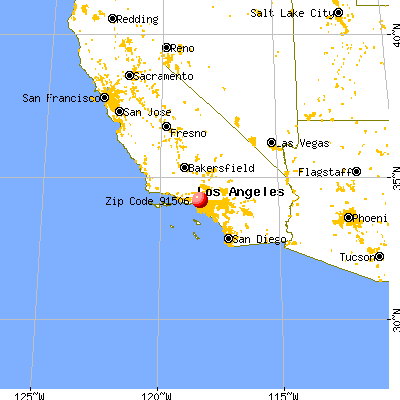
Land area: 2.4 sq. mi. Water area: 0.0 sq. mi.
Population density: 7,927 people per square mile
(high).
OSM Map
General Map
Google Map
MSN Map
OSM Map
General Map
Google Map
MSN Map
OSM Map
General Map
Google Map
MSN Map
OSM Map
General Map
Google Map
MSN Map
Please wait while loading the map...
Real estate property taxes paid for housing units in 2022:
This zip code:
0.5% ($5,577)
California:
0.7% ($4,831)
Median real estate property taxes paid for housing units with mortgages in 2022: $6,214 (0.6%) Median real estate property taxes paid for housing units with no mortgage in 2022: $3,037 (0.3%)
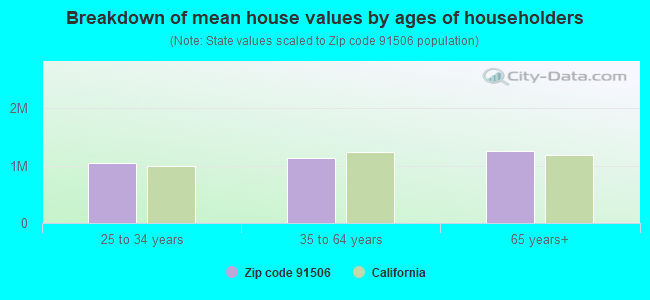
Estimated median house/condo value in 2022: $1,069,344
91506:
$1,069,344
California:
$715,900
According to our research of California and other state lists, there were 10 registered sex offenders living in 91506 zip code as of April 27, 2024. The ratio of all residents to sex offenders in zip code 91506 is 1,838 to 1. The ratio of registered sex offenders to all residents in this zip code is much lower than the state average.
Median resident age:
This zip code:
42.4 years
California median age:
37.9 years
Average household size:
This zip code:
2.3 people
California:
2.8 people
Averages for the 2020 tax year for zip code 91506, filed in 2021:
Average Adjusted Gross Income (AGI) in 2020: $92,410 (Individual Income Tax Returns)
Here:
$92,410
State:
$95,910
Salary/wage: $80,216 (reported on 80.1% of returns)
Here:
$80,216
State:
$77,331
(% of AGI for various income ranges: 1098.7% for AGIs below $25k, 3882.6% for AGIs $25k-50k, 7178.0% for AGIs $50k-75k, 11263.6% for AGIs $75k-100k, 21649.1% for AGIs $100k-200k, 75829.7% for AGIs over 200k)
Taxable interest for individuals: $1,389 (reported on 42.9% of returns)
This zip code:
$1,389
California:
$2,294
(% of AGI for various income ranges: 24.8% for AGIs below $25k, 39.6% for AGIs $25k-50k, 56.0% for AGIs $50k-75k, 87.8% for AGIs $75k-100k, 139.4% for AGIs $100k-200k, 855.2% for AGIs over 200k)
Ordinary dividends: $4,431 (reported on 24.9% of returns)
Here:
$4,431
State:
$10,949
(% of AGI for various income ranges: 37.3% for AGIs below $25k, 60.3% for AGIs $25k-50k, 94.2% for AGIs $50k-75k, 186.9% for AGIs $75k-100k, 319.4% for AGIs $100k-200k, 1488.2% for AGIs over 200k)
Net capital gain/loss in AGI: +$14,167 (reported on 23.6% of returns)
Here:
+$14,167
State:
+$49,306
(% of AGI for various income ranges: 13.9% for AGIs below $25k, 47.7% for AGIs $25k-50k, 96.4% for AGIs $50k-75k, 145.4% for AGIs $75k-100k, 497.2% for AGIs $100k-200k, 8185.2% for AGIs over 200k)
Profit/loss from business: +$10,988 (reported on 25.4% of returns)
Here:
+$10,988
State:
+$15,671
(% of AGI for various income ranges: 236.4% for AGIs below $25k, 268.0% for AGIs $25k-50k, 261.3% for AGIs $50k-75k, 341.0% for AGIs $75k-100k, 892.4% for AGIs $100k-200k, 2527.6% for AGIs over 200k)
Taxable individual retirement arrangement distribution: $17,711 (reported on 7.4% of returns)
91506:
$17,711
California:
$23,505
(% of AGI for various income ranges: 63.8% for AGIs below $25k, 86.6% for AGIs $25k-50k, 171.7% for AGIs $50k-75k, 300.7% for AGIs $75k-100k, 448.2% for AGIs $100k-200k, 1073.9% for AGIs over 200k)
Self-employed (Keogh) retirement plans: $15,970 (reported on 1.0% of returns)
91506:
$15,970
California:
$30,163
(% of AGI for various income ranges: 10.3% for AGIs below $25k, 45.3% for AGIs $100k-200k, 300.9% for AGIs over 200k)
Total itemized deductions: $32,938 (reported on 20.3% of returns)
Here:
$32,938
State:
$39,517
(% of AGI for various income ranges: 159.3% for AGIs below $25k, 278.4% for AGIs $25k-50k, 625.0% for AGIs $50k-75k, 1206.1% for AGIs $75k-100k, 2416.5% for AGIs $100k-200k, 7947.0% for AGIs over 200k)
Charity contributions: $5,269 (reported on 17.6% of returns)
Here:
$5,269
State:
$12,598
(% of AGI for various income ranges: 6.5% for AGIs below $25k, 21.5% for AGIs $25k-50k, 71.2% for AGIs $50k-75k, 141.9% for AGIs $75k-100k, 291.7% for AGIs $100k-200k, 1460.3% for AGIs over 200k)
Taxes paid: $8,766 (reported on 20.3% of returns)
91506:
$8,766
State:
$8,807
(% of AGI for various income ranges: 26.6% for AGIs below $25k, 63.4% for AGIs $25k-50k, 163.5% for AGIs $50k-75k, 363.1% for AGIs $75k-100k, 728.5% for AGIs $100k-200k, 1919.7% for AGIs over 200k)
Earned income credit: $1,237 (reported on 9.6% of returns)
Here:
$1,237
State:
$2,074
(% of AGI for various income ranges: 44.3% for AGIs below $25k, 38.9% for AGIs $25k-50k)
Percentage of individuals using paid preparers for their 2020 taxes: 93.3%
Here:
93%
State:
92%
(% for various income ranges: 91.2% for AGIs below $25k, 94.1% for AGIs $25k-50k, 92.8% for AGIs $50k-75k, 94.1% for AGIs $75k-100k, 94.8% for AGIs $100k-200k, 95.1% for AGIs over 200k)
Averages for the 2012 tax year for zip code 91506, filed in 2013:
Average Adjusted Gross Income (AGI) in 2012: $66,737 (Individual Income Tax Returns)
Here:
$66,737
State:
$72,726
Salary/wage: $62,760 (reported on 82.1% of returns)
Here:
$62,760
State:
$59,079
(% of AGI for various income ranges: 65.4% for AGIs below $25k, 76.1% for AGIs $25k-50k, 77.0% for AGIs $50k-75k, 79.4% for AGIs $75k-100k, 82.1% for AGIs $100k-200k, 71.8% for AGIs over 200k)
Taxable interest for individuals: $994 (reported on 41.9% of returns)
This zip code:
$994
California:
$2,146
(% of AGI for various income ranges: 1.5% for AGIs below $25k, 0.8% for AGIs $25k-50k, 0.6% for AGIs $50k-75k, 0.4% for AGIs $75k-100k, 0.5% for AGIs $100k-200k, 0.6% for AGIs over 200k)
Ordinary dividends: $3,318 (reported on 21.3% of returns)
Here:
$3,318
State:
$9,308
(% of AGI for various income ranges: 1.6% for AGIs below $25k, 0.8% for AGIs $25k-50k, 1.2% for AGIs $50k-75k, 1.0% for AGIs $75k-100k, 0.8% for AGIs $100k-200k, 1.5% for AGIs over 200k)
Net capital gain/loss in AGI: +$4,309 (reported on 15.6% of returns)
Here:
+$4,309
State:
+$30,460
(% of AGI for various income ranges: 0.2% for AGIs $75k-100k, 0.9% for AGIs $100k-200k, 3.2% for AGIs over 200k)
Profit/loss from business: +$13,109 (reported on 25.2% of returns)
Here:
+$13,109
State:
+$17,064
(% of AGI for various income ranges: 15.0% for AGIs below $25k, 6.9% for AGIs $25k-50k, 4.7% for AGIs $50k-75k, 3.6% for AGIs $75k-100k, 3.5% for AGIs $100k-200k, 4.3% for AGIs over 200k)
Taxable individual retirement arrangement distribution: $15,299 (reported on 8.7% of returns)
91506:
$15,299
California:
$19,557
(% of AGI for various income ranges: 3.4% for AGIs below $25k, 2.3% for AGIs $25k-50k, 2.0% for AGIs $50k-75k, 2.4% for AGIs $75k-100k, 1.9% for AGIs $100k-200k, 1.3% for AGIs over 200k)
Self-employment retirement plans: $14,070 (reported on 1.0% of returns)
91506:
$14,070
California:
$24,530
(% of AGI for various income ranges: 0.4% for AGIs $25k-50k, 0.2% for AGIs $100k-200k, 0.5% for AGIs over 200k)
Total itemized deductions: $27,725 (25% of AGI, reported on 43.0% of returns)
Here:
$27,725
State:
$34,004
Here:
25.0% of AGI
State:
22.7% of AGI
(% of AGI for various income ranges: 15.6% for AGIs below $25k, 14.1% for AGIs $25k-50k, 15.6% for AGIs $50k-75k, 18.4% for AGIs $75k-100k, 20.4% for AGIs $100k-200k, 17.9% for AGIs over 200k)
Charity contributions: $2,849 (reported on 36.0% of returns)
Here:
$2,849
State:
$4,659
(% of AGI for various income ranges: 0.8% for AGIs below $25k, 1.1% for AGIs $25k-50k, 1.4% for AGIs $50k-75k, 1.6% for AGIs $75k-100k, 1.7% for AGIs $100k-200k, 1.8% for AGIs over 200k)
Taxes paid: $10,367 (reported on 42.9% of returns)
91506:
$10,367
State:
$14,448
(% of AGI for various income ranges: 2.8% for AGIs below $25k, 3.2% for AGIs $25k-50k, 4.3% for AGIs $50k-75k, 6.2% for AGIs $75k-100k, 8.0% for AGIs $100k-200k, 9.5% for AGIs over 200k)
Earned income credit: $1,703 (reported on 11.8% of returns)
Here:
$1,703
State:
$2,286
(% of AGI for various income ranges: 3.8% for AGIs below $25k, 0.7% for AGIs $25k-50k)
Percentage of individuals using paid preparers for their 2012 taxes: 67.3%
Here:
67%
State:
64%
(% for various income ranges: 63.2% for AGIs below $25k, 65.0% for AGIs $25k-50k, 67.8% for AGIs $50k-75k, 71.4% for AGIs $75k-100k, 72.2% for AGIs $100k-200k, 80.5% for AGIs over 200k)
Averages for the 2004 tax year for zip code 91506, filed in 2005:
Average Adjusted Gross Income (AGI) in 2004: $52,916 (Individual Income Tax Returns)
Here:
$52,916
State:
$58,600
Salary/wage: $51,396 (reported on 81.8% of returns)
Here:
$51,396
State:
$49,455
(% of AGI for various income ranges: 306.4% for AGIs below $10k, 69.1% for AGIs $10k-25k, 81.4% for AGIs $25k-50k, 81.5% for AGIs $50k-75k, 84.3% for AGIs $75k-100k, 75.9% for AGIs over 100k)
Taxable interest for individuals: $1,348 (reported on 52.9% of returns)
This zip code:
$1,348
California:
$2,365
(% of AGI for various income ranges: 25.4% for AGIs below $10k, 2.7% for AGIs $10k-25k, 1.3% for AGIs $25k-50k, 1.3% for AGIs $50k-75k, 1.1% for AGIs $75k-100k, 1.1% for AGIs over 100k)
Taxable dividends: $1,851 (reported on 24.6% of returns)
Here:
$1,851
State:
$4,746
(% of AGI for various income ranges: 16.6% for AGIs below $10k, 1.4% for AGIs $10k-25k, 0.8% for AGIs $25k-50k, 0.6% for AGIs $50k-75k, 0.8% for AGIs $75k-100k, 0.8% for AGIs over 100k)
Net capital gain/loss: +$9,266 (reported on 20.4% of returns)
Here:
+$9,266
State:
+$23,418
(% of AGI for various income ranges: -6.9% for AGIs below $10k, -0.4% for AGIs $10k-25k, 0.2% for AGIs $25k-50k, 0.5% for AGIs $50k-75k, 1.0% for AGIs $75k-100k, 8.0% for AGIs over 100k)
Profit/loss from business: +$11,220 (reported on 24.3% of returns)
Here:
+$11,220
State:
+$16,826
(% of AGI for various income ranges: 42.3% for AGIs below $10k, 11.4% for AGIs $10k-25k, 6.2% for AGIs $25k-50k, 5.0% for AGIs $50k-75k, 3.7% for AGIs $75k-100k, 4.0% for AGIs over 100k)
IRA payment deduction: $3,007 (reported on 3.3% of returns)
91506:
$3,007
California:
$3,192
(% of AGI for various income ranges: 2.4% for AGIs below $10k, 0.2% for AGIs $10k-25k, 0.2% for AGIs $25k-50k, 0.2% for AGIs $50k-75k, 0.2% for AGIs $75k-100k, 0.1% for AGIs over 100k)
Self-employed pension: $10,771 (reported on 1.2% of returns)
Here:
$10,771
California:
$17,688
(% of AGI for various income ranges: 0.2% for AGIs $25k-50k, 0.3% for AGIs $50k-75k, 0.1% for AGIs $75k-100k, 0.3% for AGIs over 100k)
Total itemized deductions: $23,524 (28% of AGI, reported on 46.0% of returns)
Here:
$23,524
State:
$28,113
Here:
27.7% of AGI
State:
25.3% of AGI
(% of AGI for various income ranges: 105.4% for AGIs below $10k, 17.0% for AGIs $10k-25k, 16.6% for AGIs $25k-50k, 21.2% for AGIs $50k-75k, 23.7% for AGIs $75k-100k, 20.4% for AGIs over 100k)
Charity contributions deductions: $2,492 (3% of AGI, reported on 41.3% of returns)
Here:
$2,492
State:
$3,923
Here:
2.8% of AGI
State:
3.3% of AGI
(% of AGI for various income ranges: 5.7% for AGIs below $10k, 1.2% for AGIs $10k-25k, 1.6% for AGIs $25k-50k, 2.1% for AGIs $50k-75k, 2.3% for AGIs $75k-100k, 2.0% for AGIs over 100k)
Total tax: $7,642 (reported on 83.3% of returns)
91506:
$7,642
State:
$10,761
(% of AGI for various income ranges: 18.9% for AGIs below $10k, 5.4% for AGIs $10k-25k, 8.1% for AGIs $25k-50k, 10.0% for AGIs $50k-75k, 10.6% for AGIs $75k-100k, 16.1% for AGIs over 100k)
Earned income credit: $1,330 (reported on 10.4% of returns)
Here:
$1,330
State:
$1,763
Percentage of individuals using paid preparers for their 2004 taxes: 70.5%
Here:
71%
State:
66%
(% for various income ranges: 63.5% for AGIs below $10k, 67.4% for AGIs $10k-25k, 67.9% for AGIs $25k-50k, 73.4% for AGIs $50k-75k, 76.7% for AGIs $75k-100k, 80.6% for AGIs over 100k)
Likely homosexual households (counted as self-reported same-sex unmarried-partner households)
Lesbian couples: 0.6% of all households
Gay men: 0.0% of all households
Household received Food Stamps/SNAP in the past 12 months: 493 Household did not receive Food Stamps/SNAP in the past 12 months: 7,633
Women who had a birth in the past 12 months: 24 (13 now married, 11 unmarried) Women who did not have a birth in the past 12 months: 4,696 (2,108 now married, 2,577 unmarried)
Housing units in zip code 91506 with a mortgage: 3,542 (368 second mortgage, 10 home equity loan, 317 both second mortgage and home equity loan) Houses without a mortgage: 79
Median monthly owner costs for units with a mortgage: $3,233 Median monthly owner costs for units without a mortgage: $667
Residents with income below the poverty level in 2022:
This zip code:
8.1%
Whole state:
12.2%
Residents with income below 50% of the poverty level in 2022:
This zip code:
4.1%
Whole state:
6.2%
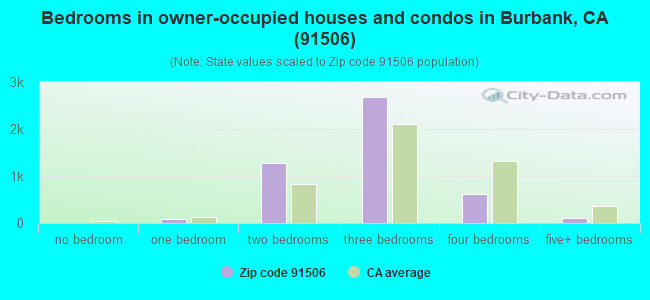
Median number of rooms in houses and condos:
Here:
6.0
State:
6.0
Median number of rooms in apartments:
Here:
3.6
State:
3.9
Notable locations in this zip code not listed on our city pages
Notable locations in zip code 91506: Disney Studios (A), City of Burbank Fire Department Station 14 (B), Walt Disney Studios Fire Department (C), City of Burbank Fire Department Station 15 (D). Display/hide their locations on the map
Churches in zip code 91506 include: Saint Finbars Church (A), Valley Baptist Church (B), Valley Community Church (C), Christ Lutheran Church (D), United Brethren Church (E), Calvary Bible Church (F). Display/hide their locations on the map
Parks in zip code 91506 include: Mountain View Park (1), Olive Avenue Recreation Center (2), Vickroy Park (3), George Izay Park (4), Pickwick Recreation Center (5). Display/hide their locations on the map
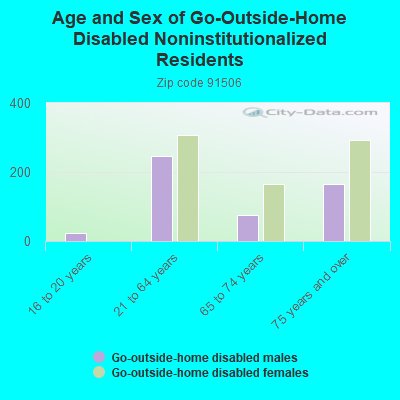
In group quarters: 407 (-1 institutionalized population)
Size of family households: 2,057 2-persons, 1,085 3-persons, 1,093 4-persons, 262 5-persons, 174 6-persons, 73 7-or-more-persons
Size of nonfamily households: 3,157 1-person, 370 2-persons
2,288 married couples with children.
488 single-parent households (311 men, 177 women).
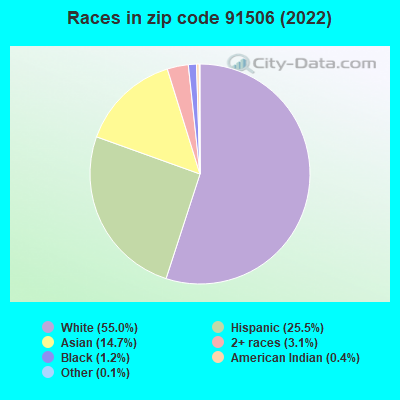
63.9% of residents of 91506 zip code speak English at home.
16.6% of residents speak Spanish at home (70% very well, 19% well, 11% not well).
8.5% of residents speak other Indo-European language at home (68% very well, 24% well, 4% not well, 4% not at all).
10.2% of residents speak Asian or Pacific Island language at home (60% very well, 15% well, 17% not well, 7% not at all).
0.7% of residents speak other language at home (67% very well, 11% well, 22% not well).
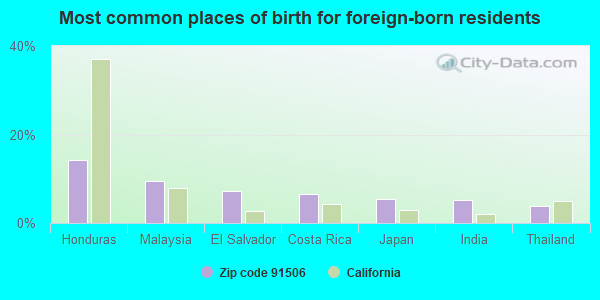
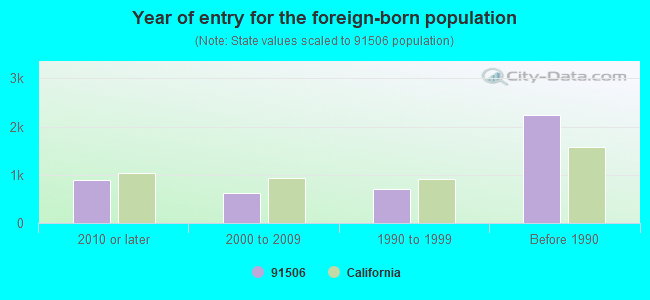
Foreign born population: 4,288 (22.1%) (75.9% of them are naturalized citizens)
Major facilities with environmental interests located in this zip code:
ALL METALS PROCESSING COMPANY INCORPORATED (264 W. SPAZIER AVE. in BURBANK, CA)
STATE MASTER (California - Hazardous Waste Tracking) - HAZARDOU WASTE PROGRAM FORMAL ENFORCEMENT ACTION (Integrated Compliance Information System) CRITERIA AND HAZARDOUS AIR POLLUTANT INVENTORY (Inventory of air pollution sources) HAZARDOUS WASTE BIENNIAL REPORTER (Resource Conservation and Recovery Act (tracking hazardous waste)) - ICIS-, ENFORCEMENT/COMPLIANCE ACTIVITY Large Quantity Generators, more that 1000 kg of hazardous waste/month (Resource Conservation and Recovery Act (tracking hazardous waste)) - ICIS-, ENFORCEMENT/COMPLIANCE ACTIVITY TRI REPORTER (Tracking of toxic chemicals releasing facilities) Business SIC and NAICS classification: ELECTROPLATING, PLATING, POLISHING, ANODIZING, AND COLORING Organizations: ALL METALS PROCESSING CO INC (CONTACT/OPERATOR)
, HELEN POWERS (CONTACT/OWNER)
G&H MECHANICAL (2900 W BURBANK BLVD in BURBANK, CA)
STATE MASTER (California - Hazardous Waste Tracking) - HAZARDOU WASTE PROGRAM Small Quantity Generators, between 100 kg and 1000 kg of hazardous waste/month (Resource Conservation and Recovery Act (tracking hazardous waste)) - notification Business NAICS classification: GENERAL AUTOMOTIVE REPAIR. Organizations: GEVORG TOROSSIAN (CONTACT/OWNER)
GENERAL MOTORS TRAINING CENTER (1105 RIVERSIDE DR in BURBANK, CA)
STATE MASTER (California - Hazardous Waste Tracking) - HAZARDOU WASTE PROGRAM Small Quantity Generators, between 100 kg and 1000 kg of hazardous waste/month (Resource Conservation and Recovery Act (tracking hazardous waste)) - notification Business NAICS classification: ADMINISTRATIVE MANAGEMENT AND GENERAL MANAGEMENT CONSULTING SERVICES. Organizations: GENERAL MOTORS CORPORATION (CONTACT/OWNER)
C J SCHEFERS INC (1112 D CHESTNUT ST in BURBANK, CA)
STATE MASTER (California - Hazardous Waste Tracking) - HAZARDOU WASTE PROGRAM Small Quantity Generators, between 100 kg and 1000 kg of hazardous waste/month (Resource Conservation and Recovery Act (tracking hazardous waste)) - notification Business NAICS classification: OTHER COMMERCIAL AND SERVICE INDUSTRY MACHINERY MANUFACTURING. Organizations: CORBY & LORRAINE SCHEFERS (CONTACT/OWNER)
GEORGE F MCMURRAY MFG DBA MCMURRAY CO (1118 CHESTNUT ST in BURBANK, CA)
STATE MASTER (California - Hazardous Waste Tracking) - HAZARDOU WASTE PROGRAM Small Quantity Generators, between 100 kg and 1000 kg of hazardous waste/month (Resource Conservation and Recovery Act (tracking hazardous waste))
KENS RAPID LUBE (1417 W BURBANK BLVD in BURBANK, CA)
STATE MASTER (California - Hazardous Waste Tracking) - HAZARDOU WASTE PROGRAM Small Quantity Generators, between 100 kg and 1000 kg of hazardous waste/month (Resource Conservation and Recovery Act (tracking hazardous waste)) Business NAICS classification: ALL OTHER AUTOMOTIVE REPAIR AND MAINTENANCE.
CHARLIES COMPLETE AUTO (1000 W MAGNOLIA AVE in BURBANK, CA)
STATE MASTER (California - Hazardous Waste Tracking) - HAZARDOU WASTE PROGRAM Small Quantity Generators, between 100 kg and 1000 kg of hazardous waste/month (Resource Conservation and Recovery Act (tracking hazardous waste)) - notification Organizations: CARLOS PARADA (CONTACT/OWNER)
BANGS MFG (1601 WEST BURBANK BLVD in BURBANK, CA)
STATE MASTER (California - Hazardous Waste Tracking) - HAZARDOU WASTE PROGRAM Small Quantity Generators, between 100 kg and 1000 kg of hazardous waste/month (Resource Conservation and Recovery Act (tracking hazardous waste)) Business NAICS classification: OTHER COMMERCIAL AND SERVICE INDUSTRY MACHINERY MANUFACTURING.
EDISON (THOMAS) ELEMENTARY (2110 W. CHESTNUT ST. in BURBANK, CA)
(National Center for Education Statistics) - STATE ID-6011886 Organizations: BURBANK UNIFIED (SCHOOL DISTRICT)
JORDAN (DAVID STARR) MIDDLE (420 S. MARIPOSA ST. in BURBANK, CA)
(National Center for Education Statistics) - STATE ID-6057525 Organizations: BURBANK UNIFIED (SCHOOL DISTRICT)
MCKINLEY (WILLIAM) ELEMENTARY (349 W. VALENCIA AVE. in BURBANK, CA)
(National Center for Education Statistics) - STATE ID-6011951 Organizations: BURBANK UNIFIED (SCHOOL DISTRICT)
MONTEREY HIGH (CONT.) (1915 MONTEREY AVE. in BURBANK, CA)
(National Center for Education Statistics) - STATE ID-1933332 Organizations: BURBANK UNIFIED (SCHOOL DISTRICT)
CALIFORNIA COASTS COLOR INC (1121 ISABEL ST in BURBANK, CA)
CRITERIA AND HAZARDOUS AIR POLLUTANT INVENTORY (Inventory of air pollution sources) Large Quantity Generators, more that 1000 kg of hazardous waste/month (Resource Conservation and Recovery Act (tracking hazardous waste)) TRI REPORTER (Tracking of toxic chemicals releasing facilities) Business SIC classification: COMMERCIAL PRINTING, LITHOGRAPHIC; COATING, ENGRAVING, AND ALLIED SERVICES Organizations: BURMAR METAL FINISHING CORP (CONTACT/OWNER)
Alternative names: BARRON ANODIZING AND PAINT, BURMAR METAL FINISHING DBA BARRON ANODIZING & PAINT
Housing units lacking complete plumbing facilities: 0.3% Housing units lacking complete kitchen facilities: 1.4%
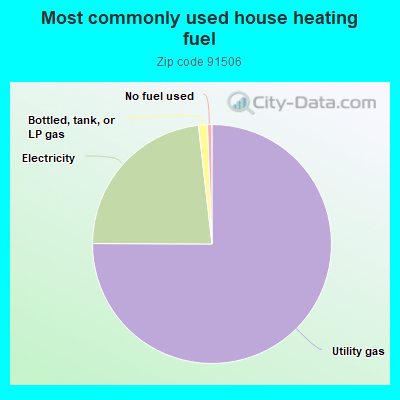
75.0%Utility gas
23.1%Electricity
1.2%Bottled, tank, or LP gas
0.6%No fuel used
Population in 1990: 18,336. Population change in the 1990s: +194 (+1.1%).
Place of birth for U.S.-born residents:
This state: 10,259
Northeast: 1,337
Midwest: 1,168
South: 1,253
West: 808
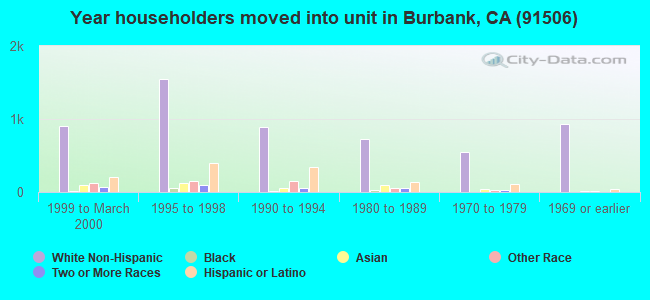
61% of the 91506 zip code residents lived in the same house 5 years ago. Out of people who lived in different houses, 80% lived in this county. Out of people who lived in different counties, 50% lived in California.
90% of the 91506 zip code residents lived in the same house 1 year ago. Out of people who lived in different houses, 60% moved from this county. Out of people who lived in different houses, 23% moved from different county within same state. Out of people who lived in different houses, 4% moved from different state. Out of people who lived in different houses, 13% moved from abroad.
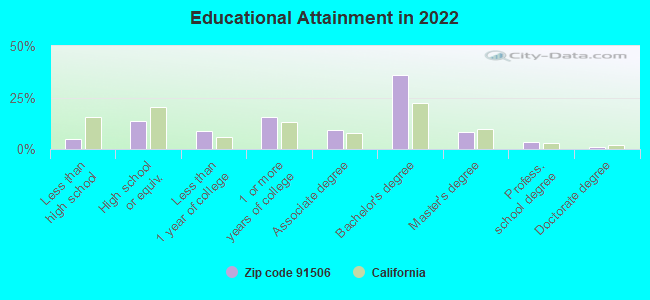
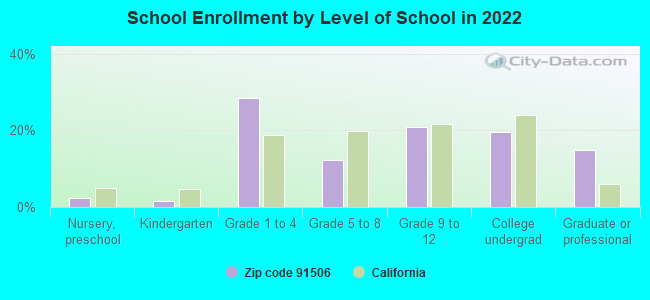
Private vs. public school enrollment:
Students in private schools in grades 1 to 8 (elementary and middle school): 181
Here:
10.2%
California:
10.5%
Students in private schools in grades 9 to 12 (high school):
Here:
0.0%
California:
8.5%
Students in private undergraduate colleges: 193
Here:
22.6%
California:
15.9%
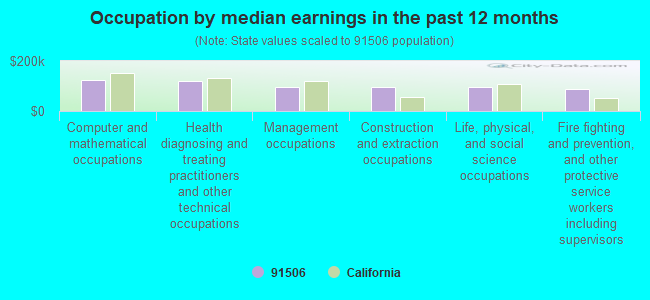
Occupation by median earnings in the past 12 months ($)
123,063Computer and mathematical occupations
120,263Health diagnosing and treating practitioners and other technical occupations
97,868Management occupations
97,204Construction and extraction occupations
94,865Life, physical, and social science occupations
86,795Fire fighting and prevention, and other protective service workers including supervisors
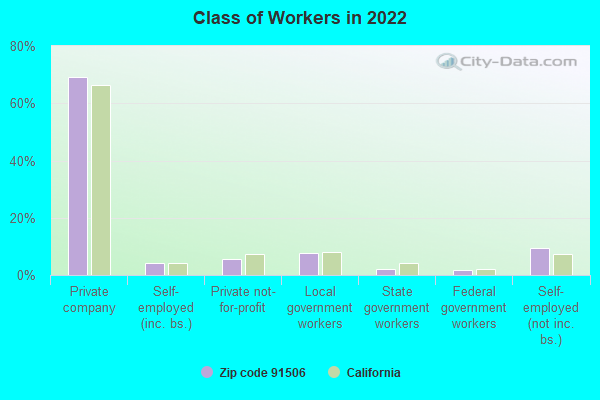
Companies with federal contracts located in this zip code:
OLIVER AND WINSTON INC (900 W ALAMEDA AVE in BURBANK, CA; small business) : $215,467 in 5 contractsfrom 1999 to 2003
Contracts for Tires, Solid and Cushion, Maintenance, Repair and Rebuilding of Equipment -- Tires and Tubes, Tires and Tubes, Pneumatic, Except Aircraft by Army Signed by year:2000: $72,138; 2001: $72,588; 2002: $0; 2003: -$1,397; 2004: $0; 2005: $0; 2006: $0.
Biggest contracts:
$72,588 with Army for Tires, Solid and Cushion. Signed on 2001-03-27. Completion date: 2001-09-30.
$72,138 with Army for Maintenance, Repair and Rebuilding of Equipment -- Tires and Tubes. Signed on 2000-10-01. Completion date: 2001-09-30.
$72,138 with Army for Tires and Tubes, Pneumatic, Except Aircraft. Signed on 1999-11-12. Completion date: 2000-06-30.
$0, same as above.Signed on 1999-11-12. Completion date: 2000-06-30.
PROCESS CONTROL CONSULTING TRU (1918 WEST MAGNOLIA BLVD R in BURBANK, CA; small business) : $204,000 in 2 contractsfrom 2000 to 2002
$156,400 with Air Force for Maintenance, Repair and Rebuilding of Equipment -- Miscellaneous. Taking place in UT. Signed on 2000-02-18. Completion date: 2001-02-17.
$47,600, same as above.Signed on 2002-05-20. Completion date: 2002-09-30.
N M IMBERTSON & ASSOCIATES INC (2213 W BURBANK BLVD in BURBANK, CA; small business) : $98,000 in 2 contractsin 2001
$98,000 with U.S. Army Corps of Engineers - civil program financing only for Miscellaneous Fabricated Nonmetallic Materials. Taking place in TX. Signed on 2001-09-26. Completion date: 2002-02-24.
$0, same as above.Signed on 2001-09-26. Completion date: 2002-02-24.
Top industries in this zip code by the number of employees in 2005:
Information: Television Broadcasting (over 1000 employees: 1 establishment)
Administrative and Support and Waste Management and Remediation Services: All Other Travel Arrangement and Reservation Services (250-499: 1)
2005 - 2018 National Fire Incident Reporting System (NFIRS) incidents
Based on the data from the years 2005 - 2018 the average number of fire incidents per year is 28. The highest number of reported fires - 37 took place in 2007, and the least - 12 in 2012. The data has a declining trend.
When looking into fire subcategories, the most reports belonged to: Structure Fires (42.9%), and Outside Fires (26.5%).
Fire incident types reported to NFIRS in Zip Code 91506


 Nearest zip codes: 91502, 91505, 91201, 91504, 90068, 91608.
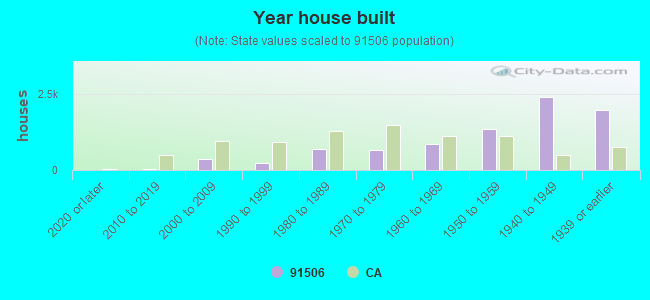


 Based on the data from the years 2005 - 2018 the average number of fire incidents per year is 28. The highest number of reported fires - 37 took place in 2007, and the least - 12 in 2012. The data has a declining trend.
 When looking into fire subcategories, the most reports belonged to: Structure Fires (42.9%), and Outside Fires (26.5%).