Estimated zip code population in 2022: 27,250 Zip code population in 2010: 24,939 Zip code population in 2000: 25,872
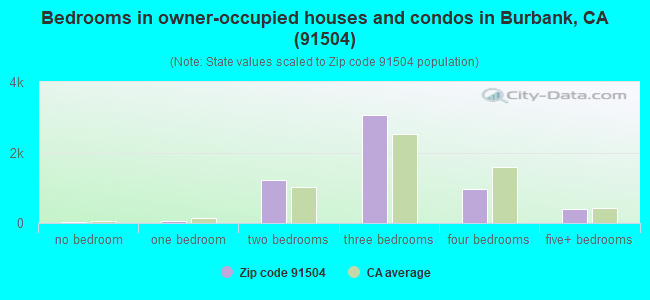
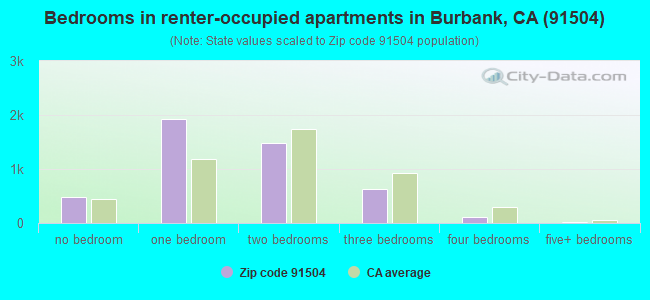
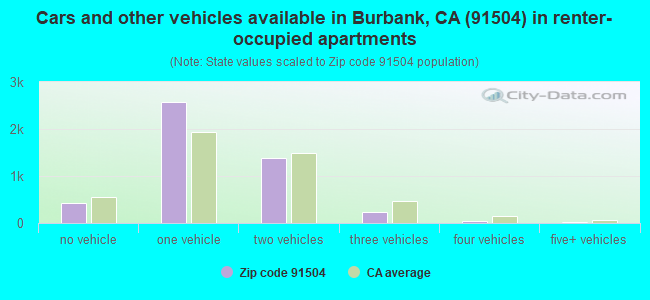
Houses and condos: 10,955 Renter-occupied apartments: 4,644
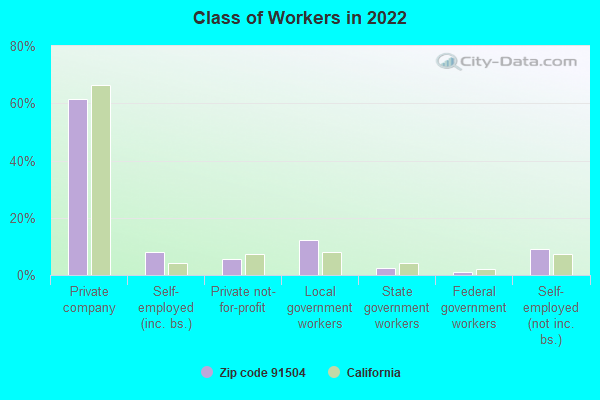
% of renters here:
45%
State:
44%
March 2022 cost of living index in zip code 91504: 137.7 (high, U.S. average is 100)
Land area: 4.9 sq. mi. Water area: 0.0 sq. mi.
Population density: 5,521 people per square mile
(average).
OSM Map
General Map
Google Map
MSN Map
OSM Map
General Map
Google Map
MSN Map
OSM Map
General Map
Google Map
MSN Map
OSM Map
General Map
Google Map
MSN Map
Please wait while loading the map...
Real estate property taxes paid for housing units in 2022:
This zip code:
0.6% ($6,067)
California:
0.7% ($4,831)
Median real estate property taxes paid for housing units with mortgages in 2022: $6,505 (0.6%) Median real estate property taxes paid for housing units with no mortgage in 2022: $4,853 (0.5%)
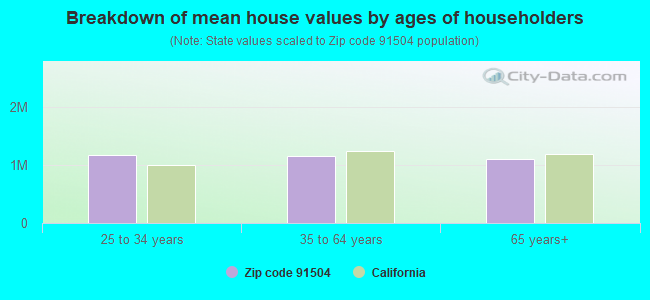
Estimated median house/condo value in 2022: $1,003,107
91504:
$1,003,107
California:
$715,900
According to our research of California and other state lists, there were 11 registered sex offenders living in 91504 zip code as of April 27, 2024. The ratio of all residents to sex offenders in zip code 91504 is 2,474 to 1. The ratio of registered sex offenders to all residents in this zip code is much lower than the state average.
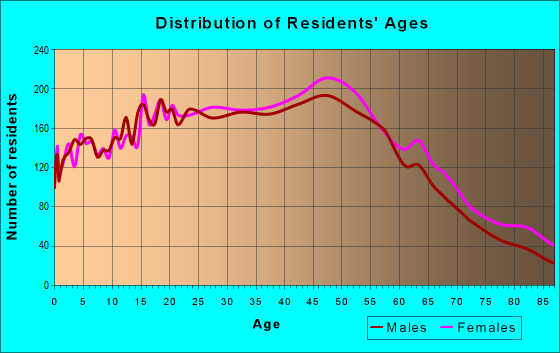
Median resident age:
This zip code:
40.7 years
California median age:
37.9 years
Average household size:
This zip code:
2.6 people
California:
2.8 people
Averages for the 2020 tax year for zip code 91504, filed in 2021:
Average Adjusted Gross Income (AGI) in 2020: $106,937 (Individual Income Tax Returns)
Here:
$106,937
State:
$95,910
Salary/wage: $76,084 (reported on 78.8% of returns)
Here:
$76,084
State:
$77,331
(% of AGI for various income ranges: 1211.2% for AGIs below $25k, 4029.3% for AGIs $25k-50k, 7752.9% for AGIs $50k-75k, 11832.1% for AGIs $75k-100k, 22899.5% for AGIs $100k-200k, 100418.5% for AGIs over 200k)
Taxable interest for individuals: $1,552 (reported on 39.0% of returns)
This zip code:
$1,552
California:
$2,294
(% of AGI for various income ranges: 24.3% for AGIs below $25k, 29.3% for AGIs $25k-50k, 60.6% for AGIs $50k-75k, 91.4% for AGIs $75k-100k, 211.0% for AGIs $100k-200k, 1217.4% for AGIs over 200k)
Ordinary dividends: $5,425 (reported on 21.9% of returns)
Here:
$5,425
State:
$10,949
(% of AGI for various income ranges: 26.4% for AGIs below $25k, 44.3% for AGIs $25k-50k, 90.4% for AGIs $50k-75k, 196.3% for AGIs $75k-100k, 424.5% for AGIs $100k-200k, 2655.9% for AGIs over 200k)
Net capital gain/loss in AGI: +$14,359 (reported on 21.8% of returns)
Here:
+$14,359
State:
+$49,306
(% of AGI for various income ranges: 13.8% for AGIs below $25k, 65.6% for AGIs $25k-50k, 61.0% for AGIs $50k-75k, 210.7% for AGIs $75k-100k, 725.8% for AGIs $100k-200k, 10774.1% for AGIs over 200k)
Profit/loss from business: +$12,604 (reported on 26.2% of returns)
Here:
+$12,604
State:
+$15,671
(% of AGI for various income ranges: 266.0% for AGIs below $25k, 366.2% for AGIs $25k-50k, 420.1% for AGIs $50k-75k, 532.5% for AGIs $75k-100k, 930.2% for AGIs $100k-200k, 4657.4% for AGIs over 200k)
Taxable individual retirement arrangement distribution: $20,328 (reported on 6.7% of returns)
91504:
$20,328
California:
$23,505
(% of AGI for various income ranges: 43.2% for AGIs below $25k, 72.4% for AGIs $25k-50k, 152.9% for AGIs $50k-75k, 289.6% for AGIs $75k-100k, 716.6% for AGIs $100k-200k, 1594.8% for AGIs over 200k)
Self-employed (Keogh) retirement plans: $22,889 (reported on 0.7% of returns)
91504:
$22,889
California:
$30,163
(% of AGI for various income ranges: 40.2% for AGIs $100k-200k, 611.1% for AGIs over 200k)
Total itemized deductions: $38,886 (reported on 20.3% of returns)
Here:
$38,886
State:
$39,517
(% of AGI for various income ranges: 162.8% for AGIs below $25k, 319.9% for AGIs $25k-50k, 694.5% for AGIs $50k-75k, 1315.5% for AGIs $75k-100k, 3127.8% for AGIs $100k-200k, 16071.9% for AGIs over 200k)
Charity contributions: $6,536 (reported on 16.9% of returns)
Here:
$6,536
State:
$12,598
(% of AGI for various income ranges: 9.8% for AGIs below $25k, 26.6% for AGIs $25k-50k, 71.9% for AGIs $50k-75k, 140.1% for AGIs $75k-100k, 439.2% for AGIs $100k-200k, 2665.2% for AGIs over 200k)
Taxes paid: $8,852 (reported on 20.2% of returns)
91504:
$8,852
State:
$8,807
(% of AGI for various income ranges: 35.2% for AGIs below $25k, 72.9% for AGIs $25k-50k, 174.1% for AGIs $50k-75k, 393.0% for AGIs $75k-100k, 910.9% for AGIs $100k-200k, 2577.8% for AGIs over 200k)
Earned income credit: $1,771 (reported on 11.6% of returns)
Here:
$1,771
State:
$2,074
(% of AGI for various income ranges: 75.1% for AGIs below $25k, 61.8% for AGIs $25k-50k, 0.7% for AGIs $50k-75k)
Percentage of individuals using paid preparers for their 2020 taxes: 92.7%
Here:
93%
State:
92%
(% for various income ranges: 91.0% for AGIs below $25k, 91.8% for AGIs $25k-50k, 93.9% for AGIs $50k-75k, 93.1% for AGIs $75k-100k, 94.4% for AGIs $100k-200k, 93.8% for AGIs over 200k)
Averages for the 2012 tax year for zip code 91504, filed in 2013:
Average Adjusted Gross Income (AGI) in 2012: $72,315 (Individual Income Tax Returns)
Here:
$72,315
State:
$72,726
Salary/wage: $60,833 (reported on 81.6% of returns)
Here:
$60,833
State:
$59,079
(% of AGI for various income ranges: 71.3% for AGIs below $25k, 78.8% for AGIs $25k-50k, 76.8% for AGIs $50k-75k, 74.9% for AGIs $75k-100k, 76.8% for AGIs $100k-200k, 51.4% for AGIs over 200k)
Taxable interest for individuals: $1,596 (reported on 40.4% of returns)
This zip code:
$1,596
California:
$2,146
(% of AGI for various income ranges: 1.1% for AGIs below $25k, 1.0% for AGIs $25k-50k, 0.8% for AGIs $50k-75k, 0.8% for AGIs $75k-100k, 0.9% for AGIs $100k-200k, 0.9% for AGIs over 200k)
Ordinary dividends: $4,776 (reported on 19.6% of returns)
Here:
$4,776
State:
$9,308
(% of AGI for various income ranges: 1.2% for AGIs below $25k, 0.9% for AGIs $25k-50k, 1.1% for AGIs $50k-75k, 1.1% for AGIs $75k-100k, 1.2% for AGIs $100k-200k, 1.7% for AGIs over 200k)
Net capital gain/loss in AGI: +$6,172 (reported on 17.1% of returns)
Here:
+$6,172
State:
+$30,460
(% of AGI for various income ranges: 0.2% for AGIs $50k-75k, 0.4% for AGIs $75k-100k, 1.1% for AGIs $100k-200k, 3.7% for AGIs over 200k)
Profit/loss from business: +$14,193 (reported on 23.3% of returns)
Here:
+$14,193
State:
+$17,064
(% of AGI for various income ranges: 13.9% for AGIs below $25k, 6.7% for AGIs $25k-50k, 4.8% for AGIs $50k-75k, 3.6% for AGIs $75k-100k, 3.6% for AGIs $100k-200k, 3.3% for AGIs over 200k)
Taxable individual retirement arrangement distribution: $15,135 (reported on 8.1% of returns)
91504:
$15,135
California:
$19,557
(% of AGI for various income ranges: 2.5% for AGIs below $25k, 1.9% for AGIs $25k-50k, 2.3% for AGIs $50k-75k, 2.6% for AGIs $75k-100k, 2.0% for AGIs $100k-200k, 0.7% for AGIs over 200k)
Self-employment retirement plans: $18,390 (reported on 0.8% of returns)
91504:
$18,390
California:
$24,530
(% of AGI for various income ranges: 0.3% for AGIs $25k-50k, 0.3% for AGIs $100k-200k, 0.3% for AGIs over 200k)
Total itemized deductions: $30,987 (24% of AGI, reported on 41.4% of returns)
Here:
$30,987
State:
$34,004
Here:
24.0% of AGI
State:
22.7% of AGI
(% of AGI for various income ranges: 14.7% for AGIs below $25k, 15.0% for AGIs $25k-50k, 16.9% for AGIs $50k-75k, 18.8% for AGIs $75k-100k, 21.1% for AGIs $100k-200k, 16.2% for AGIs over 200k)
Charity contributions: $3,405 (reported on 34.6% of returns)
Here:
$3,405
State:
$4,659
(% of AGI for various income ranges: 0.7% for AGIs below $25k, 1.4% for AGIs $25k-50k, 1.5% for AGIs $50k-75k, 1.8% for AGIs $75k-100k, 1.9% for AGIs $100k-200k, 1.6% for AGIs over 200k)
Taxes paid: $12,154 (reported on 41.4% of returns)
91504:
$12,154
State:
$14,448
(% of AGI for various income ranges: 2.9% for AGIs below $25k, 3.2% for AGIs $25k-50k, 4.7% for AGIs $50k-75k, 6.0% for AGIs $75k-100k, 8.1% for AGIs $100k-200k, 9.2% for AGIs over 200k)
Earned income credit: $1,925 (reported on 15.1% of returns)
Here:
$1,925
State:
$2,286
(% of AGI for various income ranges: 5.5% for AGIs below $25k, 0.8% for AGIs $25k-50k)
Percentage of individuals using paid preparers for their 2012 taxes: 70.9%
Here:
71%
State:
64%
(% for various income ranges: 67.4% for AGIs below $25k, 70.1% for AGIs $25k-50k, 71.7% for AGIs $50k-75k, 73.7% for AGIs $75k-100k, 74.0% for AGIs $100k-200k, 80.6% for AGIs over 200k)
Averages for the 2004 tax year for zip code 91504, filed in 2005:
Average Adjusted Gross Income (AGI) in 2004: $55,874 (Individual Income Tax Returns)
Here:
$55,874
State:
$58,600
Salary/wage: $49,733 (reported on 81.7% of returns)
Here:
$49,733
State:
$49,455
(% of AGI for various income ranges: 446.9% for AGIs below $10k, 74.4% for AGIs $10k-25k, 79.8% for AGIs $25k-50k, 75.9% for AGIs $50k-75k, 77.5% for AGIs $75k-100k, 65.5% for AGIs over 100k)
Taxable interest for individuals: $1,964 (reported on 50.8% of returns)
This zip code:
$1,964
California:
$2,365
(% of AGI for various income ranges: 28.0% for AGIs below $10k, 2.4% for AGIs $10k-25k, 1.5% for AGIs $25k-50k, 2.0% for AGIs $50k-75k, 1.5% for AGIs $75k-100k, 1.7% for AGIs over 100k)
Taxable dividends: $2,859 (reported on 24.4% of returns)
Here:
$2,859
State:
$4,746
(% of AGI for various income ranges: 17.1% for AGIs below $10k, 1.1% for AGIs $10k-25k, 1.1% for AGIs $25k-50k, 1.1% for AGIs $50k-75k, 1.0% for AGIs $75k-100k, 1.3% for AGIs over 100k)
Net capital gain/loss: +$8,890 (reported on 21.1% of returns)
Here:
+$8,890
State:
+$23,418
(% of AGI for various income ranges: -7.6% for AGIs below $10k, -0.0% for AGIs $10k-25k, 0.2% for AGIs $25k-50k, 0.8% for AGIs $50k-75k, 0.9% for AGIs $75k-100k, 6.4% for AGIs over 100k)
Profit/loss from business: +$13,688 (reported on 22.9% of returns)
Here:
+$13,688
State:
+$16,826
(% of AGI for various income ranges: 53.8% for AGIs below $10k, 10.3% for AGIs $10k-25k, 5.8% for AGIs $25k-50k, 4.7% for AGIs $50k-75k, 5.3% for AGIs $75k-100k, 5.0% for AGIs over 100k)
IRA payment deduction: $3,581 (reported on 3.5% of returns)
91504:
$3,581
California:
$3,192
(% of AGI for various income ranges: 2.2% for AGIs below $10k, 0.2% for AGIs $10k-25k, 0.3% for AGIs $25k-50k, 0.3% for AGIs $50k-75k, 0.2% for AGIs $75k-100k, 0.1% for AGIs over 100k)
Self-employed pension: $17,370 (reported on 1.3% of returns)
Here:
$17,370
California:
$17,688
(% of AGI for various income ranges: 0.1% for AGIs $10k-25k, 0.1% for AGIs $25k-50k, 0.1% for AGIs $50k-75k, 0.2% for AGIs $75k-100k, 0.7% for AGIs over 100k)
Total itemized deductions: $26,379 (27% of AGI, reported on 43.7% of returns)
Here:
$26,379
State:
$28,113
Here:
27.3% of AGI
State:
25.3% of AGI
(% of AGI for various income ranges: 92.9% for AGIs below $10k, 15.8% for AGIs $10k-25k, 18.7% for AGIs $25k-50k, 22.2% for AGIs $50k-75k, 23.4% for AGIs $75k-100k, 20.2% for AGIs over 100k)
Charity contributions deductions: $3,247 (3% of AGI, reported on 39.0% of returns)
Here:
$3,247
State:
$3,923
Here:
3.2% of AGI
State:
3.3% of AGI
(% of AGI for various income ranges: 3.8% for AGIs below $10k, 1.1% for AGIs $10k-25k, 1.8% for AGIs $25k-50k, 2.2% for AGIs $50k-75k, 2.7% for AGIs $75k-100k, 2.5% for AGIs over 100k)
Total tax: $9,134 (reported on 79.5% of returns)
91504:
$9,134
State:
$10,761
(% of AGI for various income ranges: 23.1% for AGIs below $10k, 4.9% for AGIs $10k-25k, 7.2% for AGIs $25k-50k, 9.5% for AGIs $50k-75k, 10.5% for AGIs $75k-100k, 17.8% for AGIs over 100k)
Earned income credit: $1,571 (reported on 12.5% of returns)
Here:
$1,571
State:
$1,763
Percentage of individuals using paid preparers for their 2004 taxes: 73.4%
Here:
73%
State:
66%
(% for various income ranges: 66.5% for AGIs below $10k, 71.4% for AGIs $10k-25k, 73.7% for AGIs $25k-50k, 75.1% for AGIs $50k-75k, 78.4% for AGIs $75k-100k, 79.3% for AGIs over 100k)
Likely homosexual households (counted as self-reported same-sex unmarried-partner households)
Lesbian couples: 0.4% of all households
Gay men: 0.5% of all households
Household received Food Stamps/SNAP in the past 12 months: 1,070 Household did not receive Food Stamps/SNAP in the past 12 months: 9,279
Women who had a birth in the past 12 months: 274 (272 now married, 0 unmarried) Women who did not have a birth in the past 12 months: 6,264 (2,789 now married, 3,461 unmarried)
Housing units in zip code 91504 with a mortgage: 4,260 (584 second mortgage, 25 home equity loan, 541 both second mortgage and home equity loan) Houses without a mortgage: 18
Median monthly owner costs for units with a mortgage: $3,315 Median monthly owner costs for units without a mortgage: $855
Residents with income below the poverty level in 2022:
This zip code:
11.5%
Whole state:
12.2%
Residents with income below 50% of the poverty level in 2022:
This zip code:
7.3%
Whole state:
6.2%
Median number of rooms in houses and condos:
Here:
5.9
State:
6.0
Median number of rooms in apartments:
Here:
3.4
State:
3.9
Notable locations in this zip code not listed on our city pages
Notable locations in zip code 91504: City of Burbank Fire Department Station 16 (A), City of Burbank Fire Department Station 13 (B). Display/hide their locations on the map
Churches in zip code 91504 include: First Church of Christ Scientist (A), First Congregational Church (B), Temple Emanuel (C), Luther Memorial Lutheran Church (D), Bethany United Presbyterian Church (E). Display/hide their locations on the map
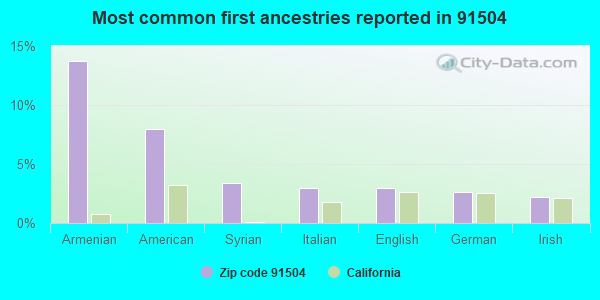
3,840 married couples with children.
1,352 single-parent households (216 men, 1,136 women).
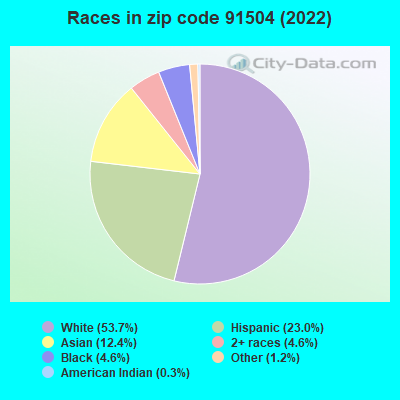
50.7% of residents of 91504 zip code speak English at home.
17.5% of residents speak Spanish at home (70% very well, 16% well, 11% not well, 3% not at all).
20.2% of residents speak other Indo-European language at home (68% very well, 21% well, 11% not well).
8.8% of residents speak Asian or Pacific Island language at home (48% very well, 44% well, 8% not well).
3.9% of residents speak other language at home (54% very well, 28% well, 16% not well, 2% not at all).
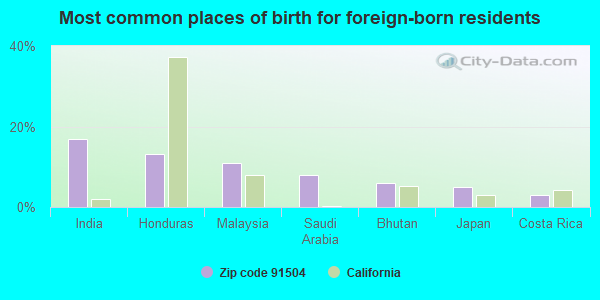
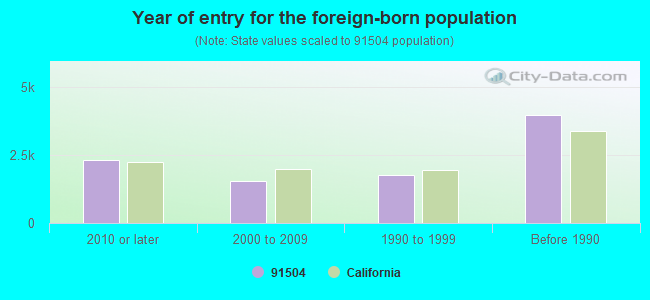
Foreign born population: 9,330 (34.2%) (74.5% of them are naturalized citizens)
Major facilities with environmental interests located in this zip code:
A H PLATING INCORPORATED (1837 NORTH VICTORY PLACE in BURBANK, CA)
STATE MASTER (California - Hazardous Waste Tracking) - HAZARDOU WASTE PROGRAM CRITERIA AND HAZARDOUS AIR POLLUTANT INVENTORY (Inventory of air pollution sources) National Pollutant Discharge Elimination System NON-MAJOR (Tracking pollutant discharge elimination systems) - permit HAZARDOUS WASTE BIENNIAL REPORTER (Resource Conservation and Recovery Act (tracking hazardous waste)) Large Quantity Generators, more that 1000 kg of hazardous waste/month (Resource Conservation and Recovery Act (tracking hazardous waste)) TRI REPORTER (Tracking of toxic chemicals releasing facilities) Business SIC and NAICS classification: ELECTROPLATING, PLATING, POLISHING, ANODIZING, AND COLORING Organizations: RUEL GREY (CONTACT/OPERATOR)
, SUNVAIR COATING TECHNOLOGIES (CONTACT/OWNER)
MAGNA PLATING COMPANY (3063 NORTH CALIFORNIA STREET in BURBANK, CA)
STATE MASTER (California - Hazardous Waste Tracking) - HAZARDOU WASTE PROGRAM National Pollutant Discharge Elimination System NON-MAJOR (Tracking pollutant discharge elimination systems) - permit HAZARDOUS WASTE BIENNIAL REPORTER (Resource Conservation and Recovery Act (tracking hazardous waste)) Large Quantity Generators, more that 1000 kg of hazardous waste/month (Resource Conservation and Recovery Act (tracking hazardous waste)) Business NAICS classification: ELECTROPLATING, PLATING, POLISHING, ANODIZING, AND COLORING. Organizations: MAGNA PLATING COMPANY, INC (CONTACT/OPERATOR)
MEL BERNIE & COMPANY INCORPORATED (3000 EMPIRE AVE in BURBANK, CA)
STATE MASTER (California - Hazardous Waste Tracking) - HAZARDOU WASTE PROGRAM CRITERIA AND HAZARDOUS AIR POLLUTANT INVENTORY (Inventory of air pollution sources) HAZARDOUS WASTE BIENNIAL REPORTER (Resource Conservation and Recovery Act (tracking hazardous waste)) Large Quantity Generators, more that 1000 kg of hazardous waste/month (Resource Conservation and Recovery Act (tracking hazardous waste)) TRI REPORTER (Tracking of toxic chemicals releasing facilities) Business SIC classification: ELECTROPLATING, PLATING, POLISHING, ANODIZING, AND COLORING; COSTUME JEWELRY AND COSTUME NOVELTIES, EXCEPT PRECIOUS METAL Business NAICS classification: ELECTROPLATING, PLATING, POLISHING, ANODIZING, AND COLORING.; COSTUME JEWELRY AND NOVELTY MANUFACTURING. Organizations: RENE GUARDADO (CONTACT/OPERATOR)
, MELVYN J. BERNIE (CONTACT/OWNER)
Alternative names: BERNIE & CO ACCESSORY PLATING, MEL BERNIE & CO., 1928 JEWELRY ACCESSORY PLATING
LOCKHEED MARTIN CORPORATION (1705 VICTORY PL in BURBANK, CA)
STATE MASTER (California - Hazardous Waste Tracking) - HAZARDOU WASTE PROGRAM CRITERIA AND HAZARDOUS AIR POLLUTANT INVENTORY (Inventory of air pollution sources) HAZARDOUS WASTE BIENNIAL REPORTER (Resource Conservation and Recovery Act (tracking hazardous waste)) Large Quantity Generators, more that 1000 kg of hazardous waste/month (Resource Conservation and Recovery Act (tracking hazardous waste)) TSD (Resource Conservation and Recovery Act (tracking hazardous waste)) TRI REPORTER (Tracking of toxic chemicals releasing facilities) Business SIC classification: AIRCRAFT PARTS AND AUXILIARY EQUIPMENT Alternative names: LOCKHEED AERONAUTICAL SYS. CO. PLANT B-1
CARTER PLATING CO (1842 N KEYSTONE in BURBANK, CA)
STATE MASTER (California - Hazardous Waste Tracking) - HAZARDOU WASTE PROGRAM National Pollutant Discharge Elimination System NON-MAJOR (Tracking pollutant discharge elimination systems) - permit Small Quantity Generators, between 100 kg and 1000 kg of hazardous waste/month (Resource Conservation and Recovery Act (tracking hazardous waste)) Business NAICS classification: ELECTROPLATING, PLATING, POLISHING, ANODIZING, AND COLORING.
GERALD CRAWFORD COMPANY (3031 THORNTON AVENUE in BURBANK, CA)
AIR MAJOR (AIRS/AFS) STATE MASTER (California - Hazardous Waste Tracking) - HAZARDOU WASTE PROGRAM CRITERIA AND HAZARDOUS AIR POLLUTANT INVENTORY (Inventory of air pollution sources) Small Quantity Generators, between 100 kg and 1000 kg of hazardous waste/month (Resource Conservation and Recovery Act (tracking hazardous waste)) - notification Business SIC classification: COMMERCIAL PRINTING, LITHOGRAPHIC Business NAICS classification: OTHER COMMERCIAL PRINTING. Alternative names: CRAWFORD PRINTING
ED&D ELECTRONICS (43110 WINONA in BURBANK, CA)
Small Quantity Generators, between 100 kg and 1000 kg of hazardous waste/month (Resource Conservation and Recovery Act (tracking hazardous waste)) Small Quantity Generators, between 100 kg and 1000 kg of hazardous waste/month (Resource Conservation and Recovery Act (tracking hazardous waste)) - notification (Resource Conservation and Recovery Act (tracking hazardous waste)) Business NAICS classification: CURRENT-CARRYING WIRING DEVICE MANUFACTURING. Organizations: SUNBANK ELECTRONICS INC. (CONTACT/OPERATOR)
, JOSLYN CORP/D P CRONIN (CONTACT/OWNER)
, SUNBANK (CONTACT/OWNER)
Alternative names: ED & ELECTRONICS, SUNBANK ELECTRONICS INC.
LOCKHEED LADC PLANT B 1 B180 (2300 W EMPIRE BLVD in BURBANK, CA)
ALUMINUM DIP BRAZE CO (2537 N ONTARIO ST in BURBANK, CA)
STATE MASTER (California - Hazardous Waste Tracking) - HAZARDOU WASTE PROGRAM Small Quantity Generators, between 100 kg and 1000 kg of hazardous waste/month (Resource Conservation and Recovery Act (tracking hazardous waste)) - notification Business NAICS classification: METAL HEAT TREATING. Organizations: J TIECHE AND B BECKMANN (CONTACT/OWNER)
ELECTRICAL ADVERTISING INC (2545 ONTARIO ST in BURBANK, CA)
STATE MASTER (California - Hazardous Waste Tracking) - HAZARDOU WASTE PROGRAM Small Quantity Generators, between 100 kg and 1000 kg of hazardous waste/month (Resource Conservation and Recovery Act (tracking hazardous waste)) - notification Organizations: THOMAS W. ELLISON (CONTACT/OWNER)
CALTRANS BUENA VISTA (2600 N SAN FERNANDO RD in BURBANK, CA)
STATE MASTER (California - Hazardous Waste Tracking) - HAZARDOU WASTE PROGRAM Small Quantity Generators, between 100 kg and 1000 kg of hazardous waste/month (Resource Conservation and Recovery Act (tracking hazardous waste)) - notification TRANSPORTER (Resource Conservation and Recovery Act (tracking hazardous waste)) - notification Organizations: STATE OF CALIFORNIA (CONTACT/OWNER)
Alternative names: CALTRANS DISTRICT 7/BUENAVISTA MS.
MOLDING CORPORATION OF AMERICA (2701 N ONTARIO in BURBANK, CA)
STATE MASTER (California - Hazardous Waste Tracking) - HAZARDOU WASTE PROGRAM COMPLIANCE ACTIVITY (Tracking inspections of insecticide, fungicide, and rodenticide, and toxic substances) Small Quantity Generators, between 100 kg and 1000 kg of hazardous waste/month (Resource Conservation and Recovery Act (tracking hazardous waste)) - notification Business NAICS classification: ALL OTHER PLASTICS PRODUCT MANUFACTURING.
ALUMTREAT INC (2905 WINONA in BURBANK, CA)
Large Quantity Generators, more that 1000 kg of hazardous waste/month (Resource Conservation and Recovery Act (tracking hazardous waste)) TSD (Resource Conservation and Recovery Act (tracking hazardous waste)) (Resource Conservation and Recovery Act (tracking hazardous waste)) TRI REPORTER (Tracking of toxic chemicals releasing facilities) Business SIC classification: ELECTROPLATING, PLATING, POLISHING, ANODIZING, AND COLORING Alternative names: ALUMTREAT S. INC.
Housing units lacking complete plumbing facilities: 0.4% Housing units lacking complete kitchen facilities: 2.7%
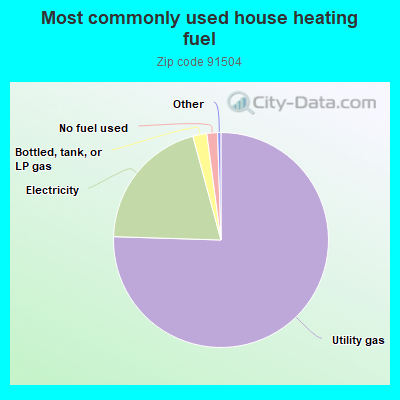
75.5%Utility gas
20.3%Electricity
2.1%Bottled, tank, or LP gas
1.6%No fuel used
Population in 1990: 22,656. Population change in the 1990s: +3,216 (+14.2%).
Place of birth for U.S.-born residents:
This state: 12,835
Northeast: 1,736
Midwest: 1,533
South: 932
West: 650
59% of the 91504 zip code residents lived in the same house 5 years ago. Out of people who lived in different houses, 80% lived in this county. Out of people who lived in different counties, 50% lived in California.
93% of the 91504 zip code residents lived in the same house 1 year ago. Out of people who lived in different houses, 78% moved from this county. Out of people who lived in different houses, 7% moved from different county within same state. Out of people who lived in different houses, 3% moved from different state. Out of people who lived in different houses, 13% moved from abroad.
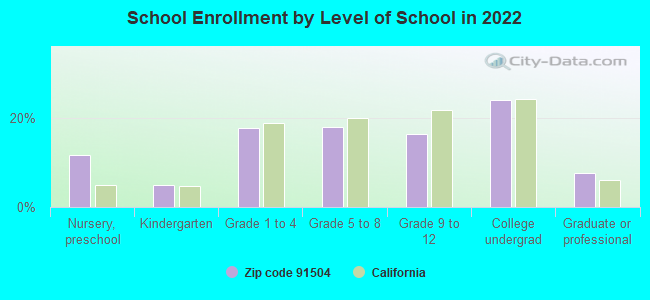
Private vs. public school enrollment:
Students in private schools in grades 1 to 8 (elementary and middle school): 222
Here:
9.8%
California:
10.5%
Students in private schools in grades 9 to 12 (high school): 86
Here:
8.3%
California:
8.5%
Students in private undergraduate colleges: 328
Here:
21.4%
California:
15.9%
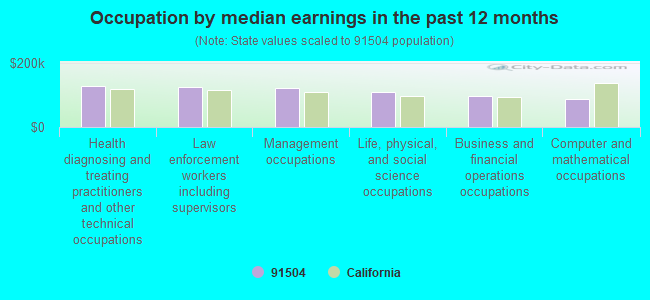
Occupation by median earnings in the past 12 months ($)
127,854Health diagnosing and treating practitioners and other technical occupations
126,213Law enforcement workers including supervisors
122,193Management occupations
109,088Life, physical, and social science occupations
97,922Business and financial operations occupations
89,084Computer and mathematical occupations
Companies with biggest federal contracts located in this zip code (BURBANK, CA):
HYDRO-AIRE, INC (3000 WINONA AVE) : $38,596,460 in 502 contractsfrom 1999 to 2006
Contracts for Aircraft Wheel and Brake Systems, Engine Fuel System Components, Aircraft and Missile Prime Movers, Aircraft Hydraulic, Vacuum, and De-icing System Components, Motors, Electrical, and moreby Air Force, Defense Logistics Agency, Navy, U.S. Coast Guard, and others Signed by year:2000: $5,889,881; 2001: $4,251,109; 2002: $4,264,566; 2003: $3,496,120; 2004: $5,799,751; 2005: $6,940,195; 2006: $7,314,677.
Biggest contracts:
$3,371,200 with Air Force for Aircraft Wheel and Brake Systems. Signed on 2006-03-23. Completion date: 2007-07-31.
$886,140 with Air Force for Engine Fuel System Components, Aircraft and Missile Prime Movers. Signed on 2006-04-14. Completion date: 2007-02-28.
$883,736 with Air Force for Aircraft Wheel and Brake Systems. Signed on 2006-03-23. Completion date: 2007-02-28.
$764,530, same as above.Signed on 2005-09-08. Completion date: 2006-10-31.
SENIOR OPERATIONS, INC (2980 N SAN FERNANDO BLVD) : $36,156,861 in 530 contractsfrom 1999 to 2006
Contracts for Airframe Structural Components, Engine Cooling System Components, Aircraft Prime Moving, Aircraft Air Conditioning, Heating, and Pressurizing Equipment, Pipe, Tube and Rigid Tubing, and moreby Defense Logistics Agency, United States Coast Guard (disused code: now 7008), Air Force, U.S. Coast Guard, and others Signed by year:2000: $4,097,446; 2001: $9,894,549; 2002: $4,610,178; 2003: $1,134,284; 2004: $6,924,199; 2005: $5,616,379; 2006: $2,624,739.
Biggest contracts:
$1,283,844 with Defense Logistics Agency for Airframe Structural Components. Signed on 2004-09-22. Completion date: 2004-09-24.
$932,200, same as above.Signed on 2004-04-15. Completion date: 2005-08-08.
$828,000 with United States Coast Guard (disused code: now 7008) for Airframe Structural Components. Signed on 2001-01-15. Completion date: 2003-02-15.
$710,920 with Defense Logistics Agency for Airframe Structural Components. Signed on 2001-02-26. Completion date: 2002-12-13.
ALUMINUM DIP BRAZE COMPANY (2537 N ONTARIO ST; small business) : $12,723,271 in 20 contractsfrom 2000 to 2006
Contracts for Airframe Structural Components, Antennas, Waveguides, and Related Equipment by Army, Defense Logistics Agency Signed by year:2000: $1,579,530; 2001: $1,129,030; 2002: $914,732; 2003: $1,527,478; 2004: $2,775,482; 2005: $2,251,594; 2006: $2,545,425.
Biggest contracts:
$2,663,952 with Army for Airframe Structural Components. Signed on 2004-07-09. Completion date: 2006-05-10.
$2,425,475, same as above.Signed on 2006-04-13. Completion date: 2010-10-15.
$1,375,387, same as above.Signed on 2005-10-19. Completion date: 2007-01-25.
$1,129,030, same as above.Signed on 2001-06-19. Completion date: 2006-05-10.
STELLEX BANDY MACHINING, INC (3420 N SAN FERNANDO BLVD; small business) 500 employees, $0 revenue. : $954,083 in 65 contractsfrom 2000 to 2006
Contracts for Airframe Structural Components, Hardware, Commercial, Hardware, Weapon System, Fans, Air Circulators, and Blower Equipment, and moreby Defense Logistics Agency, Army, U.S. Coast Guard Signed by year:2000: $51,424; 2001: $127,797; 2002: $255,296; 2003: $53,341; 2004: $83,376; 2005: $287,172; 2006: $95,677.
Biggest contracts:
$97,300 with Defense Logistics Agency for Airframe Structural Components. Signed on 2002-07-10. Completion date: 2002-11-07.
$83,400, same as above.Signed on 2002-09-10. Completion date: 2003-03-09.
$49,833 with Defense Logistics Agency for Hardware, Commercial. Signed on 2001-03-16. Completion date: 2001-08-14.
$48,000, same as above.Signed on 2001-11-18. Completion date: 2002-09-23.
SMUCK ENTERPRISES, INC (2800 N SAN FERNANDO BLVD; small business) : $654,699 in 14 contractsfrom 2003 to 2005
Contracts for Bushings, Rings, Shims, and Spacers, Gas Turbines and Jet Engines, Non-Aircraft; and Components, Aircraft Hydraulic, Vacuum, and De-icing System Components, Launchers, Torpedo and Depth Charge, and moreby Army, Defense Logistics Agency Signed by year:2000: $0; 2001: $0; 2002: $0; 2003: $394,817; 2004: $205,433; 2005: $54,449; 2006: $0.
Biggest contracts:
$201,164 with Army for Bushings, Rings, Shims, and Spacers. Signed on 2004-06-21. Completion date: 2005-07-29.
$127,756, same as above.Signed on 2003-08-29. Completion date: 2008-01-31.
$93,807, same as above.Signed on 2003-01-17. Completion date: 2003-10-31.
$65,814, same as above.Signed on 2003-05-13. Completion date: 2004-01-30.
ACCRATRONICS SEALS CORP (2211 KENMERE AVE; small business) : $517,737 in 14 contractsfrom 2000 to 2006
Contracts for Rockets, Rocket Ammunition and Rocket Components, Cartridge and Propellant Actuated Devices and Components, Cutlery and Flatware, Accounting Services (NOTE: New code created for Financial Services See R710 below) by Navy Signed by year:2000: $136,633; 2001: $33,562; 2002: $65,230; 2003: $37,380; 2004: $37,380; 2005: $137,340; 2006: $70,212.
Biggest contracts:
$99,960 with Navy for Rockets, Rocket Ammunition and Rocket Components. Signed on 2005-08-19. Completion date: 2005-11-22.
$90,410, same as above.Signed on 2000-08-15. Completion date: 2001-02-28.
$58,222 with Navy for Cartridge and Propellant Actuated Devices and Components. Signed on 2006-03-20. Completion date: 2006-07-31.
$46,223 with Navy for Cutlery and Flatware. Signed on 2000-07-20. Completion date: 2000-11-20.
VITEC BROADCAST SERVICES INC (2701 N ONTARIO ST) : $405,255 in 11 contractsfrom 2003 to 2006
Contracts for Miscellaneous Items, Other Defense -- Applied Research and Exploratory Development (R&D), Cameras, Motion Picture, Aerial Photographic Services, and moreby Air Force, Navy, Army, Assistant Secretary for Administration, and others Signed by year:2000: $0; 2001: $0; 2002: $0; 2003: $377,935; 2004: $5,583; 2005: $17,777; 2006: $3,960.
Biggest contracts:
$298,901 with Air Force for Miscellaneous Items. Signed on 2003-09-18. Completion date: 2003-10-15.
$79,034, same as above.Signed on 2003-10-15. Completion date: 2003-10-09.
$8,092 with Navy for Other Defense -- Applied Research and Exploratory Development (R&D). Taking place in DC. Signed on 2004-10-27. Completion date: 2004-11-02.
$7,200 with Army for Cameras, Motion Picture. Taking place in AL. Signed on 2005-09-26. Completion date: 2005-09-27.
THOMSON MULTIMEDIA (2255 N ONTARIO STREET, SUI) : $361,877 in 3 contractsfrom 2000 to 2001
$226,175 with Army for Cameras, Motion Picture. Signed on 2001-09-14. Completion date: 2001-11-30.
$77,788 with Department of Defense for Cameras, Motion Picture. Taking place in NJ. Signed on 2000-07-28. Completion date: 2000-11-15.
$57,914, same as above.Signed on 2001-02-28. Completion date: 2001-04-26.
DISKEEPER CORPORATION (7590 N GLENOAKS BLVD) : $321,719 in 29 contractsfrom 2001 to 2006
Contracts for ADP Software, ADP Supplies, ADP Facility Operation and Maintenance Services, Maintenance, Repair and Rebuilding of Equipment -- Automatic Data Processing Equipment (Including Firmware), Software, Supplies and Support Equipment, and moreby Army, Animal and Plant Health Inspection Service, Bureau of the Census, Maritime Administration, and others Signed by year:2000: $0; 2001: $126,183; 2002: $32,478; 2003: $41,231; 2004: $52,935; 2005: $42,943; 2006: $25,949.
Biggest contracts:
$126,183 with Army for ADP Software. Signed on 2001-11-21. Completion date: 2002-11-20.
$22,298, same as above.Signed on 2006-03-22. Completion date: 2006-03-01.
$21,241, same as above.Signed on 2005-01-27. Completion date: 2005-02-20.
$21,236 with Army for ADP Supplies. Signed on 2004-01-14. Completion date: 2005-02-21.
PACIFIC AERO COMPONENTS, INC (1823 N KEYSTONE ST; small business) : $168,620 in 14 contractsfrom 2005 to 2006
Contracts for Hose and Flexible Tubing, Bearings, Plain, Unmounted, Miscellaneous Aircraft Accessories and Components by Defense Logistics Agency, Air Force Signed by year:2000: $0; 2001: $0; 2002: $0; 2003: $0; 2004: $0; 2005: $114,236; 2006: $54,384.
Biggest contracts:
$35,490 with Defense Logistics Agency for Hose and Flexible Tubing. Signed on 2006-01-24. Completion date: 2006-03-21.
$28,563, same as above.Signed on 2005-08-17. Completion date: 2005-09-28.
$26,616, same as above.Signed on 2005-10-01. Completion date: 2005-12-24.
$12,060, same as above.Signed on 2006-01-19. Completion date: 2006-03-02.
Top industries in this zip code by the number of employees in 2005:
2005 - 2018 National Fire Incident Reporting System (NFIRS) incidents
Based on the data from the years 2005 - 2018 the average number of fire incidents per year is 38. The highest number of reported fires - 55 took place in 2005, and the least - 22 in 2010. The data has a declining trend.
When looking into fire subcategories, the most reports belonged to: Structure Fires (43.1%), and Mobile Property/Vehicle Fires (29.9%).
Fire incident types reported to NFIRS in Zip Code 91504


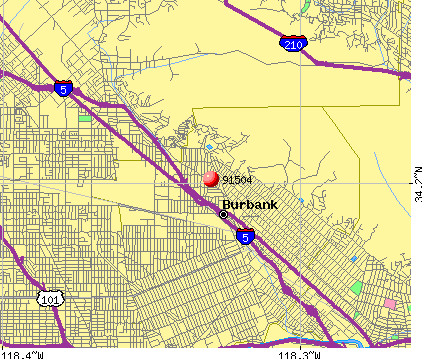 Nearest zip codes: 91502, 91501, 91506, 91505, 91352, 91201.
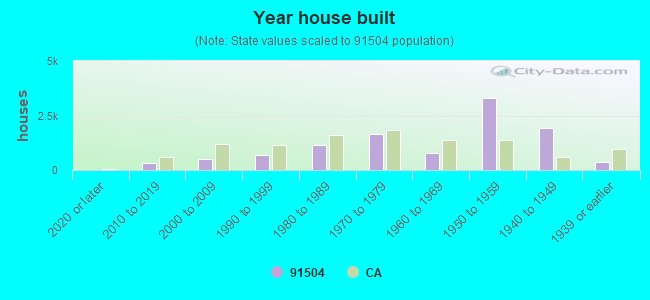


 Based on the data from the years 2005 - 2018 the average number of fire incidents per year is 38. The highest number of reported fires - 55 took place in 2005, and the least - 22 in 2010. The data has a declining trend.
 When looking into fire subcategories, the most reports belonged to: Structure Fires (43.1%), and Mobile Property/Vehicle Fires (29.9%).