Crime rate in Frisco, Texas (TX): murders, rapes, robberies, assaults, burglaries, thefts, auto thefts, arson, law enforcement employees, police officers, crime map
Crime rate in Frisco, TX
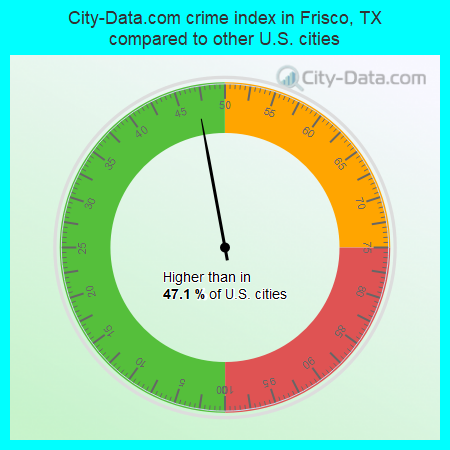
The 2022 crime rate in Frisco, TX is 92 (City-Data.com crime index), which is 2.7 times lower than the U.S. average. It was higher than in 47.1% U.S. cities. The 2022 Frisco crime rate rose by 10% compared to 2021. In the last 5 years Frisco has seen increasing violent crime and decreasing property crime.See how dangerous Frisco, TX is compared to the nearest cities:
(Note: Higher means more crime)
(Note: Higher means more crime)
| Frisco: | 92.1 |
| The Colony: | 230.7 |
| Prosper: | 69.0 |
| Little Elm: | 86.0 |
| Plano: | 144.1 |
| Allen: | 76.6 |
| McKinney: | 88.8 |
| Fairview: | 36.4 |
| Carrollton: | 147.7 |
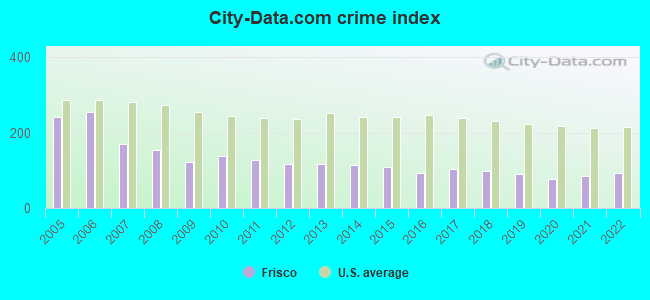
The City-Data.com crime index weighs serious crimes and violent crimes more heavily. Higher means more crime, U.S. average is 246.1. It adjusts for the number of visitors and daily workers commuting into cities.
- means the value is smaller than the state average.
According to our research of Texas and other state lists, there were 37 registered sex offenders living in Frisco, Texas as of April 28, 2024.
The ratio of all residents to sex offenders in Frisco is 4,422 to 1.
The ratio of registered sex offenders to all residents in this city is much lower than the state average.
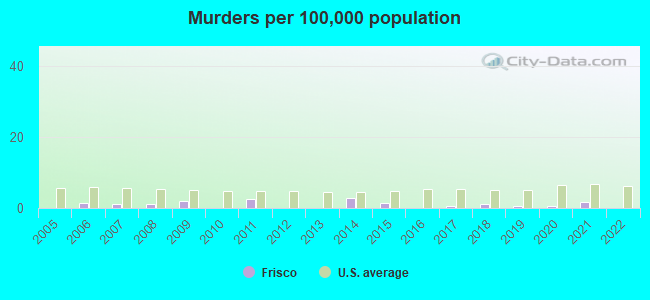
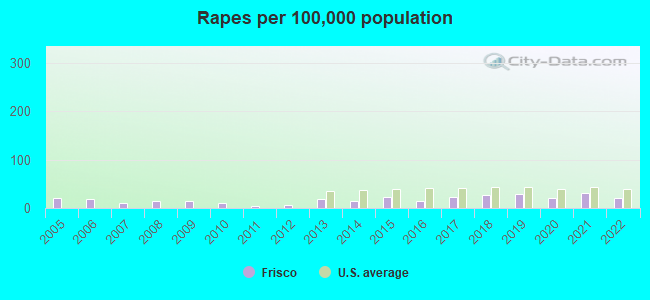
Violent crime rate in 2022
| Frisco: | 61.2 |
| U.S. Average: | 219.8 |
Violent crime rate in 2021
| Frisco: | 68.3 |
| U.S. Average: | 224.8 |
Violent crime rate in 2020
| Frisco: | 56.4 |
| U.S. Average: | 228.2 |
Violent crime rate in 2019
| Frisco: | 57.7 |
| U.S. Average: | 219.9 |
Violent crime rate in 2018
| Frisco: | 59.6 |
| U.S. Average: | 221.2 |
Violent crime rate in 2017
| Frisco: | 61.9 |
| U.S. Average: | 226.2 |
Violent crime rate in 2016
| Frisco: | 47.0 |
| U.S. Average: | 227.3 |
Violent crime rate in 2015
| Frisco: | 60.3 |
| U.S. Average: | 219.3 |
Violent crime rate in 2014
| Frisco: | 53.2 |
| U.S. Average: | 211.1 |
Violent crime rate in 2013
| Frisco: | 48.6 |
| U.S. Average: | 214.2 |
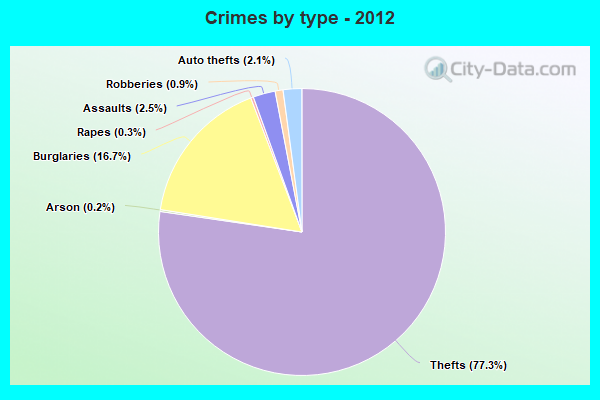
Violent crime rate in 2012
| Frisco: | 43.0 |
| U.S. Average: | 187.4 |
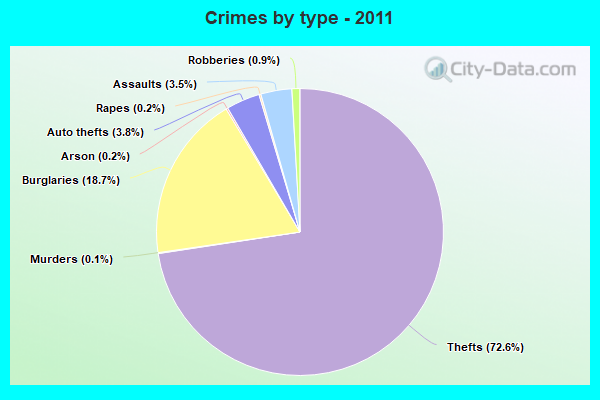
Violent crime rate in 2011
| Frisco: | 56.9 |
| U.S. Average: | 187.1 |
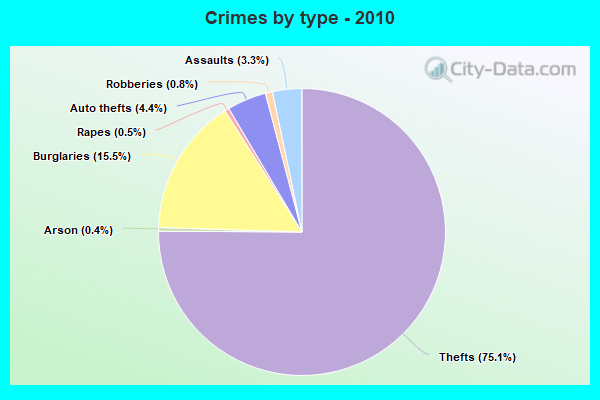
Violent crime rate in 2010
| Frisco: | 60.7 |
| U.S. Average: | 195.7 |
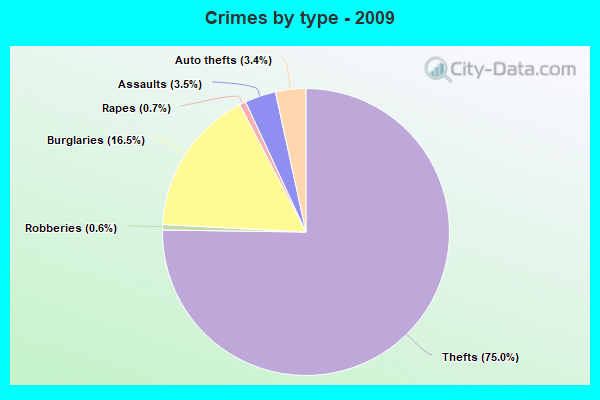
Violent crime rate in 2009
| Frisco: | 60.0 |
| U.S. Average: | 208.9 |
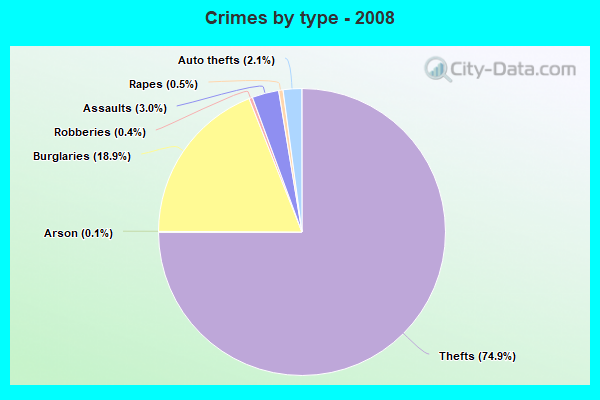
Violent crime rate in 2008
| Frisco: | 61.3 |
| U.S. Average: | 222.5 |
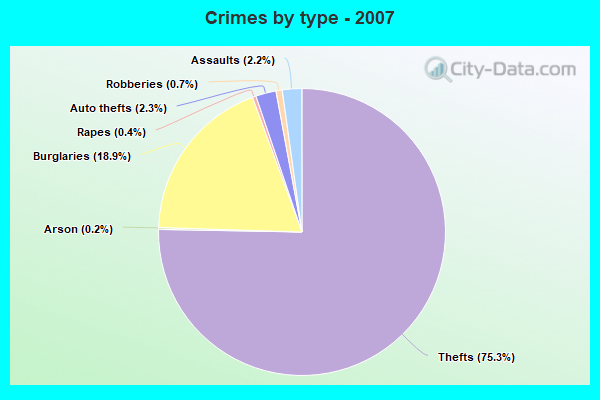
Violent crime rate in 2007
| Frisco: | 58.3 |
| U.S. Average: | 229.1 |
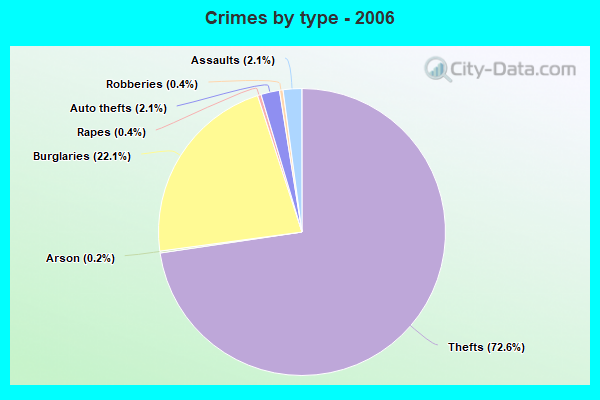
Violent crime rate in 2006
| Frisco: | 78.8 |
| U.S. Average: | 232.6 |
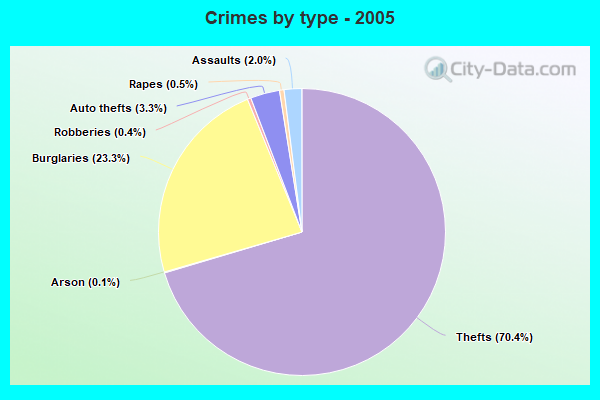
Violent crime rate in 2005
| Frisco: | 72.2 |
| U.S. Average: | 227.0 |
Property crime rate in 2022
| Frisco: | 87.0 |
| U.S. Average: | 166.5 |
Property crime rate in 2021
| Frisco: | 62.7 |
| U.S. Average: | 157.8 |
Property crime rate in 2020
| Frisco: | 70.9 |
| U.S. Average: | 169.6 |
Property crime rate in 2019
| Frisco: | 84.4 |
| U.S. Average: | 179.7 |
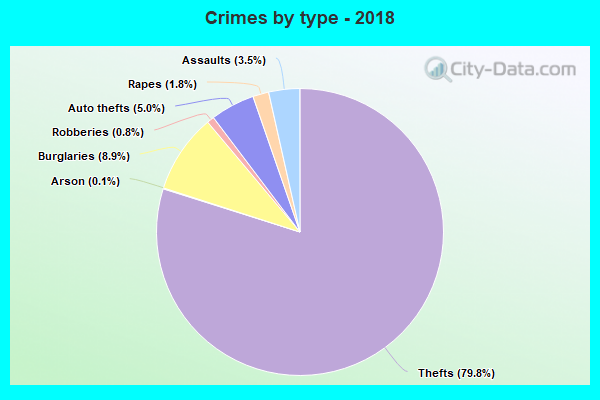
Property crime rate in 2018
| Frisco: | 95.6 |
| U.S. Average: | 190.2 |
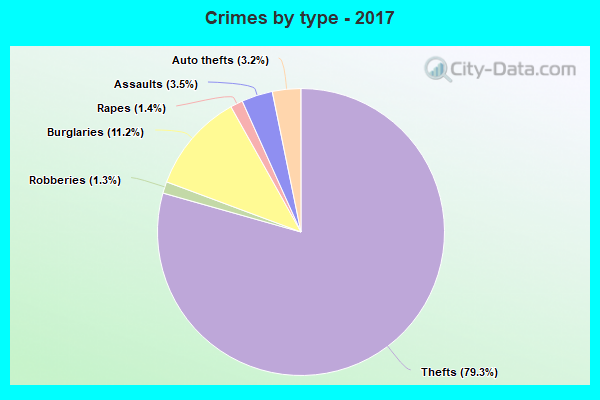
Property crime rate in 2017
| Frisco: | 106.7 |
| U.S. Average: | 206.4 |
Property crime rate in 2016
| Frisco: | 106.6 |
| U.S. Average: | 216.6 |
Property crime rate in 2015
| Frisco: | 118.4 |
| U.S. Average: | 221.5 |
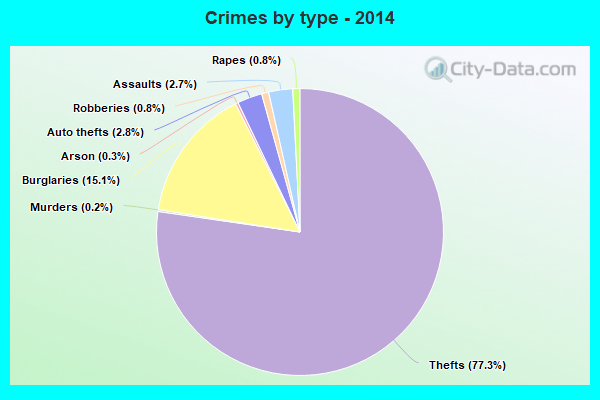
Property crime rate in 2014
| Frisco: | 137.1 |
| U.S. Average: | 230.8 |
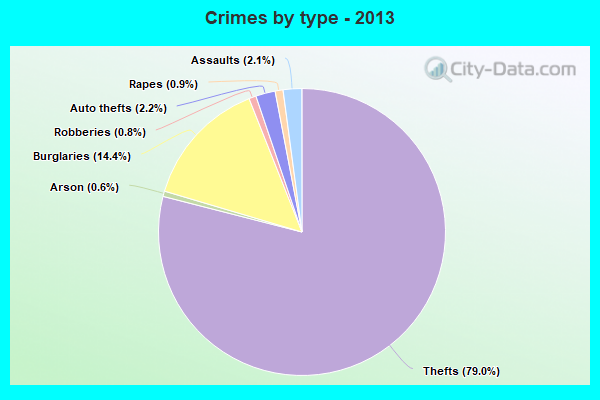
Property crime rate in 2013
| Frisco: | 143.7 |
| U.S. Average: | 250.4 |
Property crime rate in 2012
| Frisco: | 160.9 |
| U.S. Average: | 267.3 |
Property crime rate in 2011
| Frisco: | 172.5 |
| U.S. Average: | 273.5 |
Property crime rate in 2010
| Frisco: | 180.0 |
| U.S. Average: | 276.4 |
Property crime rate in 2009
| Frisco: | 152.2 |
| U.S. Average: | 285.6 |
Property crime rate in 2008
| Frisco: | 210.4 |
| U.S. Average: | 302.2 |
Property crime rate in 2007
| Frisco: | 244.7 |
| U.S. Average: | 309.2 |
Property crime rate in 2006
| Frisco: | 387.2 |
| U.S. Average: | 317.3 |
Property crime rate in 2005
| Frisco: | 372.1 |
| U.S. Average: | 322.3 |

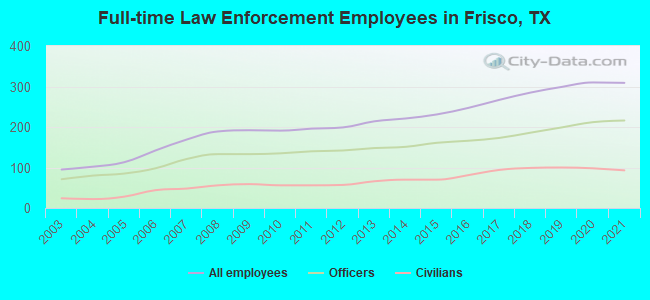
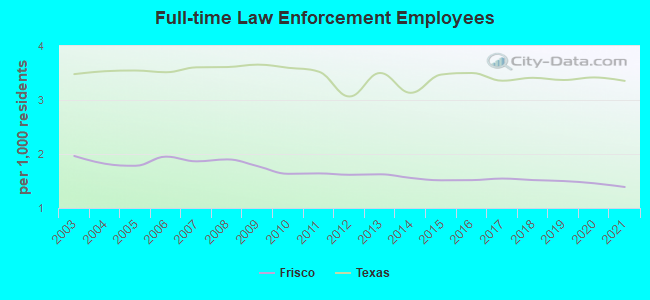
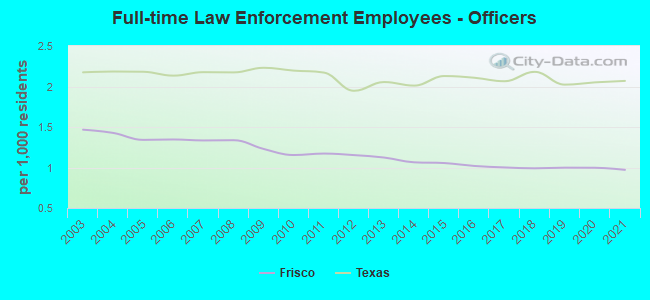
Full-time law enforcement employees in 2021, including police officers: 309 (216 officers - 199 male; 17 female).
| Officers per 1,000 residents here: | 0.97 |
| Texas average: | 2.07 |
Full-time law enforcement employees in 2020, including police officers: 310 (212 officers - 196 male; 16 female).
| Officers per 1,000 residents here: | 1.00 |
| Texas average: | 2.05 |
Full-time law enforcement employees in 2019, including police officers: 299 (199 officers - 182 male; 17 female).
| Officers per 1,000 residents here: | 1.00 |
| Texas average: | 2.02 |
Full-time law enforcement employees in 2018, including police officers: 285 (186 officers - 168 male; 18 female).
| Officers per 1,000 residents here: | 0.99 |
| Texas average: | 2.18 |
Full-time law enforcement employees in 2017, including police officers: 267 (173 officers - 156 male; 17 female).
| Officers per 1,000 residents here: | 1.00 |
| Texas average: | 2.06 |
Full-time law enforcement employees in 2016, including police officers: 247 (166 officers - 150 male; 16 female).
| Officers per 1,000 residents here: | 1.02 |
| Texas average: | 2.11 |
Full-time law enforcement employees in 2015, including police officers: 231 (161 officers - 148 male; 13 female).
| Officers per 1,000 residents here: | 1.05 |
| Texas average: | 2.13 |
Full-time law enforcement employees in 2014, including police officers: 221 (151 officers - 138 male; 13 female).
| Officers per 1,000 residents here: | 1.06 |
| Texas average: | 2.01 |
Full-time law enforcement employees in 2013, including police officers: 214 (148 officers - 136 male; 12 female).
| Officers per 1,000 residents here: | 1.12 |
| Texas average: | 2.05 |
Full-time law enforcement employees in 2012, including police officers: 199 (142 officers - 130 male; 12 female).
| Officers per 1,000 residents here: | 1.15 |
| Texas average: | 1.95 |
Full-time law enforcement employees in 2011, including police officers: 196 (140 officers - 127 male; 13 female).
| Officers per 1,000 residents here: | 1.17 |
| Texas average: | 2.17 |
Full-time law enforcement employees in 2010, including police officers: 191 (135 officers - 119 male; 16 female).
| Officers per 1,000 residents here: | 1.15 |
| Texas average: | 2.20 |
Full-time law enforcement employees in 2009, including police officers: 192 (133 officers - 118 male; 15 female).
| Officers per 1,000 residents here: | 1.23 |
| Texas average: | 2.23 |
Full-time law enforcement employees in 2008, including police officers: 189 (133 officers - 117 male; 16 female).
| Officers per 1,000 residents here: | 1.34 |
| Texas average: | 2.17 |
Full-time law enforcement employees in 2007, including police officers: 169 (121 officers - 108 male; 13 female).
| Officers per 1,000 residents here: | 1.33 |
| Texas average: | 2.18 |
Full-time law enforcement employees in 2006, including police officers: 142 (98 officers - 92 male; 6 female).
| Officers per 1,000 residents here: | 1.35 |
| Texas average: | 2.13 |
Full-time law enforcement employees in 2005, including police officers: 113 (85 officers - 77 male; 8 female).
| Officers per 1,000 residents here: | 1.34 |
| Texas average: | 2.18 |
Full-time law enforcement employees in 2004, including police officers: 102 (80 officers - 72 male; 8 female).
| Officers per 1,000 residents here: | 1.43 |
| Texas average: | 2.19 |
Full-time law enforcement employees in 2003, including police officers: 95 (71 officers - 62 male; 9 female).
| Officers per 1,000 residents here: | 1.47 |
| Texas average: | 2.17 |