Frisco, Texas
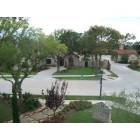
Frisco: Latera Neighborhood
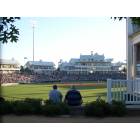
Frisco: Inside the Ballpark
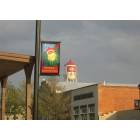
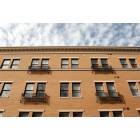
Frisco: Old Downtown
Frisco: Dr. Pepper/7Up Ballpark - Home of the Frisco Roughriders
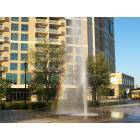
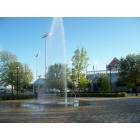
Frisco: Frisco Fountain Rainbow
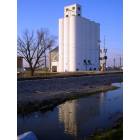
Frisco: A New Building In Frisco, Texas
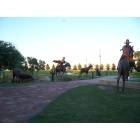
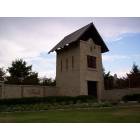
Frisco: Shawnee Trail Memorial
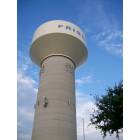
Frisco: New Frisco Water Tower
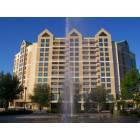
Frisco: Embassy Suites Hotel
Frisco: The Trails Neighborhood
Frisco: Old Downtown Xilo
- see
22
more - add
your
Submit your own pictures of this city and show them to the world
- OSM Map
- General Map
- Google Map
- MSN Map
Population change since 2000: +551.3%
| Males: 109,861 | |
| Females: 109,726 |
| Median resident age: | 38.3 years |
| Texas median age: | 35.6 years |
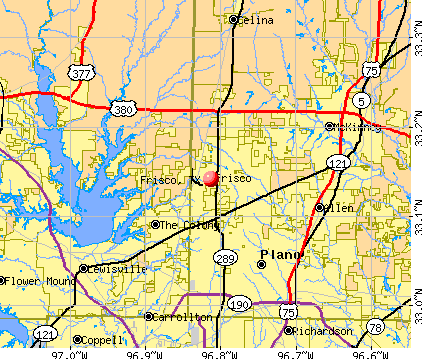
Zip codes: 75024, 75034, 75035, 75068, 75070.
Frisco Zip Code Map| Frisco: | $145,914 |
| TX: | $72,284 |
Estimated per capita income in 2022: $66,784 (it was $34,089 in 2000)
Frisco city income, earnings, and wages data
Estimated median house or condo value in 2022: $669,900 (it was $156,000 in 2000)
| Frisco: | $669,900 |
| TX: | $275,400 |
Mean prices in 2022: all housing units: $551,517; detached houses: $553,737; townhouses or other attached units: $424,244; mobile homes: $135,130
Median gross rent in 2022: $1,851.
(3.3% for White Non-Hispanic residents, 4.5% for Black residents, 2.6% for Hispanic or Latino residents, 1.0% for American Indian residents, 3.6% for other race residents, 1.4% for two or more races residents)
Detailed information about poverty and poor residents in Frisco, TX


Compare current foreclosures in Frisco, TX:
| Photo | Address | Area | Beds / Baths | Price | Details |
|---|---|---|---|---|---|

|
#1
Eastpark Ln
Frisco, TX 75033
|
1,874 sq. feet
|
3 baths 3 beds |
$397,800
|
show details |

|
#2
Baton Rouge Blvd
Frisco, TX 75035
|
1,889 sq. feet
|
2 baths 3 beds |
show details | |

|
#3
Barnhill Ln
Frisco, TX 75034
|
4,157 sq. feet
|
3 baths 4 beds |
show details | |

|
#4
Samantha Dr
Frisco, TX 75035
|
2,873 sq. feet
|
2 baths 4 beds |
show details | |

|
#5
Ducks Lndg
Frisco, TX 75033
|
3,146 sq. feet
|
2 baths 4 beds |
show details | |

|
#6
Oliver Ln
Frisco, TX 75035
|
1,586 sq. feet
|
2 baths 3 beds |
show details | |

|
#7
Arcadia Dr
Frisco, TX 75035
|
2,720 sq. feet
|
4 baths 5 beds |
show details | |

|
#8
Sandy Creek Dr
Frisco, TX 75033
|
3,136 sq. feet
|
3 baths 4 beds |
show details | |

|
#9
Firenze Ln
Frisco, TX 75034
|
1,670 sq. feet
|
2 baths 2 beds |
show details | |

|
#10
Santa Rosa Dr
Frisco, TX 75033
|
1,240 sq. feet
|
1 baths 3 beds |
show details |
| Photo | Address | Area | Beds / Baths | Price | Details |
|---|---|---|---|---|---|

|
#11
Danbridge Ln
Frisco, TX 75035
|
1,290 sq. feet
|
1 baths 3 beds |
show details | |

|
#12
Kings Ridge Rd
Frisco, TX 75035
|
1,568 sq. feet
|
2 baths 3 beds |
show details | |

|
#13
Shamrock Dr
Frisco, TX 75034
|
2,967 sq. feet
|
2 baths 4 beds |
show details | |

|
#14
Lincoln Dr
Frisco, TX 75034
|
1,638 sq. feet
|
2 baths 3 beds |
show details | |

|
#15
Saint Augustine Dr
Frisco, TX 75033
|
1,995 sq. feet
|
2 baths 4 beds |
show details | |

|
#16
Wyndbrook Dr
Frisco, TX 75035
|
3,685 sq. feet
|
3 baths 5 beds |
show details | |

|
#17
Baton Rouge Blvd
Frisco, TX 75035
|
1,889 sq. feet
|
2 baths 3 beds |
show details | |

|
#18
Princess Ln
Frisco, TX 75034
|
3,655 sq. feet
|
2 baths 3 beds |
show details | |

|
#19
Wingfield Ln
Frisco, TX 75035
|
2,206 sq. feet
|
3 baths 4 beds |
show details | |

|
#20
Orchard Park Dr
Frisco, TX 75034
|
4,316 sq. feet
|
4 baths 5 beds |
show details |
| Photo | Address | Area | Beds / Baths | Price | Details |
|---|---|---|---|---|---|

|
#21
Coach House Ln
Frisco, TX 75035
|
2,775 sq. feet
|
2 baths 4 beds |
show details | |

|
#22
Prescott Dr
Frisco, TX 75033
|
2,832 sq. feet
|
3 baths 4 beds |
show details | |

|
#23
Seneca Dr
Frisco, TX 75034
|
4,779 sq. feet
|
5 baths 5 beds |
show details | |

|
#24
Continental Dr
Frisco, TX 75034
|
3,573 sq. feet
|
2 baths 4 beds |
show details | |

|
#25
Fountainbridge Dr
Frisco, TX 75035
|
2,148 sq. feet
|
2 baths 3 beds |
show details | |

|
#26
Malibu St
Frisco, TX 75033
|
1,485 sq. feet
|
2 baths 3 beds |
show details | |

|
#27
Republic Dr
Frisco, TX 75034
|
1,638 sq. feet
|
2 baths 3 beds |
show details | |

|
#28
Bloomfield Ln
Frisco, TX 75033
|
5,050 sq. feet
|
3 baths 5 beds |
show details | |

|
#29
Barbarosa Dr
Frisco, TX 75035
|
2,038 sq. feet
|
2 baths 3 beds |
show details | |

|
#30
Corsicana Dr
Frisco, TX 75035
|
3,439 sq. feet
|
3 baths 4 beds |
show details |
| Photo | Address | Area | Beds / Baths | Price | Details |
|---|---|---|---|---|---|

|
#31
Amberdale Ln
Frisco, TX 75034
|
4,139 sq. feet
|
4 baths 5 beds |
show details | |

|
#32
Bay St
Frisco, TX 75035
|
1,411 sq. feet
|
2 baths 3 beds |
show details | |

|
#33
Monticello Dr
Frisco, TX 75035
|
1,417 sq. feet
|
2 baths 3 beds |
show details | |

|
#34
Creekmere Dr
Frisco, TX 75035
|
3,642 sq. feet
|
3 baths 4 beds |
show details | |

|
#35
Carriage Hill Ln
Frisco, TX 75035
|
4,041 sq. feet
|
4 baths 5 beds |
show details | |

|
#36
Robincreek Ln
Frisco, TX 75035
|
2,140 sq. feet
|
2 baths 4 beds |
show details | |

|
#37
Kings Ridge Rd
Frisco, TX 75035
|
2,262 sq. feet
|
2 baths 4 beds |
show details | |

|
#38
Paisano Dr
Frisco, TX 75035
|
2,842 sq. feet
|
2 baths 4 beds |
show details | |

|
#39
Cain River Dr
Frisco, TX 75035
|
1,835 sq. feet
|
2 baths 2 beds |
show details | |

|
#40
Tambra Dr
Frisco, TX 75033
|
4,093 sq. feet
|
3 baths 6 beds |
show details |
| Photo | Address | Area | Beds / Baths | Price | Details |
|---|---|---|---|---|---|

|
#41
Memorial Dr
Frisco, TX 75034
|
3,829 sq. feet
|
3 baths 3 beds |
show details | |

|
#42
Kings Ridge Rd
Frisco, TX 75035
|
2,056 sq. feet
|
2 baths 3 beds |
show details | |

|
#43
Golfside Dr
Frisco, TX 75035
|
2,830 sq. feet
|
3 baths 3 beds |
show details | |

|
#44
Kings Ridge Rd
Frisco, TX 75035
|
2,056 sq. feet
|
2 baths 3 beds |
show details | |

|
#45
Midway Dr
Frisco, TX 75035
|
2,064 sq. feet
|
2 baths 4 beds |
show details | |

|
#46
Stonewyck Ln
Frisco, TX 75033
|
4,440 sq. feet
|
4 baths 5 beds |
show details | |

|
#47
Estacado Dr
Frisco, TX 75033
|
4,175 sq. feet
|
3 baths 4 beds |
show details | |

|
#48
Hague Dr
Frisco, TX 75033
|
4,997 sq. feet
|
2 baths 3 beds |
show details | |

|
#49
Inlet St
Frisco, TX 75035
|
1,743 sq. feet
|
2 baths 3 beds |
show details | |

|
Check over 1 million property listings on Foreclosure.com!
|
browse all offers | |||


- 99,83945.5%White alone
- 58,25226.5%Asian alone
- 30,98914.1%Hispanic
- 20,0629.1%Black alone
- 8,7014.0%Two or more races
- 1,6290.7%Other race alone
- 720.03%American Indian alone
- 270.01%Native Hawaiian and Other
Pacific Islander alone
Races in Frisco detailed stats: ancestries, foreign born residents, place of birth
According to our research of Texas and other state lists, there were 37 registered sex offenders living in Frisco, Texas as of April 26, 2024.
The ratio of all residents to sex offenders in Frisco is 4,422 to 1.
The ratio of registered sex offenders to all residents in this city is much lower than the state average.
The City-Data.com crime index weighs serious crimes and violent crimes more heavily. Higher means more crime, U.S. average is 246.1. It adjusts for the number of visitors and daily workers commuting into cities.
- means the value is smaller than the state average.
Crime rate in Frisco detailed stats: murders, rapes, robberies, assaults, burglaries, thefts, arson
Full-time law enforcement employees in 2021, including police officers: 309 (216 officers - 199 male; 17 female).
| Officers per 1,000 residents here: | 0.97 |
| Texas average: | 2.07 |
 Recent articles from our blog. Our writers, many of them Ph.D. graduates or candidates, create easy-to-read articles on a wide variety of topics.


Latest news from Frisco, TX collected exclusively by city-data.com from local newspapers, TV, and radio stations
Frisco, TX City Guides:
Ancestries: English (5.9%), German (5.4%), American (5.2%), Irish (3.2%), European (2.4%), Italian (2.1%).
Current Local Time: CST time zone
Land area: 69.9 square miles.
Population density: 3,142 people per square mile (average).
52,999 residents are foreign born (17.7% Asia, 3.9% Latin America).
| This city: | 24.4% |
| Texas: | 17.1% |
Median real estate property taxes paid for housing units with mortgages in 2022: $9,156 (1.3%)
Median real estate property taxes paid for housing units with no mortgage in 2022: $7,469 (1.3%)
Nearest city with pop. 50,000+: Plano, TX  (7.4 miles , pop. 222,030).
Nearest city with pop. 1,000,000+: Dallas, TX (23.7 miles , pop. 1,188,580).
Nearest cities:
), ), )Latitude: 33.14 N, Longitude: 96.81 W
Daytime population change due to commuting: -6,818 (-3.1%)
Workers who live and work in this city: 66,733 (57.1%)
Area codes: 972, 469, 214
Property values in Frisco, TX
Frisco tourist attractions:
Frisco, Texas accommodation & food services, waste management - Economy and Business Data
Single-family new house construction building permits:
- 2022: 1327 buildings, average cost: $250,200
- 2021: 1879 buildings, average cost: $236,200
- 2020: 2444 buildings, average cost: $234,300
- 2019: 2081 buildings, average cost: $242,200
- 2018: 2205 buildings, average cost: $254,300
- 2017: 1935 buildings, average cost: $265,400
- 2016: 2204 buildings, average cost: $270,300
- 2015: 2280 buildings, average cost: $275,600
- 2014: 2165 buildings, average cost: $278,900
- 2013: 2220 buildings, average cost: $275,500
- 2012: 1578 buildings, average cost: $269,300
- 2011: 1309 buildings, average cost: $264,800
- 2010: 1284 buildings, average cost: $250,800
- 2009: 917 buildings, average cost: $235,200
- 2008: 1076 buildings, average cost: $243,300
- 2007: 1719 buildings, average cost: $230,700
- 2006: 3414 buildings, average cost: $251,400
- 2005: 3686 buildings, average cost: $236,800
- 2004: 3414 buildings, average cost: $239,700
- 2003: 2795 buildings, average cost: $234,200
- 2002: 2801 buildings, average cost: $215,400
- 2001: 2040 buildings, average cost: $171,700
- 2000: 2447 buildings, average cost: $154,900
- 1999: 1718 buildings, average cost: $143,300
- 1998: 1281 buildings, average cost: $139,400
- 1997: 1189 buildings, average cost: $120,300
| Here: | 3.2% |
| Texas: | 3.5% |
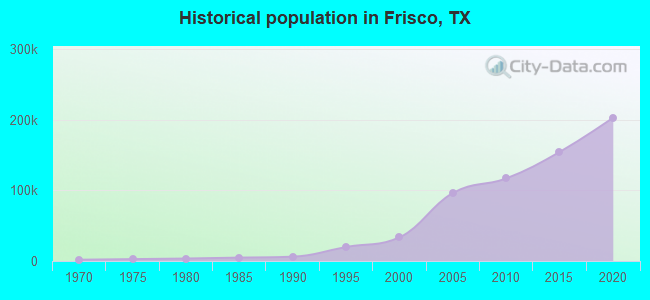
Population change in the 1990s: +27,132 (+412.2%).
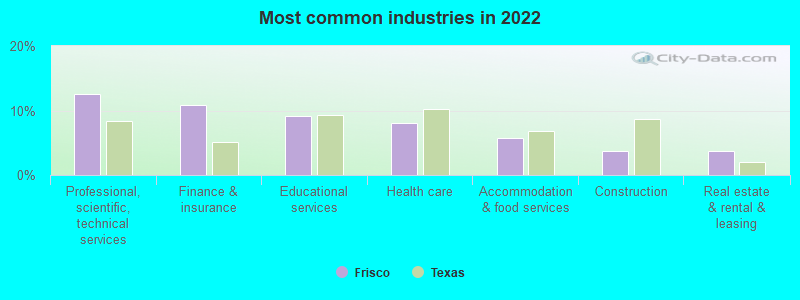
- Professional, scientific, technical services (12.6%)
- Finance & insurance (10.8%)
- Educational services (9.1%)
- Health care (8.1%)
- Accommodation & food services (5.8%)
- Construction (3.8%)
- Real estate & rental & leasing (3.7%)
- Professional, scientific, technical services (14.8%)
- Finance & insurance (12.5%)
- Construction (6.2%)
- Accommodation & food services (5.4%)
- Educational services (5.1%)
- Broadcasting & telecommunications (4.2%)
- Health care (3.6%)
- Educational services (13.9%)
- Health care (13.4%)
- Professional, scientific, technical services (10.0%)
- Finance & insurance (8.8%)
- Accommodation & food services (6.3%)
- Real estate & rental & leasing (5.4%)
- Department & other general merchandise stores (3.8%)
- Computer specialists (7.9%)
- Other management occupations, except farmers and farm managers (7.3%)
- Top executives (5.1%)
- Cooks and food preparation workers (3.4%)
- Advertising, marketing, promotions, public relations, and sales managers (3.2%)
- Retail sales workers, except cashiers (3.2%)
- Secretaries and administrative assistants (3.1%)
- Computer specialists (10.3%)
- Other management occupations, except farmers and farm managers (9.4%)
- Top executives (6.8%)
- Advertising, marketing, promotions, public relations, and sales managers (4.0%)
- Engineers (3.5%)
- Retail sales workers, except cashiers (3.4%)
- Cooks and food preparation workers (3.3%)
- Secretaries and administrative assistants (6.2%)
- Computer specialists (5.1%)
- Other management occupations, except farmers and farm managers (4.9%)
- Other office and administrative support workers, including supervisors (4.0%)
- Registered nurses (3.6%)
- Cooks and food preparation workers (3.4%)
- Cashiers (3.2%)
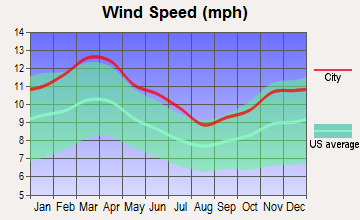
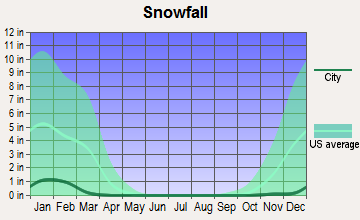
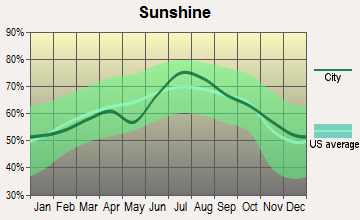
Average climate in Frisco, Texas
Based on data reported by over 4,000 weather stations

|
|


(lower is better)
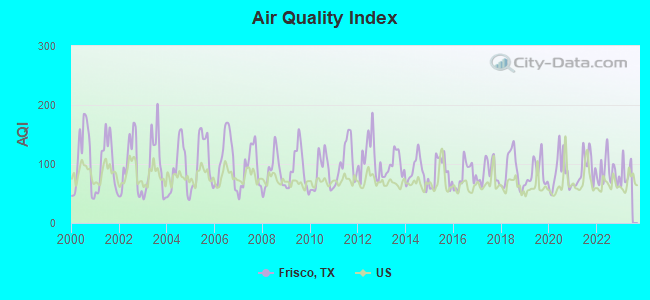
Air Quality Index (AQI) level in 2022 was 86.5. This is about average.
| City: | 86.5 |
| U.S.: | 72.6 |
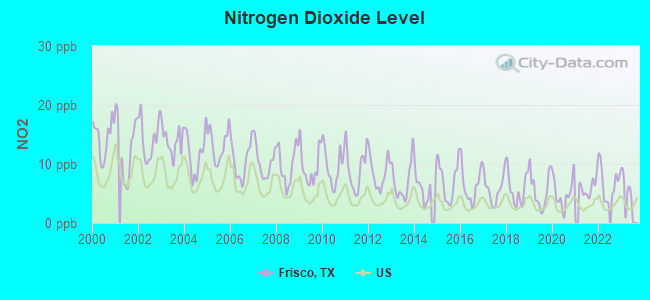
Nitrogen Dioxide (NO2) [ppb] level in 2022 was 6.77. This is worse than average. Closest monitor was 15.3 miles away from the city center.
| City: | 6.77 |
| U.S.: | 5.11 |
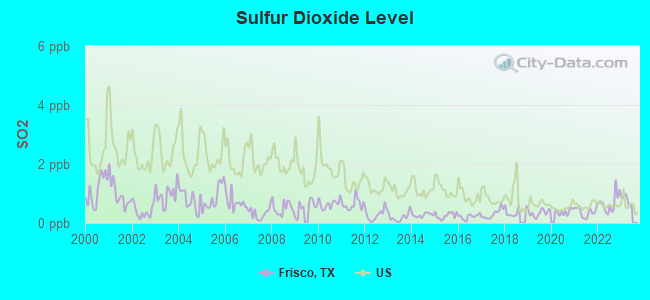
Sulfur Dioxide (SO2) [ppb] level in 2022 was 0.679. This is significantly better than average. Closest monitor was 15.3 miles away from the city center.
| City: | 0.679 |
| U.S.: | 1.515 |
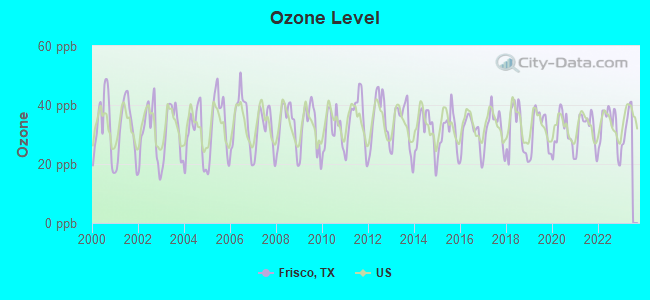
Ozone [ppb] level in 2022 was 32.6. This is about average. Closest monitor was 1.7 miles away from the city center.
| City: | 32.6 |
| U.S.: | 33.3 |
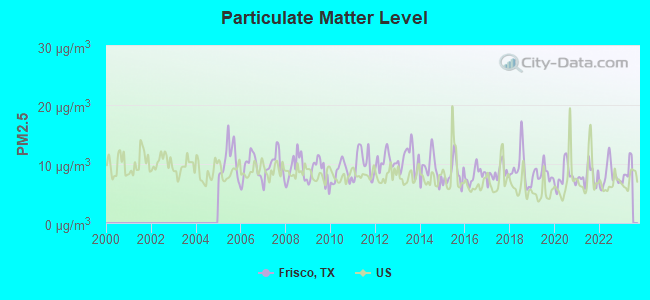
Particulate Matter (PM2.5) [µg/m3] level in 2022 was 8.02. This is about average. Closest monitor was 1.7 miles away from the city center.
| City: | 8.02 |
| U.S.: | 8.11 |
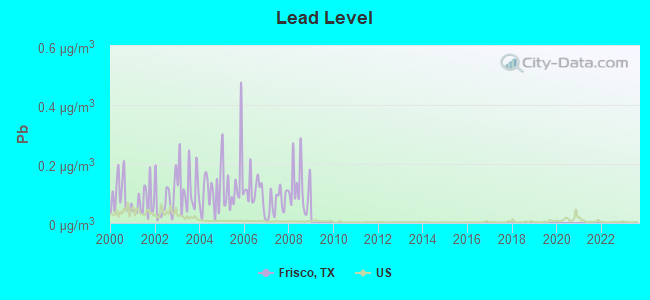
Lead (Pb) [µg/m3] level in 2008 was 0.121. This is significantly worse than average. Closest monitor was 0.6 miles away from the city center.
| City: | 0.121 |
| U.S.: | 0.009 |
Tornado activity:
Frisco-area historical tornado activity is above Texas state average. It is 152% greater than the overall U.S. average.
On 4/2/1957, a category F3 (max. wind speeds 158-206 mph) tornado 3.0 miles away from the Frisco city center killed 10 people and injured 200 people and caused between $500,000 and $5,000,000 in damages.
On 4/25/1994, a category F4 (max. wind speeds 207-260 mph) tornado 33.6 miles away from the city center killed 3 people and injured 48 people and caused between $50,000,000 and $500,000,000 in damages.
Earthquake activity:
Frisco-area historical earthquake activity is significantly above Texas state average. It is 509% greater than the overall U.S. average.On 11/6/2011 at 03:53:10, a magnitude 5.7 (5.7 MW, Depth: 3.2 mi, Class: Moderate, Intensity: VI - VII) earthquake occurred 165.4 miles away from the city center
On 9/3/2016 at 12:02:44, a magnitude 5.8 (5.8 MW, Depth: 3.5 mi) earthquake occurred 227.2 miles away from Frisco center
On 6/16/1978 at 11:46:54, a magnitude 5.3 (4.4 MB, 4.6 UK, 5.3 ML) earthquake occurred 229.2 miles away from Frisco center
On 11/7/2016 at 01:44:24, a magnitude 5.0 (5.0 MW, Depth: 2.8 mi) earthquake occurred 197.1 miles away from Frisco center
On 11/8/2011 at 02:46:57, a magnitude 4.8 (4.8 MW, Depth: 3.1 mi, Class: Light, Intensity: IV - V) earthquake occurred 165.3 miles away from the city center
On 5/17/2012 at 08:12:00, a magnitude 4.8 (4.8 MW, Depth: 3.1 mi) earthquake occurred 165.5 miles away from Frisco center
Magnitude types: body-wave magnitude (MB), local magnitude (ML), moment magnitude (MW)
Natural disasters:
The number of natural disasters in Collin County (14) is near the US average (15).Major Disasters (Presidential) Declared: 5
Emergencies Declared: 8
Causes of natural disasters: Hurricanes: 5, Floods: 4, Storms: 4, Fires: 3, Tornadoes: 3, Other: 2 (Note: some incidents may be assigned to more than one category).

Main business address for: COMSTOCK RESOURCES INC (CRUDE PETROLEUM & NATURAL GAS).
Hospitals in Frisco:
- BAYLOR MEDICAL CENTER AT FRISCO (Proprietary, provides emergency services, 5601 WARREN PARKWAY)
- CENTENNIAL MEDICAL CENTER (Proprietary, provides emergency services, 12505 LEBANON ROAD)
- FRIENDLY HOSPICE SERVICES (10605 DRY CREEK LANE)
Nursing Homes in Frisco:
Dialysis Facilities in Frisco:
Home Health Centers in Frisco:
Airports and heliports located in Frisco:
See details about Airports and heliports located in Frisco, TXColleges/universities with over 2000 students nearest to Frisco:
- Collin County Community College District (about 11 miles; McKinney, TX; Full-time enrollment: 18,044)
- The University of Texas at Dallas (about 12 miles; Richardson, TX; FT enrollment: 16,777)
- Brookhaven College (about 15 miles; Farmers Branch, TX; FT enrollment: 6,868)
- Richland College (about 16 miles; Dallas, TX; FT enrollment: 11,617)
- DeVry University-Texas (about 19 miles; Irving, TX; FT enrollment: 4,098)
- Texas Woman's University (about 20 miles; Denton, TX; FT enrollment: 11,837)
- University of North Texas (about 21 miles; Denton, TX; FT enrollment: 31,694)
Biggest public high schools in Frisco:
- WAKELAND H S (Students: 2,055, Location: 10700 LEGACY DR, Grades: 9-12)
- LIBERTY H S (Students: 1,641, Location: 15250 ROLATER RD, Grades: 9-12)
- CENTENNIAL H S (Students: 1,617, Location: 6901 COIT RD, Grades: 9-12)
- FRISCO H S (Students: 1,442, Location: 6401 PARKWOOD BLVD, Grades: 9-12)
- HERITAGE H S (Students: 634, Location: 14040 ELDORADO PKWY, Grades: 9-12)
- STUDENT OPPORTUNITY CENTER (Location: 6928 MAPLE ST, Grades: 9-12)
- COLLIN CO J J A E P (Location: 5515 OHIO DR, Grades: 10-12)
- LONE STAR H S (Location: 2606 PANTHER CREEK PKWY, Grades: 9-12)
- REEDY H S (Location: 3003 STONEBROOK PKWY, Grades: 9-10)
- INDEPENDENCE H S (Location: 10555 INDEPENDENCE PKWY, Grades: 9-11)
Biggest public elementary/middle schools in Frisco:
- PIONEER HERITAGE MIDDLE (Students: 1,012, Location: 1649 HIGH SHOALS DR, Grades: 6-8)
- GRIFFIN MIDDLE SCHOOL (Students: 977, Location: 3703 EDORADO PKWY, Grades: 6-8)
- ROACH MIDDLE SCHOOL (Students: 902, Location: 12499 INDEPENDENCE PKWY, Grades: 6-8)
- PINK ELEMENTARY (Students: 806, Location: 3650 OVERHILL DR, Grades: KG-5)
- ROGERS ELEMENTARY (Students: 795, Location: 10500 ROGERS RD, Grades: KG-5)
- CLARK MIDDLE SCHOOL (Students: 776, Location: 4600 COLBY DR, Grades: 6-8)
- CORBELL EL (Students: 775, Location: 11095 MONARCH DR, Grades: KG-5)
- WESTER MIDDLE (Students: 766, Location: 12293 SHEPHERDS HILL LN, Grades: 6-8)
- ASHLEY EL (Students: 763, Location: 15601 CHRISTOPHER LN, Grades: KG-5)
- ISBELL EL (Students: 740, Location: 6000 MALTBY DR, Grades: KG-5)
Private elementary/middle schools in Frisco:
Library in Frisco:
User-submitted facts and corrections:
- Population of approximately 64,981 people as of April 1, 2004
- Dr Pepper/7 Up Ballpark is now named Dr Pepper Ballpark.
- Currently 4 high schools. High school #3 (Wakeland H.S.) and #4 (Liberty H.S.) opened fall of 2006. High school #5 (Heritage) and #6 (Lone Star) scheduled to open fall of 2009. Folwler Middle School opens 2007 and two more middle schools will open in 2008. Multiple elementary schools open each year.
Points of interest:
Notable locations in Frisco: City of Frisco Water Treatment Facility (A), Cottonwood Creek Wastewater Treatment Plant (B), Pilot Point Waste Water Treatment Plant (C), Stewart Creek West Water Treament Facility (D), Frisco Fire Department Station 1 (E), Frisco Fire Department Station 5 (F), Frisco Fire Department Station 3 (G), Frisco Fire Department Station 4 (H), Frisco Fire Department Station 2 (I), CareFlight - Cotton Gin Road (J). Display/hide their locations on the map
Shopping Center: Stonebriar Centre Shopping Center (1). Display/hide its location on the map
Main business address in Frisco: COMSTOCK RESOURCES INC (A). Display/hide its location on the map
Churches in Frisco include: First Pentecostal Church of Frisco (A), Stonebriar Community Church (B), United Pentecostal Church Apostolic Temple (C), Saint Francis Catholic Church (D), Primera Iglesia Bautista Church (E), Fellowship of Frisco Church (F), Cornerstone Community Assembly of God Church (G), Lebanon Baptist Church (H), Mary Young Chapel (I). Display/hide their locations on the map
Cemeteries: Smith Cemetery (1), Sonntag Cemetery (2), Bethel Cemetery (3), Zion Cemetery (4). Display/hide their locations on the map
Reservoirs: Vial Lake (A), Box Lake (B), Anderson Lake (C), Caldwell Lake (D), T P and L Lake (E), Phillips Lake (F), Phillips North Lake (G). Display/hide their locations on the map
Streams, rivers, and creeks: Parvin Branch (A). Display/hide its location on the map
Parks in Frisco include: Frisco Independent School District Stadium (1), EDS Superdrome (2). Display/hide their locations on the map
| This city: | 2.9 people |
| Texas: | 2.8 people |
| This city: | 78.3% |
| Whole state: | 69.9% |
| This city: | 4.1% |
| Whole state: | 6.0% |
Likely homosexual households (counted as self-reported same-sex unmarried-partner households)
- Lesbian couples: 0.3% of all households
- Gay men: 0.3% of all households
People in group quarters in Frisco in 2000:
- 77 people in nursing homes
- 31 people in agriculture workers' dormitories on farms
- 7 people in other workers' dormitories
Banks with most branches in Frisco (2011 data):
- JPMorgan Chase Bank, National Association: 7 branches. Info updated 2011/11/10: Bank assets: $1,811,678.0 mil, Deposits: $1,190,738.0 mil, headquarters in Columbus, OH, positive income, International Specialization, 5577 total offices, Holding Company: Jpmorgan Chase & Co.
- Wells Fargo Bank, National Association: Frisco Preston Road Branch, Dallas North Tollway And Eldorado, Grayhawk Branch, Preston & Main Branch, Starwood Branch. Info updated 2011/04/05: Bank assets: $1,161,490.0 mil, Deposits: $905,653.0 mil, headquarters in Sioux Falls, SD, positive income, 6395 total offices, Holding Company: Wells Fargo & Company
- Capital One, National Association: North Custer Branch, Frisco Main Branch, Stonebriar Branch, Little Elm Branch. Info updated 2011/07/01: Bank assets: $133,477.8 mil, Deposits: $97,063.7 mil, headquarters in Mclean, VA, positive income, 984 total offices, Holding Company: Capital One Financial Corporation
- Bank of America, National Association: West Frisco Branch, Preston Lebanon, Northwest Frisco Branch, Parkway Town Center Branch. Info updated 2009/11/18: Bank assets: $1,451,969.3 mil, Deposits: $1,077,176.8 mil, headquarters in Charlotte, NC, positive income, 5782 total offices, Holding Company: Bank Of America Corporation
- Compass Bank: Stonebriar Branch, Frisco Branch, Four Corners Branch. Info updated 2011/02/24: Bank assets: $63,107.0 mil, Deposits: $46,232.4 mil, headquarters in Birmingham, AL, negative income in the last year, Commercial Lending Specialization, 720 total offices, Holding Company: Banco Bilbao Vizcaya Argentaria, S.A.
- Branch Banking and Trust Company: Warren Branch at 3434 Legacy Drive, branch established on 2007/07/25; Wade (Frisco) Branch at 6021 Preston Road, branch established on 2004/05/24. Info updated 2010/03/29: Bank assets: $168,867.6 mil, Deposits: $127,549.5 mil, headquarters in Winston Salem, NC, positive income, Commercial Lending Specialization, 1793 total offices, Holding Company: Bb&T Corporation
- Comerica Bank: Page And Towwlway - Frisco Banking C at 8422 Dallas Parkway, branch established on 2008/12/01; Preston Road Branch at 3333 Preston Road, branch established on 2005/04/20. Info updated 2011/07/29: Bank assets: $60,970.5 mil, Deposits: $48,300.9 mil, headquarters in Dallas, TX, positive income, Commercial Lending Specialization, 497 total offices, Holding Company: Comerica Incorporated
- First National Bank Texas: Frisco Banking Center - Rc 415 Branc at 8555 Preston Road, branch established on 2011/05/18; Eldorado Banking Center - Rc 692 Bra at 12220 Fm 423, branch established on 2007/01/18. Info updated 2006/11/03: Bank assets: $944.3 mil, Deposits: $815.9 mil, headquarters in Killeen, TX, positive income, Mortgage Lending Specialization, 250 total offices, Holding Company: First Community Bancshares, Inc.
- Prosperity Bank: Frisco Branch at 6801 Gaylord Parkway, Suite 101, branch established on 2001/02/26; Frisco West Branch at 2860 Main Street, branch established on 2004/01/15. Info updated 2012/01/05: Bank assets: $9,816.2 mil, Deposits: $8,064.8 mil, headquarters in El Campo, TX, positive income, Mortgage Lending Specialization, 187 total offices, Holding Company: Prosperity Bancshares, Inc.
- 18 other banks with 22 local branches
For population 15 years and over in Frisco:
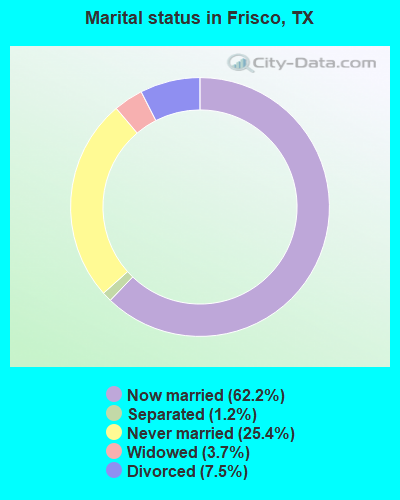
- Never married: 25.4%
- Now married: 62.2%
- Separated: 1.2%
- Widowed: 3.7%
- Divorced: 7.5%
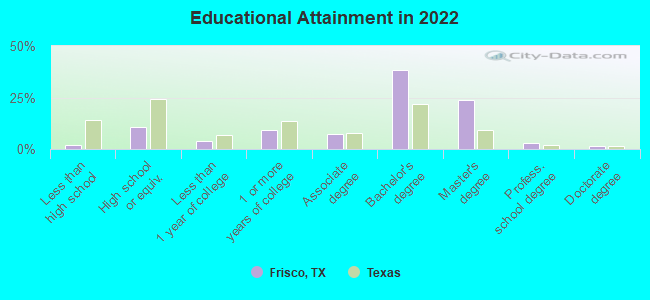
For population 25 years and over in Frisco:
- High school or higher: 98.0%
- Bachelor's degree or higher: 66.7%
- Graduate or professional degree: 28.3%
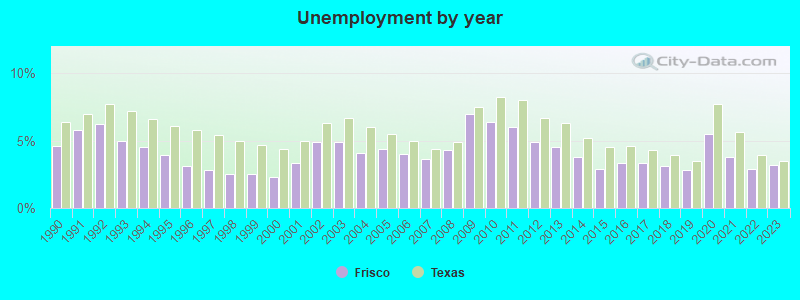
- Unemployed: 2.8%
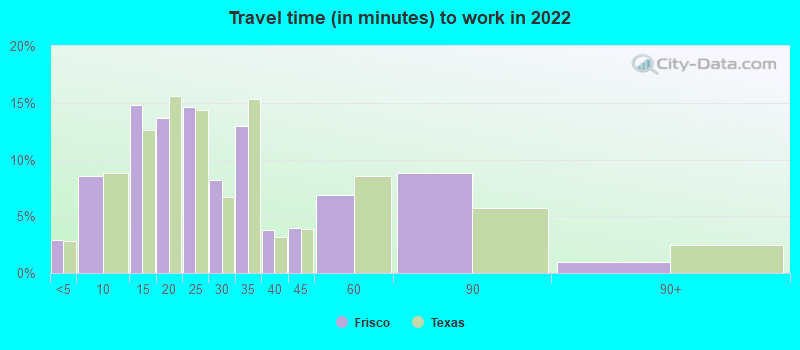
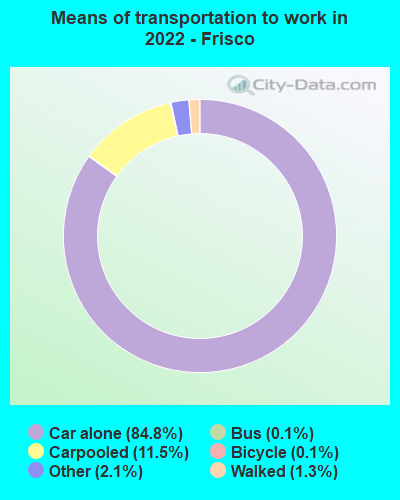
- Mean travel time to work (commute): 16.9 minutes
| Here: | 8.0 |
| Texas average: | 14.0 |
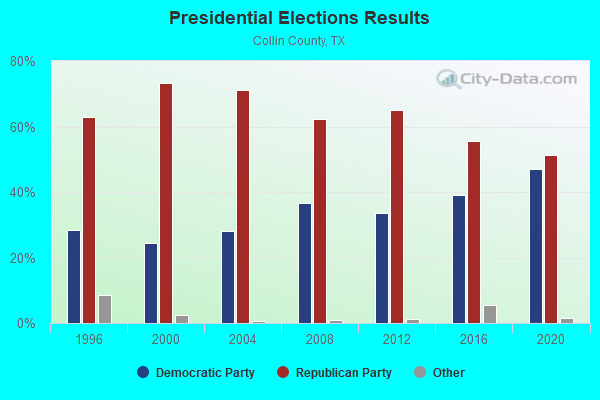
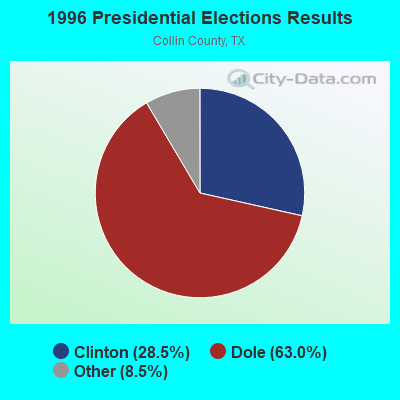
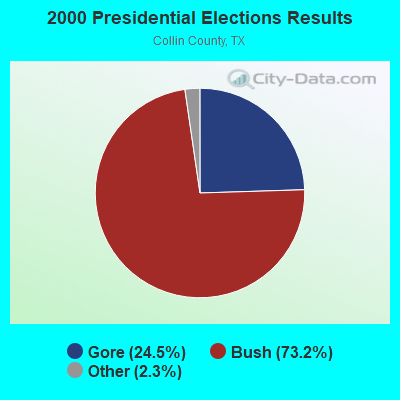
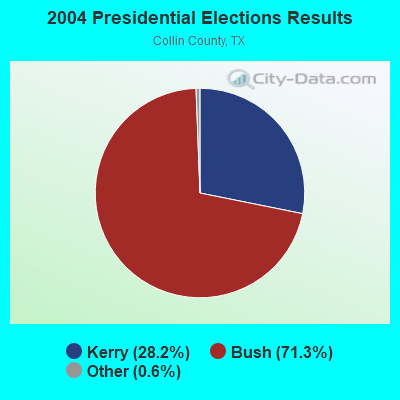
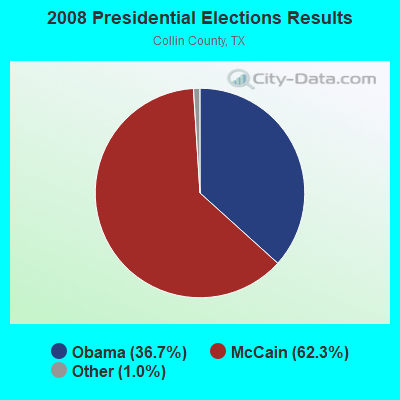
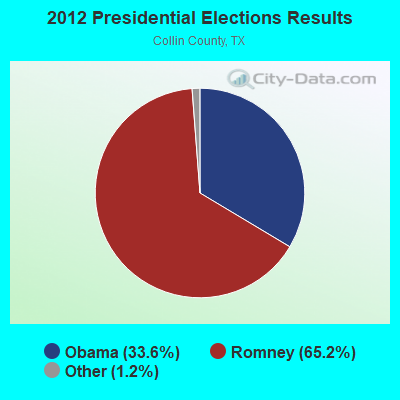
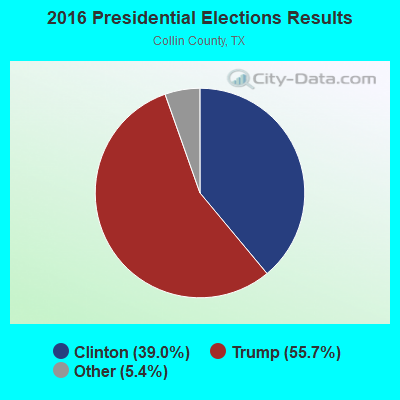
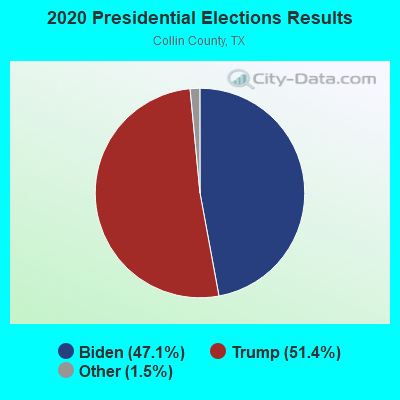
Graphs represent county-level data. Detailed 2008 Election Results
Religion statistics for Frisco, TX (based on Collin County data)
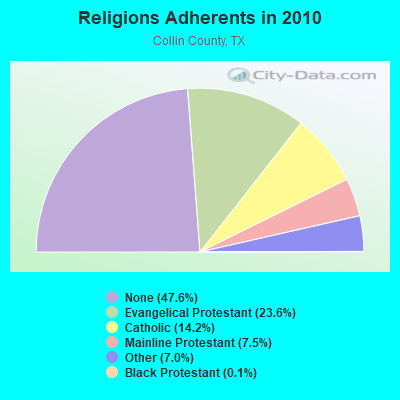
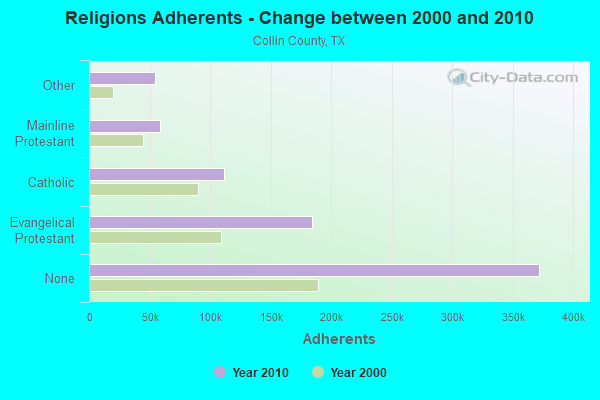
| Religion | Adherents | Congregations |
|---|---|---|
| Evangelical Protestant | 184,331 | 334 |
| Catholic | 111,182 | 8 |
| Mainline Protestant | 59,022 | 60 |
| Other | 54,475 | 74 |
| Black Protestant | 1,014 | 8 |
| Orthodox | 190 | 1 |
| None | 372,127 | - |
Food Environment Statistics:
| This county: | 1.05 / 10,000 pop. |
| State: | 1.47 / 10,000 pop. |
| Collin County: | 0.18 / 10,000 pop. |
| State: | 0.14 / 10,000 pop. |
| Here: | 0.73 / 10,000 pop. |
| Texas: | 1.11 / 10,000 pop. |
| Collin County: | 2.94 / 10,000 pop. |
| Texas: | 3.95 / 10,000 pop. |
| This county: | 6.54 / 10,000 pop. |
| Texas: | 6.13 / 10,000 pop. |
| This county: | 7.3% |
| Texas: | 8.9% |
| Collin County: | 24.0% |
| State: | 26.6% |
| Collin County: | 15.3% |
| Texas: | 15.7% |
Health and Nutrition:
| Frisco: | 52.6% |
| Texas: | 48.6% |
| Frisco: | 53.4% |
| State: | 47.4% |
| This city: | 28.0 |
| Texas: | 28.5 |
| This city: | 19.5% |
| Texas: | 20.6% |
| This city: | 8.0% |
| Texas: | 10.3% |
| Frisco: | 6.8 |
| State: | 6.8 |
| Frisco: | 31.4% |
| Texas: | 33.1% |
| This city: | 62.0% |
| State: | 56.2% |
| This city: | 84.0% |
| State: | 80.7% |
More about Health and Nutrition of Frisco, TX Residents
| Local government employment and payroll (March 2022) | |||||
| Function | Full-time employees | Monthly full-time payroll | Average yearly full-time wage | Part-time employees | Monthly part-time payroll |
|---|---|---|---|---|---|
| Firefighters | 231 | $2,356,399 | $122,410 | 0 | $0 |
| Police Protection - Officers | 195 | $1,683,614 | $103,607 | 0 | $0 |
| Other and Unallocable | 194 | $1,230,208 | $76,095 | 3 | $1,931 |
| Police - Other | 119 | $845,275 | $85,238 | 0 | $0 |
| Parks and Recreation | 100 | $462,042 | $55,445 | 73 | $64,489 |
| Financial Administration | 96 | $712,462 | $89,058 | 0 | $0 |
| Streets and Highways | 68 | $399,997 | $70,588 | 0 | $0 |
| Water Supply | 57 | $275,386 | $57,976 | 3 | $1,590 |
| Other Government Administration | 38 | $330,918 | $104,500 | 7 | $6,345 |
| Local Libraries | 37 | $203,914 | $66,134 | 32 | $50,379 |
| Fire - Other | 32 | $263,380 | $98,768 | 0 | $0 |
| Sewerage | 32 | $158,104 | $59,289 | 0 | $0 |
| Solid Waste Management | 20 | $87,194 | $52,316 | 0 | $0 |
| Judicial and Legal | 19 | $122,640 | $77,457 | 1 | $1,395 |
| Health | 12 | $67,274 | $67,274 | 0 | $0 |
| Natural Resources | 4 | $16,297 | $48,891 | 0 | $0 |
| Housing and Community Development (Local) | 3 | $19,470 | $77,880 | 0 | $0 |
| Totals for Government | 1,257 | $9,234,577 | $88,158 | 119 | $126,129 |
Frisco government finances - Expenditure in 2021 (per resident):
- Construction - Regular Highways: $38,354,000 ($174.66)
Water Utilities: $30,875,000 ($140.60)
Central Staff Services: $18,876,000 ($85.96)
Parks and Recreation: $9,291,000 ($42.31)
Local Fire Protection: $4,474,000 ($20.37)
Libraries: $3,024,000 ($13.77)
General - Other: $2,282,000 ($10.39)
Judicial and Legal Services: $1,836,000 ($8.36)
- Current Operations - Police Protection: $44,151,000 ($201.06)
Local Fire Protection: $42,709,000 ($194.50)
Water Utilities: $40,455,000 ($184.23)
Sewerage: $40,455,000 ($184.23)
Central Staff Services: $20,703,000 ($94.28)
Solid Waste Management: $20,347,000 ($92.66)
Parks and Recreation: $19,464,000 ($88.64)
Regular Highways: $14,355,000 ($65.37)
General - Other: $13,453,000 ($61.27)
Financial Administration: $5,585,000 ($25.43)
Libraries: $4,357,000 ($19.84)
Protective Inspection and Regulation - Other: $3,754,000 ($17.10)
Judicial and Legal Services: $3,264,000 ($14.86)
Health - Other: $2,420,000 ($11.02)
- General - Interest on Debt: $28,467,000 ($129.64)
- Intergovernmental to Local - Other - Elementary and Secondary Education: $22,196,000 ($101.08)
- Other Capital Outlay - Police Protection: $1,611,000 ($7.34)
Libraries: $1,298,000 ($5.91)
General - Other: $1,073,000 ($4.89)
Central Staff Services: $600,000 ($2.73)
Parks and Recreation: $526,000 ($2.40)
Regular Highways: $312,000 ($1.42)
Local Fire Protection: $191,000 ($0.87)
Health - Other: $96,000 ($0.44)
Financial Administration: $96,000 ($0.44)
- Total Salaries and Wages: $100,025,000 ($455.51)
- Water Utilities - Interest on Debt: $2,832,000 ($12.90)
Frisco government finances - Revenue in 2021 (per resident):
- Charges - Sewerage: $43,005,000 ($195.84)
Solid Waste Management: $18,816,000 ($85.69)
Parks and Recreation: $6,508,000 ($29.64)
Other: $4,113,000 ($18.73)
- Local Intergovernmental - Other: $41,064,000 ($187.01)
Highways: $11,027,000 ($50.22)
General Local Government Support: $4,695,000 ($21.38)
- Miscellaneous - Donations From Private Sources: $18,588,000 ($84.65)
Special Assessments: $10,281,000 ($46.82)
Interest Earnings: $8,278,000 ($37.70)
Rents: $7,346,000 ($33.45)
General Revenue - Other: $3,075,000 ($14.00)
Fines and Forfeits: $1,654,000 ($7.53)
- Revenue - Water Utilities: $60,947,000 ($277.55)
- State Intergovernmental - General Local Government Support: $913,000 ($4.16)
- Tax - Property: $142,681,000 ($649.77)
General Sales and Gross Receipts: $45,125,000 ($205.50)
Other License: $11,043,000 ($50.29)
Public Utilities Sales: $10,377,000 ($47.26)
Other Selective Sales: $3,986,000 ($18.15)
Frisco government finances - Debt in 2021 (per resident):
- Long Term Debt - Beginning Outstanding - Unspecified Public Purpose: $890,301,000 ($4054.43)
Outstanding Unspecified Public Purpose: $864,902,000 ($3938.77)
Retired Unspecified Public Purpose: $70,717,000 ($322.05)
Issue, Unspecified Public Purpose: $45,319,000 ($206.38)
Frisco government finances - Cash and Securities in 2021 (per resident):
- Bond Funds - Cash and Securities: $270,761,000 ($1233.05)
- Other Funds - Cash and Securities: $329,213,000 ($1499.24)
- Sinking Funds - Cash and Securities: $5,429,000 ($24.72)
11.92% of this county's 2021 resident taxpayers lived in other counties in 2020 ($95,581 average adjusted gross income)
| Here: | 11.92% |
| Texas average: | 8.12% |
0.01% of residents moved from foreign countries ($68 average AGI)
Collin County: 0.01% Texas average: 0.04%
Top counties from which taxpayers relocated into this county between 2020 and 2021:
| from Dallas County, TX | |
| from Denton County, TX | |
| from Tarrant County, TX |
9.42% of this county's 2020 resident taxpayers moved to other counties in 2021 ($90,634 average adjusted gross income)
| Here: | 9.42% |
| Texas average: | 7.40% |
0.01% of residents moved to foreign countries ($143 average AGI)
Collin County: 0.01% Texas average: 0.03%
Top counties to which taxpayers relocated from this county between 2020 and 2021:
| to Dallas County, TX | |
| to Denton County, TX | |
| to Tarrant County, TX |
| Businesses in Frisco, TX | ||||
| Name | Count | Name | Count | |
|---|---|---|---|---|
| 24 Hour Fitness | 1 | Justice | 2 | |
| 7-Eleven | 9 | KFC | 1 | |
| ALDO | 1 | Kohl's | 1 | |
| AT&T | 6 | Kroger | 5 | |
| Abercrombie & Fitch | 1 | LA Fitness | 1 | |
| Abercrombie Kids | 1 | La-Z-Boy | 1 | |
| Academy Sports + Outdoors | 1 | Lane Bryant | 1 | |
| Aeropostale | 1 | Lane Furniture | 1 | |
| Albertsons | 1 | LensCrafters | 1 | |
| American Eagle Outfitters | 1 | Little Caesars Pizza | 2 | |
| Ann Taylor | 1 | Lowe's | 1 | |
| Apple Store | 1 | Macy's | 1 | |
| Applebee's | 1 | Marshalls | 1 | |
| Arby's | 1 | McDonald's | 3 | |
| Ashley Furniture | 1 | Men's Wearhouse | 1 | |
| AutoZone | 1 | Motherhood Maternity | 2 | |
| Banana Republic | 1 | New Balance | 2 | |
| Barnes & Noble | 1 | Nike | 17 | |
| Baskin-Robbins | 1 | Nordstrom | 1 | |
| Bath & Body Works | 2 | Office Depot | 1 | |
| Bebe | 1 | Old Navy | 1 | |
| Bed Bath & Beyond | 1 | Olive Garden | 1 | |
| Blockbuster | 3 | Outback | 1 | |
| Brookstone | 1 | Outback Steakhouse | 1 | |
| Burger King | 1 | Pac Sun | 1 | |
| Buybuy BABY | 1 | Panda Express | 2 | |
| CVS | 3 | Payless | 2 | |
| Cache | 1 | Penske | 1 | |
| Charlotte Russe | 1 | PetSmart | 1 | |
| Chevrolet | 1 | Pier 1 Imports | 1 | |
| Chick-Fil-A | 2 | Pizza Hut | 1 | |
| Chico's | 1 | Plato's Closet | 1 | |
| Chipotle | 1 | Popeyes | 1 | |
| Cinnabon | 1 | Pottery Barn | 1 | |
| Clarks | 1 | Pottery Barn Kids | 1 | |
| Coldwater Creek | 1 | Quiznos | 2 | |
| DHL | 3 | RadioShack | 3 | |
| Dairy Queen | 1 | Red Lobster | 1 | |
| Domino's Pizza | 1 | Rooms To Go | 2 | |
| Dunkin Donuts | 1 | Rue21 | 1 | |
| Eddie Bauer | 1 | SONIC Drive-In | 5 | |
| Ethan Allen | 1 | Safeway | 1 | |
| Express | 1 | Sears | 2 | |
| Famous Footwear | 1 | Sephora | 2 | |
| FedEx | 7 | Sheraton | 1 | |
| Finish Line | 1 | Soma Intimates | 1 | |
| Firestone Complete Auto Care | 2 | Spencer Gifts | 1 | |
| Ford | 1 | Sprint Nextel | 2 | |
| Forever 21 | 1 | Staples | 1 | |
| GNC | 2 | Starbucks | 10 | |
| GameStop | 3 | Steak 'n Shake | 1 | |
| Gap | 1 | T-Mobile | 6 | |
| Gymboree | 1 | T.J.Maxx | 1 | |
| H&R Block | 2 | Taco Bell | 1 | |
| Havertys Furniture | 1 | Target | 2 | |
| Hilton | 3 | The Cheesecake Factory | 1 | |
| Hobby Lobby | 1 | Torrid | 1 | |
| Holiday Inn | 2 | Toys"R"Us | 1 | |
| Hollister Co. | 1 | U-Haul | 2 | |
| Home Depot | 1 | UPS | 10 | |
| Honda | 1 | Vans | 4 | |
| Hot Topic | 1 | Verizon Wireless | 2 | |
| IHOP | 2 | Victoria's Secret | 1 | |
| IKEA | 1 | Vons | 1 | |
| J.Crew | 1 | Walgreens | 3 | |
| JCPenney | 1 | Walmart | 1 | |
| Jack In The Box | 1 | Wendy's | 4 | |
| Jimmy John's | 1 | Westin | 1 | |
| JoS. A. Bank | 1 | Wingate | 1 | |
| Jones New York | 3 | YMCA | 1 | |
| Journeys | 1 | |||
Strongest AM radio stations in Frisco:
- KRLD (1080 AM; 50 kW; DALLAS, TX; Owner: TEXAS INFINITY BROADCASTING L.P.)
- KBIS (1150 AM; 25 kW; HIGHLAND PARK, TX; Owner: DALLAS AM RADIO PARTNERS, L.P.)
- KFXR (1190 AM; 50 kW; DALLAS, TX; Owner: CLEAR CHANNEL BROADCASTING LICENSES, INC.)
- KZMP (1540 AM; 50 kW; UNIVERSITY PARK, TX; Owner: ENTRAVISION HOLDINGS, LLC)
- KAAM (770 AM; 10 kW; GARLAND, TX; Owner: DONTRON, INC.)
- KSKY (660 AM; 20 kW; BALCH SPRINGS, TX; Owner: BISON MEDIA, INC.)
- WBAP (820 AM; 50 kW; FORT WORTH, TX; Owner: WBAP-KSCS OPERATING, LTD.)
- KESS (1270 AM; 50 kW; FORT WORTH, TX; Owner: KESS-AM LICENSE CORP.)
- KTNO (1440 AM; 12 kW; DENTON, TX; Owner: MORTENSON BROADCASTING COMPANY)
- KTCK (1310 AM; 9 kW; DALLAS, TX; Owner: KRBE LICO, INC.)
- KLIF (570 AM; 5 kW; DALLAS, TX; Owner: KLIF LICO, INC.)
- KMKI (620 AM; 5 kW; PLANO, TX; Owner: ABC, INC)
- KXEB (910 AM; 1 kW; SHERMAN, TX; Owner: AMIGO RADIO, LTD.)
Strongest FM radio stations in Frisco:
- KPLX (99.5 FM; FORT WORTH, TX; Owner: KPLX LICO, INC.)
- WRR (101.1 FM; DALLAS, TX; Owner: CITY OF DALLAS, TEXAS)
- KLUV-FM (98.7 FM; DALLAS, TX; Owner: INFINITY BROADCASTING CORPORATION OF DALLAS)
- KESN (103.3 FM; ALLEN, TX; Owner: WBAP-KSCS OPERATING, LTD.)
- KSOC (94.5 FM; GAINESVILLE, TX; Owner: RADIO ONE LICENSES, LLC)
- KTPW (89.7 FM; SANGER, TX; Owner: RESEARCH EDUCATIONAL FOUNDATION, INC)
- KTCY (104.9 FM; PILOT POINT, TX; Owner: ENTRAVISION HOLDINGS, LLC)
- KNOR (93.7 FM; HEALDTON, OK; Owner: AM & PM BROADCASTERS, LLC)
- KHYI (95.3 FM; HOWE, TX; Owner: METRO BROADCASTERS - TEXAS, INC.)
- KLLI (105.3 FM; DALLAS, TX; Owner: INFINITY BROADCASTING CORPORATION OF DALLAS)
- KMEO (96.7 FM; FLOWER MOUND, TX; Owner: ABC, INC.)
- KKDL (106.7 FM; MUENSTER, TX; Owner: ENTRAVISION HOLDINGS, LLC)
- KZMP-FM (101.7 FM; AZLE, TX; Owner: ENTRAVISION HOLDINGS, LLC)
- KZPS (92.5 FM; DALLAS, TX; Owner: AMFM TEXAS LICENSES LIMITED PARTNERSHIP)
- KHKS (106.1 FM; DENTON, TX; Owner: AMFM TEXAS LICENSES LIMITED PARTNERSHIP)
- KVIL-FM (103.7 FM; HIGHLAND PARK-DALLAS, TX; Owner: INFINITY BROADCASTING CORPORATION OF TEXAS)
- KOAI (107.5 FM; FORT WORTH, TX; Owner: INFINITY KOAI-FM, INC.)
- KKDA-FM (104.5 FM; DALLAS, TX; Owner: SERVICE BROADCASTING I, LTD.)
- KRBV (100.3 FM; DALLAS, TX; Owner: INFINITY BROADCASTING CORP. OF FORT WORTH)
- KEGL (97.1 FM; FORT WORTH, TX; Owner: CITICASTERS LICENSES, L.P.)
TV broadcast stations around Frisco:
- KLDT (Channel 55; LAKE DALLAS, TX; Owner: JOHNSON BROADCASTING OF DALLAS, INC.)
- KLEG-LP (Channel 44; DALLAS, TX; Owner: DILIP VISWANATH)
- KTVT (Channel 11; FORT WORTH, TX; Owner: CBS STATIONS GROUP OF TEXAS L.P.)
- KXAS-TV (Channel 5; FORT WORTH, TX; Owner: STATION VENTURE OPERATIONS, LP)
- KDTN (Channel 2; DENTON, TX; Owner: NORTH TEXAS PUBLIC BROADCASTING, INC.)
- KMPX (Channel 29; DECATUR, TX; Owner: WORD OF GOD FELLOWSHIP, INC.)
- KSTR-TV (Channel 49; IRVING, TX; Owner: TELEFUTURA DALLAS LLC)
- KTXA (Channel 21; FORT WORTH, TX; Owner: VIACOM TELEVISION STATIONS GROUP OF DALLAS/FORT WORTH L.P.)
- KUVN (Channel 23; GARLAND, TX; Owner: KUVN LICENSE PARTNERSHIP, L.P.)
- KPXD (Channel 68; ARLINGTON, TX; Owner: PAXSON DALLAS LICENSE, INC.)
- WFAA-TV (Channel 8; DALLAS, TX; Owner: WFAA-TV, L.P.)
- KERA-TV (Channel 13; DALLAS, TX; Owner: NORTH TEXAS PUBLIC BROADCASTING, INC.)
- KJJM-LP (Channel 46; DALLAS/MESQUITE, TX; Owner: JANE McGINNIS)
- KTAQ (Channel 47; GREENVILLE, TX; Owner: MIKE SIMONS)
- KXTX-TV (Channel 39; DALLAS, TX; Owner: TELEMUNDO OF TEXAS PARTNERSHIP, LP)
- KDTX-TV (Channel 58; DALLAS, TX; Owner: TRINITY BROADCASTING OF TEXAS, INC.)
- KDFW (Channel 4; DALLAS, TX; Owner: KDFW LICENSE, INC.)
- KDAF (Channel 33; DALLAS, TX; Owner: TRIBUNE TELEVISION COMPANY)
- KDFI (Channel 27; DALLAS, TX; Owner: NEW DMIC, INC.)
- K26HF (Channel 26; BRITTON, TX; Owner: MAKO COMMUNICATIONS, LLC)
- KHPK-LP (Channel 28; DE SOTO, TX; Owner: MAKO COMMUNICATIONS, LLC)
- KFWD (Channel 52; FORT WORTH, TX; Owner: HIC BROADCAST, INC.)
- K25FW (Channel 25; CORSICANA, TX; Owner: VENTANA TELEVISION, INC.)
- KATA-LP (Channel 60; MESQUITE, TX; Owner: JANE McGINNIS)
- National Bridge Inventory (NBI) Statistics
- 229Number of bridges
- 4,665ft / 1,422mTotal length
- $165,000Total costs
- 3,696,176Total average daily traffic
- 122,007Total average daily truck traffic
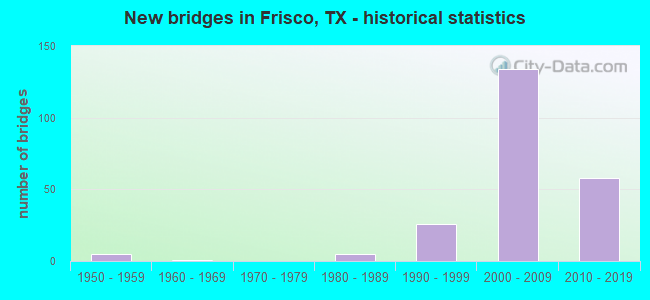
- New bridges - historical statistics
- 51950-1959
- 11960-1969
- 51980-1989
- 261990-1999
- 1342000-2009
- 582010-2019
FCC Registered Private Land Mobile Towers: 9 (See the full list of FCC Registered Private Land Mobile Towers in Frisco, TX)
FCC Registered Broadcast Land Mobile Towers: 85 (See the full list of FCC Registered Broadcast Land Mobile Towers)
FCC Registered Microwave Towers: 86 (See the full list of FCC Registered Microwave Towers in this town)
FCC Registered Paging Towers: 3 (See the full list of FCC Registered Paging Towers)
FCC Registered Maritime Coast & Aviation Ground Towers: 3 (See the full list of FCC Registered Maritime Coast & Aviation Ground Towers)
FCC Registered Amateur Radio Licenses: 631 (See the full list of FCC Registered Amateur Radio Licenses in Frisco)
FAA Registered Aircraft Manufacturers and Dealers: 10 (See the full list of FAA Registered Manufacturers and Dealers in Frisco)
FAA Registered Aircraft: 131 (See the full list of FAA Registered Aircraft)
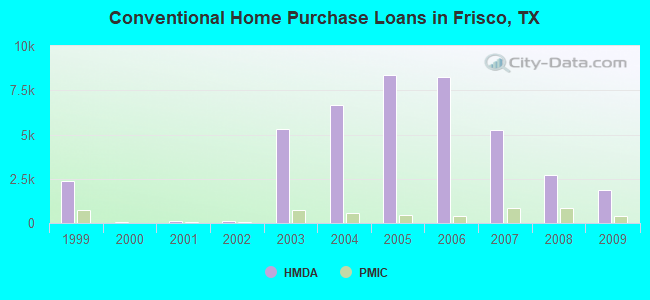
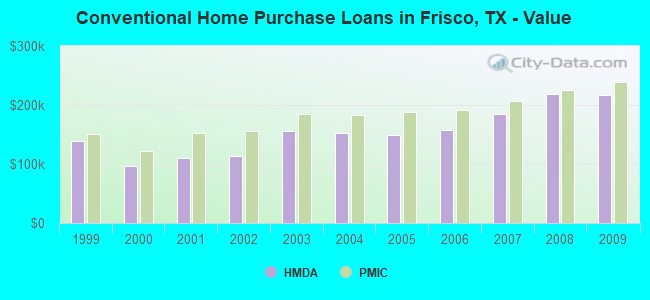
| Home Mortgage Disclosure Act Aggregated Statistics For Year 2009 (Based on 4 full and 6 partial tracts) | ||||||||||||
| A) FHA, FSA/RHS & VA Home Purchase Loans | B) Conventional Home Purchase Loans | C) Refinancings | D) Home Improvement Loans | F) Non-occupant Loans on < 5 Family Dwellings (A B C & D) | G) Loans On Manufactured Home Dwelling (A B C & D) | |||||||
|---|---|---|---|---|---|---|---|---|---|---|---|---|
| Number | Average Value | Number | Average Value | Number | Average Value | Number | Average Value | Number | Average Value | Number | Average Value | |
| LOANS ORIGINATED | 1,354 | $183,560 | 1,883 | $217,304 | 4,439 | $207,863 | 147 | $74,958 | 205 | $164,129 | 2 | $84,205 |
| APPLICATIONS APPROVED, NOT ACCEPTED | 41 | $184,342 | 115 | $192,747 | 376 | $196,890 | 28 | $41,944 | 16 | $146,266 | 1 | $34,040 |
| APPLICATIONS DENIED | 155 | $185,936 | 232 | $220,295 | 1,060 | $220,564 | 152 | $46,572 | 81 | $152,392 | 3 | $95,370 |
| APPLICATIONS WITHDRAWN | 153 | $184,848 | 246 | $223,267 | 827 | $209,122 | 36 | $82,948 | 43 | $153,232 | 0 | $0 |
| FILES CLOSED FOR INCOMPLETENESS | 21 | $183,960 | 40 | $225,819 | 171 | $226,406 | 9 | $74,256 | 14 | $144,215 | 0 | $0 |
Detailed mortgage data for all 10 tracts in Frisco, TX
| Private Mortgage Insurance Companies Aggregated Statistics For Year 2009 (Based on 4 full and 6 partial tracts) | ||||||
| A) Conventional Home Purchase Loans | B) Refinancings | C) Non-occupant Loans on < 5 Family Dwellings (A & B) | ||||
|---|---|---|---|---|---|---|
| Number | Average Value | Number | Average Value | Number | Average Value | |
| LOANS ORIGINATED | 407 | $239,018 | 212 | $223,015 | 2 | $160,620 |
| APPLICATIONS APPROVED, NOT ACCEPTED | 80 | $245,333 | 77 | $228,763 | 3 | $196,697 |
| APPLICATIONS DENIED | 43 | $241,882 | 37 | $214,889 | 7 | $95,391 |
| APPLICATIONS WITHDRAWN | 20 | $277,987 | 25 | $236,991 | 0 | $0 |
| FILES CLOSED FOR INCOMPLETENESS | 6 | $220,962 | 4 | $168,462 | 1 | $41,000 |
2004 - 2018 National Fire Incident Reporting System (NFIRS) incidents
- Fire incident types reported to NFIRS in Frisco, TX
- 1,53851.3%Outside Fires
- 73624.6%Structure Fires
- 45515.2%Mobile Property/Vehicle Fires
- 2688.9%Other
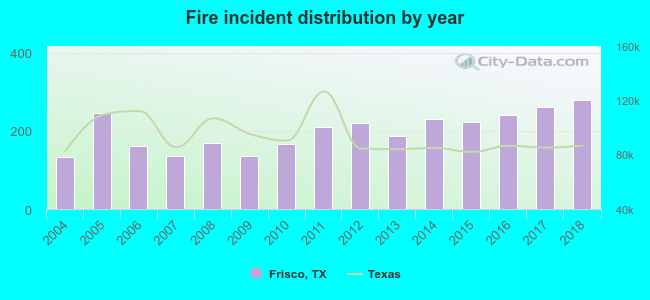 According to the data from the years 2004 - 2018 the average number of fires per year is 200. The highest number of reported fire incidents - 278 took place in 2018, and the least - 132 in 2004. The data has a rising trend.
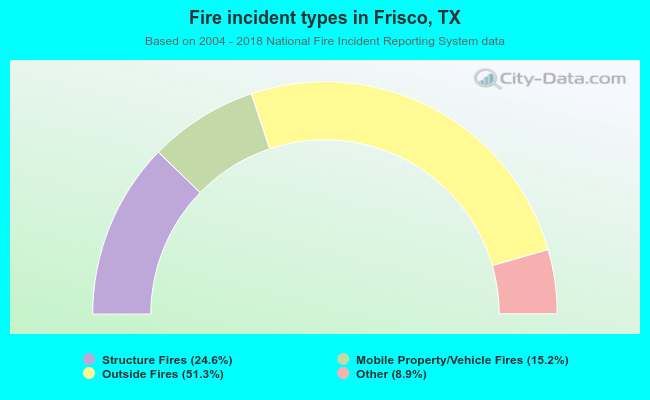 When looking into fire subcategories, the most incidents belonged to: Outside Fires (51.3%), and Structure Fires (24.6%).
Fire-safe hotels and motels in Frisco, Texas:
- Hampton Inn & Suites Frisco, 3199 Parkwood Blvd, Frisco, Texas 75034 , Phone: (972) 712-8400, Fax: (972) 712-7600
- Embassy Suites Hotel Dallas Frisco, 7600 John Q Hammons Dr, Frisco, Texas 75034 , Phone: (972) 712-7200, Fax: (972) 712-7221
- Holiday Inn Express, 3400 Parkwood Blvd, Frisco, Texas 75034 , Phone: (972) 668-5959, Fax: (972) 668-4621
- Homewood Suites - Dallas/Frisco, 3240 Parkwood Blvd, Frisco, Texas 75034 , Phone: (214) 618-0111, Fax: (214) 618-0110
- Sheraton Stonebriar Hotel, 5444 State Hwy 121, Frisco, Texas 75034 , Phone: (972) 668-8700, Fax: (972) 668-8799
- Westin Stonebriar Resort, 1549 Legacy Dr, Frisco, Texas 75034 , Phone: (972) 668-8000, Fax: (972) 668-8100
- Comfort Suites Frisco, 9700 Dallas Pkwy, Frisco, Texas 75034 , Phone: (972) 668-9700, Fax: (972) 668-9701
- Hilton Garden Inn Frisco Texas, 7550 Gaylord Pkwy, Frisco, Texas 75034 , Phone: (469) 362-8485, Fax: (469) 362-8487
- 9 other hotels and motels
| Most common first names in Frisco, TX among deceased individuals | ||
| Name | Count | Lived (average) |
|---|---|---|
| John | 64 | 76.8 years |
| Mary | 50 | 78.4 years |
| James | 50 | 70.1 years |
| Robert | 49 | 70.3 years |
| William | 37 | 74.2 years |
| George | 29 | 73.1 years |
| Dorothy | 23 | 79.6 years |
| Betty | 20 | 73.8 years |
| Charles | 18 | 70.9 years |
| Thomas | 17 | 74.0 years |
| Most common last names in Frisco, TX among deceased individuals | ||
| Last name | Count | Lived (average) |
|---|---|---|
| Smith | 35 | 76.6 years |
| Davis | 25 | 77.6 years |
| Jones | 22 | 71.9 years |
| Johnson | 20 | 76.3 years |
| Thompson | 15 | 75.7 years |
| Wilson | 14 | 76.8 years |
| Williams | 13 | 79.1 years |
| Bailey | 11 | 82.1 years |
| Carter | 11 | 79.2 years |
| White | 11 | 80.7 years |
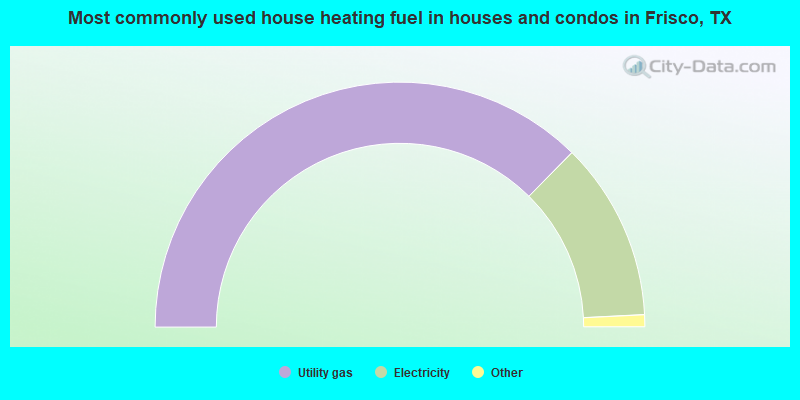
- 74.8%Utility gas
- 23.6%Electricity
- 1.2%Bottled, tank, or LP gas
- 0.2%No fuel used
- 0.2%Solar energy
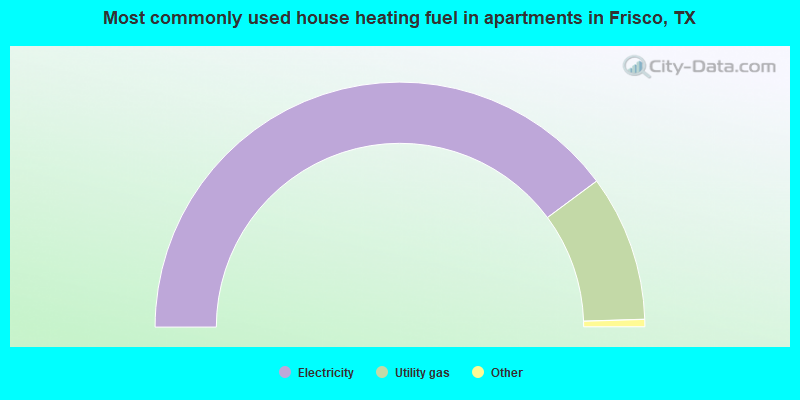
- 79.7%Electricity
- 19.3%Utility gas
- 0.5%Bottled, tank, or LP gas
- 0.3%No fuel used
- 0.2%Solar energy
Frisco compared to Texas state average:
- Median household income above state average.
- Median house value significantly above state average.
- Unemployed percentage significantly below state average.
- Black race population percentage significantly above state average.
- Hispanic race population percentage above state average.
- Foreign-born population percentage significantly above state average.
- Renting percentage below state average.
- Length of stay since moving in significantly below state average.
- Number of rooms per house above state average.
- House age significantly below state average.
- Number of college students significantly above state average.
- Percentage of population with a bachelor's degree or higher significantly above state average.
Frisco, TX compared to other similar cities:
Frisco on our top lists:
- #2 on the list of "Top 101 cities with the smallest percentages of current college students (population 100,000+)"
- #2 on the list of "Top 101 cities with the largest percentage population increase from 2000 (population 50,000+)"
- #3 on the list of "Top 101 cities with largest percentage population increases in the 1990s) (population 50,000+)"
- #3 on the list of "Top 101 cities with most building permits per 10,000 residents (population 50,000+)"
- #5 on the list of "Top 100 fastest growing cities from 2000 to 2014 (pop. 50,000+)"
- #9 on the list of "Top 100 cities with newest houses (pop. 50,000+)"
- #12 on the list of "Top 101 cities with largest percentage of males in occupations: management occupations (population 50,000+)"
- #14 on the list of "Top 100 cities with biggest houses (pop. 50,000+)"
- #14 on the list of "Top 100 cities with highest median household income (pop. 50,000+)"
- #28 on the list of "Top 101 cities with largest percentage of males in industries: finance and insurance (population 50,000+)"
- #28 on the list of "Top 101 cities with largest percentage of females in occupations: management occupations (population 50,000+)"
- #29 on the list of "Top 101 cities with the least people below the poverty level (population 50,000+)"
- #37 on the list of "Top 101 cities with the highest percentage of family households, population 100,000+"
- #37 on the list of "Top 101 cities with the most people below the poverty level, excluding cities with 15% or more of residents in college and with the median age below 28 (population 50,000+)"
- #42 on the list of "Top 100 cities with highest median household income and median resident age less than 35"
- #44 on the list of "Top 101 cities with largest percentage of males in occupations: sales and related occupations (population 50,000+)"
- #44 on the list of "Top 101 cities that people commute from (largest negative percentage daily daytime population change due to commuting) (population 50,000+)"
- #49 on the list of "Top 101 cities with largest percentage of females in occupations: computer and mathematical occupations (population 50,000+)"
- #49 on the list of "Top 101 cities with largest percentage of males in occupations: computer and mathematical occupations (population 50,000+)"
- #50 on the list of "Top 101 cities with the highest ratio of rapes to murders between 2002 and 2012 (population 50,000+)"
- #57 (75024) on the list of "Top 101 zip codes with the most big companies in 2005 (at least 1000 employees)"
- #6 on the list of "Top 101 counties with the lowest number of deaths per 1000 residents 2007-2013 (pop. 50,000+)"
- #10 on the list of "Top 101 counties with the largest number of children under 18 without health insurance coverage in 2000 (pop. 50,000+)"
- #21 on the list of "Top 101 counties with the highest surface withdrawal of fresh water for public supply"
- #28 on the list of "Top 101 counties with the largest decrease in the number of births per 1000 residents 2000-2006 to 2007-2013 (pop 50,000+)"
- #28 on the list of "Top 101 counties with the largest increase in the number of deaths per 1000 residents 2000-2006 to 2007-2013 (pop. 50,000+)"
State forum archive:
- Texas Pages: 2 3 4 5 6 7 8 9 10 11 12 13 14 15 16 17 18 19 20 21 22 23 24 25 26 27 28 29 30 31 32 33 34 35 36 37 38 39 40 41 42 43 44 45 46 47 48 49 50 51 52 53 54 55 56 57 58 59 60 61 62 63 64
- Austin Pages: 2 3 4 5 6 7 8 9 10 11 12 13 14 15 16 17 18 19 20 21 22 23 24 25 26 27 28 29 30 31 32 33 34 35 36 37 38 39 40 41 42 43 44 45 46 47 48 49 50 51 52 53 54 55 56 57 58 59 60 61 62 63 64 65 66 67 68 69 70 71 72 73 74 75 76 77 78 79 80 81 82 83 84 85 86 87 88 89 90 91 92 93 94 95 96 97 98 99 100 101 102 103 104 105 106 107 108 109 110 111 112 113 114 115 116 117 118 119 120 121 122 123 124 125 126 127 128 129
- Corpus Christi Pages: 2 3 4 5 6
- Dallas Pages: 2 3 4 5 6 7 8 9 10 11 12 13 14 15 16 17 18 19 20 21 22 23 24 25 26 27 28 29 30 31 32 33 34 35 36 37 38 39 40 41 42 43 44 45 46 47 48 49 50 51 52 53 54 55 56 57 58 59 60 61 62 63 64 65 66 67 68 69 70 71 72 73 74 75 76 77 78 79 80 81 82 83 84 85 86 87 88 89 90 91 92 93 94 95 96 97 98 99 100 101 102 103 104 105 106 107 108 109 110 111 112 113 114 115 116 117 118 119 120 121 122 123 124 125 126 127 128 129 130 131 132 133 134 135 136 137 138 139 140 141 142 143 144 145 146 147 148 149 150 151 152 153 154 155 156
- El Paso Pages: 2 3 4 5 6 7 8 9 10 11 12 13 14 15 16 17
- Fort Worth Pages: 2 3 4 5 6 7 8 9 10 11 12 13 14 15 16 17 18 19 20 21 22 23 24 25 26 27 28
- Houston Pages: 2 3 4 5 6 7 8 9 10 11 12 13 14 15 16 17 18 19 20 21 22 23 24 25 26 27 28 29 30 31 32 33 34 35 36 37 38 39 40 41 42 43 44 45 46 47 48 49 50 51 52 53 54 55 56 57 58 59 60 61 62 63 64 65 66 67 68 69 70 71 72 73 74 75 76 77 78 79 80 81 82 83 84 85 86 87 88 89 90 91 92 93 94 95 96 97 98 99 100 101 102 103 104 105 106 107 108 109 110 111 112 113 114 115 116 117 118 119 120 121 122 123 124 125 126 127 128 129 130 131 132 133 134 135 136 137 138 139 140 141 142 143 144 145 146 147 148 149 150 151 152 153 154 155 156 157 158 159 160 161 162 163 164 165 166 167 168 169 170 171 172 173 174 175 176 177
- Lubbock Pages: 2 3
- San Antonio Pages: 2 3 4 5 6 7 8 9 10 11 12 13 14 15 16 17 18 19 20 21 22 23 24 25 26 27 28 29 30 31 32 33 34 35 36 37 38 39 40 41 42 43 44 45 46 47 48 49 50 51 52 53 54 55 56 57 58 59 60 61 62 63 64 65 66 67 68 69 70 71 72 73 74 75 76 77 78 79 80 81 82 83 84 85 86 87 88 89 90 91 92 93 94 95 96 97 98 99 100 101 102 103 104 105 106 107 108 109 110 111 112 113 114
- Tyler Pages: 2 3 4

|
|
Total of 2141 patent applications in 2008-2024.