Little Elm, Texas
Little Elm: A Great Place to Live and Play at the Northeast Shores of Lake Lewisville
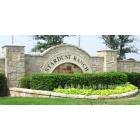
Little Elm: Paloma Creek

Little Elm: Fishing at the dam in Little Elm, Sunset, Lewisville Lake Toll Bridge

Little Elm: Gorgeous Little Elm sunset

Little Elm: Little Elm sunsets are awesome!

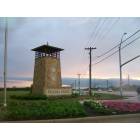
Little Elm: Little a day in Little Elm on Lake Lewisville
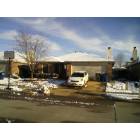
Little Elm: Little Elm Snow Day 03-06-08
- add
your
Submit your own pictures of this town and show them to the world
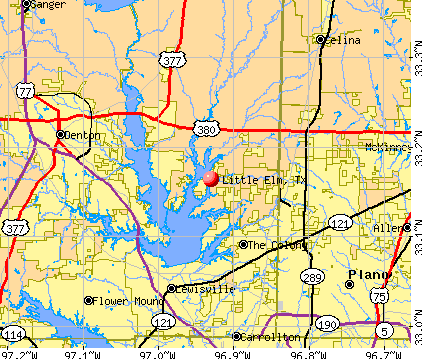
- OSM Map
- General Map
- Google Map
- MSN Map
Population change since 2000: +1418.3%
| Males: 28,370 | |
| Females: 26,987 |
| Median resident age: | 36.4 years |
| Texas median age: | 35.6 years |
Zip codes: 75068.
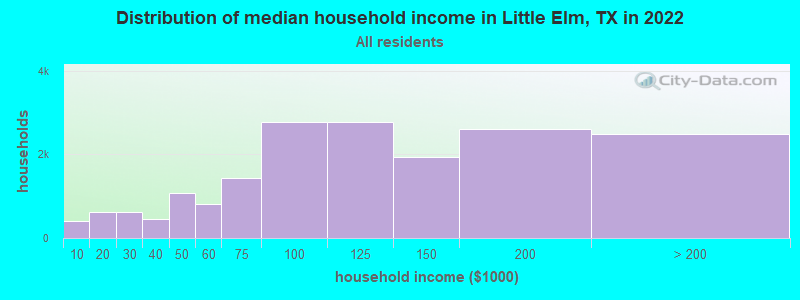
| Little Elm: | $108,364 |
| TX: | $72,284 |
Estimated per capita income in 2022: $44,822 (it was $18,362 in 2000)
Little Elm town income, earnings, and wages data
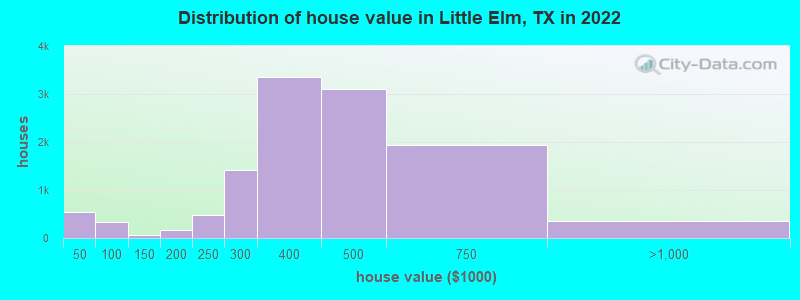
Estimated median house or condo value in 2022: $409,764 (it was $95,800 in 2000)
| Little Elm: | $409,764 |
| TX: | $275,400 |
Mean prices in 2022: all housing units: $397,863; detached houses: $416,522; townhouses or other attached units: $477,224; mobile homes: $60,800
Median gross rent in 2022: $2,031.
(7.8% for White Non-Hispanic residents, 15.8% for Black residents, 9.8% for Hispanic or Latino residents, 65.0% for American Indian residents, 1.5% for two or more races residents)
Detailed information about poverty and poor residents in Little Elm, TX


Compare current foreclosures in Little Elm, TX:
| Photo | Address | Area | Beds / Baths | Price | Details |
|---|---|---|---|---|---|

|
#1
Sun Creek Dr
Little Elm, TX 75068
|
2,717 sq. feet
|
2 baths 3 beds |
show details | |

|
#2
Joe Pool Dr
Little Elm, TX 75068
|
1,456 sq. feet
|
2 baths 3 beds |
show details | |

|
#3
Lamp Post Dr
Little Elm, TX 75068
|
1,480 sq. feet
|
2 baths 3 beds |
show details | |

|
#4
Zebra Finch Dr
Little Elm, TX 75068
|
- sq. feet
|
3 baths 5 beds |
show details | |

|
#5
Lone Spring Dr
Little Elm, TX 75068
|
2,600 sq. feet
|
2 baths 4 beds |
show details | |

|
#6
Bigleaf Dr
Little Elm, TX 75068
|
2,033 sq. feet
|
2 baths 3 beds |
show details | |

|
#7
Willowlake Dr
Little Elm, TX 75068
|
2,339 sq. feet
|
2 baths 4 beds |
show details | |

|
#8
Eagle Mountain Dr
Little Elm, TX 75068
|
1,761 sq. feet
|
3 baths 4 beds |
show details | |

|
#9
Deerwood Dr
Little Elm, TX 75068
|
2,204 sq. feet
|
2 baths 4 beds |
show details | |

|
#10
Apple Dr
Little Elm, TX 75068
|
3,063 sq. feet
|
2 baths 5 beds |
show details |
| Photo | Address | Area | Beds / Baths | Price | Details |
|---|---|---|---|---|---|

|
#11
Sunbeam Dr
Little Elm, TX 75068
|
2,930 sq. feet
|
2 baths 3 beds |
show details | |

|
#12
Spillway Dr
Little Elm, TX 75068
|
1,880 sq. feet
|
2 baths 4 beds |
show details | |

|
#13
Wheatear Dr
Little Elm, TX 75068
|
2,980 sq. feet
|
2 baths 4 beds |
show details | |

|
#14
Salt Maker Way
Little Elm, TX 75068
|
1,647 sq. feet
|
2 baths 3 beds |
show details | |

|
#15
Quail Creek Dr
Little Elm, TX 75068
|
2,654 sq. feet
|
2 baths 4 beds |
show details | |

|
#16
Port Boliver Dr
Little Elm, TX 75068
|
1,560 sq. feet
|
2 baths 3 beds |
show details | |

|
#17
Kittyhawk Dr
Little Elm, TX 75068
|
1,988 sq. feet
|
2 baths 3 beds |
show details | |

|
#18
Preston On The Lake Blvd
Little Elm, TX 75068
|
1,840 sq. feet
|
2 baths 3 beds |
show details | |

|
#19
Morning Star Dr
Little Elm, TX 75068
|
2,846 sq. feet
|
2 baths 4 beds |
show details | |

|
#20
Turtledove Dr
Little Elm, TX 75068
|
1,793 sq. feet
|
2 baths 3 beds |
show details |
| Photo | Address | Area | Beds / Baths | Price | Details |
|---|---|---|---|---|---|

|
#21
Rockport Ln
Little Elm, TX 75068
|
1,868 sq. feet
|
2 baths 3 beds |
show details | |

|
#22
Morning Song Dr
Little Elm, TX 75068
|
1,615 sq. feet
|
2 baths 3 beds |
show details | |

|
#23
Hillside Dr
Little Elm, TX 75068
|
1,700 sq. feet
|
2 baths 3 beds |
show details | |

|
#24
Parakeet Dr
Little Elm, TX 75068
|
1,840 sq. feet
|
2 baths 3 beds |
show details | |

|
#25
Whispering Trl
Little Elm, TX 75068
|
3,508 sq. feet
|
3 baths 5 beds |
show details | |

|
#26
Sage Meadow Trl
Little Elm, TX 75068
|
3,368 sq. feet
|
3 baths 4 beds |
show details | |

|
#27
Basswood Dr
Little Elm, TX 75068
|
1,563 sq. feet
|
2 baths 3 beds |
show details | |

|
#28
Cowboy Trl
Little Elm, TX 75068
|
3,032 sq. feet
|
2 baths 4 beds |
show details | |

|
#29
Sumac Dr
Little Elm, TX 75068
|
2,292 sq. feet
|
2 baths 4 beds |
show details | |

|
#30
Replay Ln
Little Elm, TX 75068
|
2,000 sq. feet
|
2 baths 4 beds |
show details |
| Photo | Address | Area | Beds / Baths | Price | Details |
|---|---|---|---|---|---|

|
#31
Lake Grove Dr
Little Elm, TX 75068
|
3,281 sq. feet
|
2 baths 3 beds |
show details | |

|
#32
Concho Dr
Little Elm, TX 75068
|
1,262 sq. feet
|
1 baths 3 beds |
show details | |

|
#33
Elm Valley Dr
Little Elm, TX 75068
|
2,493 sq. feet
|
2 baths 3 beds |
show details | |

|
#34
Grand Fir Dr
Little Elm, TX 75068
|
2,048 sq. feet
|
2 baths 4 beds |
show details | |

|
#35
Marble Canyon Dr
Little Elm, TX 75068
|
2,010 sq. feet
|
2 baths 3 beds |
show details | |

|
#36
Kittyhawk Dr
Little Elm, TX 75068
|
2,992 sq. feet
|
2 baths 4 beds |
show details | |

|
#37
Silverwood Ln
Little Elm, TX 75068
|
3,440 sq. feet
|
3 baths 4 beds |
show details | |

|
#38
Tisbury Way
Little Elm, TX 75068
|
2,698 sq. feet
|
3 baths 4 beds |
show details | |

|
#39
Timberhollow Dr
Little Elm, TX 75068
|
2,464 sq. feet
|
2 baths 4 beds |
show details | |

|
#40
Fawn Meadow Dr
Little Elm, TX 75068
|
2,326 sq. feet
|
2 baths 3 beds |
show details |
| Photo | Address | Area | Beds / Baths | Price | Details |
|---|---|---|---|---|---|

|
#41
Highland Cir
Little Elm, TX 75068
|
2,996 sq. feet
|
2 baths 4 beds |
show details | |

|
#42
Jasmine Valley Dr
Little Elm, TX 75068
|
2,170 sq. feet
|
2 baths 4 beds |
show details | |

|
#43
Spinnaker Run Pt
Little Elm, TX 75068
|
3,600 sq. feet
|
3 baths 4 beds |
show details | |

|
#44
Crystal Lake Dr
Little Elm, TX 75068
|
1,879 sq. feet
|
2 baths 3 beds |
show details | |

|
#45
Spruce Ct
Little Elm, TX 75068
|
4,167 sq. feet
|
4 baths 5 beds |
show details | |

|
#46
Persimmon Dr
Little Elm, TX 75068
|
1,808 sq. feet
|
2 baths 3 beds |
show details | |

|
#47
Salt Maker Way
Little Elm, TX 75068
|
1,507 sq. feet
|
2 baths 3 beds |
show details | |

|
#48
Toucan Dr
Little Elm, TX 75068
|
1,720 sq. feet
|
2 baths 3 beds |
show details | |

|
#49
Hawk Valley Dr
Little Elm, TX 75068
|
1,941 sq. feet
|
2 baths 3 beds |
show details | |

|
Check over 1 million property listings on Foreclosure.com!
|
browse all offers | |||


- 21,64242.0%White alone
- 10,71320.8%Hispanic
- 9,68318.8%Black alone
- 5,41910.5%Asian alone
- 4,6519.0%Two or more races
- 1940.4%Other race alone
- 940.2%American Indian alone
- 190.04%Native Hawaiian and Other
Pacific Islander alone
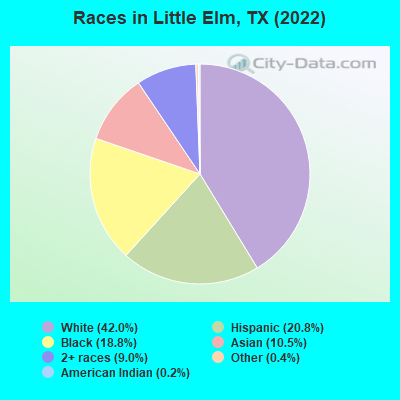
Races in Little Elm detailed stats: ancestries, foreign born residents, place of birth
According to our research of Texas and other state lists, there were 48 registered sex offenders living in Little Elm, Texas as of April 27, 2024.
The ratio of all residents to sex offenders in Little Elm is 791 to 1.
The ratio of registered sex offenders to all residents in this city is lower than the state average.
The City-Data.com crime index weighs serious crimes and violent crimes more heavily. Higher means more crime, U.S. average is 246.1. It adjusts for the number of visitors and daily workers commuting into cities.
- means the value is smaller than the state average.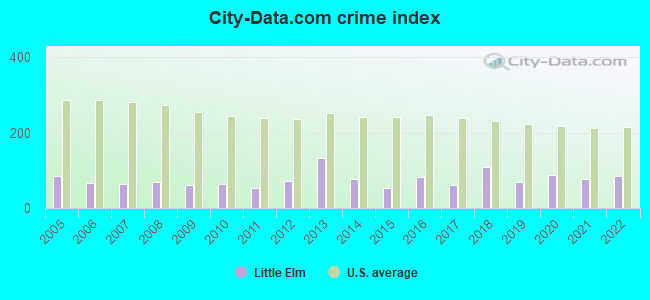
Crime rate in Little Elm detailed stats: murders, rapes, robberies, assaults, burglaries, thefts, arson
Full-time law enforcement employees in 2021, including police officers: 86 (79 officers - 67 male; 12 female).
| Officers per 1,000 residents here: | 1.29 |
| Texas average: | 2.07 |
 Recent articles from our blog. Our writers, many of them Ph.D. graduates or candidates, create easy-to-read articles on a wide variety of topics.

 | 2nd Little Elm High School (5 replies) |
| Relocating to Frisco, Plano, Little Elm (6 replies) |
| Little Elm Vs Melissa - Real Estate Query (2 replies) |
| McKinney vs Little Elm (2 replies) |
| Little Elm Racial division? (7 replies) |
| New build in Little Elm vs mid 2000's in Frisco/McKinney??? (3 replies) |
Latest news from Little Elm, TX collected exclusively by city-data.com from local newspapers, TV, and radio stations
Ancestries: American (7.8%), German (6.8%), English (4.1%), African (3.3%), Irish (2.9%), Nigerian (1.8%).
Current Local Time: CST time zone
Land area: 4.85 square miles.
Population density: 11,410 people per square mile (high).
9,307 residents are foreign born (7.5% Asia, 6.4% Latin America, 3.1% Africa).
| This town: | 18.1% |
| Texas: | 17.1% |
Median real estate property taxes paid for housing units with mortgages in 2022: $7,129 (1.7%)
Median real estate property taxes paid for housing units with no mortgage in 2022: $6,310 (1.8%)
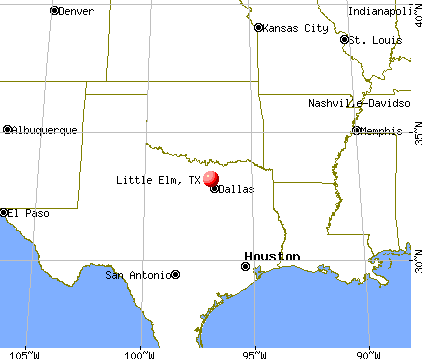
Nearest city with pop. 50,000+: Lewisville, TX  (9.7 miles , pop. 77,737).
Nearest city with pop. 200,000+: Plano, TX (13.3 miles , pop. 222,030).
Nearest city with pop. 1,000,000+: Dallas, TX (26.5 miles , pop. 1,188,580).
Nearest cities:
), ), ), )Latitude: 33.16 N, Longitude: 96.93 W
Property values in Little Elm, TX

Little Elm, Texas accommodation & food services, waste management - Economy and Business Data
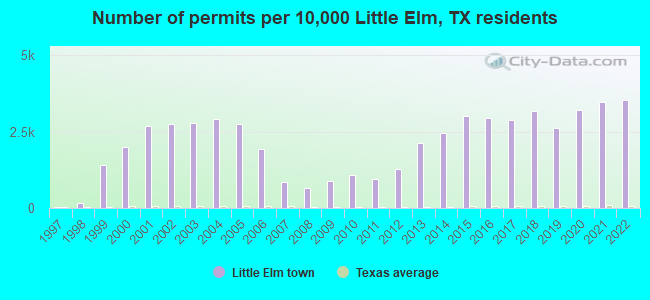
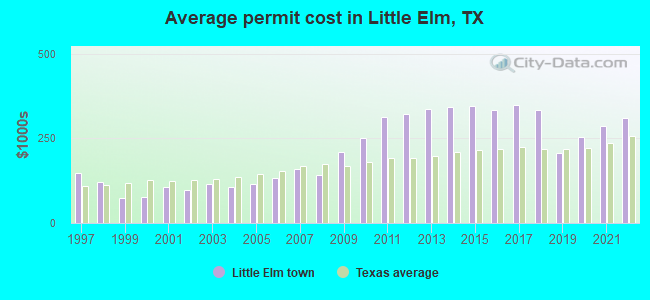
Single-family new house construction building permits:
- 2022: 1291 buildings, average cost: $310,400
- 2021: 1267 buildings, average cost: $287,900
- 2020: 1170 buildings, average cost: $254,200
- 2019: 960 buildings, average cost: $206,600
- 2018: 1162 buildings, average cost: $335,000
- 2017: 1047 buildings, average cost: $349,700
- 2016: 1081 buildings, average cost: $333,700
- 2015: 1102 buildings, average cost: $345,600
- 2014: 892 buildings, average cost: $341,700
- 2013: 771 buildings, average cost: $337,500
- 2012: 470 buildings, average cost: $321,900
- 2011: 343 buildings, average cost: $312,700
- 2010: 389 buildings, average cost: $249,800
- 2009: 319 buildings, average cost: $210,900
- 2008: 239 buildings, average cost: $141,900
- 2007: 310 buildings, average cost: $159,400
- 2006: 702 buildings, average cost: $132,100
- 2005: 999 buildings, average cost: $113,600
- 2004: 1061 buildings, average cost: $106,400
- 2003: 1019 buildings, average cost: $114,700
- 2002: 1001 buildings, average cost: $98,900
- 2001: 984 buildings, average cost: $104,700
- 2000: 727 buildings, average cost: $76,600
- 1999: 518 buildings, average cost: $74,200
- 1998: 54 buildings, average cost: $119,700
- 1997: 16 buildings, average cost: $147,300
| Here: | 3.1% |
| Texas: | 3.5% |
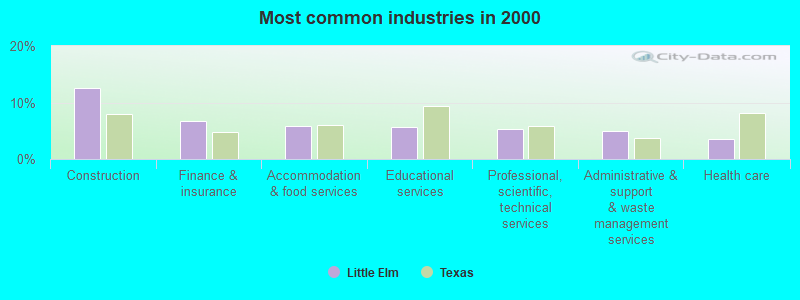
- Construction (12.6%)
- Finance & insurance (6.7%)
- Accommodation & food services (5.8%)
- Educational services (5.6%)
- Professional, scientific, technical services (5.4%)
- Administrative & support & waste management services (4.9%)
- Health care (3.6%)
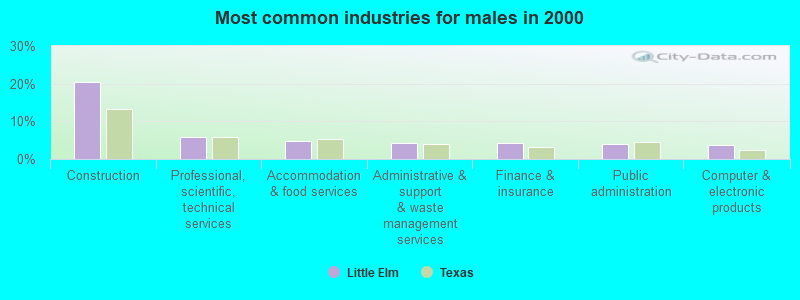
- Construction (20.4%)
- Professional, scientific, technical services (5.8%)
- Accommodation & food services (4.9%)
- Administrative & support & waste management services (4.3%)
- Finance & insurance (4.2%)
- Public administration (4.0%)
- Computer & electronic products (3.7%)
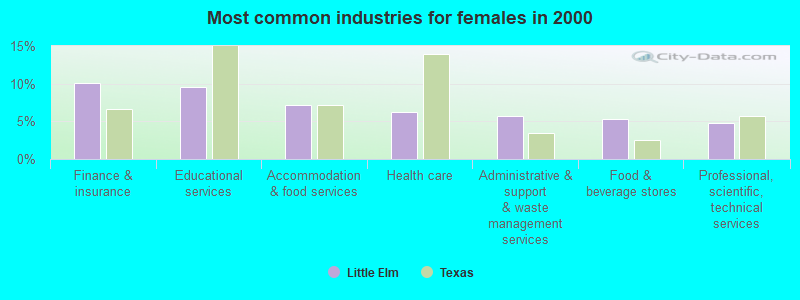
- Finance & insurance (10.1%)
- Educational services (9.5%)
- Accommodation & food services (7.2%)
- Health care (6.2%)
- Administrative & support & waste management services (5.7%)
- Food & beverage stores (5.3%)
- Professional, scientific, technical services (4.8%)
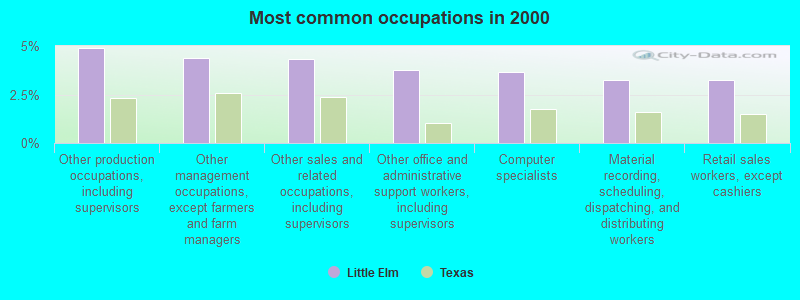
- Other production occupations, including supervisors (4.9%)
- Other management occupations, except farmers and farm managers (4.4%)
- Other sales and related occupations, including supervisors (4.3%)
- Other office and administrative support workers, including supervisors (3.8%)
- Computer specialists (3.6%)
- Material recording, scheduling, dispatching, and distributing workers (3.2%)
- Retail sales workers, except cashiers (3.2%)
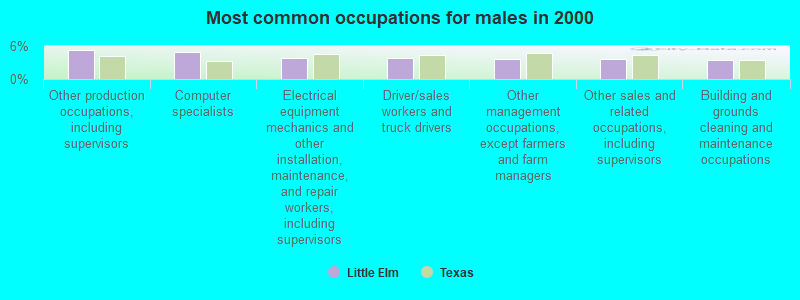
- Other production occupations, including supervisors (5.2%)
- Computer specialists (4.9%)
- Electrical equipment mechanics and other installation, maintenance, and repair workers, including supervisors (3.8%)
- Driver/sales workers and truck drivers (3.8%)
- Other management occupations, except farmers and farm managers (3.6%)
- Other sales and related occupations, including supervisors (3.6%)
- Building and grounds cleaning and maintenance occupations (3.4%)
- Secretaries and administrative assistants (6.3%)
- Other management occupations, except farmers and farm managers (5.4%)
- Other sales and related occupations, including supervisors (5.3%)
- Other office and administrative support workers, including supervisors (5.3%)
- Material recording, scheduling, dispatching, and distributing workers (5.2%)
- Preschool, kindergarten, elementary, and middle school teachers (5.1%)
- Other production occupations, including supervisors (4.4%)
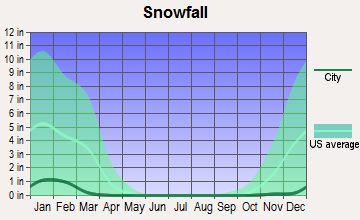
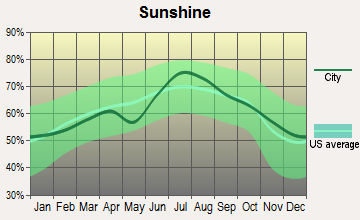
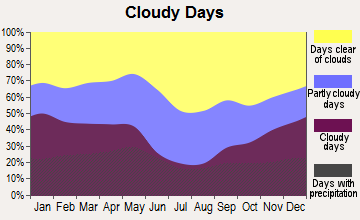
Average climate in Little Elm, Texas
Based on data reported by over 4,000 weather stations

(lower is better)
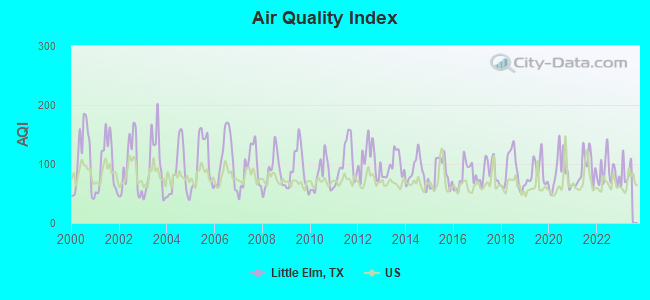
Air Quality Index (AQI) level in 2022 was 86.5. This is about average.
| City: | 86.5 |
| U.S.: | 72.6 |
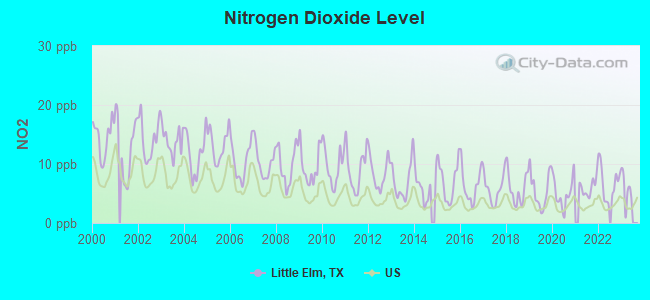
Nitrogen Dioxide (NO2) [ppb] level in 2022 was 6.77. This is worse than average. Closest monitor was 15.6 miles away from the city center.
| City: | 6.77 |
| U.S.: | 5.11 |
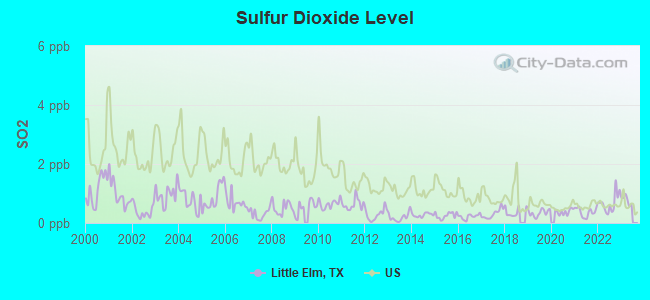
Sulfur Dioxide (SO2) [ppb] level in 2022 was 0.679. This is significantly better than average. Closest monitor was 12.3 miles away from the city center.
| City: | 0.679 |
| U.S.: | 1.515 |
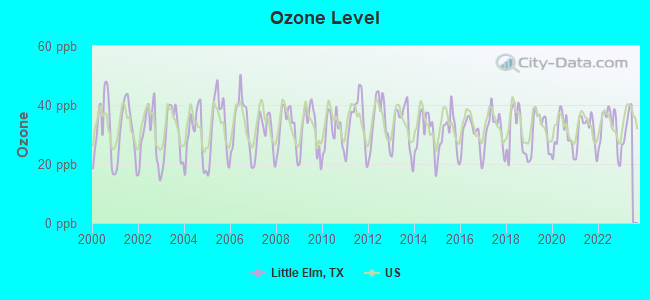
Ozone [ppb] level in 2022 was 32.4. This is about average. Closest monitor was 8.6 miles away from the city center.
| City: | 32.4 |
| U.S.: | 33.3 |
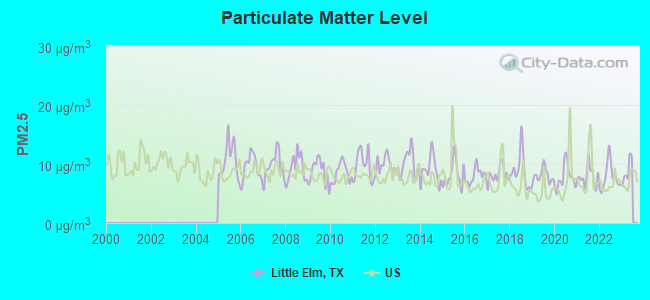
Particulate Matter (PM2.5) [µg/m3] level in 2022 was 7.83. This is about average. Closest monitor was 8.6 miles away from the city center.
| City: | 7.83 |
| U.S.: | 8.11 |
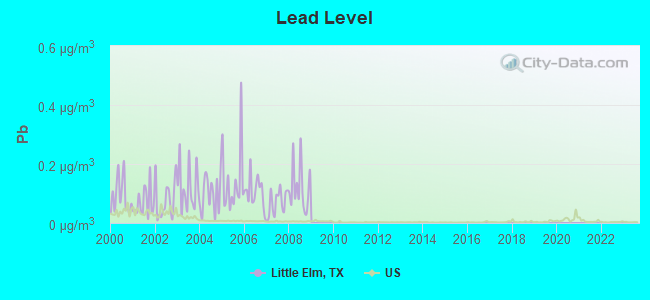
Lead (Pb) [µg/m3] level in 2008 was 0.121. This is significantly worse than average. Closest monitor was 6.0 miles away from the city center.
| City: | 0.121 |
| U.S.: | 0.009 |
Tornado activity:
Little Elm-area historical tornado activity is above Texas state average. It is 151% greater than the overall U.S. average.
On 4/2/1957, a category F3 (max. wind speeds 158-206 mph) tornado 7.3 miles away from the Little Elm town center killed 10 people and injured 200 people and caused between $500,000 and $5,000,000 in damages.
On 6/12/1966, a category F3 tornado 10.2 miles away from the town center .
Earthquake activity:
Little Elm-area historical earthquake activity is significantly above Texas state average. It is 513% greater than the overall U.S. average.On 11/6/2011 at 03:53:10, a magnitude 5.7 (5.7 MW, Depth: 3.2 mi, Class: Moderate, Intensity: VI - VII) earthquake occurred 164.1 miles away from the city center
On 9/3/2016 at 12:02:44, a magnitude 5.8 (5.8 MW, Depth: 3.5 mi) earthquake occurred 225.6 miles away from Little Elm center
On 6/16/1978 at 11:46:54, a magnitude 5.3 (4.4 MB, 4.6 UK, 5.3 ML) earthquake occurred 222.4 miles away from Little Elm center
On 11/7/2016 at 01:44:24, a magnitude 5.0 (5.0 MW, Depth: 2.8 mi) earthquake occurred 195.7 miles away from Little Elm center
On 11/8/2011 at 02:46:57, a magnitude 4.8 (4.8 MW, Depth: 3.1 mi, Class: Light, Intensity: IV - V) earthquake occurred 163.9 miles away from Little Elm center
On 11/5/2011 at 07:12:45, a magnitude 4.8 (4.8 MW, Depth: 1.9 mi) earthquake occurred 165.3 miles away from Little Elm center
Magnitude types: body-wave magnitude (MB), local magnitude (ML), moment magnitude (MW)
Natural disasters:
The number of natural disasters in Denton County (18) is near the US average (15).Major Disasters (Presidential) Declared: 7
Emergencies Declared: 9
Causes of natural disasters: Storms: 6, Fires: 5, Floods: 5, Hurricanes: 5, Tornadoes: 5, Wind: 1, Other: 2 (Note: some incidents may be assigned to more than one category).
Main business address for: RETRACTABLE TECHNOLOGIES INC (SURGICAL & MEDICAL INSTRUMENTS & APPARATUS).
Hospitals and medical centers in Little Elm:
Airports located in Little Elm:
- Spanish Oaks Airport (76TX) (Runways: 1)
Colleges/universities with over 2000 students nearest to Little Elm:
- Texas Woman's University (about 13 miles; Denton, TX; Full-time enrollment: 11,837)
- University of North Texas (about 14 miles; Denton, TX; FT enrollment: 31,694)
- The University of Texas at Dallas (about 17 miles; Richardson, TX; FT enrollment: 16,777)
- DeVry University-Texas (about 17 miles; Irving, TX; FT enrollment: 4,098)
- Collin County Community College District (about 17 miles; McKinney, TX; FT enrollment: 18,044)
- Brookhaven College (about 17 miles; Farmers Branch, TX; FT enrollment: 6,868)
- North Lake College (about 21 miles; Irving, TX; FT enrollment: 6,191)
Public high schools in Little Elm:
- LITTLE ELM H S (Students: 1,486, Location: 1900 WALKER LN, Grades: 9-12)
- DENTON CO J J A E P (Location: 500 LOBO LN, Grades: 8-12)
Public elementary/middle schools in Little Elm:
- LAKESIDE MIDDLE (Students: 809, Location: 400 LOBO LN, Grades: 6-8)
- CESAR CHAVEZ EL (Students: 608, Location: 2600 HART RD, Grades: PK-5)
- D H BRENT EL (Students: 528, Location: 500 WITT RD, Grades: PK-5)
- HERSCHEL ZELLARS EL (Students: 393, Location: 300 LOBO LN, Grades: PK-5)
- EDUCATION CENTER AT LITTLE ELM (Location: 5901 CRESTWOOD PL, Grades: KG-8, Charter school)
- ROBERTSON EL (Location: 2501 WOODLAKE PKWY, Grades: KG-5)
- LAKEVIEW EL (Location: 1800 WATERSIDE, Grades: PK-5)
User-submitted facts and corrections:
- The current library information is Little Elm Public Library, 100 W. Eldorado Parkway, Little Elm, TX 75068 214-975-0430 fax number 214-540-2345 email library at littleelm.org 17,528 items in collection as of August 2005 Services include computers with internet access, copier, fax, programs for all ages, books, audios, videos, and dvd's.
Points of interest:
Notable location: Little Elm Fire Department (A). Display/hide its location on the map
Main business address in Little Elm: RETRACTABLE TECHNOLOGIES INC (A). Display/hide its location on the map
Parks in Little Elm include: Little Elm Park (1), Cottonwood Park (2), Marion Field (3). Display/hide their locations on the map
| This town: | 3.2 people |
| Texas: | 2.8 people |
| This town: | 81.1% |
| Whole state: | 69.9% |
| This town: | 6.2% |
| Whole state: | 6.0% |
Likely homosexual households (counted as self-reported same-sex unmarried-partner households)
- Lesbian couples: 0.4% of all households
- Gay men: 0.4% of all households
Banks with branches in Little Elm (2011 data):
- JPMorgan Chase Bank, National Association: Little Elm Banking Center Branch at 2701 Fm 423, branch established on 2005/10/24. Info updated 2011/11/10: Bank assets: $1,811,678.0 mil, Deposits: $1,190,738.0 mil, headquarters in Columbus, OH, positive income, International Specialization, 5577 total offices, Holding Company: Jpmorgan Chase & Co.
- Pointbank: Little Elm Branch at 2103 E Eldorado Parkway, branch established on 2004/05/25. Info updated 2006/11/03: Bank assets: $325.7 mil, Deposits: $287.2 mil, headquarters in Pilot Point, TX, positive income, Commercial Lending Specialization, 9 total offices, Holding Company: Pilot Point Bancorp, Inc. Esop
- Independent Bank: Little Elm Branch at 229 Eldorado Parkway, branch established on 1994/09/01. Info updated 2010/10/06: Bank assets: $1,237.6 mil, Deposits: $1,035.0 mil, headquarters in Mckinney, TX, positive income, Commercial Lending Specialization, 27 total offices, Holding Company: Independent Bank Group, Inc.
For population 15 years and over in Little Elm:
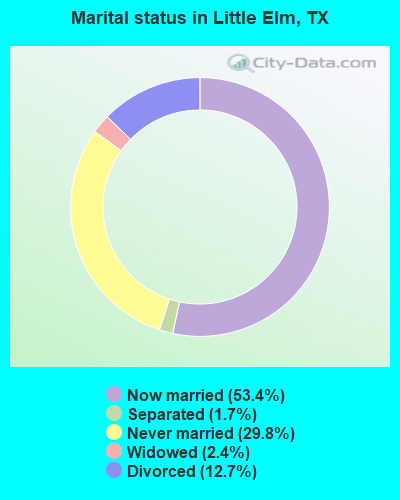
- Never married: 29.8%
- Now married: 53.4%
- Separated: 1.7%
- Widowed: 2.4%
- Divorced: 12.7%
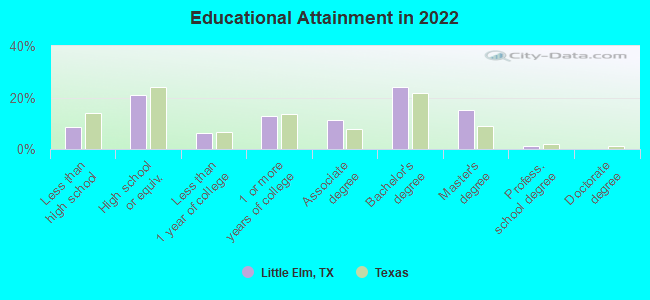
For population 25 years and over in Little Elm:
- High school or higher: 91.6%
- Bachelor's degree or higher: 38.7%
- Graduate or professional degree: 14.7%
- Unemployed: 3.7%
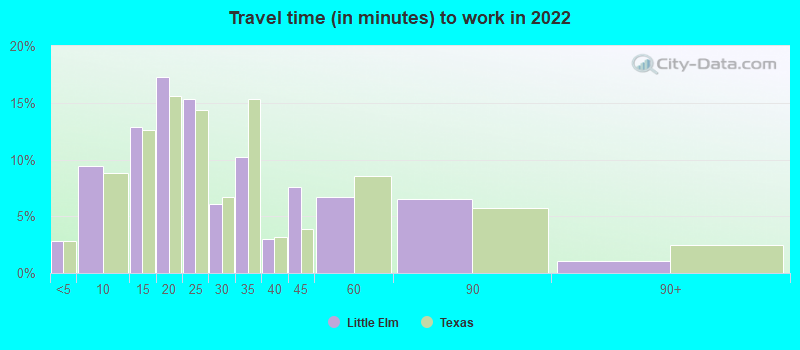
- Mean travel time to work (commute): 28.7 minutes
| Here: | 10.6 |
| Texas average: | 14.0 |
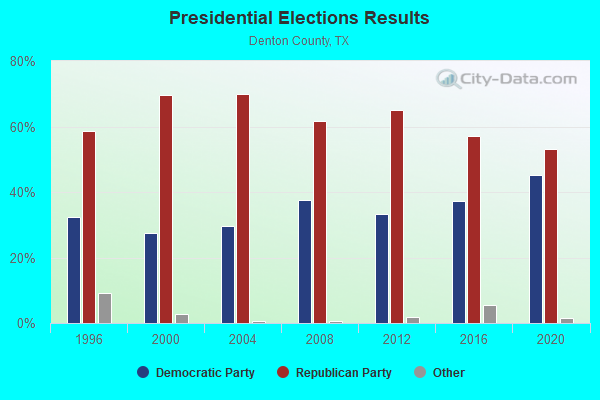
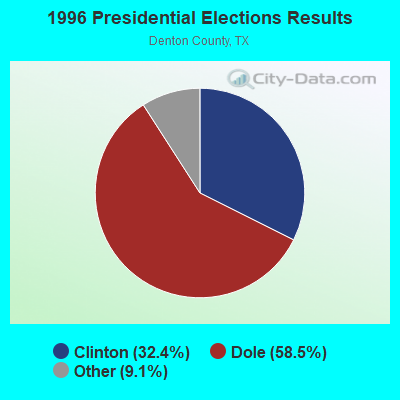

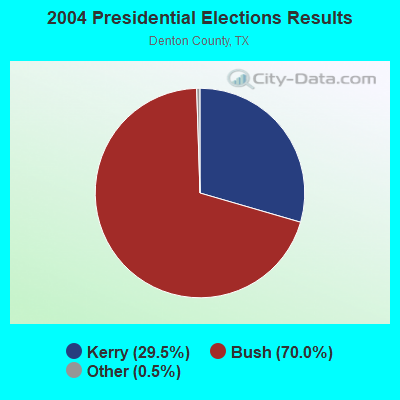

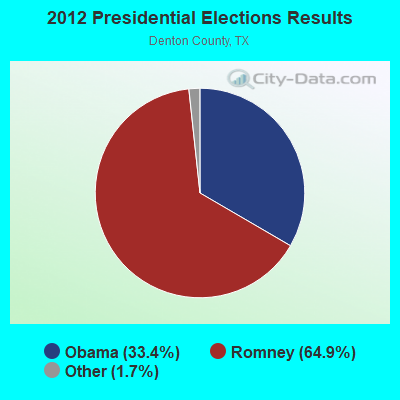
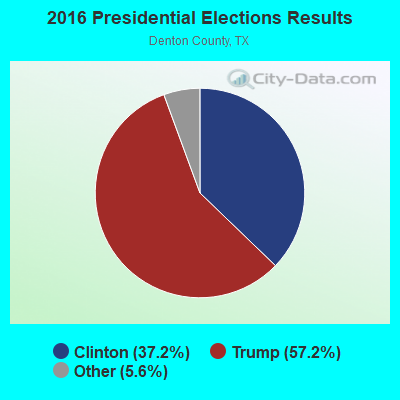
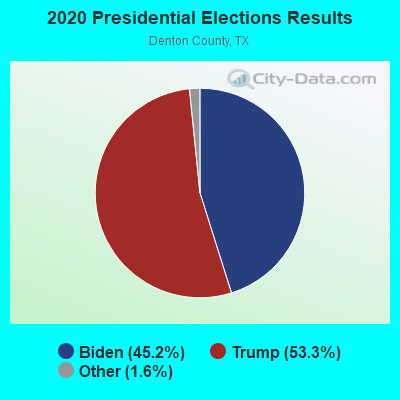
Graphs represent county-level data. Detailed 2008 Election Results
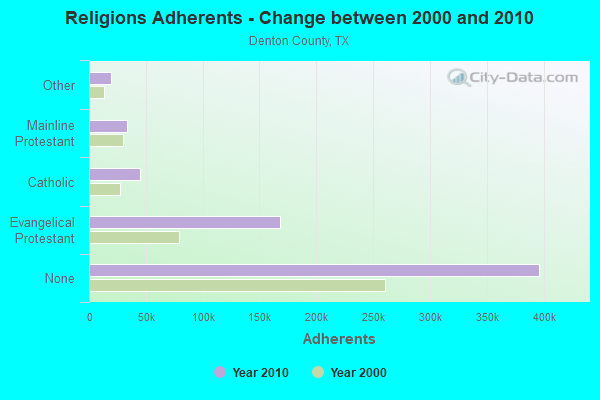
Religion statistics for Little Elm, TX (based on Denton County data)
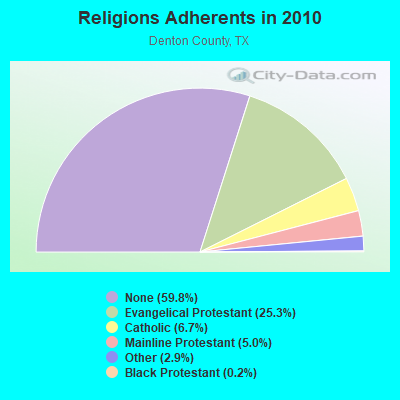
| Religion | Adherents | Congregations |
|---|---|---|
| Evangelical Protestant | 167,945 | 321 |
| Catholic | 44,615 | 8 |
| Mainline Protestant | 33,340 | 56 |
| Other | 18,928 | 42 |
| Black Protestant | 1,354 | 8 |
| Orthodox | 120 | 1 |
| None | 396,312 | - |
Food Environment Statistics:
| This county: | 0.85 / 10,000 pop. |
| Texas: | 1.47 / 10,000 pop. |
| This county: | 0.16 / 10,000 pop. |
| Texas: | 0.14 / 10,000 pop. |
| Here: | 0.57 / 10,000 pop. |
| Texas: | 1.11 / 10,000 pop. |
| Denton County: | 2.67 / 10,000 pop. |
| Texas: | 3.95 / 10,000 pop. |
| Here: | 4.90 / 10,000 pop. |
| Texas: | 6.13 / 10,000 pop. |
| Here: | 8.5% |
| Texas: | 8.9% |
| Denton County: | 28.4% |
| Texas: | 26.6% |
| Denton County: | 13.8% |
| Texas: | 15.7% |
Health and Nutrition:
| Little Elm: | 48.9% |
| Texas: | 48.6% |
| Here: | 48.9% |
| Texas: | 47.4% |
| This city: | 28.4 |
| Texas: | 28.5 |
| Little Elm: | 20.4% |
| Texas: | 20.6% |
| Little Elm: | 9.1% |
| Texas: | 10.3% |
| Little Elm: | 6.8 |
| Texas: | 6.8 |
| This city: | 31.9% |
| Texas: | 33.1% |
| Here: | 59.0% |
| Texas: | 56.2% |
| This city: | 82.7% |
| Texas: | 80.7% |
More about Health and Nutrition of Little Elm, TX Residents
| Local government employment and payroll (March 2022) | |||||
| Function | Full-time employees | Monthly full-time payroll | Average yearly full-time wage | Part-time employees | Monthly part-time payroll |
|---|---|---|---|---|---|
| Police Protection - Officers | 79 | $529,427 | $80,419 | 2 | $3,346 |
| Firefighters | 63 | $473,027 | $90,100 | 0 | $0 |
| Parks and Recreation | 27 | $150,173 | $66,744 | 89 | $84,745 |
| Other and Unallocable | 25 | $153,293 | $73,581 | 1 | $1,935 |
| Financial Administration | 13 | $89,371 | $82,496 | 0 | $0 |
| Streets and Highways | 13 | $66,980 | $61,828 | 0 | $0 |
| Water Supply | 12 | $56,544 | $56,544 | 0 | $0 |
| Other Government Administration | 11 | $94,895 | $103,522 | 7 | $750 |
| Sewerage | 11 | $48,035 | $52,402 | 0 | $0 |
| Fire - Other | 9 | $87,531 | $116,708 | 0 | $0 |
| Police - Other | 5 | $38,739 | $92,974 | 0 | $0 |
| Local Libraries | 5 | $21,220 | $50,928 | 6 | $7,298 |
| Natural Resources | 4 | $13,022 | $39,066 | 0 | $0 |
| Judicial and Legal | 4 | $18,547 | $55,641 | 0 | $0 |
| Health | 3 | $15,555 | $62,220 | 0 | $0 |
| Solid Waste Management | 1 | $3,379 | $40,548 | 0 | $0 |
| Totals for Government | 285 | $1,859,737 | $78,305 | 105 | $98,075 |
Little Elm government finances - Expenditure in 2021 (per resident):
- Current Operations - Police Protection: $9,500,000 ($171.61)
Local Fire Protection: $7,000,000 ($126.45)
Water Utilities: $7,000,000 ($126.45)
Sewerage: $2,000,000 ($36.13)
Central Staff Services: $1,750,000 ($31.61)
Financial Administration: $1,507,000 ($27.22)
Protective Inspection and Regulation - Other: $1,180,000 ($21.32)
Parks and Recreation: $1,000,000 ($18.06)
Regular Highways: $917,000 ($16.57)
General Public Buildings: $800,000 ($14.45)
Natural Resources - Other: $550,000 ($9.94)
Libraries: $518,000 ($9.36)
Judicial and Legal Services: $456,000 ($8.24)
- General - Interest on Debt: $3,616,000 ($65.32)
- Other Capital Outlay - Local Fire Protection: $80,000 ($1.45)
- Water Utilities - Interest on Debt: $241,000 ($4.35)
Little Elm government finances - Revenue in 2021 (per resident):
- Charges - Sewerage: $6,947,000 ($125.49)
Parks and Recreation: $2,570,000 ($46.43)
Other: $2,256,000 ($40.75)
- Federal Intergovernmental - General Local Government Support: $769,000 ($13.89)
- Local Intergovernmental - Public Welfare: $2,897,000 ($52.33)
Housing and Community Development: $133,000 ($2.40)
Other: $45,000 ($0.81)
- Miscellaneous - General Revenue - Other: $2,196,000 ($39.67)
Fines and Forfeits: $675,000 ($12.19)
Interest Earnings: $549,000 ($9.92)
Donations From Private Sources: $7,000 ($0.13)
Rents: $1,000 ($0.02)
- Revenue - Water Utilities: $10,841,000 ($195.84)
- State Intergovernmental - General Local Government Support: $81,000 ($1.46)
- Tax - Property: $21,481,000 ($388.04)
General Sales and Gross Receipts: $5,291,000 ($95.58)
Other License: $5,062,000 ($91.44)
Occupation and Business License - Other: $5,000 ($0.09)
Little Elm government finances - Debt in 2021 (per resident):
- Long Term Debt - Outstanding Unspecified Public Purpose: $106,417,000 ($1922.38)
Beginning Outstanding - Unspecified Public Purpose: $96,417,000 ($1741.73)
Issue, Unspecified Public Purpose: $10,000,000 ($180.65)
Little Elm government finances - Cash and Securities in 2021 (per resident):
- Bond Funds - Cash and Securities: $9,920,000 ($179.20)
- Other Funds - Cash and Securities: $16,674,000 ($301.21)
12.39% of this county's 2021 resident taxpayers lived in other counties in 2020 ($93,158 average adjusted gross income)
| Here: | 12.39% |
| Texas average: | 8.12% |
0.01% of residents moved from foreign countries ($94 average AGI)
Denton County: 0.01% Texas average: 0.04%
Top counties from which taxpayers relocated into this county between 2020 and 2021:
| from Dallas County, TX | |
| from Collin County, TX | |
| from Tarrant County, TX |
10.07% of this county's 2020 resident taxpayers moved to other counties in 2021 ($79,464 average adjusted gross income)
| Here: | 10.07% |
| Texas average: | 7.40% |
0.01% of residents moved to foreign countries ($63 average AGI)
Denton County: 0.01% Texas average: 0.03%
Top counties to which taxpayers relocated from this county between 2020 and 2021:
| to Collin County, TX | |
| to Dallas County, TX | |
| to Tarrant County, TX |
| Businesses in Little Elm, TX | ||||
| Name | Count | Name | Count | |
|---|---|---|---|---|
| 24 Hour Fitness | 1 | Hobby Lobby | 1 | |
| 7-Eleven | 3 | KFC | 1 | |
| AT&T | 1 | Long John Silver's | 1 | |
| Applebee's | 1 | Lowe's | 1 | |
| AutoZone | 1 | McDonald's | 1 | |
| Baskin-Robbins | 1 | Nike | 1 | |
| Blockbuster | 1 | Popeyes | 1 | |
| Burger King | 1 | SONIC Drive-In | 2 | |
| CVS | 1 | Starbucks | 1 | |
| Discount Tire | 1 | Taco Bell | 1 | |
| Domino's Pizza | 1 | UPS | 3 | |
| FedEx | 2 | Walgreens | 1 | |
| H&R Block | 2 | |||
Strongest AM radio stations in Little Elm:
- KTNO (1440 AM; 12 kW; DENTON, TX; Owner: MORTENSON BROADCASTING COMPANY)
- KRLD (1080 AM; 50 kW; DALLAS, TX; Owner: TEXAS INFINITY BROADCASTING L.P.)
- KXEB (910 AM; 1 kW; SHERMAN, TX; Owner: AMIGO RADIO, LTD.)
- KBIS (1150 AM; 25 kW; HIGHLAND PARK, TX; Owner: DALLAS AM RADIO PARTNERS, L.P.)
- KZMP (1540 AM; 50 kW; UNIVERSITY PARK, TX; Owner: ENTRAVISION HOLDINGS, LLC)
- WBAP (820 AM; 50 kW; FORT WORTH, TX; Owner: WBAP-KSCS OPERATING, LTD.)
- KESS (1270 AM; 50 kW; FORT WORTH, TX; Owner: KESS-AM LICENSE CORP.)
- KFXR (1190 AM; 50 kW; DALLAS, TX; Owner: CLEAR CHANNEL BROADCASTING LICENSES, INC.)
- KLIF (570 AM; 5 kW; DALLAS, TX; Owner: KLIF LICO, INC.)
- KTCK (1310 AM; 9 kW; DALLAS, TX; Owner: KRBE LICO, INC.)
- KSKY (660 AM; 20 kW; BALCH SPRINGS, TX; Owner: BISON MEDIA, INC.)
- KAAM (770 AM; 10 kW; GARLAND, TX; Owner: DONTRON, INC.)
- KAHZ (1360 AM; 50 kW; HURST, TX)
Strongest FM radio stations in Little Elm:
- KPLX (99.5 FM; FORT WORTH, TX; Owner: KPLX LICO, INC.)
- KESN (103.3 FM; ALLEN, TX; Owner: WBAP-KSCS OPERATING, LTD.)
- KSOC (94.5 FM; GAINESVILLE, TX; Owner: RADIO ONE LICENSES, LLC)
- KTPW (89.7 FM; SANGER, TX; Owner: RESEARCH EDUCATIONAL FOUNDATION, INC)
- KLUV-FM (98.7 FM; DALLAS, TX; Owner: INFINITY BROADCASTING CORPORATION OF DALLAS)
- WRR (101.1 FM; DALLAS, TX; Owner: CITY OF DALLAS, TEXAS)
- KNOR (93.7 FM; HEALDTON, OK; Owner: AM & PM BROADCASTERS, LLC)
- KMEO (96.7 FM; FLOWER MOUND, TX; Owner: ABC, INC.)
- KKDL (106.7 FM; MUENSTER, TX; Owner: ENTRAVISION HOLDINGS, LLC)
- KZMP-FM (101.7 FM; AZLE, TX; Owner: ENTRAVISION HOLDINGS, LLC)
- KTCY (104.9 FM; PILOT POINT, TX; Owner: ENTRAVISION HOLDINGS, LLC)
- KRNB (105.7 FM; DECATUR, TX; Owner: SERVICE BROADCASTING I, LTD.)
- KHYI (95.3 FM; HOWE, TX; Owner: METRO BROADCASTERS - TEXAS, INC.)
- KLLI (105.3 FM; DALLAS, TX; Owner: INFINITY BROADCASTING CORPORATION OF DALLAS)
- KDKR (91.3 FM; DECATUR, TX; Owner: CSN INTERNATIONAL)
- KHCK-FM (99.1 FM; DENTON, TX; Owner: KHCK-FM LICENSE CORP.)
- KZPS (92.5 FM; DALLAS, TX; Owner: AMFM TEXAS LICENSES LIMITED PARTNERSHIP)
- KHKS (106.1 FM; DENTON, TX; Owner: AMFM TEXAS LICENSES LIMITED PARTNERSHIP)
- KNTU (88.1 FM; MCKINNEY, TX; Owner: UNIVERSITY OF NORTH TEXAS)
- KVIL-FM (103.7 FM; HIGHLAND PARK-DALLAS, TX; Owner: INFINITY BROADCASTING CORPORATION OF TEXAS)
TV broadcast stations around Little Elm:
- KLDT (Channel 55; LAKE DALLAS, TX; Owner: JOHNSON BROADCASTING OF DALLAS, INC.)
- KTVT (Channel 11; FORT WORTH, TX; Owner: CBS STATIONS GROUP OF TEXAS L.P.)
- KXAS-TV (Channel 5; FORT WORTH, TX; Owner: STATION VENTURE OPERATIONS, LP)
- KDTN (Channel 2; DENTON, TX; Owner: NORTH TEXAS PUBLIC BROADCASTING, INC.)
- KLEG-LP (Channel 44; DALLAS, TX; Owner: DILIP VISWANATH)
- KSTR-TV (Channel 49; IRVING, TX; Owner: TELEFUTURA DALLAS LLC)
- KTXA (Channel 21; FORT WORTH, TX; Owner: VIACOM TELEVISION STATIONS GROUP OF DALLAS/FORT WORTH L.P.)
- KMPX (Channel 29; DECATUR, TX; Owner: WORD OF GOD FELLOWSHIP, INC.)
- KUVN (Channel 23; GARLAND, TX; Owner: KUVN LICENSE PARTNERSHIP, L.P.)
- KPXD (Channel 68; ARLINGTON, TX; Owner: PAXSON DALLAS LICENSE, INC.)
- WFAA-TV (Channel 8; DALLAS, TX; Owner: WFAA-TV, L.P.)
- KERA-TV (Channel 13; DALLAS, TX; Owner: NORTH TEXAS PUBLIC BROADCASTING, INC.)
- KXTX-TV (Channel 39; DALLAS, TX; Owner: TELEMUNDO OF TEXAS PARTNERSHIP, LP)
- KDTX-TV (Channel 58; DALLAS, TX; Owner: TRINITY BROADCASTING OF TEXAS, INC.)
- KDFW (Channel 4; DALLAS, TX; Owner: KDFW LICENSE, INC.)
- KDAF (Channel 33; DALLAS, TX; Owner: TRIBUNE TELEVISION COMPANY)
- KDFI (Channel 27; DALLAS, TX; Owner: NEW DMIC, INC.)
- KJJM-LP (Channel 46; DALLAS/MESQUITE, TX; Owner: JANE McGINNIS)
- KTAQ (Channel 47; GREENVILLE, TX; Owner: MIKE SIMONS)
- KFWD (Channel 52; FORT WORTH, TX; Owner: HIC BROADCAST, INC.)
- K26HF (Channel 26; BRITTON, TX; Owner: MAKO COMMUNICATIONS, LLC)
- KHPK-LP (Channel 28; DE SOTO, TX; Owner: MAKO COMMUNICATIONS, LLC)
- K25FW (Channel 25; CORSICANA, TX; Owner: VENTANA TELEVISION, INC.)
- KATA-LP (Channel 60; MESQUITE, TX; Owner: JANE McGINNIS)
- National Bridge Inventory (NBI) Statistics
- 20Number of bridges
- 545ft / 166mTotal length
- $6,000Total costs
- 468,138Total average daily traffic
- 32,093Total average daily truck traffic
- 447,556Total future (year 2027) average daily traffic
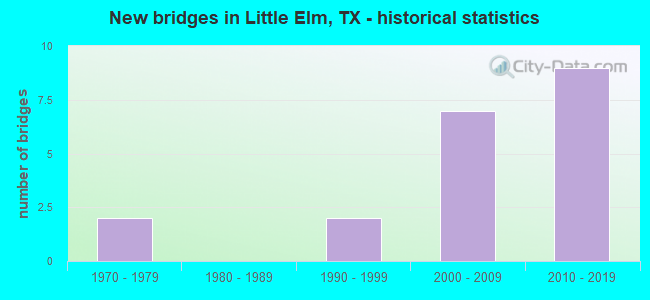
- New bridges - historical statistics
- 21970-1979
- 21990-1999
- 72000-2009
- 92010-2019
FCC Registered Antenna Towers:
59 (See the full list of FCC Registered Antenna Towers in Little Elm)FCC Registered Broadcast Land Mobile Towers:
7- City Hall 101 Hardwicke Lane (Lat: 33.160111 Lon: -96.937778), Call Sign: KYW856, Licensee ID: L00096697,
Assigned Frequencies: 155.835 MHz, 156.090 MHz, Grant Date: 06/19/1995, Expiration Date: 08/28/2000, Cancellation Date: 10/29/2000, Registrant: City Of Little Elm, City Hall 101 Hardwicke Ln, Little Elm, TX 75068, Phone: (214) 294-1821
- 3 Mi Ese (Lat: 33.153722 Lon: -96.889722), Type: Tower, Structure height: 140 m, Overall height: 142 m, Call Sign: WNQI599,
Assigned Frequencies: 451.400 MHz, Grant Date: 09/16/1998, Expiration Date: 09/16/2003, Cancellation Date: 09/23/2003, Certifier: Preston C Johnson, Registrant: Wiley Rein & Fielding LLP, 1776 K Street, N.W., Washington, DC 20006, Phone: (202) 719-3240, Fax: (202) 719-7049, Email:
- Lat: 33.184944 Lon: -96.968389, Call Sign: WQJF503,
Assigned Frequencies: 452.487 MHz, 451.537 MHz, Grant Date: 06/23/2018, Expiration Date: 08/19/2028, Certifier: Martha Werner, Registrant: Federal License Management, 175 Pine St, Suite 104, Williamsport, PA 17701-6549, Phone: (866) 908-2220, Fax: (570) 323-4002, Email:
- Lat: 33.168056 Lon: -96.890556, Call Sign: WQLM898,
Assigned Frequencies: 30.8400 MHz, 154.540 MHz, 33.4000 MHz, 33.1600 MHz, 31.2400 MHz, 468.487 MHz, 468.762 MHz, 469.462 MHz, 469.637 MHz, 469.662 MHz... (+17 more), Grant Date: 03/11/2010, Expiration Date: 03/11/2020, Cancellation Date: 05/16/2020, Certifier: Marcella Hammond, Registrant: Dolfen Consulting Group, 95 Willow Lane, Bristol, IL 60512-9711, Phone: (630) 553-5886, Fax: (530) 566-1755, Email:
- Lat: 33.157833 Lon: -96.939806, Call Sign: WQOA713,
Assigned Frequencies: 462.337 MHz, 467.337 MHz, Grant Date: 07/27/2011, Expiration Date: 07/27/2021, Cancellation Date: 10/09/2021, Certifier: Lynn Tompkins, Registrant: Cara Enterprises Inc, Las Vegas, NV 89140-0124, Phone: (702) 838-9728, Fax: (702) 363-4607, Email:
- Lat: 33.165444 Lon: -96.967944, Call Sign: WQTZ354,
Assigned Frequencies: 72.1000 MHz, Grant Date: 05/12/2014, Expiration Date: 05/12/2024, Certifier: Lilli Farley, Registrant: Primex Wireless, Inc., 965 Wells Street, Lake Geneva, WI 53147, Phone: (800) 537-0464
- DISTRICT LITTLE ELMS, Lat: 33.191306 Lon: -96.982889, Call Sign: WRUA304, Licensee ID: L01502812,
Assigned Frequencies: 451.187 MHz, Grant Date: 08/04/2022, Expiration Date: 08/04/2032, Certifier: Jack Graudenz, Registrant: Cereniti Datasense Networks, 41 East Washington Street, Suite 110, Indianapolis, IN 46204, Phone: (877) 237-3648, Fax: (877) 362-6640, Email:
FCC Registered Microwave Towers:
9 (See the full list of FCC Registered Microwave Towers in this town)FCC Registered Paging Towers:
2 (See the full list of FCC Registered Paging Towers)FCC Registered Amateur Radio Licenses:
189 (See the full list of FCC Registered Amateur Radio Licenses in Little Elm)FAA Registered Aircraft:
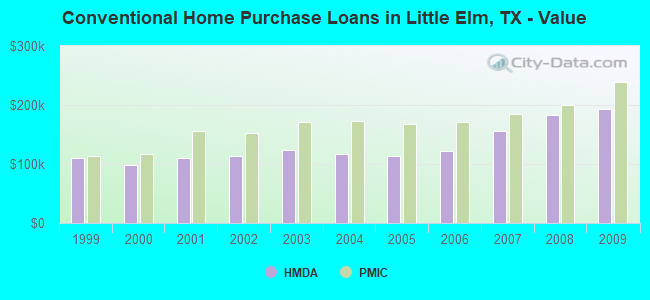
18 (See the full list of FAA Registered Aircraft in Little Elm)| Home Mortgage Disclosure Act Aggregated Statistics For Year 2009 (Based on 2 partial tracts) | ||||||||||||
| A) FHA, FSA/RHS & VA Home Purchase Loans | B) Conventional Home Purchase Loans | C) Refinancings | D) Home Improvement Loans | F) Non-occupant Loans on < 5 Family Dwellings (A B C & D) | G) Loans On Manufactured Home Dwelling (A B C & D) | |||||||
|---|---|---|---|---|---|---|---|---|---|---|---|---|
| Number | Average Value | Number | Average Value | Number | Average Value | Number | Average Value | Number | Average Value | Number | Average Value | |
| LOANS ORIGINATED | 87 | $166,868 | 62 | $193,511 | 128 | $198,496 | 5 | $37,186 | 10 | $140,737 | 1 | $54,050 |
| APPLICATIONS APPROVED, NOT ACCEPTED | 3 | $220,617 | 6 | $187,733 | 13 | $167,009 | 1 | $25,000 | 1 | $77,170 | 0 | $0 |
| APPLICATIONS DENIED | 11 | $161,287 | 9 | $161,701 | 44 | $192,160 | 6 | $38,352 | 3 | $136,393 | 1 | $58,560 |
| APPLICATIONS WITHDRAWN | 11 | $172,396 | 8 | $266,079 | 28 | $194,724 | 1 | $83,000 | 1 | $204,920 | 0 | $0 |
| FILES CLOSED FOR INCOMPLETENESS | 1 | $202,100 | 2 | $230,345 | 7 | $174,920 | 1 | $48,690 | 0 | $0 | 0 | $0 |
Detailed HMDA statistics for the following Tracts: 0201.02
| Private Mortgage Insurance Companies Aggregated Statistics For Year 2009 (Based on 2 partial tracts) | ||||
| A) Conventional Home Purchase Loans | B) Refinancings | |||
|---|---|---|---|---|
| Number | Average Value | Number | Average Value | |
| LOANS ORIGINATED | 14 | $238,149 | 6 | $195,442 |
| APPLICATIONS APPROVED, NOT ACCEPTED | 5 | $227,668 | 3 | $231,020 |
| APPLICATIONS DENIED | 2 | $282,940 | 1 | $239,700 |
| APPLICATIONS WITHDRAWN | 1 | $256,810 | 1 | $135,450 |
| FILES CLOSED FOR INCOMPLETENESS | 0 | $0 | 0 | $0 |
Detailed PMIC statistics for the following Tracts: 0201.02
2002 - 2018 National Fire Incident Reporting System (NFIRS) incidents
- Fire incident types reported to NFIRS in Little Elm, TX
- 87243.5%Structure Fires
- 84142.0%Outside Fires
- 1547.7%Mobile Property/Vehicle Fires
- 1376.8%Other
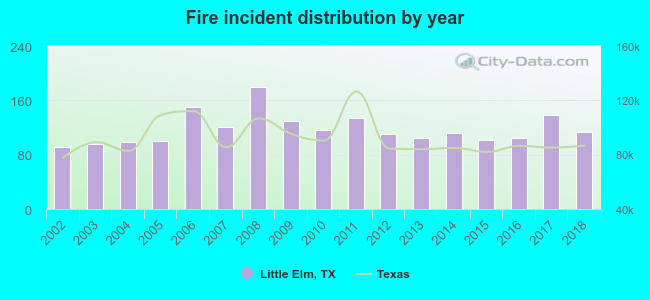 According to the data from the years 2002 - 2018 the average number of fire incidents per year is 118. The highest number of fires - 180 took place in 2008, and the least - 92 in 2002. The data has a rising trend.
 When looking into fire subcategories, the most incidents belonged to: Structure Fires (43.5%), and Outside Fires (42.0%).
- 49.8%Electricity
- 47.6%Utility gas
- 1.6%Bottled, tank, or LP gas
- 0.5%Solar energy
- 0.3%Fuel oil, kerosene, etc.
- 81.9%Electricity
- 15.5%Utility gas
- 1.2%Bottled, tank, or LP gas
- 1.2%No fuel used
- 0.3%Fuel oil, kerosene, etc.
Little Elm compared to Texas state average:
- Unemployed percentage significantly below state average.
- Black race population percentage significantly above state average.
- Hispanic race population percentage significantly above state average.
- Foreign-born population percentage significantly above state average.
- Renting percentage below state average.
- House age significantly below state average.
- Number of college students significantly above state average.
- Percentage of population with a bachelor's degree or higher above state average.
Little Elm on our top lists:
- #15 on the list of "Top 101 cities with most building permits per 10,000 residents (population 5,000+)"
- #21 on the list of "Top 100 fastest growing cities from 2000 to 2014"
- #93 on the list of "Top 101 cities with the most people taking a ferryboat to work (population 5,000+)"
- #100 on the list of "Top 100 cities with newest houses (pop. 5,000+)"
- #9 on the list of "Top 101 counties with the lowest number of deaths per 1000 residents 2007-2013 (pop. 50,000+)"
- #11 on the list of "Top 101 counties with the highest surface withdrawal of fresh water for public supply"
- #15 on the list of "Top 101 counties with the highest total withdrawal of fresh water for public supply"
- #19 on the list of "Top 101 counties with the largest number of children under 18 without health insurance coverage in 2000 (pop. 50,000+)"
- #33 on the list of "Top 101 counties with the most Evangelical Protestant adherents"

|
|
Total of 243 patent applications in 2008-2024.