Estimated zip code population in 2022: 86,186 Zip code population in 2010: 47,553 Zip code population in 2000: 19,113
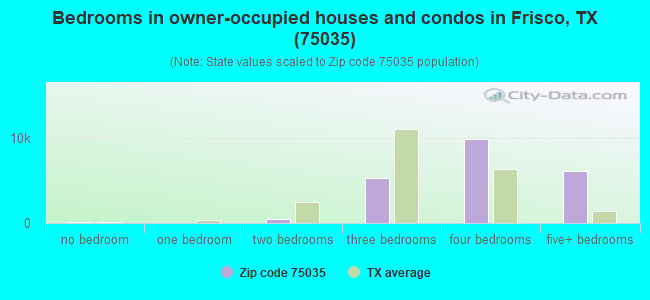
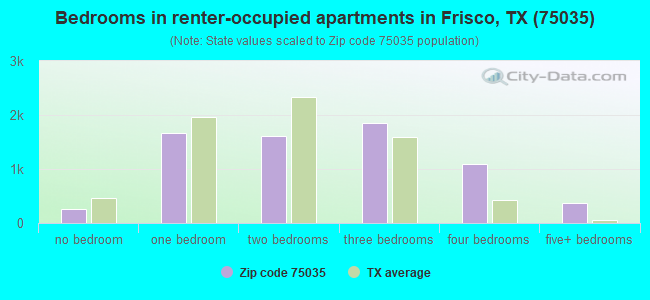
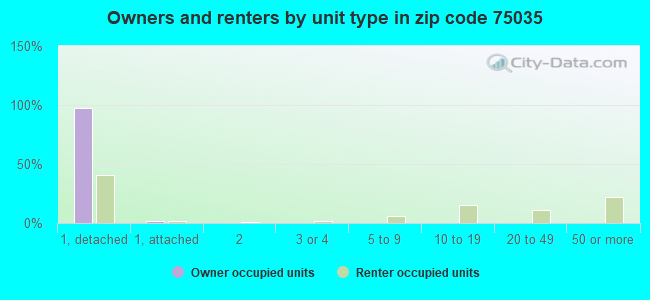
Houses and condos: 29,404 Renter-occupied apartments: 6,865
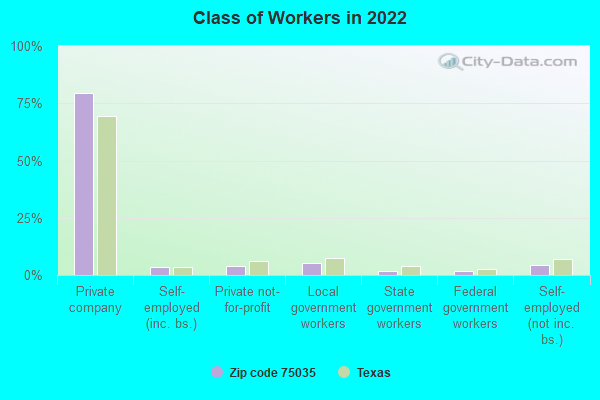
% of renters here:
24%
State:
38%
March 2022 cost of living index in zip code 75035: 97.0 (near average, U.S. average is 100)
Land area: 23.6 sq. mi. Water area: 0.1 sq. mi.
Population density: 3,646 people per square mile
(average).
OSM Map
General Map
Google Map
MSN Map
OSM Map
General Map
Google Map
MSN Map
OSM Map
General Map
Google Map
MSN Map
OSM Map
General Map
Google Map
MSN Map
Please wait while loading the map...
Real estate property taxes paid for housing units in 2022:
This zip code:
1.6% ($9,399)
Texas:
1.5% ($4,050)
Median real estate property taxes paid for housing units with mortgages in 2022: $9,681 (1.6%) Median real estate property taxes paid for housing units with no mortgage in 2022: $8,462 (1.5%)
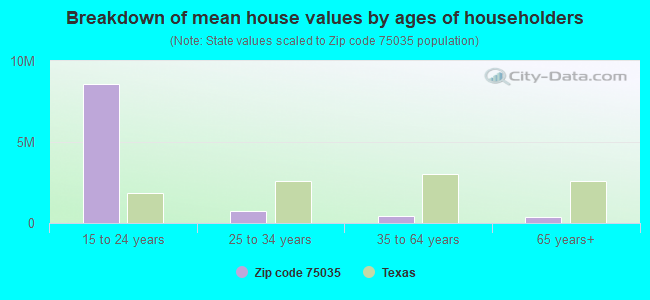
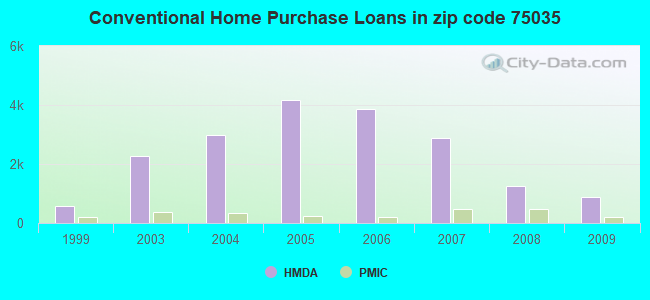
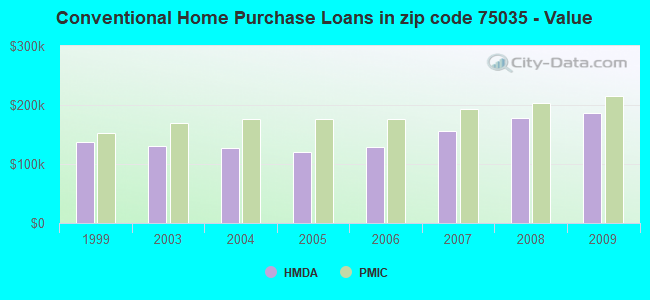
Estimated median house/condo value in 2022: $579,150
75035:
$579,150
Texas:
$275,400
According to our research of Texas and other state lists, there were 11 registered sex offenders living in 75035 zip code as of April 27, 2024. The ratio of all residents to sex offenders in zip code 75035 is 5,601 to 1. The ratio of registered sex offenders to all residents in this zip code is much lower than the state average.
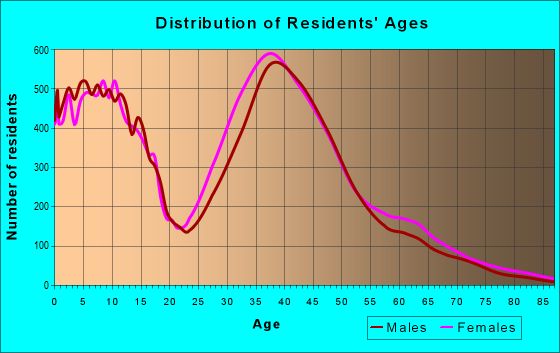
Median resident age:
This zip code:
38.2 years
Texas median age:
35.6 years
Average household size:
This zip code:
3.0 people
Texas:
2.6 people
Averages for the 2020 tax year for zip code 75035, filed in 2021:
Average Adjusted Gross Income (AGI) in 2020: $132,056 (Individual Income Tax Returns)
Here:
$132,056
State:
$77,054
Salary/wage: $120,808 (reported on 89.5% of returns)
Here:
$120,808
State:
$62,766
(% of AGI for various income ranges: 1120.2% for AGIs below $25k, 3622.7% for AGIs $25k-50k, 6895.2% for AGIs $50k-75k, 10206.8% for AGIs $75k-100k, 21159.5% for AGIs $100k-200k, 74216.5% for AGIs over 200k)
Taxable interest for individuals: $1,535 (reported on 38.5% of returns)
This zip code:
$1,535
Texas:
$2,665
(% of AGI for various income ranges: 17.8% for AGIs below $25k, 30.1% for AGIs $25k-50k, 39.4% for AGIs $50k-75k, 43.7% for AGIs $75k-100k, 85.1% for AGIs $100k-200k, 446.1% for AGIs over 200k)
Ordinary dividends: $3,444 (reported on 32.5% of returns)
Here:
$3,444
State:
$10,044
(% of AGI for various income ranges: 21.1% for AGIs below $25k, 37.6% for AGIs $25k-50k, 70.2% for AGIs $50k-75k, 90.4% for AGIs $75k-100k, 129.7% for AGIs $100k-200k, 967.2% for AGIs over 200k)
Net capital gain/loss in AGI: +$25,283 (reported on 33.6% of returns)
Here:
+$25,283
State:
+$39,590
(% of AGI for various income ranges: 19.1% for AGIs below $25k, 34.2% for AGIs $25k-50k, 93.6% for AGIs $50k-75k, 164.2% for AGIs $75k-100k, 474.0% for AGIs $100k-200k, 9966.7% for AGIs over 200k)
Profit/loss from business: +$12,780 (reported on 21.0% of returns)
Here:
+$12,780
State:
+$10,888
(% of AGI for various income ranges: 116.1% for AGIs below $25k, 191.8% for AGIs $25k-50k, 203.4% for AGIs $50k-75k, 290.9% for AGIs $75k-100k, 407.7% for AGIs $100k-200k, 1732.4% for AGIs over 200k)
Taxable individual retirement arrangement distribution: $25,280 (reported on 5.6% of returns)
75035:
$25,280
Texas:
$24,740
(% of AGI for various income ranges: 32.3% for AGIs below $25k, 97.2% for AGIs $25k-50k, 161.2% for AGIs $50k-75k, 261.4% for AGIs $75k-100k, 284.5% for AGIs $100k-200k, 684.0% for AGIs over 200k)
Self-employed (Keogh) retirement plans: $23,700 (reported on 0.8% of returns)
75035:
$23,700
Texas:
$29,298
(% of AGI for various income ranges: 17.2% for AGIs $50k-75k, 22.1% for AGIs $100k-200k, 181.8% for AGIs over 200k)
Total itemized deductions: $35,009 (reported on 16.7% of returns)
Here:
$35,009
State:
$40,428
(% of AGI for various income ranges: 43.0% for AGIs below $25k, 162.7% for AGIs $25k-50k, 372.9% for AGIs $50k-75k, 573.1% for AGIs $75k-100k, 1075.7% for AGIs $100k-200k, 4225.3% for AGIs over 200k)
Charity contributions: $11,789 (reported on 13.7% of returns)
Here:
$11,789
State:
$18,201
(% of AGI for various income ranges: 3.0% for AGIs below $25k, 20.7% for AGIs $25k-50k, 65.2% for AGIs $50k-75k, 112.9% for AGIs $75k-100k, 244.5% for AGIs $100k-200k, 1414.4% for AGIs over 200k)
Taxes paid: $8,910 (reported on 16.5% of returns)
75035:
$8,910
State:
$7,821
(% of AGI for various income ranges: 10.9% for AGIs below $25k, 39.1% for AGIs $25k-50k, 102.6% for AGIs $50k-75k, 163.8% for AGIs $75k-100k, 311.6% for AGIs $100k-200k, 949.9% for AGIs over 200k)
Earned income credit: $2,172 (reported on 6.7% of returns)
Here:
$2,172
State:
$2,584
(% of AGI for various income ranges: 57.0% for AGIs below $25k, 60.3% for AGIs $25k-50k, 1.0% for AGIs $50k-75k)
Percentage of individuals using paid preparers for their 2020 taxes: 93.4%
Here:
93%
State:
92%
(% for various income ranges: 92.1% for AGIs below $25k, 93.2% for AGIs $25k-50k, 92.6% for AGIs $50k-75k, 92.6% for AGIs $75k-100k, 93.7% for AGIs $100k-200k, 95.3% for AGIs over 200k)
Averages for the 2012 tax year for zip code 75035, filed in 2013:
Average Adjusted Gross Income (AGI) in 2012: $91,908 (Individual Income Tax Returns)
Here:
$91,908
State:
$65,384
Salary/wage: $85,953 (reported on 90.6% of returns)
Here:
$85,953
State:
$52,524
(% of AGI for various income ranges: 81.0% for AGIs below $25k, 84.2% for AGIs $25k-50k, 85.5% for AGIs $50k-75k, 89.6% for AGIs $75k-100k, 90.9% for AGIs $100k-200k, 72.0% for AGIs over 200k)
Taxable interest for individuals: $888 (reported on 37.4% of returns)
This zip code:
$888
Texas:
$2,372
(% of AGI for various income ranges: 0.9% for AGIs below $25k, 0.4% for AGIs $25k-50k, 0.4% for AGIs $50k-75k, 0.3% for AGIs $75k-100k, 0.2% for AGIs $100k-200k, 0.5% for AGIs over 200k)
Ordinary dividends: $2,396 (reported on 24.6% of returns)
Here:
$2,396
State:
$9,721
(% of AGI for various income ranges: 1.8% for AGIs below $25k, 0.9% for AGIs $25k-50k, 0.7% for AGIs $50k-75k, 0.4% for AGIs $75k-100k, 0.4% for AGIs $100k-200k, 0.9% for AGIs over 200k)
Net capital gain/loss in AGI: +$10,868 (reported on 21.7% of returns)
Here:
+$10,868
State:
+$35,319
(% of AGI for various income ranges: 0.2% for AGIs $25k-50k, 0.2% for AGIs $50k-75k, 0.3% for AGIs $75k-100k, 0.4% for AGIs $100k-200k, 9.1% for AGIs over 200k)
Profit/loss from business: +$14,142 (reported on 20.2% of returns)
Here:
+$14,142
State:
+$13,732
(% of AGI for various income ranges: 9.8% for AGIs below $25k, 5.3% for AGIs $25k-50k, 3.8% for AGIs $50k-75k, 3.1% for AGIs $75k-100k, 2.4% for AGIs $100k-200k, 2.9% for AGIs over 200k)
Taxable individual retirement arrangement distribution: $18,142 (reported on 7.4% of returns)
75035:
$18,142
Texas:
$19,511
(% of AGI for various income ranges: 3.2% for AGIs below $25k, 2.2% for AGIs $25k-50k, 1.9% for AGIs $50k-75k, 1.4% for AGIs $75k-100k, 1.3% for AGIs $100k-200k, 1.2% for AGIs over 200k)
Self-employment retirement plans: $12,862 (reported on 0.7% of returns)
75035:
$12,862
Texas:
$23,938
(% of AGI for various income ranges: 0.2% for AGIs $50k-75k, 0.2% for AGIs over 200k)
Total itemized deductions: $22,131 (17% of AGI, reported on 52.0% of returns)
Here:
$22,131
State:
$24,724
Here:
17.1% of AGI
State:
15.9% of AGI
(% of AGI for various income ranges: 13.9% for AGIs below $25k, 14.6% for AGIs $25k-50k, 15.8% for AGIs $50k-75k, 14.5% for AGIs $75k-100k, 12.6% for AGIs $100k-200k, 9.7% for AGIs over 200k)
Charity contributions: $4,104 (reported on 43.4% of returns)
Here:
$4,104
State:
$6,808
(% of AGI for various income ranges: 0.9% for AGIs below $25k, 1.6% for AGIs $25k-50k, 1.9% for AGIs $50k-75k, 2.0% for AGIs $75k-100k, 2.0% for AGIs $100k-200k, 1.9% for AGIs over 200k)
Taxes paid: $6,861 (reported on 51.4% of returns)
75035:
$6,861
State:
$6,921
(% of AGI for various income ranges: 3.5% for AGIs below $25k, 4.0% for AGIs $25k-50k, 4.4% for AGIs $50k-75k, 4.5% for AGIs $75k-100k, 4.1% for AGIs $100k-200k, 2.9% for AGIs over 200k)
Earned income credit: $2,057 (reported on 7.9% of returns)
Here:
$2,057
State:
$2,570
(% of AGI for various income ranges: 4.9% for AGIs below $25k, 0.8% for AGIs $25k-50k)
Percentage of individuals using paid preparers for their 2012 taxes: 41.3%
Here:
41%
State:
51%
(% for various income ranges: 37.9% for AGIs below $25k, 41.1% for AGIs $25k-50k, 39.8% for AGIs $50k-75k, 40.6% for AGIs $75k-100k, 41.5% for AGIs $100k-200k, 55.8% for AGIs over 200k)
Averages for the 2004 tax year for zip code 75035, filed in 2005:
Average Adjusted Gross Income (AGI) in 2004: $73,033 (Individual Income Tax Returns)
Here:
$73,033
State:
$47,881
Salary/wage: $71,444 (reported on 93.0% of returns)
Here:
$71,444
State:
$41,947
(% of AGI for various income ranges: 288.1% for AGIs below $10k, 82.6% for AGIs $10k-25k, 90.7% for AGIs $25k-50k, 91.5% for AGIs $50k-75k, 92.9% for AGIs $75k-100k, 89.6% for AGIs over 100k)
Taxable interest for individuals: $793 (reported on 48.7% of returns)
This zip code:
$793
Texas:
$2,255
(% of AGI for various income ranges: 10.1% for AGIs below $10k, 1.8% for AGIs $10k-25k, 0.8% for AGIs $25k-50k, 0.5% for AGIs $50k-75k, 0.4% for AGIs $75k-100k, 0.5% for AGIs over 100k)
Taxable dividends: $1,201 (reported on 27.7% of returns)
Here:
$1,201
State:
$4,261
(% of AGI for various income ranges: 7.9% for AGIs below $10k, 0.9% for AGIs $10k-25k, 0.6% for AGIs $25k-50k, 0.4% for AGIs $50k-75k, 0.4% for AGIs $75k-100k, 0.4% for AGIs over 100k)
Net capital gain/loss: +$3,514 (reported on 25.4% of returns)
Here:
+$3,514
State:
+$16,110
(% of AGI for various income ranges: -8.3% for AGIs below $10k, -0.4% for AGIs $10k-25k, -0.1% for AGIs $25k-50k, 0.4% for AGIs $50k-75k, 0.4% for AGIs $75k-100k, 2.2% for AGIs over 100k)
Profit/loss from business: +$9,830 (reported on 20.5% of returns)
Here:
+$9,830
State:
+$11,013
(% of AGI for various income ranges: 8.7% for AGIs below $10k, 6.5% for AGIs $10k-25k, 3.8% for AGIs $25k-50k, 2.3% for AGIs $50k-75k, 2.2% for AGIs $75k-100k, 2.7% for AGIs over 100k)
IRA payment deduction: $2,968 (reported on 2.8% of returns)
75035:
$2,968
Texas:
$3,120
(% of AGI for various income ranges: 0.2% for AGIs $10k-25k, 0.2% for AGIs $25k-50k, 0.2% for AGIs $50k-75k, 0.1% for AGIs $75k-100k, 0.1% for AGIs over 100k)
Self-employed pension: $11,982 (reported on 0.8% of returns)
Here:
$11,982
Texas:
$16,401
(% of AGI for various income ranges: 0.0% for AGIs $25k-50k, 0.1% for AGIs $50k-75k, 0.1% for AGIs $75k-100k, 0.2% for AGIs over 100k)
Total itemized deductions: $18,768 (20% of AGI, reported on 62.5% of returns)
Here:
$18,768
State:
$19,631
Here:
19.7% of AGI
State:
18.9% of AGI
(% of AGI for various income ranges: 58.6% for AGIs below $10k, 16.3% for AGIs $10k-25k, 18.9% for AGIs $25k-50k, 18.5% for AGIs $50k-75k, 17.6% for AGIs $75k-100k, 13.9% for AGIs over 100k)
Charity contributions deductions: $3,079 (3% of AGI, reported on 54.0% of returns)
Here:
$3,079
State:
$4,753
Here:
3.1% of AGI
State:
4.2% of AGI
(% of AGI for various income ranges: 3.1% for AGIs below $10k, 1.3% for AGIs $10k-25k, 2.1% for AGIs $25k-50k, 2.2% for AGIs $50k-75k, 2.2% for AGIs $75k-100k, 2.4% for AGIs over 100k)
Total tax: $10,706 (reported on 87.8% of returns)
75035:
$10,706
State:
$9,058
(% of AGI for various income ranges: 10.1% for AGIs below $10k, 4.9% for AGIs $10k-25k, 7.4% for AGIs $25k-50k, 9.5% for AGIs $50k-75k, 10.4% for AGIs $75k-100k, 16.4% for AGIs over 100k)
Earned income credit: $1,561 (reported on 5.9% of returns)
Here:
$1,561
State:
$2,024
Percentage of individuals using paid preparers for their 2004 taxes: 42.2%
Here:
42%
State:
57%
(% for various income ranges: 36.0% for AGIs below $10k, 48.9% for AGIs $10k-25k, 43.2% for AGIs $25k-50k, 40.4% for AGIs $50k-75k, 39.1% for AGIs $75k-100k, 44.8% for AGIs over 100k)
Likely homosexual households (counted as self-reported same-sex unmarried-partner households)
Lesbian couples: 0.1% of all households
Gay men: 0.1% of all households
Household received Food Stamps/SNAP in the past 12 months: 309 Household did not receive Food Stamps/SNAP in the past 12 months: 27,994
Women who had a birth in the past 12 months: 1,237 (1,213 now married, 44 unmarried) Women who did not have a birth in the past 12 months: 22,686 (13,543 now married, 9,030 unmarried)
Housing units in zip code 75035 with a mortgage: 16,282 (1,212 second mortgage, 852 both second mortgage and home equity loan) Houses without a mortgage: 147
Median monthly owner costs for units with a mortgage: $3,000 Median monthly owner costs for units without a mortgage: $1,232
Residents with income below the poverty level in 2022:
This zip code:
3.1%
Whole state:
14.0%
Residents with income below 50% of the poverty level in 2022:
This zip code:
1.2%
Whole state:
7.4%
Median number of rooms in houses and condos:
Here:
8.0
State:
6.3
Median number of rooms in apartments:
Here:
4.8
State:
4.0
Notable locations in this zip code not listed on our city pages
21,671 married couples with children.
2,880 single-parent households (608 men, 2,272 women).
59.8% of residents of 75035 zip code speak English at home.
8.2% of residents speak Spanish at home (71% very well, 19% well, 7% not well, 2% not at all).
12.6% of residents speak other Indo-European language at home (83% very well, 13% well, 3% not well, 1% not at all).
19.2% of residents speak Asian or Pacific Island language at home (78% very well, 17% well, 5% not well, 1% not at all).
1.6% of residents speak other language at home (87% very well, 10% well, 3% not well).
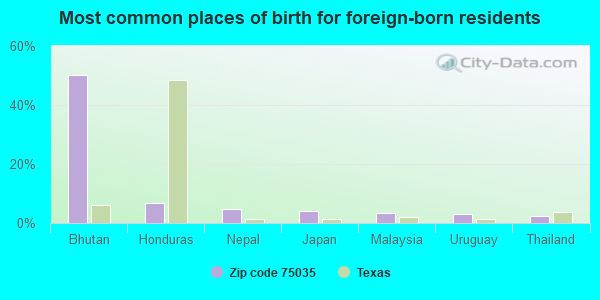
Foreign born population: 28,405 (33.0%) (55.5% of them are naturalized citizens)
This zip code:
33.0%
Whole state:
17.2%
50%Bhutan
7%Honduras
5%Nepal
4%Japan
3%Malaysia
3%Uruguay
2%Thailand
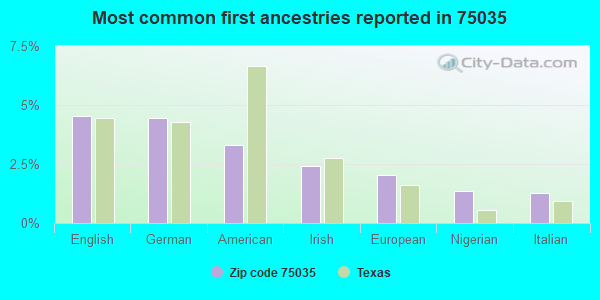
5%English
4%German
3%American
2%Irish
2%European
1%Nigerian
1%Italian
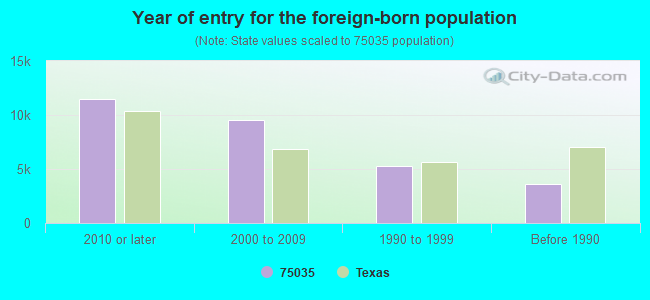
Year of entry for the foreign-born population
11,5252010 or later
9,5412000 to 2009
5,2381990 to 1999
3,584Before 1990
Facilities with environmental interests located in this zip code:
ADELLE R CLARK MIDDLE SCHOOL (4600 COLBY DR in FRISCO, TX)
(National Center for Education Statistics) - STATE ID-043905043 Organizations: FRISCO ISD (SCHOOL DISTRICT)
Housing units lacking complete plumbing facilities: 0.2% Housing units lacking complete kitchen facilities: 1.1%
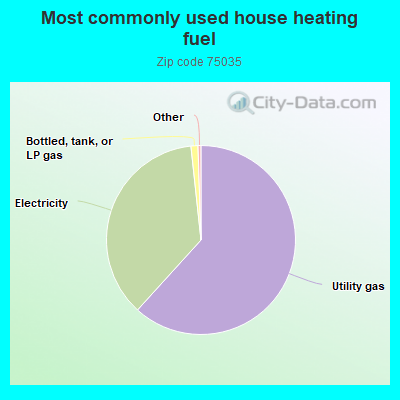
61.8%Utility gas
36.6%Electricity
1.2%Bottled, tank, or LP gas
Place of birth for U.S.-born residents:
This state: 28,455
Northeast: 4,328
Midwest: 8,599
South: 9,380
West: 6,587
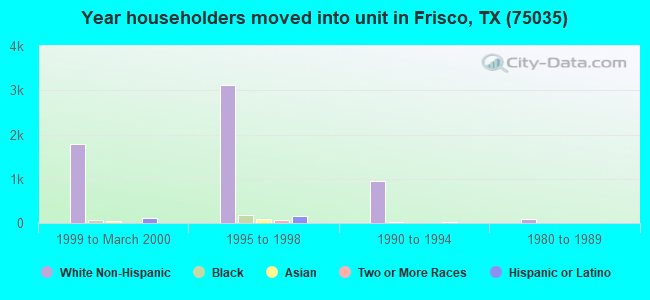
23% of the 75035 zip code residents lived in the same house 5 years ago. Out of people who lived in different houses, 25% lived in this county. Out of people who lived in different counties, 50% lived in Texas.
83% of the 75035 zip code residents lived in the same house 1 year ago. Out of people who lived in different houses, 40% moved from this county. Out of people who lived in different houses, 28% moved from different county within same state. Out of people who lived in different houses, 26% moved from different state. Out of people who lived in different houses, 7% moved from abroad.
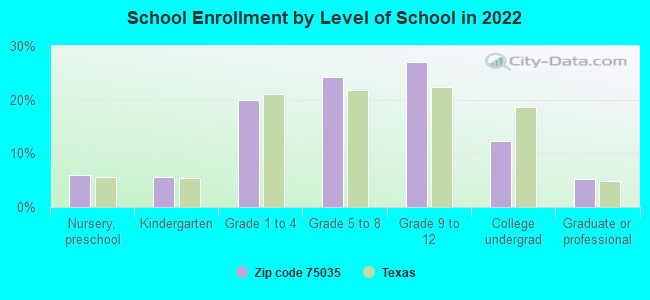
Private vs. public school enrollment:
Students in private schools in grades 1 to 8 (elementary and middle school): 597
Here:
5.1%
Texas:
8.8%
Students in private schools in grades 9 to 12 (high school): 406
Here:
5.6%
Texas:
8.0%
Students in private undergraduate colleges: 223
Here:
6.8%
Texas:
16.2%
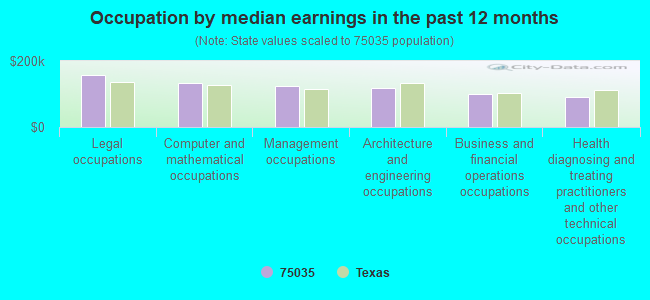
Occupation by median earnings in the past 12 months ($)
157,805Legal occupations
134,144Computer and mathematical occupations
124,423Management occupations
117,167Architecture and engineering occupations
100,176Business and financial operations occupations
91,843Health diagnosing and treating practitioners and other technical occupations
Companies with federal contracts located in this zip code (FRISCO, TX):
HAYS CONSTRUCTION INC (9601 SHELBY PLACE; small business) : $2,794,604 in 16 contractsfrom 2001 to 2004
Contracts for Construction of Structures and Facilities -- Other Non-Building Facilities by U.S. Army Corps of Engineers - civil program financing only, Army Signed by year:2000: $0; 2001: $500,002; 2002: $1,657,136; 2003: $634,046; 2004: $3,420; 2005: $0; 2006: $0.
Biggest contracts:
$921,190 with U.S. Army Corps of Engineers - civil program financing only for Construction of Structures and Facilities -- Other Non-Building Facilities. Taking place in TN. Signed on 2002-03-19. Completion date: 2002-12-31.
$500,002, same as above.Signed on 2001-06-28. Completion date: 2002-12-31.
$450,000, same as above.Signed on 2002-01-25. Completion date: 2002-12-31.
$410,000, same as above.Signed on 2003-07-31. Completion date: 2002-12-31.
A-NEUTRONICS, INC (12007 PEACHTREE LN; small business) 50 employees, $0 revenue. : $132,723 in 4 contractsfrom 2003 to 2005
$79,936 with Air Force for Miscellaneous Communication Equipment. Signed on 2003-09-10. Completion date: 2003-10-10.
$30,250 with Air Force for Maintenance, Repair and Rebuilding of Equipment -- Automatic Data Processing Equipment (Including Firmware), Software, Supplies and Support Equipment. Taking place in LA. Signed on 2003-09-10. Completion date: 2003-12-01.
$14,692 with Air Force for Other ADP and Telecommunications Services (includes data storage on tapes, compact disks, etc.). Taking place in OK. Signed on 2005-04-08. Completion date: 2005-05-12.
$7,845 with Air Force for Maintenance, Repair and Rebuilding of Equipment -- Automatic Data Processing Equipment (Including Firmware), Software, Supplies and Support Equipment. Taking place in LA. Signed on 2004-06-03. Completion date: 2004-08-15.
ON POWER SYSTEMS, INC (11415 JEREME TRAIL; small business)
$5,280 with Navy for Medical and Surgical Instruments, Equipment, and Supplies. Taking place in VA. Signed on 2004-02-05. Completion date: 2004-02-20.
IT PARTSHOUSE (10400 VINTAGE DR; small business)
$5,250 with Air Force for Automated Information System Design and Integration Services. Signed on 2002-09-30. Completion date: 2003-09-30.
Top industries in this zip code by the number of employees in 2005:
2002 - 2018 National Fire Incident Reporting System (NFIRS) incidents
Based on the data from the years 2002 - 2018 the average number of fire incidents per year is 47. The highest number of fire incidents - 85 took place in 2014, and the least - 12 in 2003. The data has an increasing trend.
When looking into fire subcategories, the most reports belonged to: Outside Fires (48.4%), and Structure Fires (26.2%).
Fire incident types reported to NFIRS in Zip Code 75035
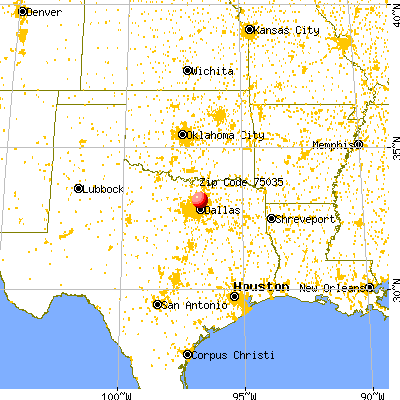


 Nearest zip codes: 75034, 75078, 75024, 75025, 75070, 75013.
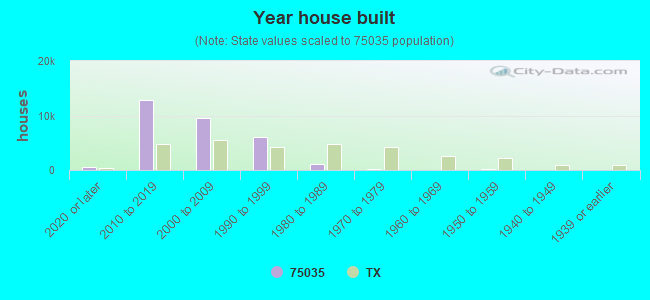


 Based on the data from the years 2002 - 2018 the average number of fire incidents per year is 47. The highest number of fire incidents - 85 took place in 2014, and the least - 12 in 2003. The data has an increasing trend.
 When looking into fire subcategories, the most reports belonged to: Outside Fires (48.4%), and Structure Fires (26.2%).