Crime rate in Montgomery, Alabama (AL): murders, rapes, robberies, assaults, burglaries, thefts, auto thefts, arson, law enforcement employees, police officers, crime map
Crime rate in Montgomery, AL
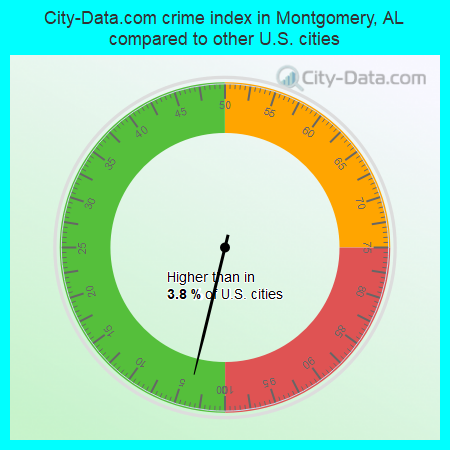
The 2022 crime rate in Montgomery, AL is 1 (City-Data.com crime index), which is 169.8 times lower than the U.S. average. It was higher than in 3.8% U.S. cities. The 2022 Montgomery crime rate rose by 37% compared to 2021. In the last 5 years Montgomery has seen decline of violent crime and decline of property crime.See how dangerous Montgomery, AL is compared to the nearest cities:
(Note: Higher means more crime)
(Note: Higher means more crime)
| Montgomery: | 1.4 |
| Coosada: | 60.3 |
| Millbrook: | 173.4 |
| Prattville: | 194.1 |
| Wetumpka: | 214.8 |
| Hayneville: | 346.2 |
| Autaugaville: | 44.5 |
| Eclectic: | 173.4 |
| White Hall: | 44.8 |

The City-Data.com crime index weighs serious crimes and violent crimes more heavily. Higher means more crime, U.S. average is 246.1. It adjusts for the number of visitors and daily workers commuting into cities.
- means the value is smaller than the state average.- means the value is about the same as the state average.
- means the value is bigger than the state average.
- means the value is much bigger than the state average.
According to our research of Alabama and other state lists, there were 434 registered sex offenders living in Montgomery, Alabama as of April 27, 2024.
The ratio of all residents to sex offenders in Montgomery is 467 to 1.
The ratio of registered sex offenders to all residents in this city is near the state average.
Violent crime rate in 2022
| Montgomery: | 3.3 |
| U.S. Average: | 219.8 |
Violent crime rate in 2021
| Montgomery: | 2.0 |
| U.S. Average: | 224.8 |
Violent crime rate in 2020
| Montgomery: | 147.9 |
| U.S. Average: | 228.2 |
Violent crime rate in 2018
| Montgomery: | 337.8 |
| U.S. Average: | 221.2 |
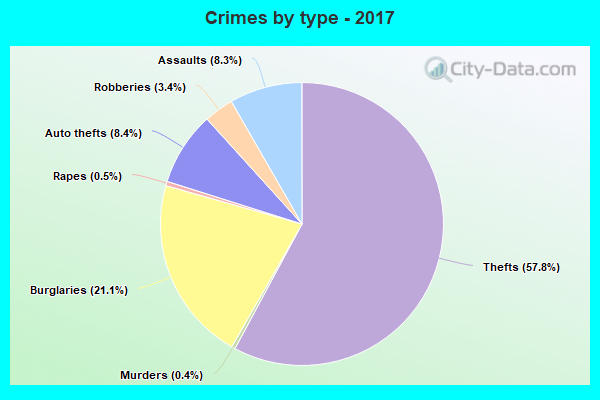
Violent crime rate in 2017
| Montgomery: | 362.4 |
| U.S. Average: | 226.2 |
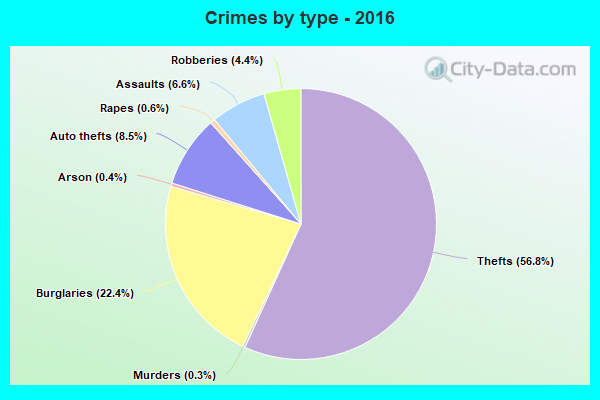
Violent crime rate in 2016
| Montgomery: | 342.5 |
| U.S. Average: | 227.3 |
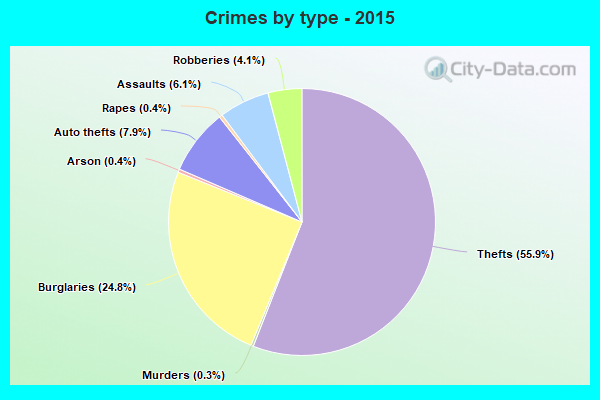
Violent crime rate in 2015
| Montgomery: | 296.5 |
| U.S. Average: | 219.3 |
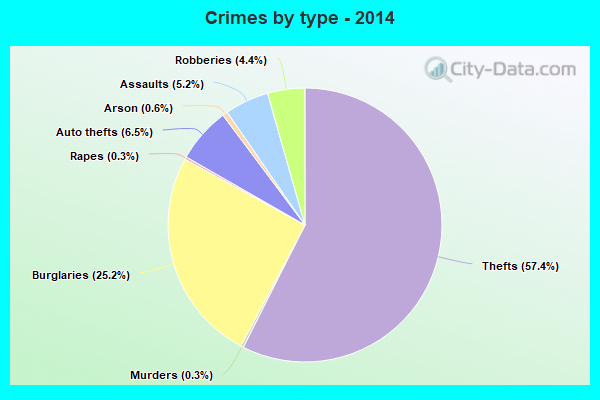
Violent crime rate in 2014
| Montgomery: | 296.2 |
| U.S. Average: | 211.1 |
Violent crime rate in 2013
| Montgomery: | 214.5 |
| U.S. Average: | 214.2 |
Violent crime rate in 2012
| Montgomery: | 239.2 |
| U.S. Average: | 187.4 |
Violent crime rate in 2011
| Montgomery: | 202.7 |
| U.S. Average: | 187.1 |
Violent crime rate in 2010
| Montgomery: | 225.3 |
| U.S. Average: | 195.7 |
Violent crime rate in 2009
| Montgomery: | 258.6 |
| U.S. Average: | 208.9 |
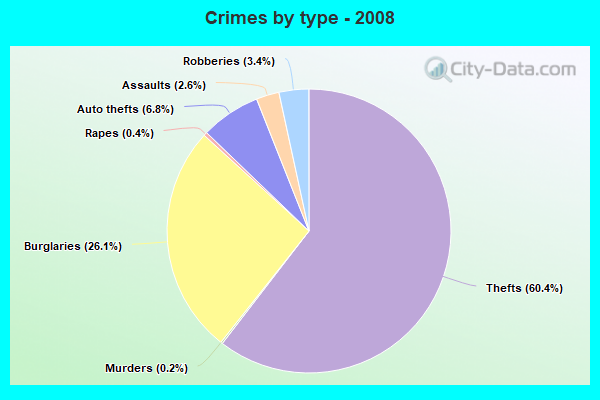
Violent crime rate in 2008
| Montgomery: | 244.9 |
| U.S. Average: | 222.5 |
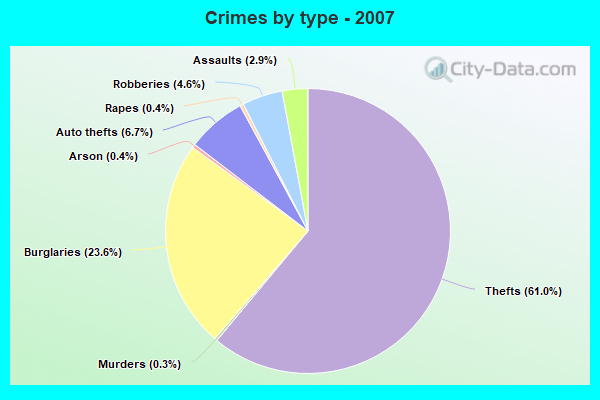
Violent crime rate in 2007
| Montgomery: | 290.7 |
| U.S. Average: | 229.1 |
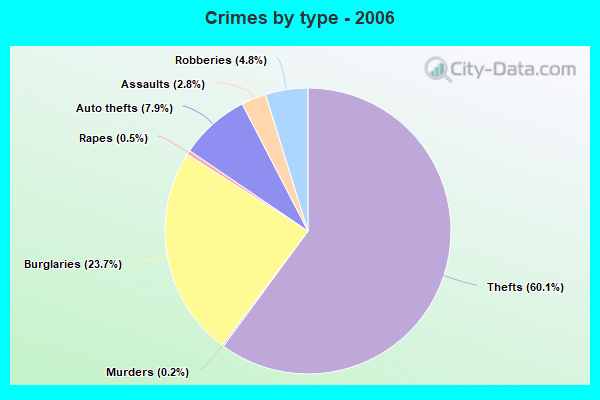
Violent crime rate in 2006
| Montgomery: | 288.8 |
| U.S. Average: | 232.6 |
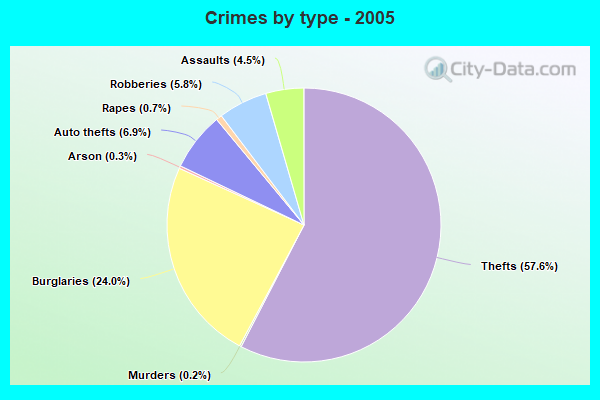
Violent crime rate in 2005
| Montgomery: | 395.6 |
| U.S. Average: | 227.0 |
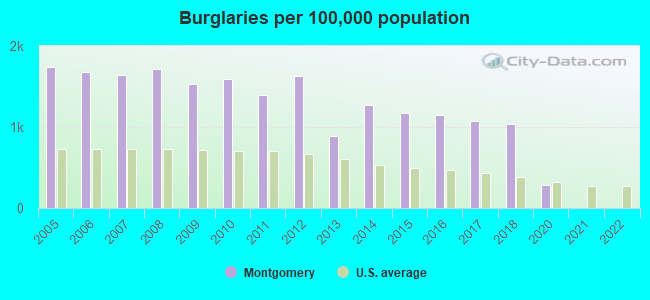
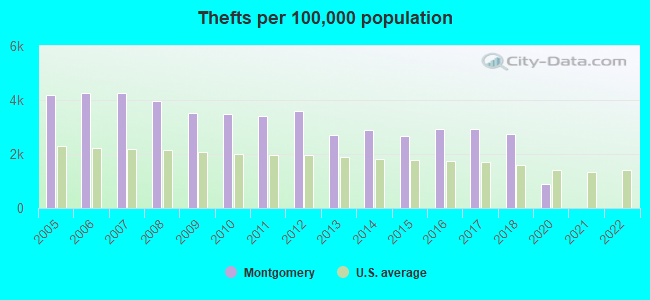
Property crime rate in 2022
| Montgomery: | 0.1 |
| U.S. Average: | 166.5 |
Property crime rate in 2021
| Montgomery: | 0.5 |
| U.S. Average: | 157.8 |
Property crime rate in 2020
| Montgomery: | 124.5 |
| U.S. Average: | 169.6 |
Property crime rate in 2018
| Montgomery: | 417.3 |
| U.S. Average: | 190.2 |
Property crime rate in 2017
| Montgomery: | 423.8 |
| U.S. Average: | 206.4 |
Property crime rate in 2016
| Montgomery: | 441.3 |
| U.S. Average: | 216.6 |
Property crime rate in 2015
| Montgomery: | 423.6 |
| U.S. Average: | 221.5 |
Property crime rate in 2014
| Montgomery: | 449.3 |
| U.S. Average: | 230.8 |
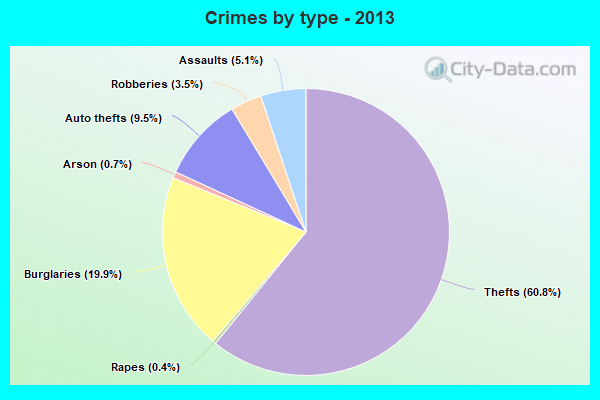
Property crime rate in 2013
| Montgomery: | 377.2 |
| U.S. Average: | 250.4 |
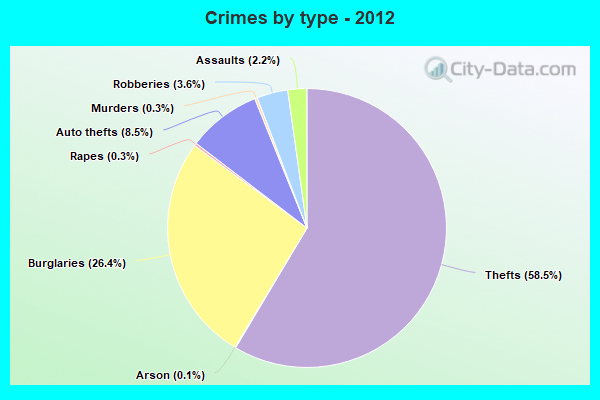
Property crime rate in 2012
| Montgomery: | 585.8 |
| U.S. Average: | 267.3 |
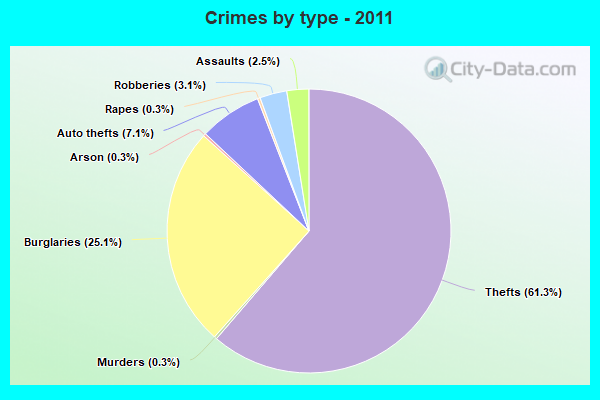
Property crime rate in 2011
| Montgomery: | 508.6 |
| U.S. Average: | 273.5 |
Property crime rate in 2010
| Montgomery: | 550.6 |
| U.S. Average: | 276.4 |
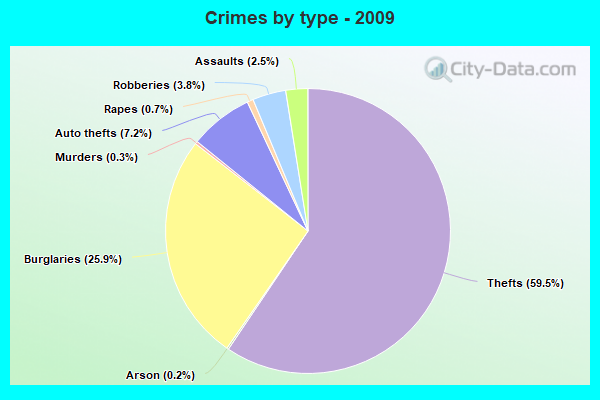
Property crime rate in 2009
| Montgomery: | 543.9 |
| U.S. Average: | 285.6 |
Property crime rate in 2008
| Montgomery: | 609.4 |
| U.S. Average: | 302.2 |
Property crime rate in 2007
| Montgomery: | 532.1 |
| U.S. Average: | 309.2 |
Property crime rate in 2006
| Montgomery: | 549.5 |
| U.S. Average: | 317.3 |
Property crime rate in 2005
| Montgomery: | 551.8 |
| U.S. Average: | 322.3 |

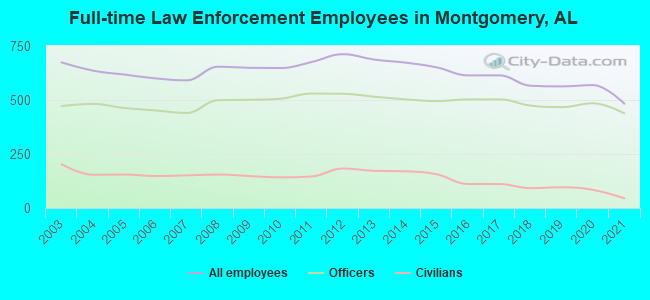
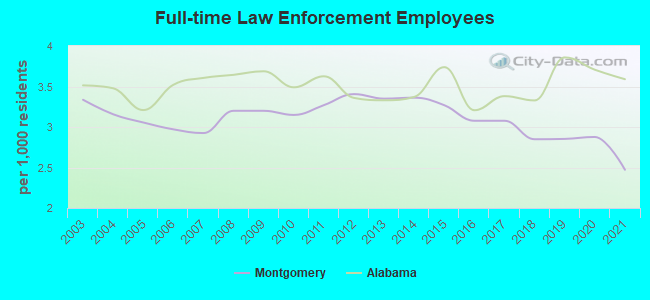
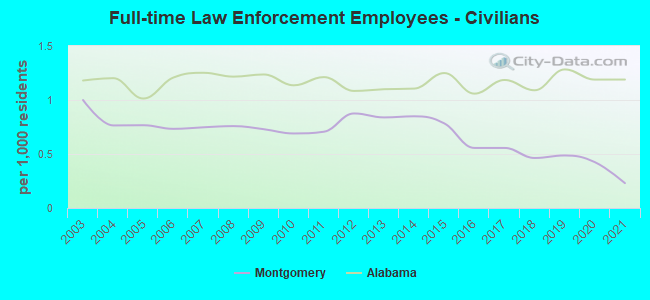
Full-time law enforcement employees in 2021, including police officers: 483 (438 officers - 334 male; 104 female).
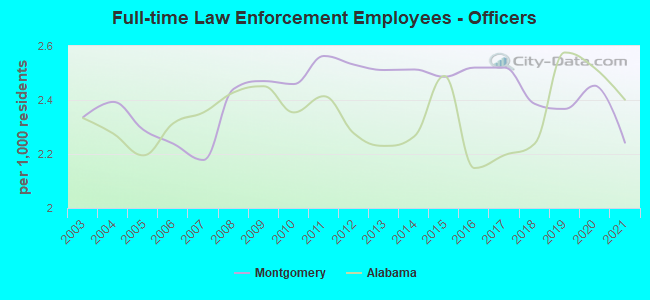
| Officers per 1,000 residents here: | 2.24 |
| Alabama average: | 2.40 |
Full-time law enforcement employees in 2020, including police officers: 569 (485 officers - 367 male; 118 female).
| Officers per 1,000 residents here: | 2.45 |
| Alabama average: | 2.52 |
Full-time law enforcement employees in 2019, including police officers: 563 (467 officers - 364 male; 103 female).
| Officers per 1,000 residents here: | 2.37 |
| Alabama average: | 2.58 |
Full-time law enforcement employees in 2018, including police officers: 566 (474 officers - 380 male; 94 female).
| Officers per 1,000 residents here: | 2.39 |
| Alabama average: | 2.24 |
Full-time law enforcement employees in 2016, including police officers: 614 (503 officers - 421 male; 82 female).
| Officers per 1,000 residents here: | 2.52 |
| Alabama average: | 2.15 |
Full-time law enforcement employees in 2015, including police officers: 651 (495 officers - 423 male; 72 female).
| Officers per 1,000 residents here: | 2.49 |
| Alabama average: | 2.49 |
Full-time law enforcement employees in 2014, including police officers: 673 (503 officers - 429 male; 74 female).
| Officers per 1,000 residents here: | 2.51 |
| Alabama average: | 2.27 |
Full-time law enforcement employees in 2013, including police officers: 687 (515 officers - 442 male; 73 female).
| Officers per 1,000 residents here: | 2.51 |
| Alabama average: | 2.23 |
Full-time law enforcement employees in 2012, including police officers: 712 (529 officers - 455 male; 74 female).
| Officers per 1,000 residents here: | 2.53 |
| Alabama average: | 2.28 |
Full-time law enforcement employees in 2011, including police officers: 676 (530 officers - 461 male; 69 female).
| Officers per 1,000 residents here: | 2.56 |
| Alabama average: | 2.41 |
Full-time law enforcement employees in 2010, including police officers: 648 (506 officers - 439 male; 67 female).
| Officers per 1,000 residents here: | 2.46 |
| Alabama average: | 2.35 |
Full-time law enforcement employees in 2009, including police officers: 649 (501 officers - 434 male; 67 female).
| Officers per 1,000 residents here: | 2.47 |
| Alabama average: | 2.45 |
Full-time law enforcement employees in 2008, including police officers: 654 (499 officers - 432 male; 67 female).
| Officers per 1,000 residents here: | 2.44 |
| Alabama average: | 2.43 |
Full-time law enforcement employees in 2007, including police officers: 591 (440 officers - 387 male; 53 female).
| Officers per 1,000 residents here: | 2.18 |
| Alabama average: | 2.35 |
Full-time law enforcement employees in 2006, including police officers: 600 (452 officers - 395 male; 57 female).
| Officers per 1,000 residents here: | 2.24 |
| Alabama average: | 2.31 |
Full-time law enforcement employees in 2005, including police officers: 618 (463 officers - 405 male; 58 female).
| Officers per 1,000 residents here: | 2.29 |
| Alabama average: | 2.20 |
Full-time law enforcement employees in 2004, including police officers: 636 (482 officers - 419 male; 63 female).
| Officers per 1,000 residents here: | 2.39 |
| Alabama average: | 2.28 |
Full-time law enforcement employees in 2003, including police officers: 674 (472 officers - 414 male; 58 female).
| Officers per 1,000 residents here: | 2.34 |
| Alabama average: | 2.33 |

Zip codes: 36043, 36064, 36104, 36105, 36106, 36107, 36108, 36109, 36110, 36111, 36112, 36113, 36115, 36116, 36117.