Crime rate in Tallahassee, Florida (FL): murders, rapes, robberies, assaults, burglaries, thefts, auto thefts, arson, law enforcement employees, police officers, crime map
Crime rate in Tallahassee, FL
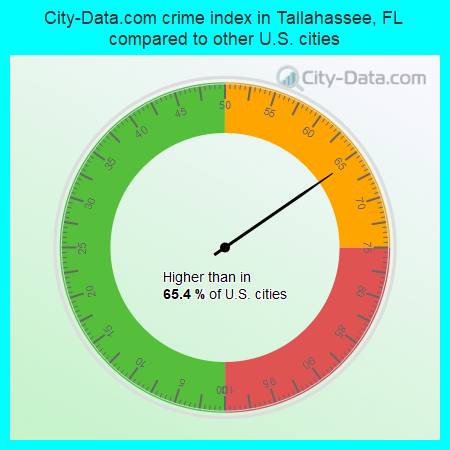
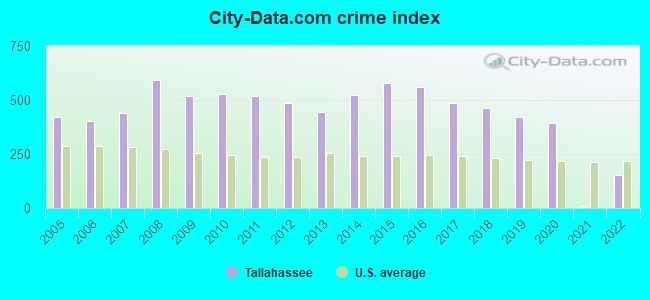
The 2022 crime rate in Tallahassee, FL is 155 (City-Data.com crime index), which is 1.6 times smaller than the U.S. average. It was higher than in 65.4% U.S. cities. The 2022 Tallahassee crime rate rose by 2978% compared to 2021. In the last 5 years Tallahassee has seen decreasing violent crime and decline of property crime.See how dangerous Tallahassee, FL is compared to the nearest cities:
(Note: Higher means more crime)
(Note: Higher means more crime)
| Tallahassee: | 154.6 |
| Midway: | 53.1 |
| Havana: | 222.8 |
| Quincy: | 526.9 |
| Attapulgus: | 28.0 |
| Monticello: | 335.4 |
| Gretna: | 295.8 |
| Cairo: | 223.6 |
| Whigham: | 107.5 |
The City-Data.com crime index weighs serious crimes and violent crimes more heavily. Higher means more crime, U.S. average is 246.1. It adjusts for the number of visitors and daily workers commuting into cities.
- means the value is smaller than the state average.- means the value is about the same as the state average.
- means the value is bigger than the state average.
- means the value is much bigger than the state average.
According to our research of Florida and other state lists, there were 799 registered sex offenders living in Tallahassee, Florida as of April 27, 2024.
The ratio of all residents to sex offenders in Tallahassee is 239 to 1.
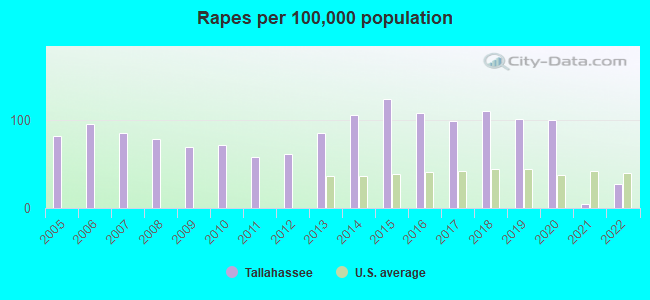
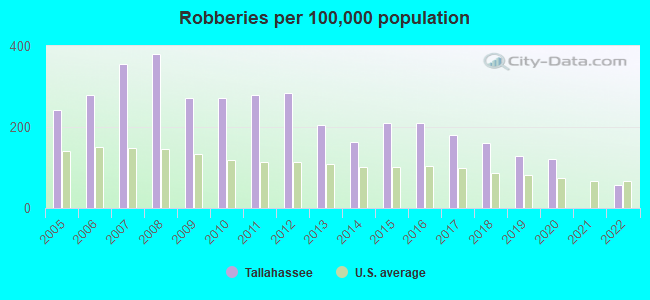
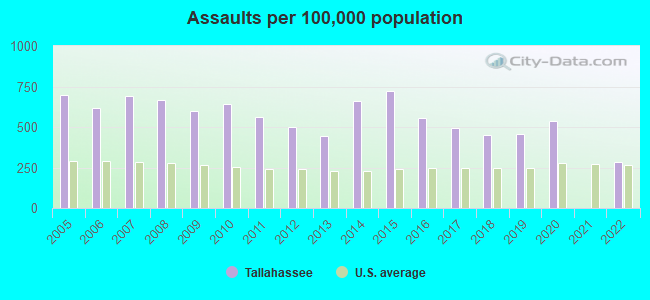
Violent crime rate in 2022
| Tallahassee: | 208.2 |
| U.S. Average: | 219.8 |
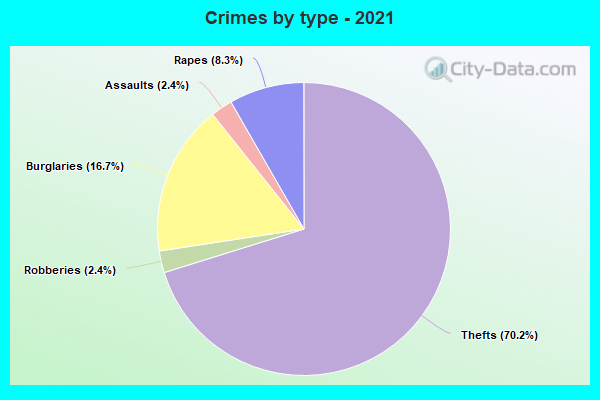
Violent crime rate in 2021
| Tallahassee: | 4.5 |
| U.S. Average: | 224.8 |
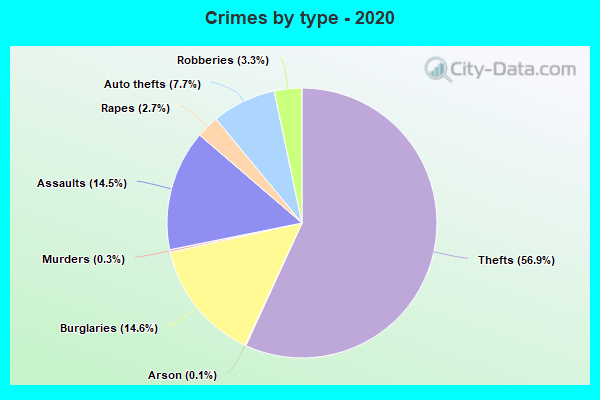
Violent crime rate in 2020
| Tallahassee: | 455.1 |
| U.S. Average: | 228.2 |
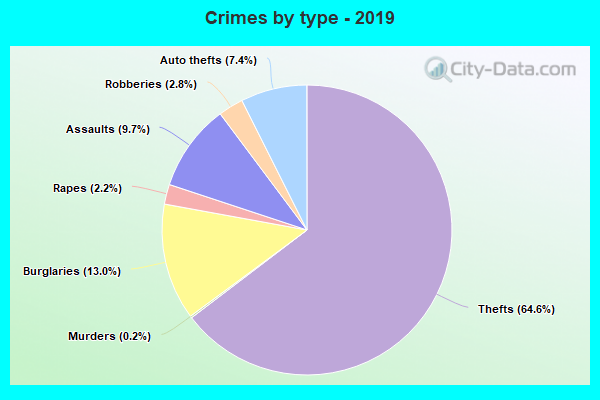
Violent crime rate in 2019
| Tallahassee: | 414.1 |
| U.S. Average: | 219.9 |
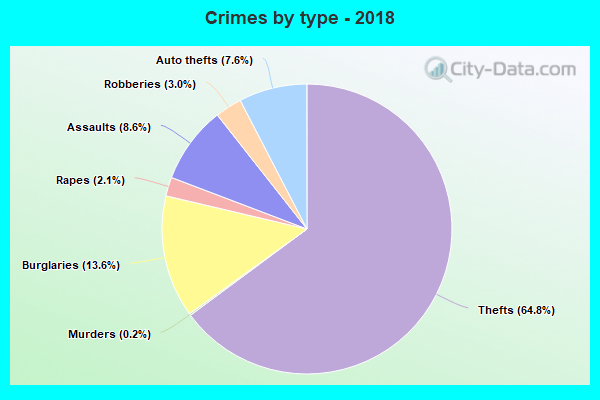
Violent crime rate in 2018
| Tallahassee: | 432.6 |
| U.S. Average: | 221.2 |
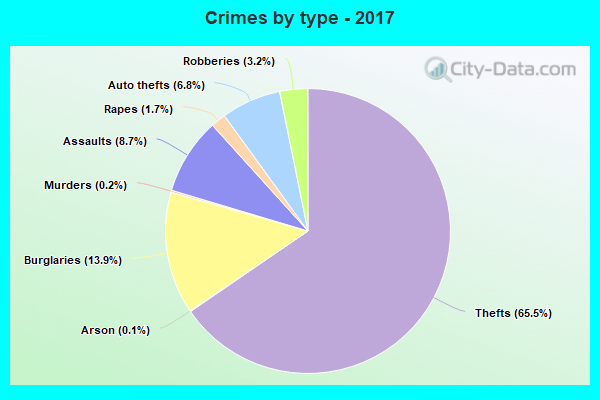
Violent crime rate in 2017
| Tallahassee: | 453.1 |
| U.S. Average: | 226.2 |
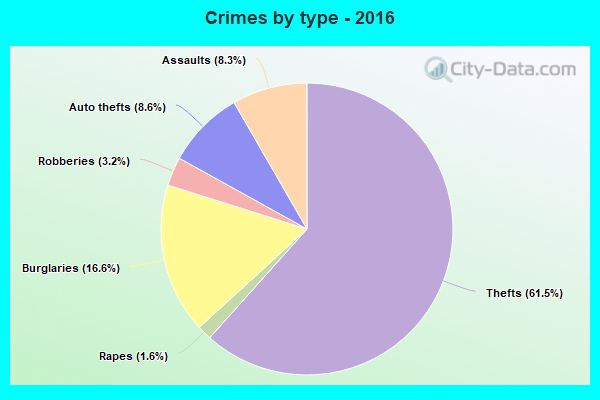
Violent crime rate in 2016
| Tallahassee: | 502.7 |
| U.S. Average: | 227.3 |
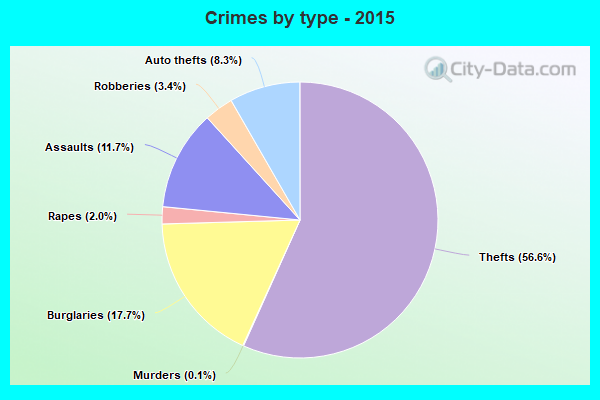
Violent crime rate in 2015
| Tallahassee: | 606.7 |
| U.S. Average: | 219.3 |
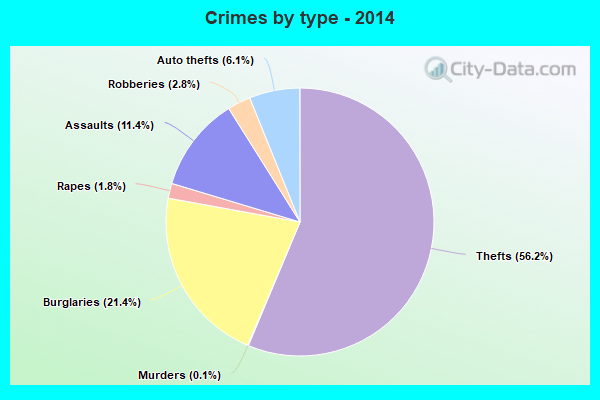
Violent crime rate in 2014
| Tallahassee: | 532.6 |
| U.S. Average: | 211.1 |
Violent crime rate in 2013
| Tallahassee: | 421.5 |
| U.S. Average: | 214.2 |
Violent crime rate in 2012
| Tallahassee: | 467.2 |
| U.S. Average: | 187.4 |
Violent crime rate in 2011
| Tallahassee: | 489.0 |
| U.S. Average: | 187.1 |
Violent crime rate in 2010
| Tallahassee: | 543.3 |
| U.S. Average: | 195.7 |
Violent crime rate in 2009
| Tallahassee: | 512.4 |
| U.S. Average: | 208.9 |
Violent crime rate in 2008
| Tallahassee: | 611.0 |
| U.S. Average: | 222.5 |
Violent crime rate in 2007
| Tallahassee: | 454.0 |
| U.S. Average: | 229.1 |
Violent crime rate in 2006
| Tallahassee: | 412.9 |
| U.S. Average: | 232.6 |
Violent crime rate in 2005
| Tallahassee: | 416.7 |
| U.S. Average: | 227.0 |
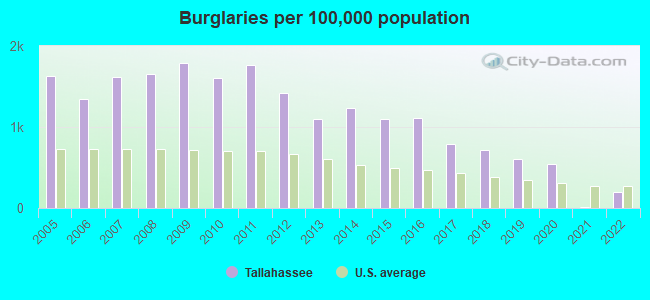
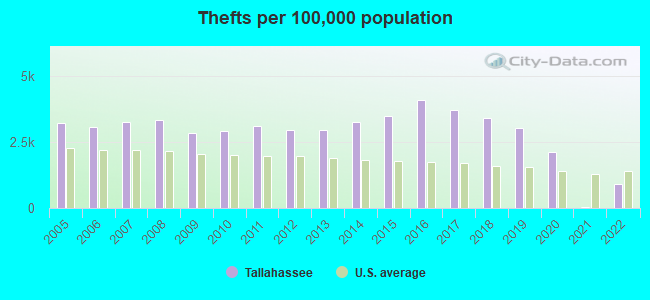
Property crime rate in 2022
| Tallahassee: | 83.3 |
| U.S. Average: | 166.5 |
Property crime rate in 2021
| Tallahassee: | 2.9 |
| U.S. Average: | 157.8 |
Property crime rate in 2020
| Tallahassee: | 257.8 |
| U.S. Average: | 169.6 |
Property crime rate in 2019
| Tallahassee: | 325.0 |
| U.S. Average: | 179.7 |
Property crime rate in 2018
| Tallahassee: | 373.3 |
| U.S. Average: | 190.2 |
Property crime rate in 2017
| Tallahassee: | 402.0 |
| U.S. Average: | 206.4 |
Property crime rate in 2016
| Tallahassee: | 512.4 |
| U.S. Average: | 216.6 |
Property crime rate in 2015
| Tallahassee: | 469.5 |
| U.S. Average: | 221.5 |
Property crime rate in 2014
| Tallahassee: | 462.7 |
| U.S. Average: | 230.8 |
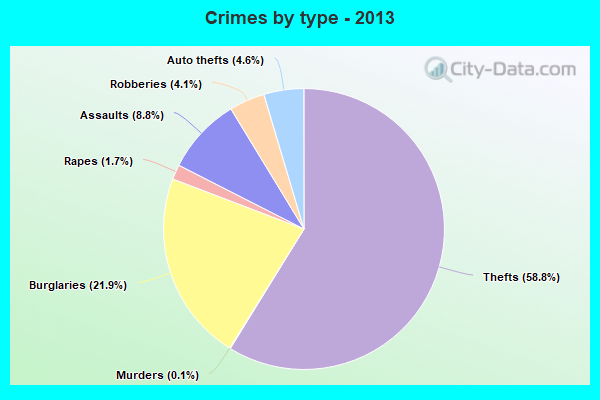
Property crime rate in 2013
| Tallahassee: | 403.8 |
| U.S. Average: | 250.4 |
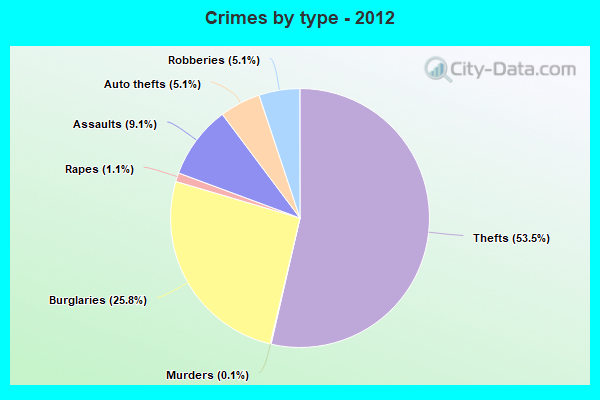
Property crime rate in 2012
| Tallahassee: | 473.3 |
| U.S. Average: | 267.3 |
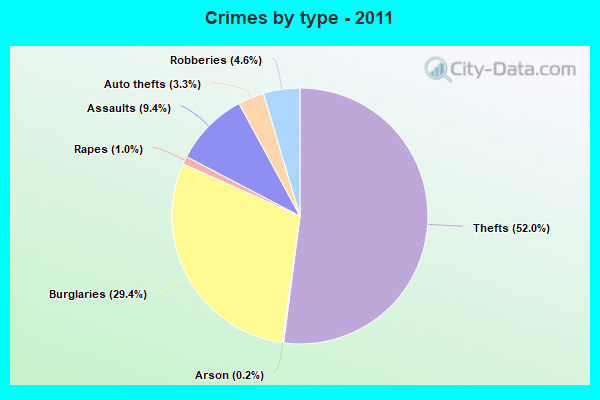
Property crime rate in 2011
| Tallahassee: | 539.7 |
| U.S. Average: | 273.5 |
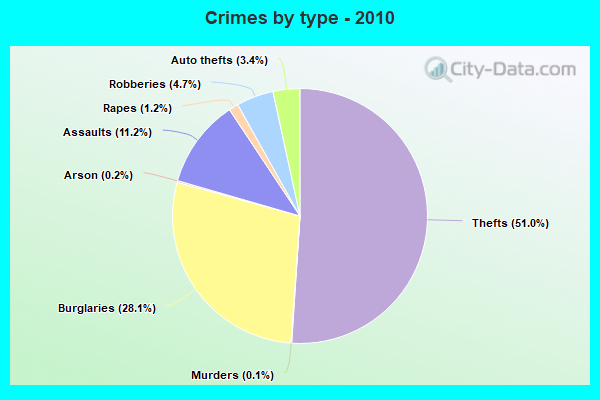
Property crime rate in 2010
| Tallahassee: | 497.2 |
| U.S. Average: | 276.4 |
Property crime rate in 2009
| Tallahassee: | 530.7 |
| U.S. Average: | 285.6 |
Property crime rate in 2008
| Tallahassee: | 544.1 |
| U.S. Average: | 302.2 |
Property crime rate in 2007
| Tallahassee: | 401.6 |
| U.S. Average: | 309.2 |
Property crime rate in 2006
| Tallahassee: | 353.8 |
| U.S. Average: | 317.3 |
Property crime rate in 2005
| Tallahassee: | 410.7 |
| U.S. Average: | 322.3 |
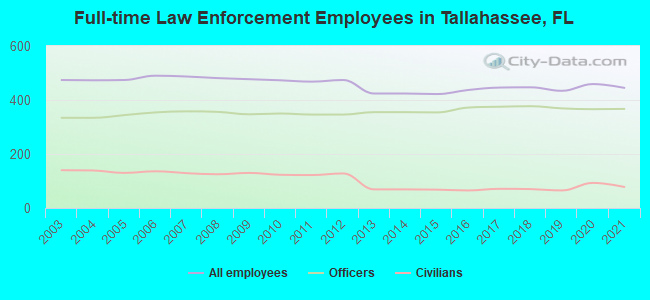
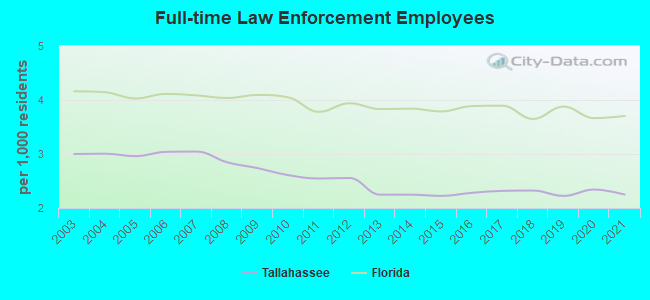
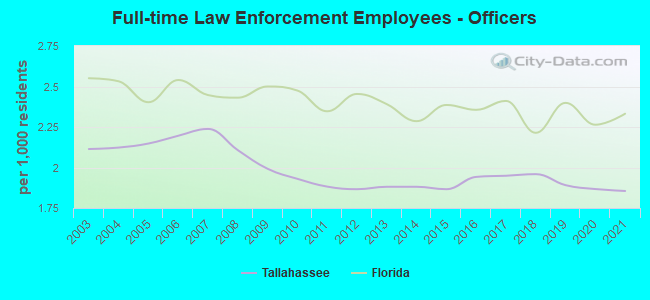
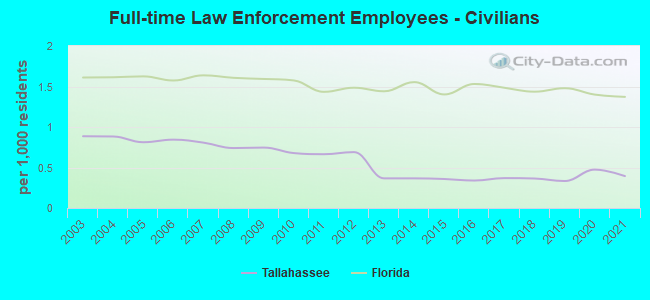
Full-time law enforcement employees in 2021, including police officers: 445 (367 officers - 294 male; 73 female).
| Officers per 1,000 residents here: | 1.85 |
| Florida average: | 2.33 |
Full-time law enforcement employees in 2020, including police officers: 459 (366 officers - 293 male; 73 female).
| Officers per 1,000 residents here: | 1.87 |
| Florida average: | 2.26 |
Full-time law enforcement employees in 2019, including police officers: 434 (369 officers - 299 male; 70 female).
| Officers per 1,000 residents here: | 1.89 |
| Florida average: | 2.40 |
Full-time law enforcement employees in 2018, including police officers: 447 (377 officers - 309 male; 68 female).
| Officers per 1,000 residents here: | 1.96 |
| Florida average: | 2.21 |
Full-time law enforcement employees in 2017, including police officers: 446 (375 officers - 306 male; 69 female).
| Officers per 1,000 residents here: | 1.95 |
| Florida average: | 2.41 |
Full-time law enforcement employees in 2016, including police officers: 437 (372 officers - 303 male; 69 female).
| Officers per 1,000 residents here: | 1.94 |
| Florida average: | 2.36 |
Full-time law enforcement employees in 2015, including police officers: 422 (354 officers - 293 male; 61 female).
| Officers per 1,000 residents here: | 1.87 |
| Florida average: | 2.39 |
Full-time law enforcement employees in 2013, including police officers: 424 (355 officers - 286 male; 69 female).
| Officers per 1,000 residents here: | 1.88 |
| Florida average: | 2.39 |
Full-time law enforcement employees in 2012, including police officers: 474 (346 officers - 278 male; 68 female).
| Officers per 1,000 residents here: | 1.87 |
| Florida average: | 2.45 |
Full-time law enforcement employees in 2011, including police officers: 468 (346 officers - 278 male; 68 female).
| Officers per 1,000 residents here: | 1.88 |
| Florida average: | 2.35 |
Full-time law enforcement employees in 2010, including police officers: 473 (350 officers - 277 male; 73 female).
| Officers per 1,000 residents here: | 1.93 |
| Florida average: | 2.47 |
Full-time law enforcement employees in 2009, including police officers: 477 (347 officers - 279 male; 68 female).
| Officers per 1,000 residents here: | 1.99 |
| Florida average: | 2.50 |
Full-time law enforcement employees in 2008, including police officers: 481 (356 officers - 284 male; 72 female).
| Officers per 1,000 residents here: | 2.11 |
| Florida average: | 2.43 |
Full-time law enforcement employees in 2007, including police officers: 487 (358 officers - 285 male; 73 female).
| Officers per 1,000 residents here: | 2.24 |
| Florida average: | 2.45 |
Full-time law enforcement employees in 2006, including police officers: 490 (354 officers - 281 male; 73 female).
| Officers per 1,000 residents here: | 2.20 |
| Florida average: | 2.54 |
Full-time law enforcement employees in 2005, including police officers: 474 (344 officers - 272 male; 72 female).
| Officers per 1,000 residents here: | 2.15 |
| Florida average: | 2.40 |
Full-time law enforcement employees in 2004, including police officers: 473 (334 officers - 264 male; 70 female).
| Officers per 1,000 residents here: | 2.12 |
| Florida average: | 2.53 |
Full-time law enforcement employees in 2003, including police officers: 474 (334 officers - 267 male; 67 female).
| Officers per 1,000 residents here: | 2.11 |
| Florida average: | 2.55 |


Zip codes: 32301, 32303, 32304, 32305, 32308, 32309, 32310, 32311, 32312, 32317, 32399.