Dell City, TX (Texas) Houses and Residents
| Dell City: | |
| Texas: |
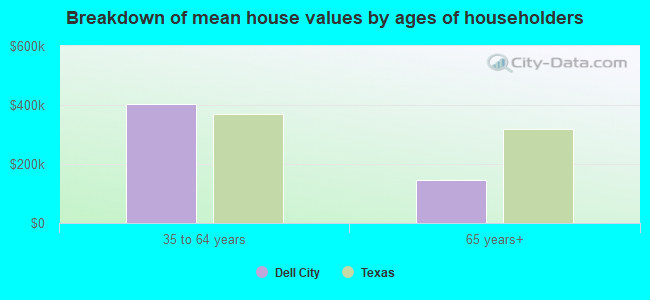
Mean price in 2022:
Detached houses: $63,100
Here: $63,100 State: $369,058 Mobile homes: $22,206
Here: $22,206 State: $124,413
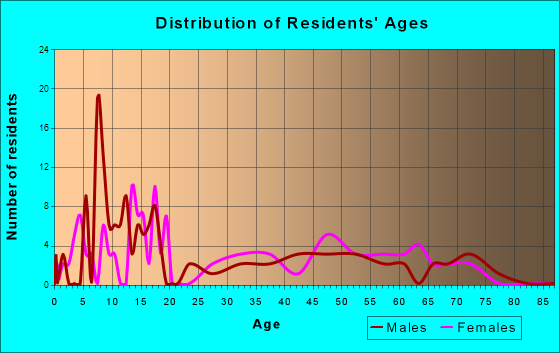
Total population: 336 (Urban population: 0, Rural population: 500 (6 farm, 494 nonfarm))
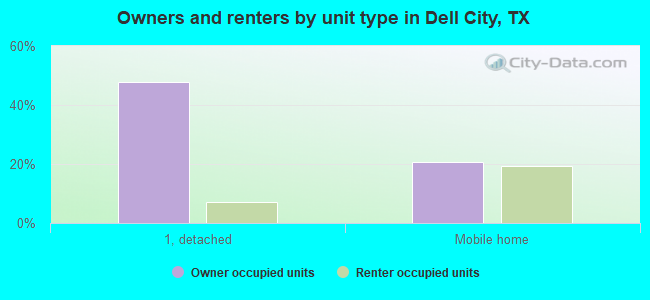
Houses: 108 (53 occupied: 26 owner occupied, 27 renter occupied)
| % of renters here: | 51% |
| State: | 38% |
Housing density: 65 houses/condos per square mile
Median price asked for vacant for-sale houses and condos in 2022: $158,257.
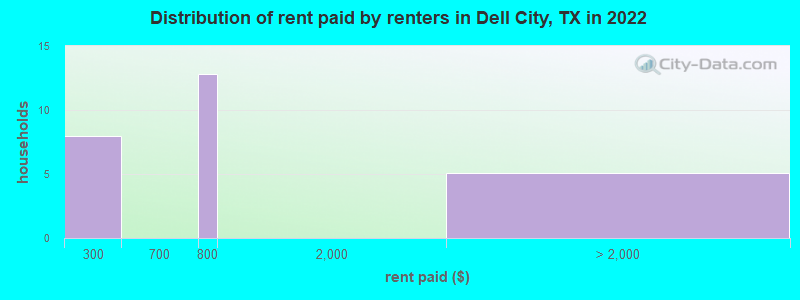
Median rent asked for vacant for-rent units in 2022: $741
Median gross rent in Dell City, TX in 2022: $-687,450,039
Housing units in Dell City with a mortgage: 0 (0 second mortgage, 0 home equity loan, 0 both second mortgage and home equity loan)
Houses without a mortgage: 0
Compare current foreclosures near your location:
| Photo | Address | Area | Beds / Baths | Price | Details |
|---|---|---|---|---|---|

|
#1
E 21st Ave
Columbus, OH 43211
|
1,061 sq. feet
|
1 baths 3 beds |
$187,900
|
show details |

|
#2
S High St
Columbus, OH 43207
|
1,678 sq. feet
|
2 baths 4 beds |
$31,900
|
show details |

|
#3
Bayberry Cir
Columbus, OH 43207
|
1,564 sq. feet
|
1 baths 3 beds |
$127,500
|
show details |

|
#4
Kingsglen Dr
Grove City, OH 43123
|
1,635 sq. feet
|
2 baths 4 beds |
show details | |

|
#5
Brookstone Dr
Westerville, OH 43082
|
1,783 sq. feet
|
3 baths 3 beds |
show details | |

|
#6
Falls Peak Ln
Delaware, OH 43015
|
1,352 sq. feet
|
2 baths 2 beds |
show details | |

|
#7
Meadowbrook Dr
Columbus, OH 43207
|
1,752 sq. feet
|
2 baths 4 beds |
show details | |

|
#8
Bunch Flower Ct
Westerville, OH 43082
|
3,173 sq. feet
|
2 baths 4 beds |
show details | |

|
#9
Sleeping Meadow Dr
New Albany, OH 43054
|
3,211 sq. feet
|
2 baths 4 beds |
show details | |

|
#10
Derrer Rd -872
Columbus, OH 43204
|
1,667 sq. feet
|
2 baths 5 beds |
show details |
| Photo | Address | Area | Beds / Baths | Price | Details |
|---|---|---|---|---|---|

|
#11
Elaine Rd
Columbus, OH 43213
|
764 sq. feet
|
1 baths 2 beds |
show details | |

|
#12
Mink St SW
Pataskala, OH 43062
|
1,442 sq. feet
|
1 baths 3 beds |
show details | |

|
#13
Bretton Pl
Columbus, OH 43211
|
1,056 sq. feet
|
1 baths 3 beds |
show details | |

|
#14
Wrexham Ave
Columbus, OH 43223
|
1,235 sq. feet
|
1 baths 3 beds |
show details | |

|
#15
Fergus Rd
Grove City, OH 43123
|
3,312 sq. feet
|
2 baths 4 beds |
show details | |

|
#16
Ferris Rd
Columbus, OH 43224
|
2,218 sq. feet
|
3 baths 3 beds |
show details | |

|
#17
S Hague Ave
Columbus, OH 43204
|
979 sq. feet
|
1 baths 2 beds |
show details | |

|
#18
Fahlander Dr N
Columbus, OH 43229
|
1,338 sq. feet
|
2 baths 3 beds |
show details | |

|
#19
Bernadette Rd
Columbus, OH 43204
|
1,168 sq. feet
|
1 baths 3 beds |
show details | |

|
#20
Midland Ave
Columbus, OH 43223
|
1,518 sq. feet
|
1 baths 2 beds |
show details |
| Photo | Address | Area | Beds / Baths | Price | Details |
|---|---|---|---|---|---|

|
#21
N Roys Ave
Columbus, OH 43204
|
1,248 sq. feet
|
2 baths 3 beds |
show details | |

|
#22
Marshrun Dr
Grove City, OH 43123
|
2,036 sq. feet
|
2 baths 4 beds |
show details | |

|
#23
N Grener Ave
Columbus, OH 43228
|
1,120 sq. feet
|
1 baths 3 beds |
show details | |

|
#24
Belle Oak Dr
Galloway, OH 43119
|
1,296 sq. feet
|
2 baths 3 beds |
show details | |

|
#25
Mayflower Blvd
Columbus, OH 43213
|
1,591 sq. feet
|
2 baths 4 beds |
show details | |

|
#26
Rosewood Ct
Powell, OH 43065
|
2,801 sq. feet
|
3 baths 4 beds |
show details | |

|
#27
High Free Pike
West Jefferson, OH 43162
|
1,216 sq. feet
|
2 baths 4 beds |
show details | |

|
#28
Stoneybrook Blvd # 21a
Hilliard, OH 43026
|
1,231 sq. feet
|
2 baths 3 beds |
show details | |

|
#29
S Richardson Ave
Columbus, OH 43204
|
1,520 sq. feet
|
2 baths 3 beds |
show details | |

|
#30
Edgeview Rd
Columbus, OH 43207
|
1,700 sq. feet
|
1 baths 4 beds |
show details |
| Photo | Address | Area | Beds / Baths | Price | Details |
|---|---|---|---|---|---|

|
#31
Striebel Ct
Columbus, OH 43227
|
925 sq. feet
|
1 baths 3 beds |
show details | |

|
#32
Scottwood Rd
Columbus, OH 43227
|
1,008 sq. feet
|
1 baths 3 beds |
show details | |

|
#33
Vineyard Haven Loop
Dublin, OH 43016
|
4,625 sq. feet
|
4 baths 4 beds |
show details | |

|
#34
S Chillicothe St
Plain City, OH 43064
|
1,736 sq. feet
|
2 baths 4 beds |
show details | |

|
#35
Trotter Dr
Columbus, OH 43207
|
1,478 sq. feet
|
1 baths 3 beds |
show details | |

|
#36
Doral Ave
Columbus, OH 43213
|
2,008 sq. feet
|
2 baths 4 beds |
show details | |

|
#37
Cole Rd
Columbus, OH 43228
|
1,833 sq. feet
|
2 baths 3 beds |
show details | |

|
#38
Bucknell Rd
Columbus, OH 43213
|
1,054 sq. feet
|
1 baths 3 beds |
show details | |

|
#39
Simpson Dr
Columbus, OH 43227
|
1,104 sq. feet
|
1 baths 3 beds |
show details | |

|
#40
Belfast Dr
Columbus, OH 43227
|
1,142 sq. feet
|
2 baths 3 beds |
show details |
| Photo | Address | Area | Beds / Baths | Price | Details |
|---|---|---|---|---|---|

|
#41
Morality Dr
Columbus, OH 43231
|
1,903 sq. feet
|
2 baths 4 beds |
show details | |

|
#42
Torchwood Loop E
Columbus, OH 43229
|
2,421 sq. feet
|
2 baths 5 beds |
show details | |

|
#43
Jason Dr
Columbus, OH 43227
|
1,602 sq. feet
|
2 baths 3 beds |
show details | |

|
#44
Omega Dr
Columbus, OH 43231
|
1,292 sq. feet
|
2 baths 3 beds |
show details | |

|
#45
Oklahoma Ave
Columbus, OH 43230
|
1,824 sq. feet
|
1 baths 4 beds |
show details | |

|
#46
Sapphire Dr
Grove City, OH 43123
|
3,241 sq. feet
|
3 baths 4 beds |
show details | |

|
#47
Colorado Ave
Groveport, OH 43125
|
1,502 sq. feet
|
1 baths 3 beds |
show details | |

|
#48
Allwood Ct
Columbus, OH 43231
|
1,683 sq. feet
|
2 baths 3 beds |
show details | |

|
#49
Jed Ct
Columbus, OH 43227
|
1,086 sq. feet
|
1 baths 3 beds |
show details | |

|
Check over 1 million property listings on Foreclosure.com!
|
browse all offers | |||


 | Should Houston ISD build apartments for employees (teachers and staff) (8 replies) |
| Sunland Estates (102 replies) |
| Is El Paso Pretty? (349 replies) |
| Dell City (19 replies) |
| Sunset Ranches crime? (110 replies) |
| Help Land on eBay in West Texas is it a rip off or not?? (60 replies) |
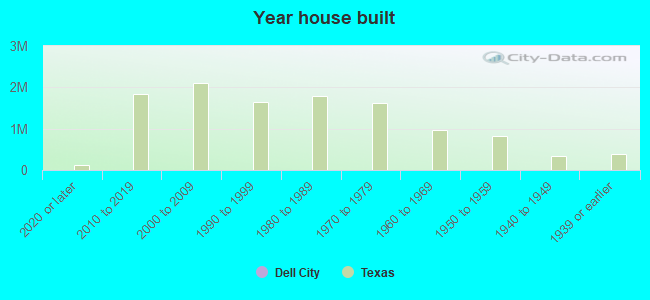
Median year apartment built: 1997
Household type by relationship:
Households: 84- Male householders: 28 (17 living alone), Female householders: 23 (6 living alone)
24 spouses (24 opposite-sex spouses), 0 unmarried partners, (0 opposite-sex unmarried partners), 7 children (7 natural, 0 adopted, 0 stepchildren), 0 grandchildren, 0 brothers or sisters, 0 parents, 0 foster children, 0 other relatives, 0 non-relatives
Size of family households: 29 2-persons.
Size of nonfamily households: 24 1-person.
0 married couples with children.
6 single-parent households (0 men, 6 women).
32.1% of residents of Dell City speak English at home.
65.5% of residents speak Spanish at home (29% speak English very well, 24% speak English well, 31% speak English not well, 16% don't speak English at all).
Foreign born population: 21 (25.0%)
(33.3% of them are naturalized citizens)
| Here: | 4.0 |
| State: | 6.3 |
| Here: | 4.7 |
| State: | 4.0 |
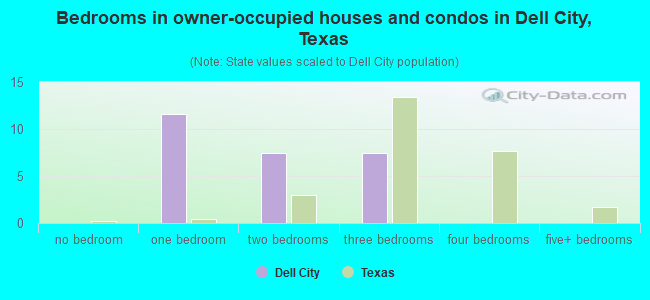
- Bedrooms in owner-occupied houses and condos in Dell City, Texas
- 0no bedroom
- 121 bedroom
- 72 bedrooms
- 73 bedrooms
- 04 bedrooms
- 05+ bedrooms
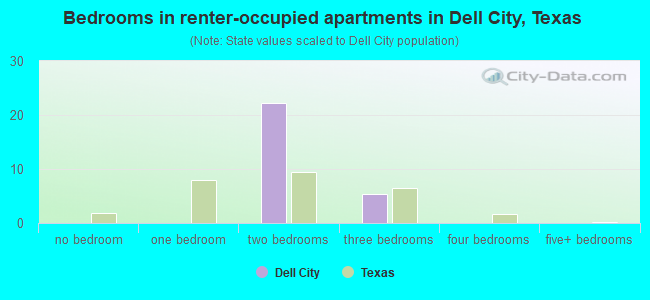
- Bedrooms in renter-occupied apartments in Dell City, Texas
- 0no bedroom
- 01 bedroom
- 222 bedrooms
- 53 bedrooms
- 04 bedrooms
- 05+ bedrooms
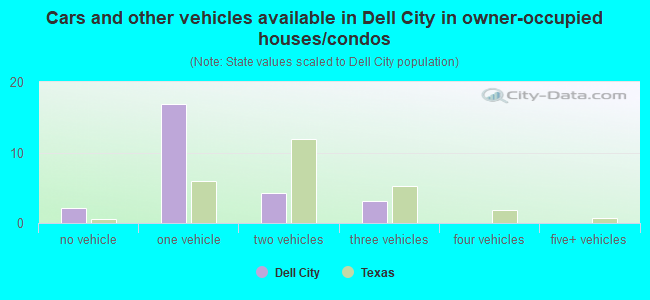
- Cars and other vehicles available in Dell City in owner-occupied houses/condos
- 2no vehicle
- 171 vehicle
- 42 vehicles
- 33 vehicles
- 04 vehicles
- 05+ vehicles
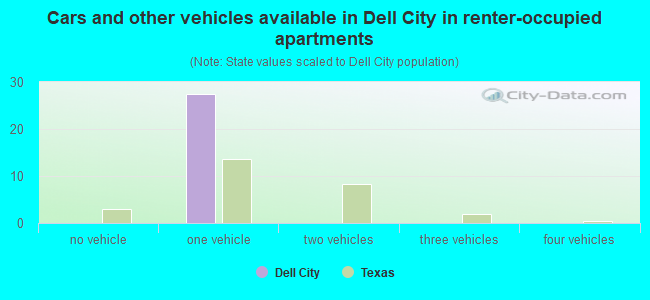
- Cars and other vehicles available in Dell City in renter-occupied apartments
- 0no vehicle
- 271 vehicle
- 02 vehicles
- 03 vehicles
- 04 vehicles
- 05+ vehicles
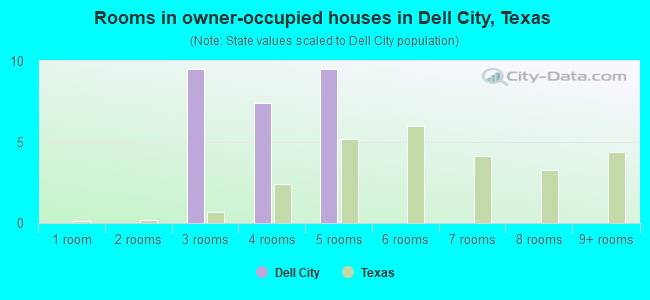
- Rooms in owner-occupied houses in Dell City, Texas
- 01 room
- 02 rooms
- 103 rooms
- 74 rooms
- 105 rooms
- 06 rooms
- 07 rooms
- 08 rooms
- 09+ rooms
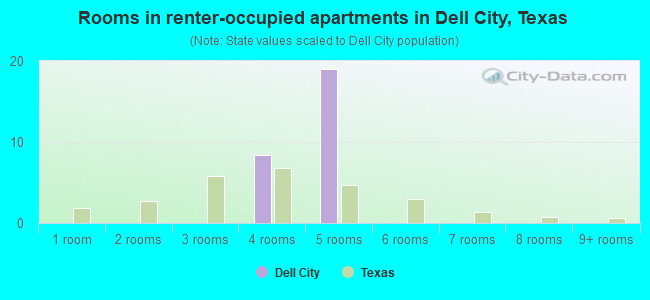
- Rooms in renter-occupied apartments in Dell City, Texas
- 01 room
- 02 rooms
- 03 rooms
- 84 rooms
- 195 rooms
- 06 rooms
- 07 rooms
- 08 rooms
- 09+ rooms
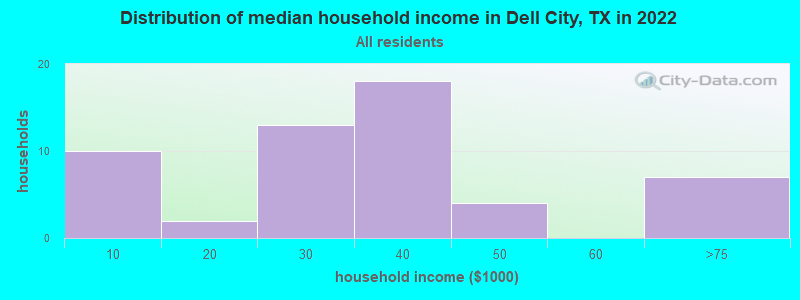
Dell City, TX household income distribution

- 10Less than $10,000
- 2$10,000 to $19,999
- 13$20,000 to $29,999
- 18$30,000 to $39,999
- 4$40,000 to $49,999
- 7$60,000 to $74,999
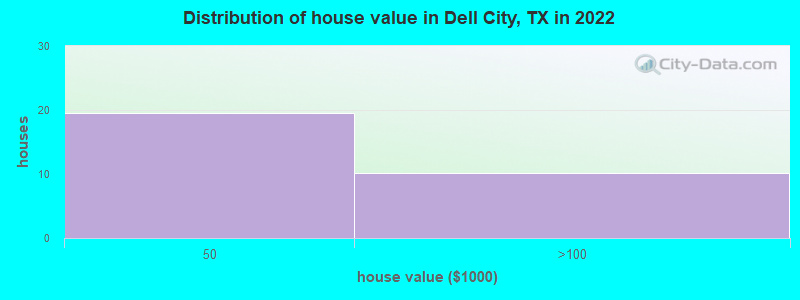
Home value of owner - occupied houses in 2022 in Dell City, TX
-
- 11Less than $10,000
- 3$25,000 to $29,999
- 4$40,000 to $49,999
- 5$50,000 to $59,999
Rent paid by renters in 2022 in Dell City, TX
-
- 7$200 to $249
- 12$700 to $749
- 5No cash rent
Percentage of workers working in this county: 100.0%
Number of people working at home: 0 (0.0% of all workers)
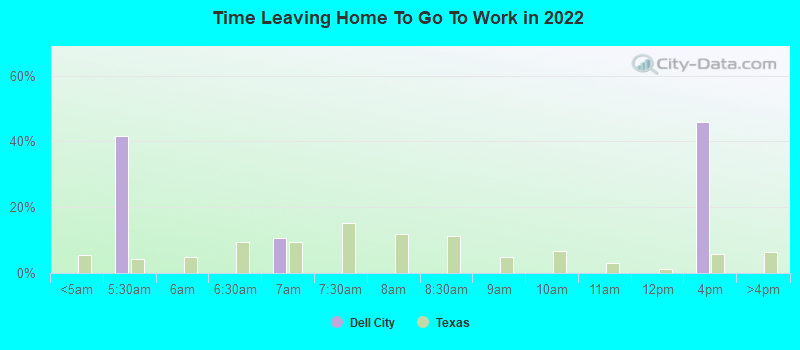
Travel time to work (commute)
- Less than 5 minutes: 3
- 5 to 9 minutes: 0
- 10 to 14 minutes: 12
- 15 to 19 minutes: 12
- 20 to 24 minutes: 0
- 25 to 29 minutes: 0
- 30 to 34 minutes: 0
- 35 to 39 minutes: 0
- 40 to 44 minutes: 0
- 45 to 59 minutes: 0
- 60 to 89 minutes: 0
- 90 or more minutes: 0
Means of transportation to work:
- Drove a car alone: 141 (73.8%)
- Carpooled: 22 (11.5%)
- Walked: 24 (12.6%)
- Other means: 4 (2.1%)
- Unemployment by race in 2022
- Unemployment rate for American Indian and Alaska Native residents
- 100.0%Males
- Unemployment rate for Hispanic or Latino residents
- 27.0%Males
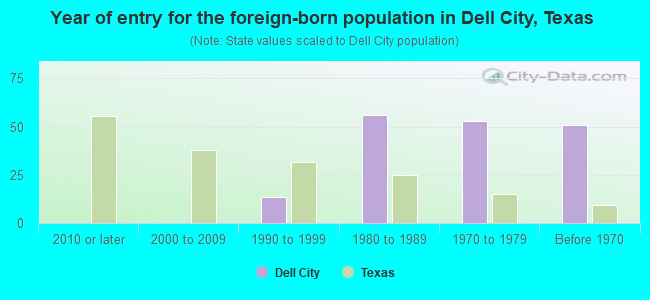
- Year of entry for the foreign-born population in Dell City, Texas
- 02010 or later
- 02000 to 2009
- 141990 to 1999
- 561980 to 1989
- 531970 to 1979
- 51Before 1970
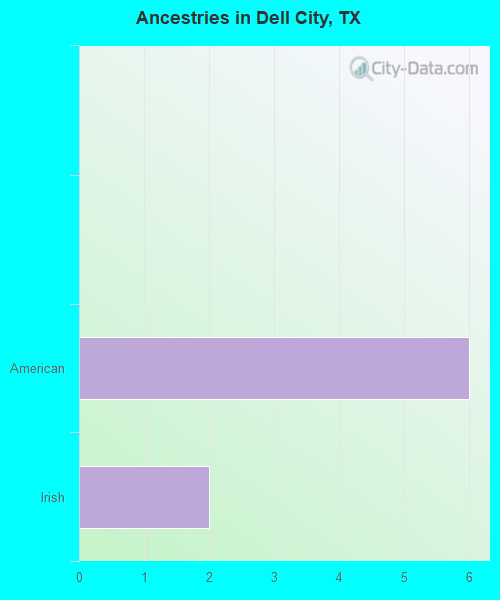
First ancestries reported:
- American: 6 (8.7%)
- Irish: 2 (2.9%)
Most common places of birth for foreign-born residents (%):
| Dell City: | 95.2% (20) |
| Texas: | 48.4% (2,411,723) |
Place of birth for U.S.-born residents:
- This state: 18
- Other state: 45
- Northeast: 3
- Midwest: 7
- South: 6
- West: 29
82.1% of Dell City residents lived in the same house 1 years ago.
Out of people who lived in different houses, 48.1% lived in this county.
| Dell City: | 82.1% |
| State average: | 85.7% |
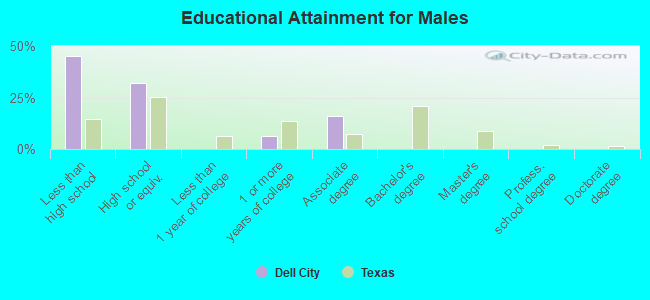
Education attainment for males 25 years and older:
- No schooling: 0
- Nursery to 4th grade: 7
- 5th and 6th grade: 7
- 7th and 8th grade: 0
- 9th grade: 0
- 10th grade: 0
- 11th grade: 0
- 12th grade, no diploma: 0
- High school graduate (or equivalency): 10
- Less than 1 year of college: 0
- Some college more than 1 year, no degree: 2
- Associate degree: 5
- Bachelor's degree: 0
- Master's degree: 0
- Professional school degree: 0
- Doctorate degree: 0
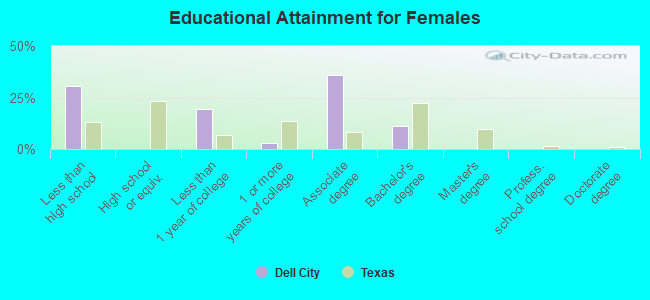
Education attainment for females 25 years and older:
- No schooling: 0
- Nursery to 4th grade: 0
- 5th and 6th grade: 8
- 7th and 8th grade: 0
- 9th grade: 0
- 10th grade: 3
- 11th grade: 0
- 12th grade, no diploma: 0
- High school graduate (or equivalency): 0
- Less than 1 year of college: 7
- Some college more than 1 year, no degree: 1
- Associate degree: 13
- Bachelor's degree: 4
- Master's degree: 0
- Professional school degree: 0
- Doctorate degree: 0
Housing units in structures:
- One, detached: 43
- Mobile homes: 64
Housing units lacking complete kitchen facilities in 2022: 16.3%
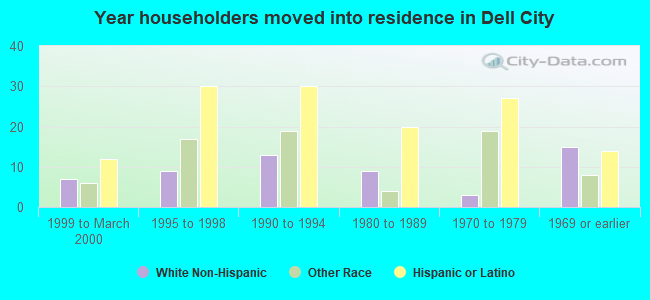
House/condo owner moved in on average 32 years ago
Renter moved in on average 3 years ago
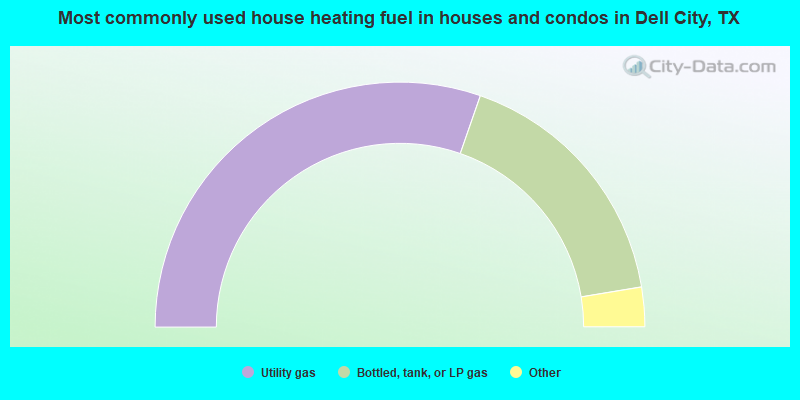
- 64.0%Utility gas
- 36.0%Bottled, tank, or LP gas
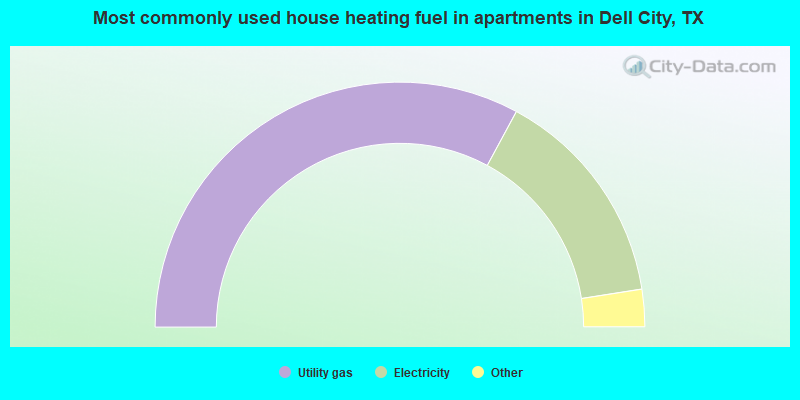
- 69.2%Utility gas
- 30.8%Electricity
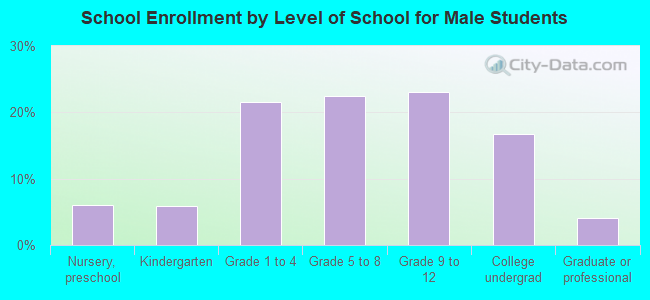
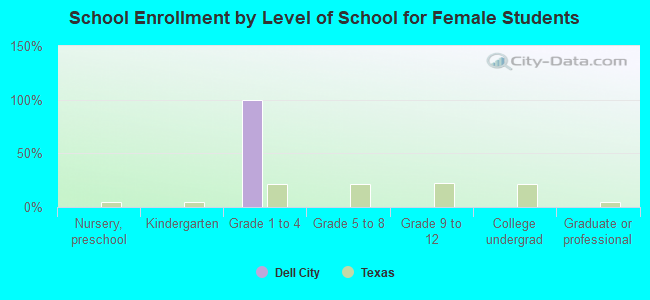
Private vs. public school enrollment:
| Here: | 0.0% |
| Texas: | 8.8% |