Housing density: 5,200 houses/condos per square mile
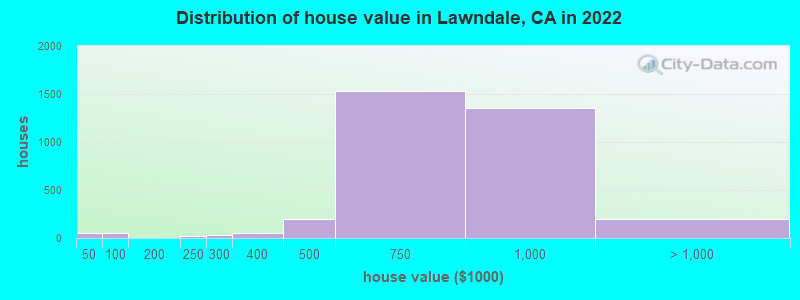
Median price asked for vacant for-sale houses and condos in 2022: $404,898.
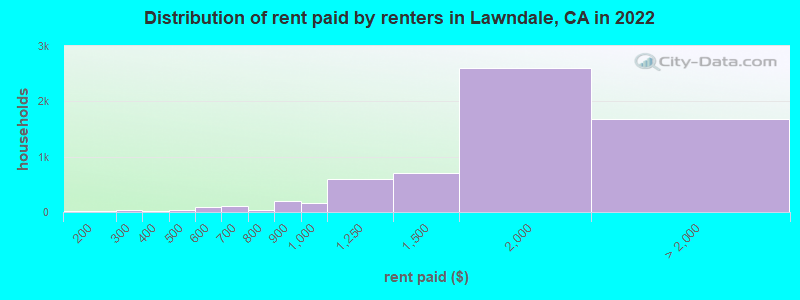
Median contract rent in 2022: $1,712 (lower quartile is $1,319, upper quartile is over $2,000)
Median rent asked for vacant for-rent units in 2022: $1,581
Median gross rent in Lawndale, CA in 2022: $1,771
Housing units in Lawndale with a mortgage: 2,436 (148 second mortgage, 0 home equity loan, 122 both second mortgage and home equity loan) Houses without a mortgage: 12
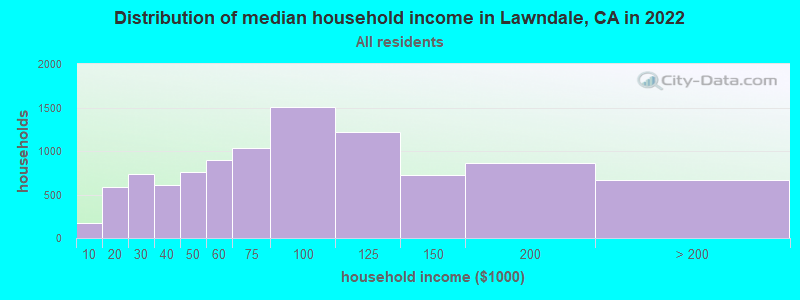
Median household income for houses/condos with a mortgage: $105,302
Median household income for apartments without a mortgage: $103,515
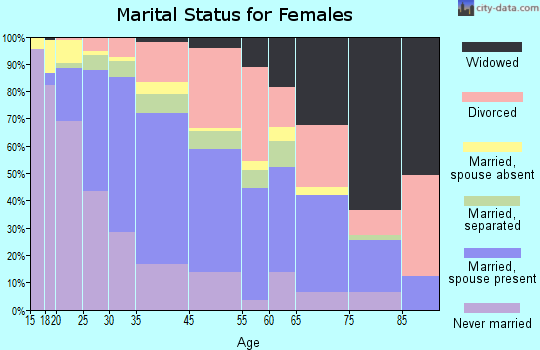
3,912 married couples with children.
1,727 single-parent households (767 men, 960 women).
31.1% of residents of Lawndale speak English at home.
54.9% of residents speak Spanish at home (60% speak English very well, 21% speak English well, 15% speak English not well, 4% don't speak English at all).
3.1% of residents speak other Indo-European language at home (63% speak English very well, 27% speak English well, 10% speak English not well).
6.8% of residents speak Asian or Pacific Island language at home (47% speak English very well, 28% speak English well, 24% speak English not well, 1% don't speak English at all).
3.3% of residents speak other language at home (78% speak English very well, 18% speak English well, 4% speak English not well).
Foreign born population: 12,305 (39.9%)
(51.9% of them are naturalized citizens)
Percentage of workers working in this county: 96.0% Number of people working at home: 1,180 (7.3% of all workers)
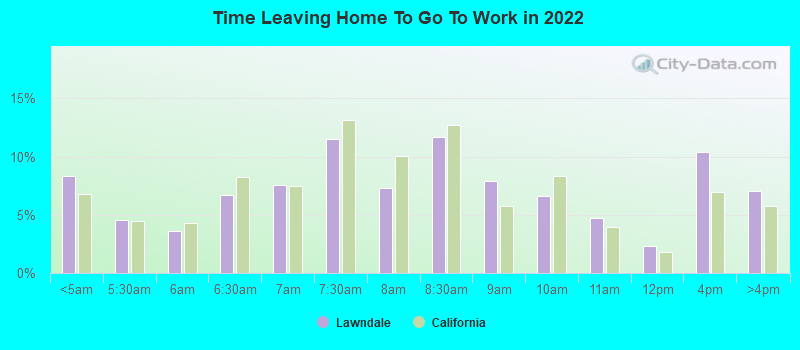
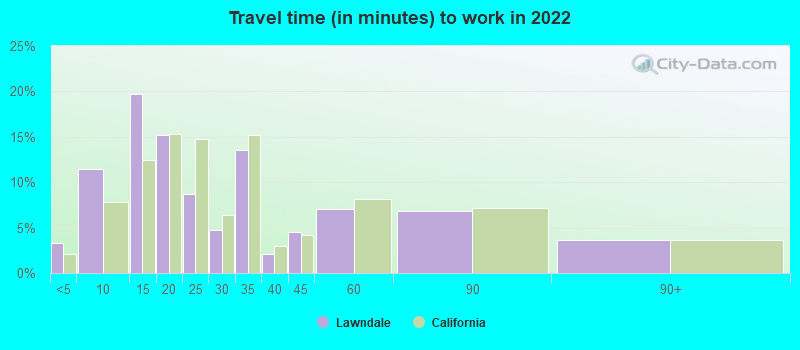
Travel time to work (commute)
Less than 5 minutes: 236
5 to 9 minutes: 926
10 to 14 minutes: 2,449
15 to 19 minutes: 2,940
20 to 24 minutes: 2,327
25 to 29 minutes: 1,039
30 to 34 minutes: 1,874
35 to 39 minutes: 402
40 to 44 minutes: 254
45 to 59 minutes: 1,128
60 to 89 minutes: 846
90 or more minutes: 317
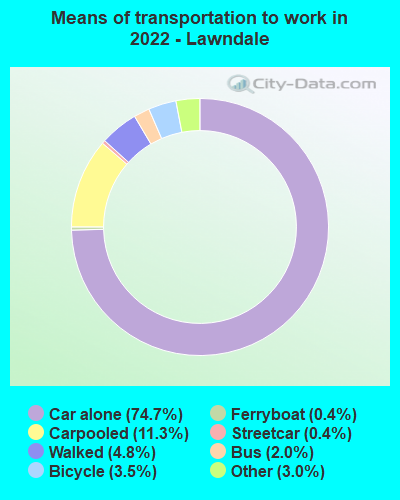
Means of transportation to work:
Drove a car alone: 4,518 (62.0%)
Carpooled: 754 (10.3%)
Bus: 110 (1.5%)
Subway or elevated rail: 18 (0.2%)
Ferryboat: 19 (0.3%)
Taxi: 196 (2.7%)
Bicycle: 220 (3.0%)
Walked: 311 (4.3%)
Worked at home: 1,180 (16.2%)
Unemployment by race in 2022
Unemployment rate for White non-Hispanic residents
0.7%Males
4.3%Females
Unemployment rate for Black residents
5.2%Males
6.6%Females
Unemployment rate for American Indian and Alaska Native residents
2.8%Females
Unemployment rate for Asian residents
2.8%Males
2.6%Females
Unemployment rate for other race residents
3.0%Males
8.1%Females
Unemployment rate for two or more race residents
14.3%Males
5.8%Females
Unemployment rate for Hispanic or Latino residents
10.6%Males
7.8%Females
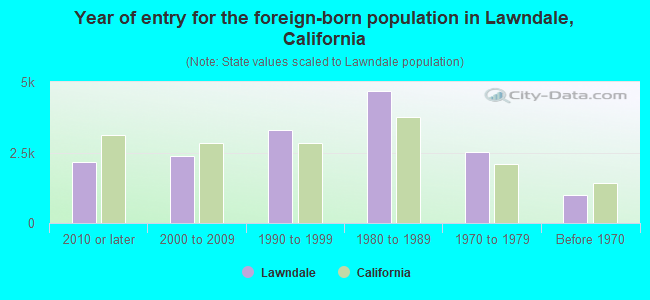
Year of entry for the foreign-born population in Lawndale, California
2,1462010 or later
2,3912000 to 2009
3,3091990 to 1999
4,6931980 to 1989
2,5061970 to 1979
1,008Before 1970
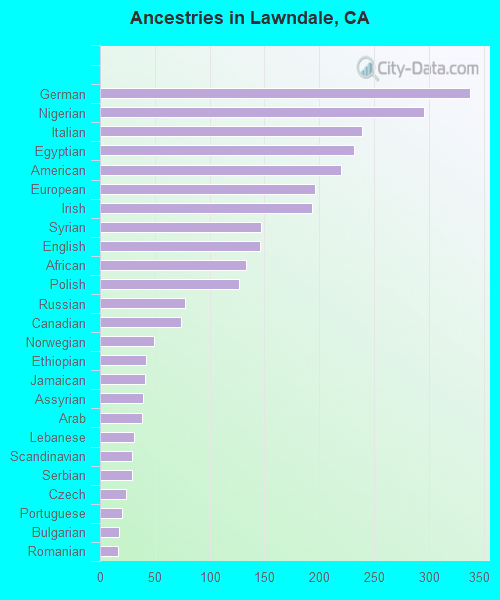
First ancestries reported:
German: 338 (1.7%)
Nigerian: 296 (1.5%)
Italian: 239 (1.2%)
Egyptian: 232 (1.2%)
American: 220 (1.1%)
European: 196 (1.0%)
Irish: 193 (1.0%)
Syrian: 147 (0.7%)
English: 146 (0.7%)
African: 133 (0.7%)
Polish: 127 (0.6%)
Russian: 78 (0.4%)
Canadian: 74 (0.4%)
Norwegian: 49 (0.2%)
Ethiopian: 42 (0.2%)
Jamaican: 41 (0.2%)
Assyrian: 39 (0.2%)
Arab: 38 (0.2%)
Lebanese: 31 (0.2%)
Scandinavian: 29 (0.1%)
Serbian: 29 (0.1%)
Czech: 24 (0.1%)
Portuguese: 20 (0.1%)
Bulgarian: 17 (0.09%)
Romanian: 16 (0.08%)
Scottish: 16 (0.08%)
Ukrainian: 15 (0.08%)
Armenian: 14 (0.07%)
French: 14 (0.07%)
Northern European: 13 (0.07%)
Latvian: 11 (0.06%)
German Russian: 10 (0.05%)
Moroccan: 8 (0.04%)
Israeli: 8 (0.04%)
Scotch-Irish: 7 (0.04%)
Slovak: 4 (0.02%)
Most common places of birth for foreign-born residents (%):
Mexico
Lawndale:
37.9% (4,667)
California:
37.2% (3,881,193)
Guatemala
Lawndale:
12.6% (1,556)
California:
2.8% (290,436)
El Salvador
Lawndale:
7.2% (885)
California:
4.2% (440,287)
Vietnam
Lawndale:
6.8% (832)
California:
4.9% (512,335)
Philippines
Lawndale:
5.8% (708)
California:
7.8% (818,297)
Peru
Lawndale:
5.2% (639)
California:
0.7% (74,025)
Egypt
Lawndale:
2.5% (307)
California:
0.4% (42,718)
Nigeria
Lawndale:
1.9% (231)
California:
0.3% (35,557)
Syria
Lawndale:
1.8% (216)
California:
0.3% (30,949)
Honduras
Lawndale:
1.6% (197)
California:
0.6% (66,590)
Place of birth for U.S.-born residents:
This state: 16,005
Other state: 2,097
Northeast: 503
Midwest: 526
South: 567
West: 481
91.6% of Lawndale residents lived in the same house 1 years ago. Out of people who lived in different houses, 45.8% lived in this county. Out of people who lived in different counties, 53.5% lived in California.
Lawndale:
91.6%
State average:
88.9%
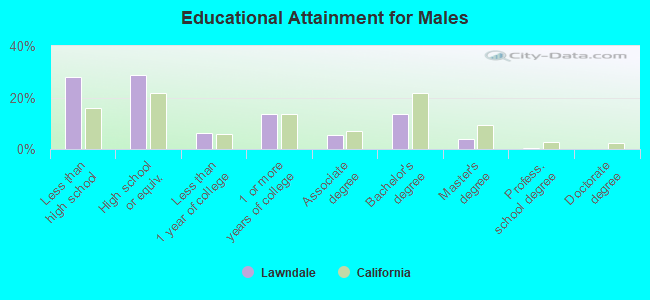
Education attainment for males 25 years and older:
No schooling: 833
Nursery to 4th grade: 126
5th and 6th grade: 677
7th and 8th grade: 254
9th grade: 282
10th grade: 125
11th grade: 225
12th grade, no diploma: 612
High school graduate (or equivalency): 3,193
Less than 1 year of college: 675
Some college more than 1 year, no degree: 1,535
Associate degree: 611
Bachelor's degree: 1,494
Master's degree: 441
Professional school degree: 59
Doctorate degree: 8
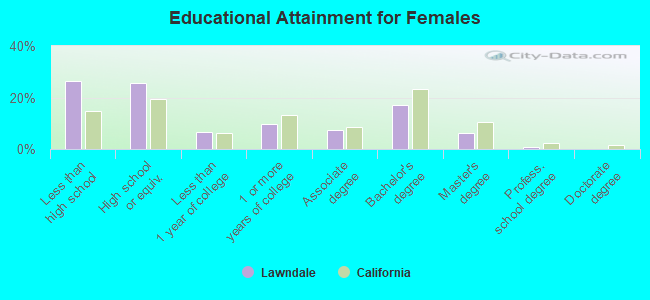
Education attainment for females 25 years and older:
No schooling: 799
Nursery to 4th grade: 133
5th and 6th grade: 351
7th and 8th grade: 144
9th grade: 265
10th grade: 169
11th grade: 171
12th grade, no diploma: 573
High school graduate (or equivalency): 2,514
Less than 1 year of college: 659
Some college more than 1 year, no degree: 944
Associate degree: 731
Bachelor's degree: 1,681
Master's degree: 593
Professional school degree: 67
Doctorate degree: 11
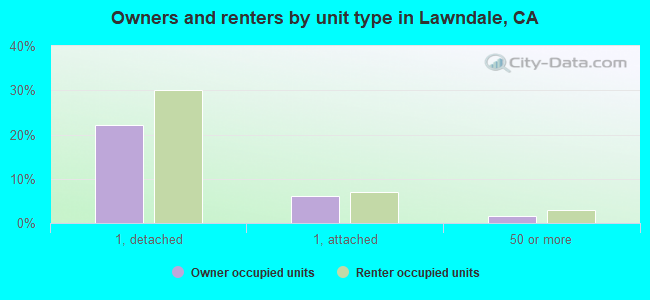
Housing units in structures:
One, detached: 5,903
One, attached: 1,190
Two: 303
3 or 4: 643
5 to 9: 516
10 to 19: 549
20 to 49: 505
50 or more: 560
Mobile homes: 101
Boats, RVs, vans, etc.: 9
Housing units lacking complete plumbing facilities in 2022: 0.8%
Housing units lacking complete kitchen facilities in 2022: 2.7%
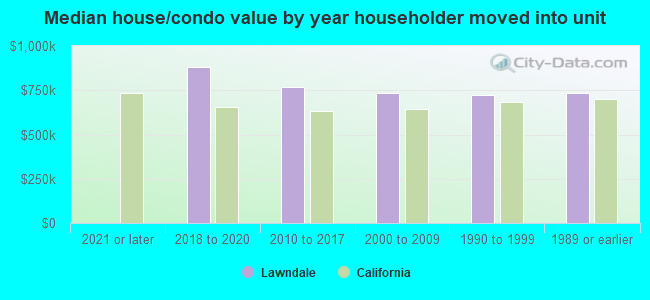
House/condo owner moved in on average 17 years ago