Housing density: 208 houses/condos per square mile
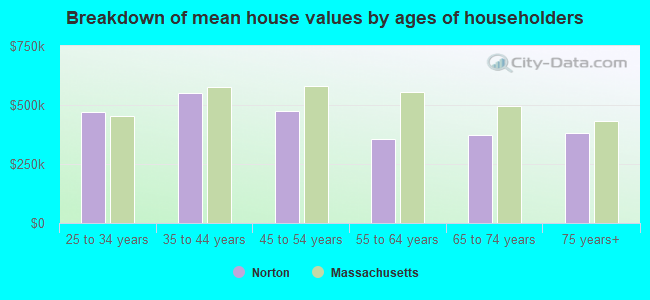
Median price asked for vacant for-sale houses and condos in 2022 in this county: $509,684.
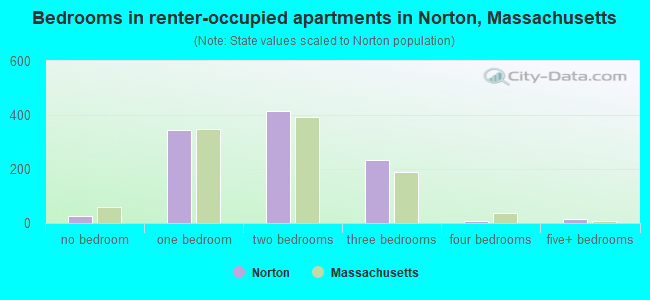
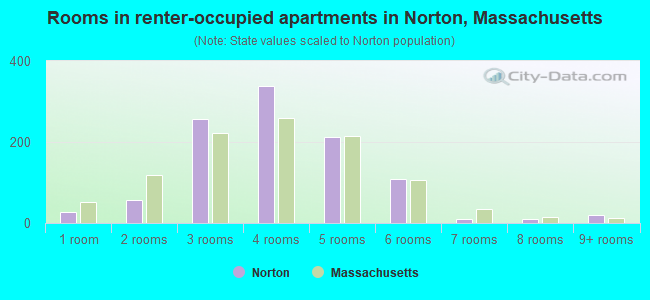
Median contract rent in 2022: $1,239 (lower quartile is $778, upper quartile is $1,752)
Median rent asked for vacant for-rent units in 2022: $1,581
Median gross rent in Norton, MA in 2022: $1,382
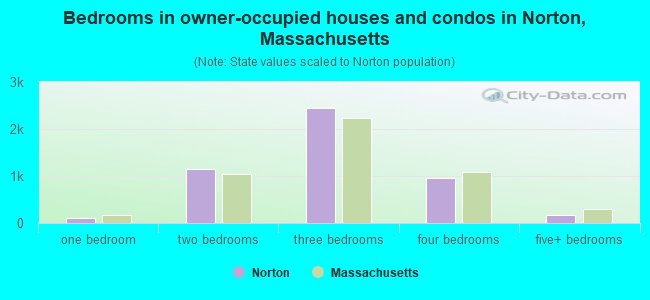
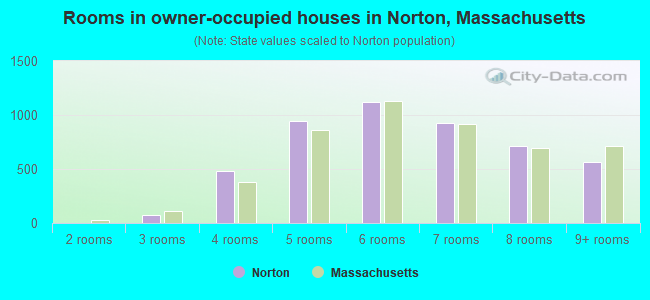
Housing units in Norton with a mortgage: 3,463 (360 second mortgage, 634 home equity loan, 24 both second mortgage and home equity loan) Houses without a mortgage: 626
In family households: 444,740 (93,440 male householders, 47,898 female householders)
101,208 spouses, 160,791 children (151,812 natural, 3,293 adopted, 5,686 stepchildren), 9,612 grandchildren, 4,550 brothers or sisters, 5,590 parents, foster children, 4,929 other relatives, 12,847 non-relatives
In nonfamily households: 87,677 (32,955 male householders (25,495 living alone)), 38,717 female householders (32,941 living alone)), 16,005 nonrelatives
In group quarters: 15,868 (6,219 institutionalized population)
88,038 married couples with children.
33,142 single-parent households (5,908 men, 27,234 women).
94.9% of residents of Norton speak English at home.
1.2% of residents speak Spanish at home (93% speak English very well, 7% speak English not well).
3.4% of residents speak other Indo-European language at home (75% speak English very well, 19% speak English well, 5% speak English not well, 1% don't speak English at all).
0.4% of residents speak Asian or Pacific Island language at home (68% speak English very well, 10% speak English well, 22% speak English not well).
0.2% of residents speak other language at home (100% speak English very well).
Foreign born population: 814 (4.2%)
(60.2% of them are naturalized citizens)
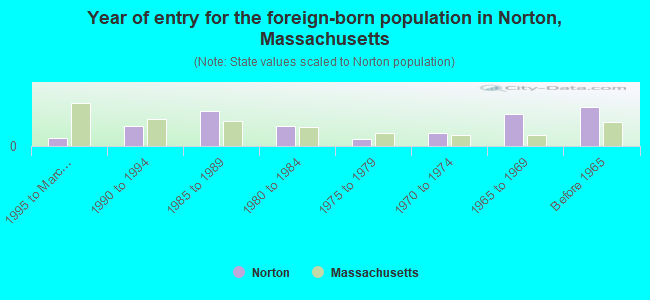
Year of entry for the foreign-born population in Norton, Massachusetts
311995 to March 2000
731990 to 1994
1291985 to 1989
731980 to 1984
261975 to 1979
481970 to 1974
1181965 to 1969
144Before 1965
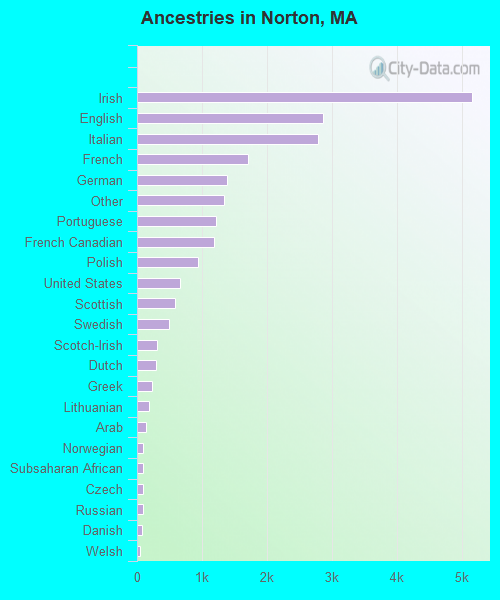
First ancestries reported:
Irish: 5,162 (23.3%)
English: 2,865 (12.9%)
Italian: 2,781 (12.6%)
French: 1,709 (7.7%)
German: 1,391 (6.3%)
Other: 1,340 (6.1%)
Portuguese: 1,219 (5.5%)
French Canadian: 1,191 (5.4%)
Polish: 942 (4.3%)
United States: 659 (3.0%)
Scottish: 592 (2.7%)
Swedish: 488 (2.2%)
Scotch-Irish: 315 (1.4%)
Dutch: 300 (1.4%)
Greek: 227 (1.0%)
Lithuanian: 189 (0.9%)
Arab: 142 (0.6%)
Norwegian: 100 (0.5%)
Subsaharan African: 98 (0.4%)
Czech: 97 (0.4%)
Russian: 97 (0.4%)
Danish: 70 (0.3%)
Welsh: 47 (0.2%)
Ukrainian: 31 (0.1%)
West Indian: 30 (0.1%)
Swiss: 27 (0.1%)
Hungarian: 15 (0.07%)
Most common places of birth for foreign-born residents (%):
Portugal
Norton:
20.6% (132)
Massachusetts:
8.6% (66,627)
United Kingdom
Norton:
10.0% (64)
Massachusetts:
3.3% (25,403)
Poland
Norton:
8.9% (57)
Massachusetts:
1.8% (13,543)
Germany
Norton:
8.4% (54)
Massachusetts:
1.9% (14,883)
Italy
Norton:
6.1% (39)
Massachusetts:
3.7% (28,319)
Canada
Norton:
4.8% (31)
Massachusetts:
5.2% (40,247)
Netherlands
Norton:
3.6% (23)
Massachusetts:
0.3% (2,470)
Other Eastern Africa
Norton:
3.3% (21)
Massachusetts:
0.7% (5,693)
India
Norton:
3.1% (20)
Massachusetts:
3.6% (28,086)
Indonesia
Norton:
3.1% (20)
Massachusetts:
0.2% (1,303)
Greece
Norton:
3.0% (19)
Massachusetts:
1.7% (12,975)
Lebanon
Norton:
2.8% (18)
Massachusetts:
0.9% (6,691)
Ireland
Norton:
2.6% (17)
Massachusetts:
2.3% (17,987)
Other Northern Africa
Norton:
2.6% (17)
Massachusetts:
0.5% (3,810)
Philippines
Norton:
2.3% (15)
Massachusetts:
1.0% (7,414)
China, excluding Hong Kong and Taiwan
Norton:
2.0% (13)
Massachusetts:
5.1% (39,255)
Other Western Europe
Norton:
1.9% (12)
Massachusetts:
0.3% (2,642)
Hong Kong
Norton:
1.9% (12)
Massachusetts:
1.0% (7,937)
Korea
Norton:
1.9% (12)
Massachusetts:
1.7% (13,456)
Place of birth for U.S.-born residents:
This state: 13,054
Other state: 4,239
Northeast: 3,122
Midwest: 306
South: 426
West: 385
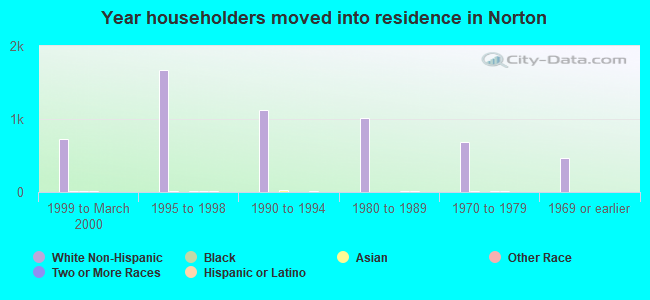
58% of Norton residents lived in the same house 5 years ago. Out of people who lived in different houses, 48% lived in this county. Out of people who lived in different counties, 60% lived in Massachusetts.
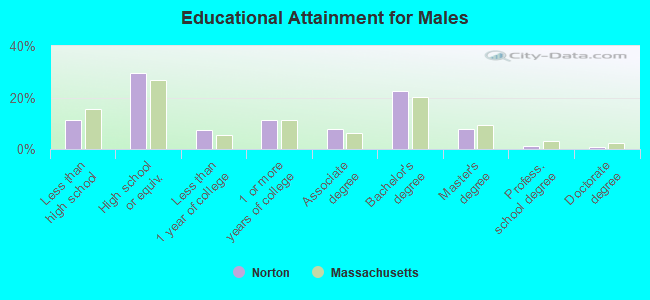
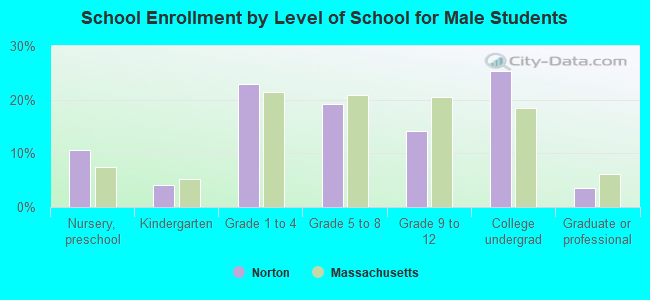
Education attainment for males 25 years and older:
No schooling: 16
Nursery to 4th grade: 6
5th and 6th grade: 20
7th and 8th grade: 73
9th grade: 80
10th grade: 106
11th grade: 107
12th grade, no diploma: 163
High school graduate (or equivalency): 1,527
Less than 1 year of college: 384
Some college more than 1 year, no degree: 590
Associate degree: 405
Bachelor's degree: 1,164
Master's degree: 404
Professional school degree: 64
Doctorate degree: 47
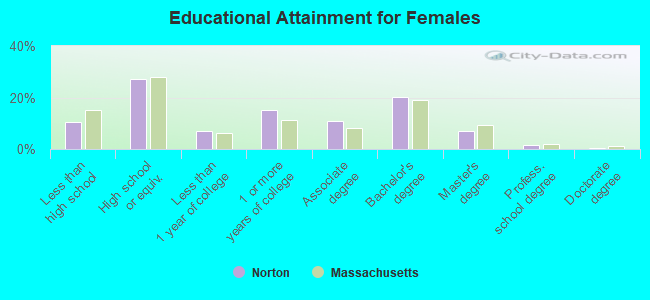
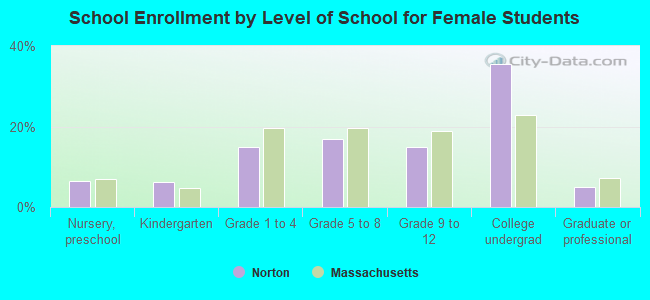
Education attainment for females 25 years and older:
No schooling: 19
Nursery to 4th grade: 10
5th and 6th grade: 10
7th and 8th grade: 106
9th grade: 152
10th grade: 129
11th grade: 57
12th grade, no diploma: 125
High school graduate (or equivalency): 1,559
Less than 1 year of college: 398
Some college more than 1 year, no degree: 867
Associate degree: 610
Bachelor's degree: 1,163
Master's degree: 404
Professional school degree: 81
Doctorate degree: 23
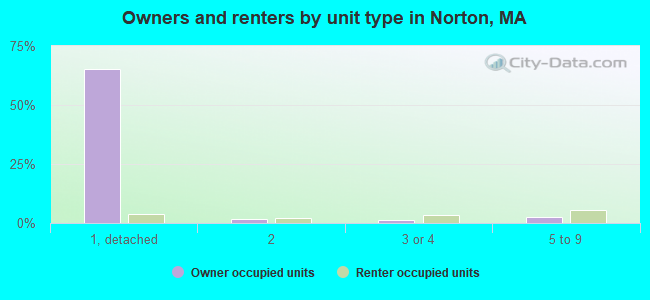
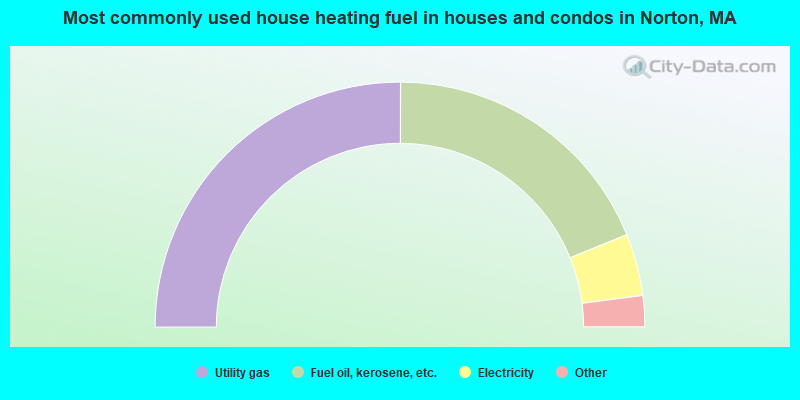
Housing units in structures:
One, detached: 4,108
One, attached: 527
Two: 239
3 or 4: 250
5 to 9: 493
10 to 19: 63
20 to 49: 27
50 or more: 55
Mobile homes: 199
Median worth of mobile homes: $250,310
Housing units lacking complete plumbing facilities: 0.3%
Housing units lacking complete kitchen facilities: 0.6%