Piney Green, NC (North Carolina) Houses and Residents
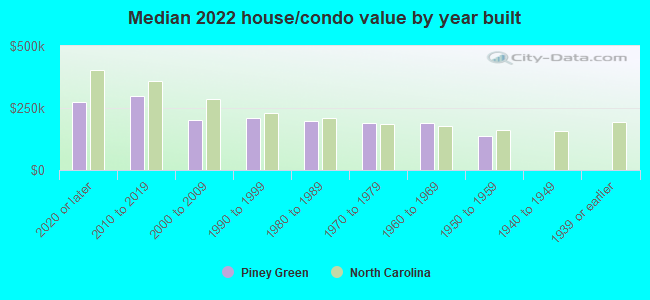
| Piney Green: | $218,808 |
| North Carolina: | $280,600 |
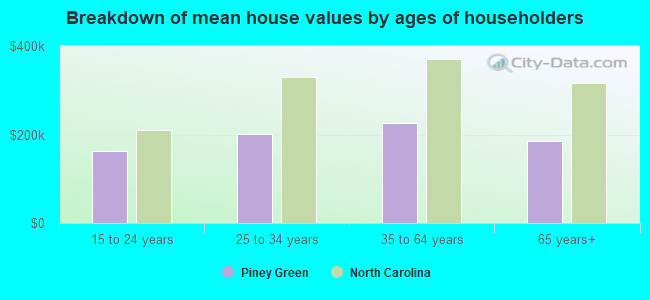
Mean price in 2022:
Detached houses: $248,905
Here: $248,905 State: $375,326 Townhouses or other attached units: $156,220
Here: $156,220 State: $317,935 In 3-to-4-unit structures: $161,498
Here: $161,498 State: $254,939 Mobile homes: $50,892
Here: $50,892 State: $124,933
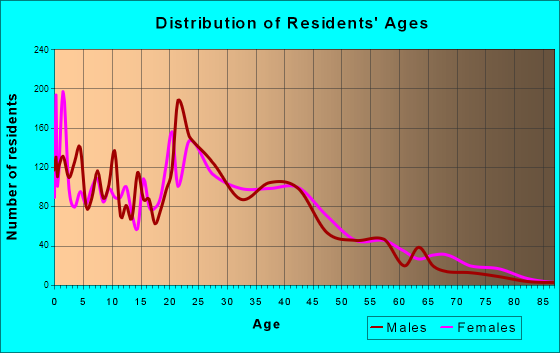
Total population: 13,293 (Urban population: 11,272, Rural population: 449 (16 farm, 433 nonfarm))
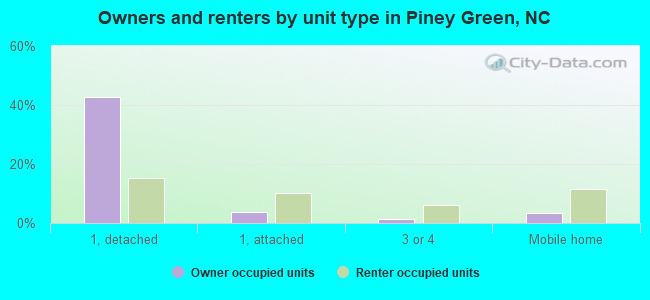
Houses: 6,315 (5,535 occupied: 3,285 owner occupied, 2,427 renter occupied)
| % of renters here: | 42% |
| State: | 33% |
Housing density: 471 houses/condos per square mile
Median price asked for vacant for-sale houses and condos in 2022: $1,356,245.
Median contract rent in 2022: $815 (lower quartile is $614, upper quartile is $1,097)
Median rent asked for vacant for-rent units in 2022: $1,474
Median gross rent in Piney Green, NC in 2022: $1,019
Housing units in Piney Green with a mortgage: 2,771 (104 second mortgage, 4 home equity loan, 119 both second mortgage and home equity loan)
Houses without a mortgage: 25
Median household income for houses/condos with a mortgage: $70,501
Median household income for apartments without a mortgage: $47,054
Median monthly housing costs: $1,090
Compare current foreclosures near Piney Green, NC:
| Photo | Address | Area | Beds / Baths | Price | Details |
|---|---|---|---|---|---|

|
#1
Poults Dr
Richlands, NC 28574
|
- sq. feet
|
3 baths 3 beds |
show details | |

|
#2
Plantation Blvd
Jacksonville, NC 28540
|
2,630 sq. feet
|
2 baths 4 beds |
show details | |

|
#3
Woodland Dr
Swansboro, NC 28584
|
1,176 sq. feet
|
2 baths 3 beds |
show details | |

|
#4
Waters Rd
Jacksonville, NC 28546
|
1,296 sq. feet
|
3 baths 4 beds |
show details | |

|
#5
Maplehurst Dr
Jacksonville, NC 28540
|
2,070 sq. feet
|
2 baths 3 beds |
show details | |

|
#6
Harbord Dr
Midway Park, NC 28544
|
1,550 sq. feet
|
2 baths 3 beds |
show details | |

|
#7
Walnut Dr
Jacksonville, NC 28540
|
1,040 sq. feet
|
2 baths 3 beds |
show details | |

|
#8
Maidstone Dr
Richlands, NC 28574
|
2,236 sq. feet
|
2 baths 3 beds |
show details | |

|
#9
Mcarthur Dr
Jacksonville, NC 28546
|
1,050 sq. feet
|
1 baths 3 beds |
show details | |

|
#10
Chief Ct
Jacksonville, NC 28546
|
1,448 sq. feet
|
2 baths 3 beds |
show details |
| Photo | Address | Area | Beds / Baths | Price | Details |
|---|---|---|---|---|---|

|
#11
S Glen Ct
Jacksonville, NC 28540
|
1,645 sq. feet
|
2 baths 3 beds |
show details | |

|
#12
Hunting Green Dr
Jacksonville, NC 28546
|
1,020 sq. feet
|
1 baths 3 beds |
show details | |

|
#13
Shipmans Pike
Jacksonville, NC 28546
|
1,674 sq. feet
|
2 baths 3 beds |
show details | |

|
#14
Avon Dr
Hubert, NC 28539
|
2,872 sq. feet
|
3 baths 3 beds |
show details | |

|
#15
E Ivybridge Dr
Hubert, NC 28539
|
1,519 sq. feet
|
2 baths 3 beds |
show details | |

|
#16
Crooked Creek Rd
Jacksonville, NC 28540
|
2,360 sq. feet
|
2 baths 5 beds |
show details | |

|
#17
Silver Creek Landing Rd
Swansboro, NC 28584
|
3,142 sq. feet
|
2 baths 4 beds |
show details | |

|
#18
Pond Dr
Hubert, NC 28539
|
1,524 sq. feet
|
2 baths 3 beds |
show details | |

|
#19
Hwy 58 S
Maysville, NC 28555
|
1,772 sq. feet
|
2 baths 3 beds |
show details | |

|
#20
Autumn Cove Ct
Jacksonville, NC 28546
|
2,476 sq. feet
|
2 baths 4 beds |
show details |
| Photo | Address | Area | Beds / Baths | Price | Details |
|---|---|---|---|---|---|

|
#21
Runnymeade Dr
Jacksonville, NC 28540
|
2,594 sq. feet
|
2 baths 4 beds |
show details | |

|
#22
Albany Dr
Jacksonville, NC 28540
|
1,696 sq. feet
|
2 baths 3 beds |
show details | |

|
#23
Durban Ln
Jacksonville, NC 28546
|
1,333 sq. feet
|
2 baths 3 beds |
show details | |

|
#24
Woodleaf Ln
Jacksonville, NC 28540
|
1,296 sq. feet
|
2 baths 3 beds |
show details | |

|
#25
Westmont Rd
Jacksonville, NC 28540
|
2,130 sq. feet
|
2 baths 4 beds |
show details | |

|
#26
Winding Creek Way
Hubert, NC 28539
|
1,829 sq. feet
|
2 baths 3 beds |
show details | |

|
#27
Natalie Ln
Hubert, NC 28539
|
1,590 sq. feet
|
2 baths 3 beds |
show details | |

|
#28
W Volant St
Hubert, NC 28539
|
1,140 sq. feet
|
2 baths 3 beds |
show details | |

|
#29
Buccaneer Ct
Swansboro, NC 28584
|
2,264 sq. feet
|
2 baths 4 beds |
show details | |

|
#30
Sanders Dr
Hubert, NC 28539
|
2,951 sq. feet
|
2 baths 4 beds |
show details |
| Photo | Address | Area | Beds / Baths | Price | Details |
|---|---|---|---|---|---|

|
#31
Savannah Dr
Jacksonville, NC 28546
|
1,840 sq. feet
|
2 baths 3 beds |
show details | |

|
#32
Deppe Rd
Maysville, NC 28555
|
1,344 sq. feet
|
2 baths 3 beds |
show details | |

|
#33
Richmond Dr
Jacksonville, NC 28540
|
2,269 sq. feet
|
2 baths 4 beds |
show details | |

|
#34
Fulcher Landing Rd
Sneads Ferry, NC 28460
|
2,114 sq. feet
|
2 baths 3 beds |
show details | |

|
#35
Zion Ln
Sneads Ferry, NC 28460
|
1,782 sq. feet
|
2 baths 4 beds |
show details | |

|
#36
English Ct
Hubert, NC 28539
|
1,077 sq. feet
|
2 baths 3 beds |
show details | |

|
#37
Blue Top Rd
Jacksonville, NC 28540
|
2,665 sq. feet
|
4 baths 2 beds |
show details | |

|
#38
Old Timber Rd
Jacksonville, NC 28540
|
1,344 sq. feet
|
2 baths 3 beds |
show details | |

|
#39
Ellen Ct
Jacksonville, NC 28540
|
1,268 sq. feet
|
2 baths 3 beds |
show details | |

|
#40
Maiden Ct
Jacksonville, NC 28546
|
1,227 sq. feet
|
2 baths 3 beds |
show details |
| Photo | Address | Area | Beds / Baths | Price | Details |
|---|---|---|---|---|---|

|
#41
James Waters Pl
Jacksonville, NC 28540
|
1,216 sq. feet
|
2 baths 3 beds |
show details | |

|
#42
Mcallister Rd
Jacksonville, NC 28540
|
1,560 sq. feet
|
2 baths 3 beds |
show details | |

|
#43
High Hill Rd
Jacksonville, NC 28540
|
1,348 sq. feet
|
2 baths 3 beds |
show details | |

|
#44
Mendover Dr
Jacksonville, NC 28546
|
2,462 sq. feet
|
2 baths 3 beds |
show details | |

|
#45
Main Street Ext
Swansboro, NC 28584
|
1,320 sq. feet
|
2 baths 3 beds |
show details | |

|
#46
Blue Crab Ct
Swansboro, NC 28584
|
2,052 sq. feet
|
2 baths 4 beds |
show details | |

|
#47
Channel Marker Loop
Swansboro, NC 28584
|
1,921 sq. feet
|
2 baths 3 beds |
show details | |

|
#48
Cormorant Dr
Swansboro, NC 28584
|
2,160 sq. feet
|
2 baths 3 beds |
show details | |

|
#49
Longwood Dr
Stella, NC 28582
|
1,448 sq. feet
|
2 baths 3 beds |
show details | |

|
Check over 1 million property listings on Foreclosure.com!
|
browse all offers | |||


 | Moving home and residential rental business to Jacksonville NC area (3 replies) |
| New Bern or Havelock???? HELP (32 replies) |
| Young family trying to relocate to coastal nc (14 replies) |
| What areas near camp lejeune are good for young family to live? (31 replies) |
| Richlands (1 reply) |
| If my husband lands a job in J'sonville...*where* should we look to live? (23 replies) |
Median year apartment built: 1986
Household type by relationship:
Households: 15,028- Male householders: 3,071 (645 living alone), Female householders: 2,368 (477 living alone)
3,036 spouses (3,022 opposite-sex spouses), 321 unmarried partners, (321 opposite-sex unmarried partners), 4,810 children (4,526 natural, 45 adopted, 238 stepchildren), 389 grandchildren, 153 brothers or sisters, 292 parents, 0 foster children, 178 other relatives, 382 non-relatives
- In group quarters: 23
Size of family households: 1,565 2-persons, 1,098 3-persons, 784 4-persons, 442 5-persons, 144 6-persons, 55 7-or-more-persons.
Size of nonfamily households: 1,244 1-person, 186 2-persons, 158 3-persons, 18 4-persons.
2,735 married couples with children.
1,005 single-parent households (125 men, 880 women).
89.4% of residents of Piney Green speak English at home.
7.3% of residents speak Spanish at home (75% speak English very well, 8% speak English well, 10% speak English not well, 7% don't speak English at all).
0.1% of residents speak other Indo-European language at home (100% speak English very well).
2.5% of residents speak Asian or Pacific Island language at home (52% speak English very well, 14% speak English well, 34% speak English not well).
0.3% of residents speak other language at home (16% speak English very well, 84% speak English not well).
Foreign born population: 717 (4.8%)
(73.8% of them are naturalized citizens)
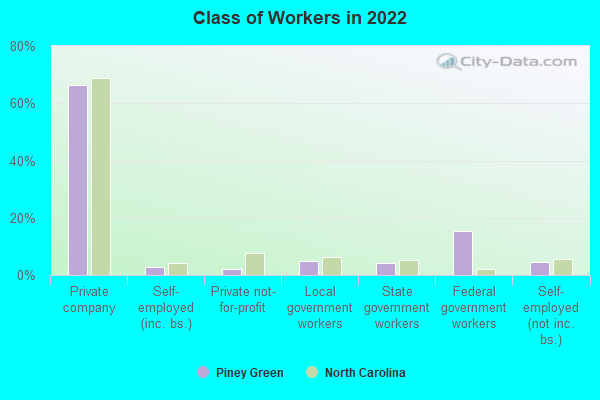
| Here: | 6.6 |
| State: | 6.4 |
| Here: | 4.3 |
| State: | 4.4 |
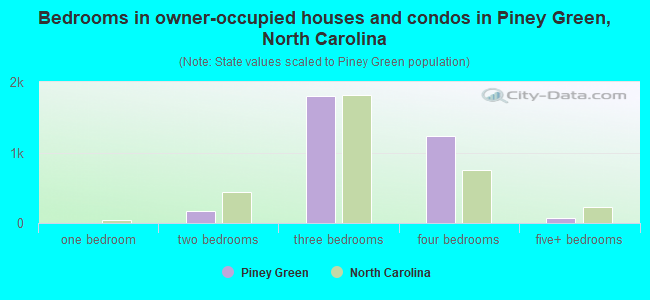
- Bedrooms in owner-occupied houses and condos in Piney Green, North Carolina
- 0no bedroom
- 01 bedroom
- 1662 bedrooms
- 1,8083 bedrooms
- 1,2404 bedrooms
- 725+ bedrooms
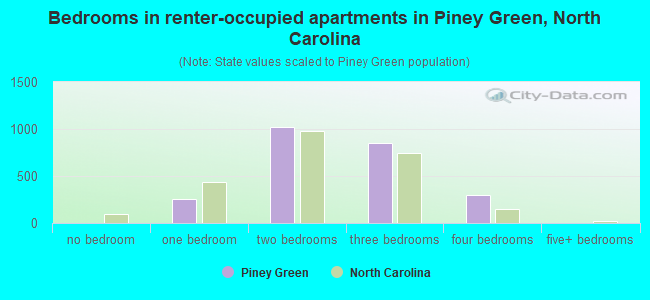
- Bedrooms in renter-occupied apartments in Piney Green, North Carolina
- 0no bedroom
- 2571 bedroom
- 1,0192 bedrooms
- 8503 bedrooms
- 3024 bedrooms
- 05+ bedrooms
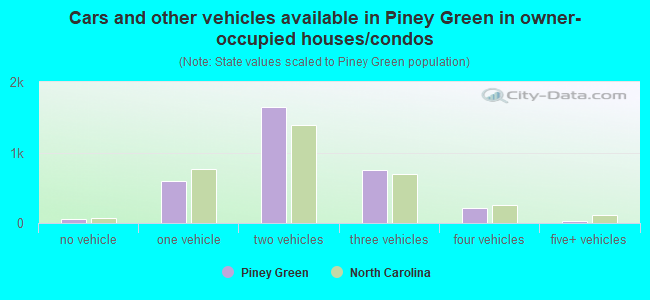
- Cars and other vehicles available in Piney Green in owner-occupied houses/condos
- 50no vehicle
- 5991 vehicle
- 1,6442 vehicles
- 7553 vehicles
- 2094 vehicles
- 295+ vehicles
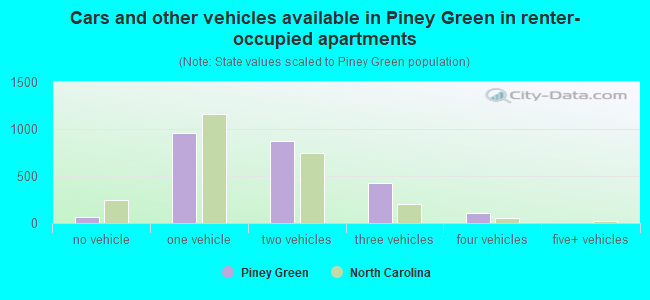
- Cars and other vehicles available in Piney Green in renter-occupied apartments
- 64no vehicle
- 9541 vehicle
- 8752 vehicles
- 4253 vehicles
- 1084 vehicles
- 05+ vehicles
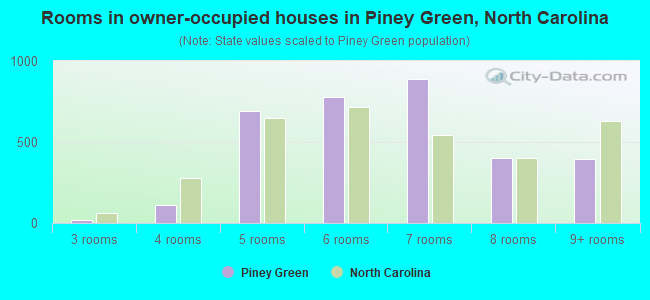
- Rooms in owner-occupied houses in Piney Green, North Carolina
- 01 room
- 02 rooms
- 163 rooms
- 1114 rooms
- 6935 rooms
- 7786 rooms
- 8897 rooms
- 4038 rooms
- 3959+ rooms
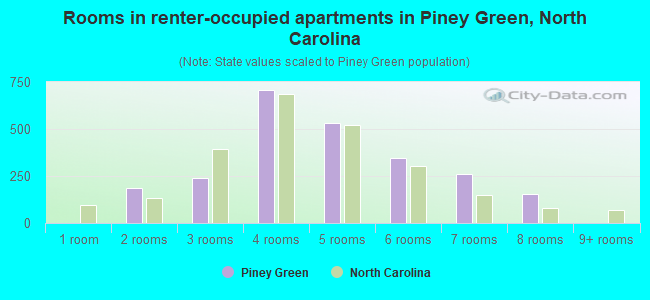
- Rooms in renter-occupied apartments in Piney Green, North Carolina
- 01 room
- 1872 rooms
- 2403 rooms
- 7074 rooms
- 5345 rooms
- 3446 rooms
- 2637 rooms
- 1528 rooms
- 09+ rooms
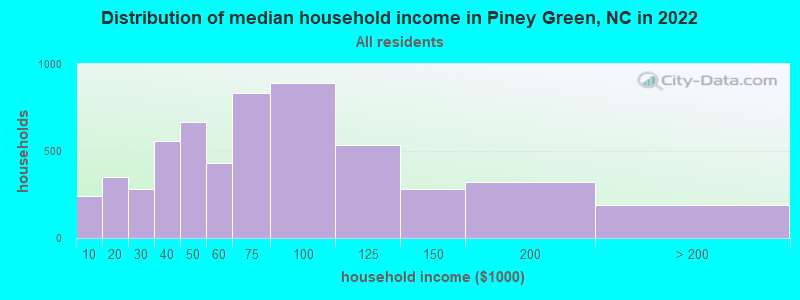
Piney Green, NC household income distribution

- 244Less than $10,000
- 351$10,000 to $19,999
- 283$20,000 to $29,999
- 556$30,000 to $39,999
- 664$40,000 to $49,999
- 432$50,000 to $59,999
- 831$60,000 to $74,999
- 891$75,000 to $99,999
- 534$100,000 to $124,999
- 284$125,000 to $149,999
- 319$150,000 to $199,999
- 190$200,000 or more
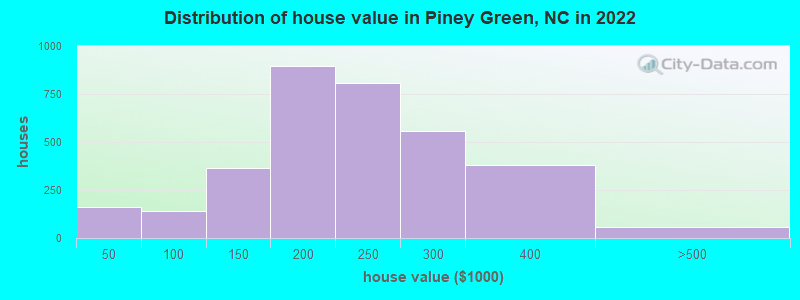
Home value of owner - occupied houses in 2022 in Piney Green, NC
-
- 34$10,000 to $14,999
- 36$15,000 to $19,999
- 27$20,000 to $24,999
- 11$25,000 to $29,999
- 32$30,000 to $34,999
- 18$35,000 to $39,999
- 27$50,000 to $59,999
- 9$60,000 to $69,999
- 20$70,000 to $79,999
- 82$90,000 to $99,999
- 252$100,000 to $124,999
- 112$125,000 to $149,999
- 295$150,000 to $174,999
- 599$175,000 to $199,999
- 807$200,000 to $249,999
- 557$250,000 to $299,999
- 381$300,000 to $399,999
- 56$400,000 to $499,999
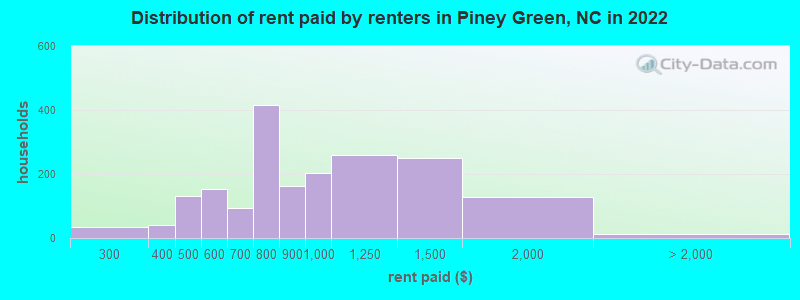
Rent paid by renters in 2022 in Piney Green, NC
-
- 34$200 to $249
- 41$300 to $349
- 6$400 to $449
- 123$450 to $499
- 52$500 to $549
- 99$550 to $599
- 80$600 to $649
- 14$650 to $699
- 254$700 to $749
- 160$750 to $799
- 162$800 to $899
- 204$900 to $999
- 258$1,000 to $1,249
- 249$1,250 to $1,499
- 128$1,500 to $1,999
- 10No cash rent
Percentage of workers working in this county: 90.1%
Number of people working at home: 797 (10.6% of all workers)
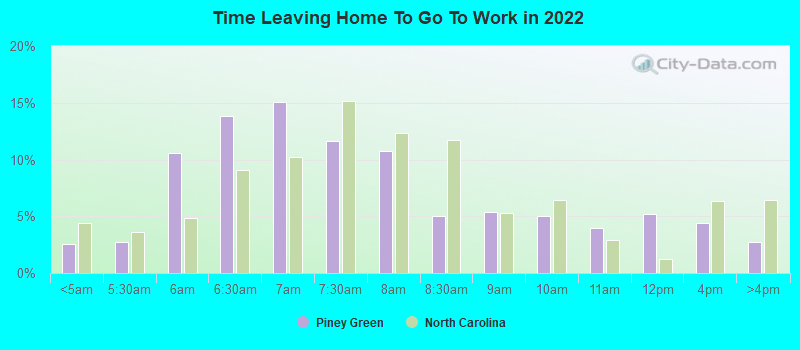
Travel time to work (commute)
- Less than 5 minutes: 80
- 5 to 9 minutes: 338
- 10 to 14 minutes: 961
- 15 to 19 minutes: 1,334
- 20 to 24 minutes: 1,852
- 25 to 29 minutes: 760
- 30 to 34 minutes: 601
- 35 to 39 minutes: 64
- 40 to 44 minutes: 114
- 45 to 59 minutes: 201
- 60 to 89 minutes: 192
- 90 or more minutes: 78
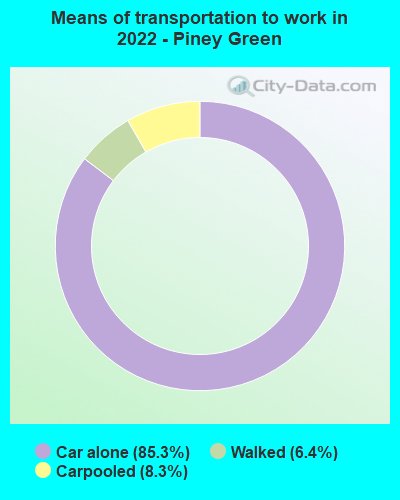
Means of transportation to work:
- Drove a car alone: 538 (42.9%)
- Carpooled: 54 (4.3%)
- Walked: 43 (3.4%)
- Worked at home: 797 (63.6%)
- Unemployment by race in 2022
- Unemployment rate for White non-Hispanic residents
- 4.1%Males
- 5.2%Females
- Unemployment rate for Black residents
- 18.3%Males
- 3.9%Females
- Unemployment rate for American Indian and Alaska Native residents
- 82.7%Males
- Unemployment rate for Asian residents
- 27.9%Females
- Unemployment rate for two or more race residents
- 0.2%Females
- Unemployment rate for Hispanic or Latino residents
- 4.8%Males
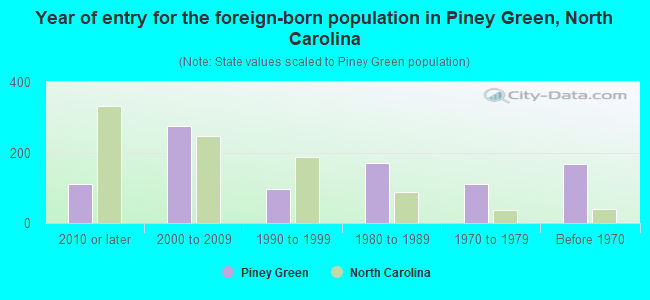
- Year of entry for the foreign-born population in Piney Green, North Carolina
- 1122010 or later
- 2762000 to 2009
- 961990 to 1999
- 1711980 to 1989
- 1101970 to 1979
- 167Before 1970
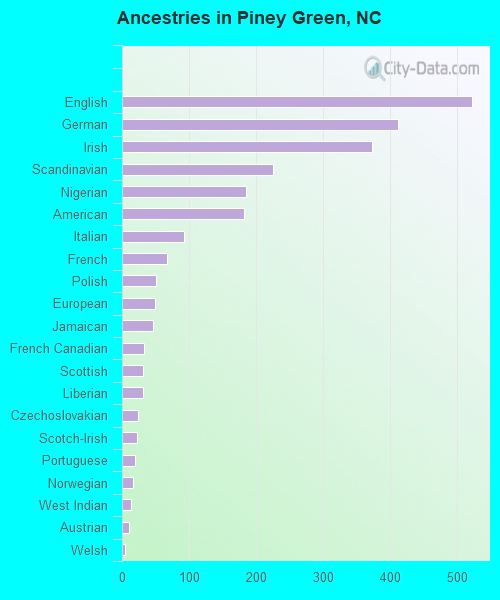
First ancestries reported:
- English: 522 (8.5%)
- German: 412 (6.7%)
- Irish: 374 (6.1%)
- Scandinavian: 226 (3.7%)
- Nigerian: 185 (3.0%)
- American: 182 (3.0%)
- Italian: 93 (1.5%)
- French: 67 (1.1%)
- Polish: 51 (0.8%)
- European: 49 (0.8%)
- Jamaican: 46 (0.7%)
- French Canadian: 33 (0.5%)
- Scottish: 32 (0.5%)
- Liberian: 32 (0.5%)
- Czechoslovakian: 24 (0.4%)
- Scotch-Irish: 23 (0.4%)
- Portuguese: 19 (0.3%)
- Norwegian: 17 (0.3%)
- West Indian: 13 (0.2%)
- Austrian: 11 (0.2%)
- Welsh: 5 (0.08%)
- African: 2 (0.03%)
Most common places of birth for foreign-born residents (%):
| Piney Green: | 23.5% (159) |
| North Carolina: | 3.8% (33,379) |
| Piney Green: | 17.8% (120) |
| North Carolina: | 3.2% (27,477) |
| Piney Green: | 12.4% (84) |
| North Carolina: | 0.1% (537) |
| Piney Green: | 10.7% (72) |
| North Carolina: | 1.3% (11,419) |
| Piney Green: | 9.8% (66) |
| North Carolina: | 0.7% (5,941) |
| Piney Green: | 7.5% (51) |
| North Carolina: | 2.4% (20,695) |
| Piney Green: | 4.3% (29) |
| North Carolina: | 0.5% (4,475) |
| Piney Green: | 4.1% (28) |
| North Carolina: | 1.8% (15,988) |
| Piney Green: | 3.3% (22) |
| North Carolina: | 1.1% (9,173) |
| Piney Green: | 2.4% (16) |
| North Carolina: | 2.1% (18,275) |
| Piney Green: | 2.2% (15) |
| North Carolina: | 0.1% (635) |
| Piney Green: | 2.2% (15) |
| North Carolina: | 0.1% (752) |
| Piney Green: | 1.8% (12) |
| North Carolina: | 0.3% (3,031) |
Place of birth for U.S.-born residents:
- This state: 5,062
- Other state: 8,591
- Northeast: 2,089
- Midwest: 1,745
- South: 3,591
- West: 1,146
84.9% of Piney Green residents lived in the same house 1 years ago.
Out of people who lived in different houses, 33.7% lived in this county.
Out of people who lived in different counties, 51.0% lived in North Carolina.
| Piney Green: | 84.9% |
| State average: | 87.3% |
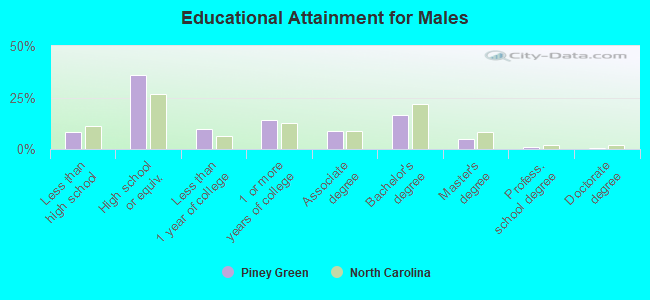
Education attainment for males 25 years and older:
- No schooling: 71
- Nursery to 4th grade: 0
- 5th and 6th grade: 28
- 7th and 8th grade: 13
- 9th grade: 12
- 10th grade: 115
- 11th grade: 45
- 12th grade, no diploma: 43
- High school graduate (or equivalency): 1,384
- Less than 1 year of college: 371
- Some college more than 1 year, no degree: 555
- Associate degree: 341
- Bachelor's degree: 647
- Master's degree: 184
- Professional school degree: 42
- Doctorate degree: 26
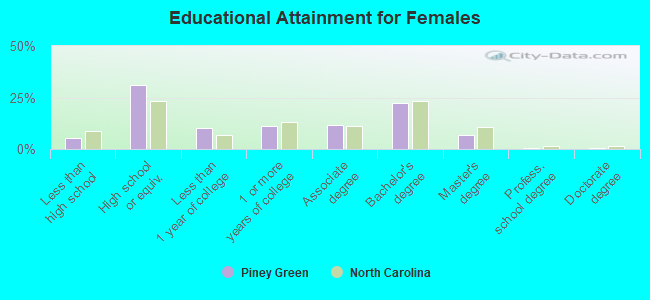
Education attainment for females 25 years and older:
- No schooling: 0
- Nursery to 4th grade: 0
- 5th and 6th grade: 41
- 7th and 8th grade: 14
- 9th grade: 1
- 10th grade: 45
- 11th grade: 133
- 12th grade, no diploma: 25
- High school graduate (or equivalency): 1,477
- Less than 1 year of college: 492
- Some college more than 1 year, no degree: 521
- Associate degree: 561
- Bachelor's degree: 1,062
- Master's degree: 323
- Professional school degree: 23
- Doctorate degree: 18
Housing units in structures:
- One, detached: 4,351
- One, attached: 696
- Two: 122
- 3 or 4: 289
- 5 to 9: 16
- 10 to 19: 34
- 20 to 49: 155
- Mobile homes: 649
Median worth of mobile homes: $39,269
Housing units lacking complete kitchen facilities in 2022: 3.4%
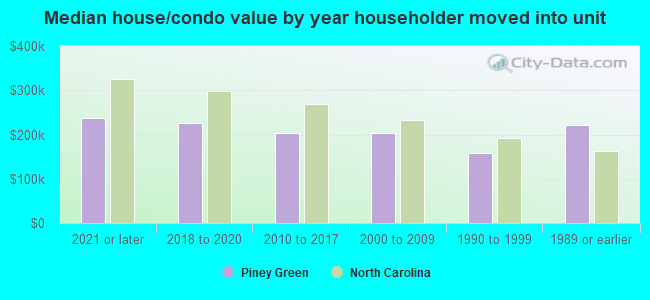
House/condo owner moved in on average 6 years ago
Renter moved in on average 4 years ago
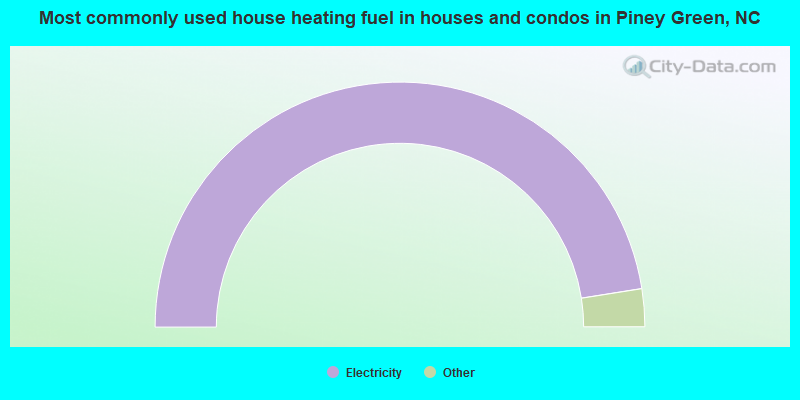
- 95.0%Electricity
- 2.2%Bottled, tank, or LP gas
- 1.6%Utility gas
- 0.8%No fuel used
- 0.5%Fuel oil, kerosene, etc.
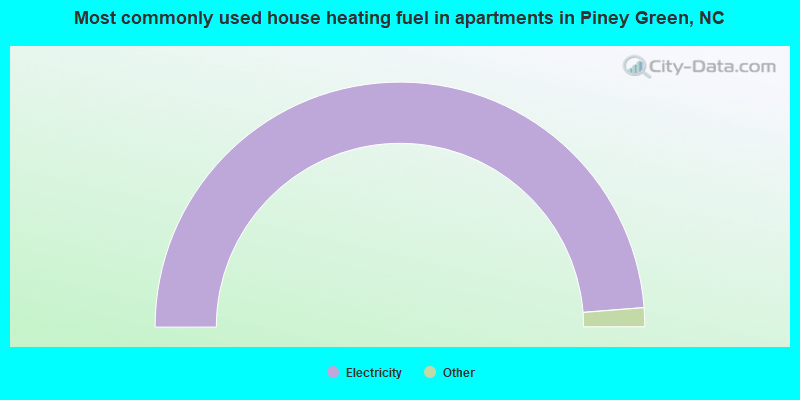
- 97.5%Electricity
- 1.4%Bottled, tank, or LP gas
- 1.1%Utility gas
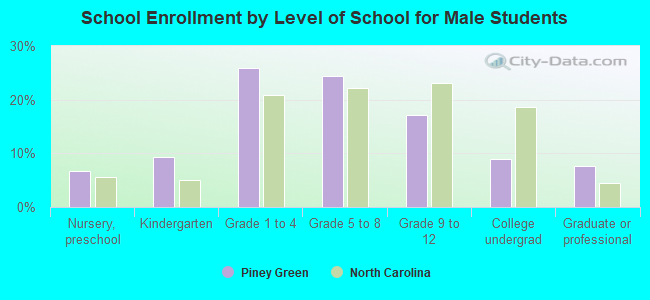
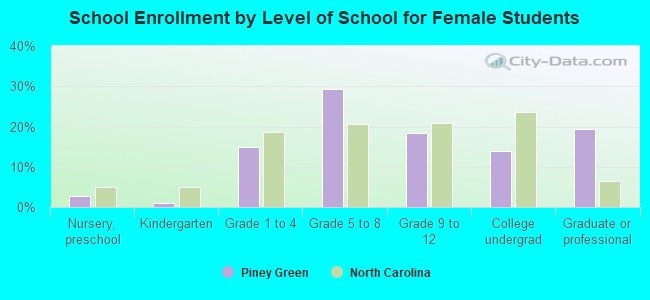
Private vs. public school enrollment:
| Here: | 12.3% |
| North Carolina: | 13.8% |
| Here: | 4.6% |
| North Carolina: | 11.9% |
| Here: | 46.7% |
| North Carolina: | 19.3% |