South Valley, New Mexico Submit your own pictures of this place and show them to the world
OSM Map
General Map
Google Map
MSN Map
OSM Map
General Map
Google Map
MSN Map
OSM Map
General Map
Google Map
MSN Map
OSM Map
General Map
Google Map
MSN Map
Please wait while loading the map...
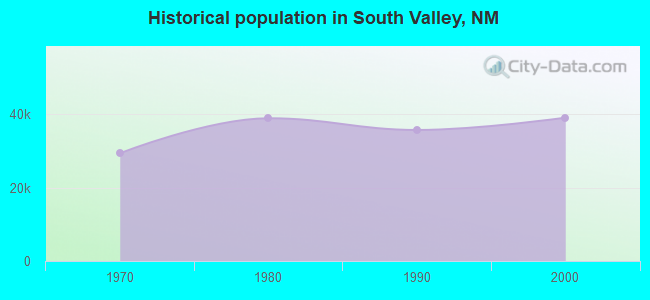
Population in 2010: 40,976. Population change since 2000: +4.9%Males: 20,861 Females: 20,115
March 2022 cost of living index in South Valley: 93.5 (less than average, U.S. average is 100) Percentage of residents living in poverty in 2022: 21.0%for White Non-Hispanic residents , 34.6% for Black residents , 20.6% for Hispanic or Latino residents , 36.6% for American Indian residents , 19.0% for other race residents , 16.6% for two or more races residents )Business Search - 14 Million verified businesses
Data:
Median household income ($)
Median household income (% change since 2000)
Household income diversity
Ratio of average income to average house value (%)
Ratio of average income to average rent
Median household income ($) - White
Median household income ($) - Black or African American
Median household income ($) - Asian
Median household income ($) - Hispanic or Latino
Median household income ($) - American Indian and Alaska Native
Median household income ($) - Multirace
Median household income ($) - Other Race
Median household income for houses/condos with a mortgage ($)
Median household income for apartments without a mortgage ($)
Races - White alone (%)
Races - White alone (% change since 2000)
Races - Black alone (%)
Races - Black alone (% change since 2000)
Races - American Indian alone (%)
Races - American Indian alone (% change since 2000)
Races - Asian alone (%)
Races - Asian alone (% change since 2000)
Races - Hispanic (%)
Races - Hispanic (% change since 2000)
Races - Native Hawaiian and Other Pacific Islander alone (%)
Races - Native Hawaiian and Other Pacific Islander alone (% change since 2000)
Races - Two or more races (%)
Races - Two or more races (% change since 2000)
Races - Other race alone (%)
Races - Other race alone (% change since 2000)
Racial diversity
Unemployment (%)
Unemployment (% change since 2000)
Unemployment (%) - White
Unemployment (%) - Black or African American
Unemployment (%) - Asian
Unemployment (%) - Hispanic or Latino
Unemployment (%) - American Indian and Alaska Native
Unemployment (%) - Multirace
Unemployment (%) - Other Race
Population density (people per square mile)
Population - Males (%)
Population - Females (%)
Population - Males (%) - White
Population - Males (%) - Black or African American
Population - Males (%) - Asian
Population - Males (%) - Hispanic or Latino
Population - Males (%) - American Indian and Alaska Native
Population - Males (%) - Multirace
Population - Males (%) - Other Race
Population - Females (%) - White
Population - Females (%) - Black or African American
Population - Females (%) - Asian
Population - Females (%) - Hispanic or Latino
Population - Females (%) - American Indian and Alaska Native
Population - Females (%) - Multirace
Population - Females (%) - Other Race
Coronavirus confirmed cases (May 02, 2024)
Deaths caused by coronavirus (May 02, 2024)
Coronavirus confirmed cases (per 100k population) (May 02, 2024)
Deaths caused by coronavirus (per 100k population) (May 02, 2024)
Daily increase in number of cases (May 02, 2024)
Weekly increase in number of cases (May 02, 2024)
Cases doubled (in days) (May 02, 2024)
Hospitalized patients (Apr 18, 2022)
Negative test results (Apr 18, 2022)
Total test results (Apr 18, 2022)
COVID Vaccine doses distributed (per 100k population) (Sep 19, 2023)
COVID Vaccine doses administered (per 100k population) (Sep 19, 2023)
COVID Vaccine doses distributed (Sep 19, 2023)
COVID Vaccine doses administered (Sep 19, 2023)
Likely homosexual households (%)
Likely homosexual households (% change since 2000)
Likely homosexual households - Lesbian couples (%)
Likely homosexual households - Lesbian couples (% change since 2000)
Likely homosexual households - Gay men (%)
Likely homosexual households - Gay men (% change since 2000)
Cost of living index
Median gross rent ($)
Median contract rent ($)
Median monthly housing costs ($)
Median house or condo value ($)
Median house or condo value ($ change since 2000)
Mean house or condo value by units in structure - 1, detached ($)
Mean house or condo value by units in structure - 1, attached ($)
Mean house or condo value by units in structure - 2 ($)
Mean house or condo value by units in structure by units in structure - 3 or 4 ($)
Mean house or condo value by units in structure - 5 or more ($)
Mean house or condo value by units in structure - Boat, RV, van, etc. ($)
Mean house or condo value by units in structure - Mobile home ($)
Median house or condo value ($) - White
Median house or condo value ($) - Black or African American
Median house or condo value ($) - Asian
Median house or condo value ($) - Hispanic or Latino
Median house or condo value ($) - American Indian and Alaska Native
Median house or condo value ($) - Multirace
Median house or condo value ($) - Other Race
Median resident age
Resident age diversity
Median resident age - Males
Median resident age - Females
Median resident age - White
Median resident age - Black or African American
Median resident age - Asian
Median resident age - Hispanic or Latino
Median resident age - American Indian and Alaska Native
Median resident age - Multirace
Median resident age - Other Race
Median resident age - Males - White
Median resident age - Males - Black or African American
Median resident age - Males - Asian
Median resident age - Males - Hispanic or Latino
Median resident age - Males - American Indian and Alaska Native
Median resident age - Males - Multirace
Median resident age - Males - Other Race
Median resident age - Females - White
Median resident age - Females - Black or African American
Median resident age - Females - Asian
Median resident age - Females - Hispanic or Latino
Median resident age - Females - American Indian and Alaska Native
Median resident age - Females - Multirace
Median resident age - Females - Other Race
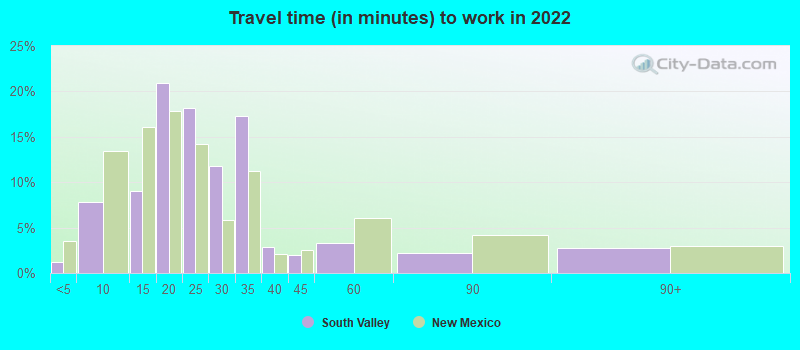
Commute - mean travel time to work (minutes)
Travel time to work - Less than 5 minutes (%)
Travel time to work - Less than 5 minutes (% change since 2000)
Travel time to work - 5 to 9 minutes (%)
Travel time to work - 5 to 9 minutes (% change since 2000)
Travel time to work - 10 to 19 minutes (%)
Travel time to work - 10 to 19 minutes (% change since 2000)
Travel time to work - 20 to 29 minutes (%)
Travel time to work - 20 to 29 minutes (% change since 2000)
Travel time to work - 30 to 39 minutes (%)
Travel time to work - 30 to 39 minutes (% change since 2000)
Travel time to work - 40 to 59 minutes (%)
Travel time to work - 40 to 59 minutes (% change since 2000)
Travel time to work - 60 to 89 minutes (%)
Travel time to work - 60 to 89 minutes (% change since 2000)
Travel time to work - 90 or more minutes (%)
Travel time to work - 90 or more minutes (% change since 2000)
Marital status - Never married (%)
Marital status - Now married (%)
Marital status - Separated (%)
Marital status - Widowed (%)
Marital status - Divorced (%)
Median family income ($)
Median family income (% change since 2000)
Median non-family income ($)
Median non-family income (% change since 2000)
Median per capita income ($)
Median per capita income (% change since 2000)
Median family income ($) - White
Median family income ($) - Black or African American
Median family income ($) - Asian
Median family income ($) - Hispanic or Latino
Median family income ($) - American Indian and Alaska Native
Median family income ($) - Multirace
Median family income ($) - Other Race
Median year house/condo built
Median year apartment built
Year house built - Built 2005 or later (%)
Year house built - Built 2000 to 2004 (%)
Year house built - Built 1990 to 1999 (%)
Year house built - Built 1980 to 1989 (%)
Year house built - Built 1970 to 1979 (%)
Year house built - Built 1960 to 1969 (%)
Year house built - Built 1950 to 1959 (%)
Year house built - Built 1940 to 1949 (%)
Year house built - Built 1939 or earlier (%)
Average household size
Household density (households per square mile)
Average household size - White
Average household size - Black or African American
Average household size - Asian
Average household size - Hispanic or Latino
Average household size - American Indian and Alaska Native
Average household size - Multirace
Average household size - Other Race
Occupied housing units (%)
Vacant housing units (%)
Owner occupied housing units (%)
Renter occupied housing units (%)
Vacancy status - For rent (%)
Vacancy status - For sale only (%)
Vacancy status - Rented or sold, not occupied (%)
Vacancy status - For seasonal, recreational, or occasional use (%)
Vacancy status - For migrant workers (%)
Vacancy status - Other vacant (%)
Residents with income below the poverty level (%)
Residents with income below 50% of the poverty level (%)
Children below poverty level (%)
Poor families by family type - Married-couple family (%)
Poor families by family type - Male, no wife present (%)
Poor families by family type - Female, no husband present (%)
Poverty status for native-born residents (%)
Poverty status for foreign-born residents (%)
Poverty among high school graduates not in families (%)
Poverty among people who did not graduate high school not in families (%)
Residents with income below the poverty level (%) - White
Residents with income below the poverty level (%) - Black or African American
Residents with income below the poverty level (%) - Asian
Residents with income below the poverty level (%) - Hispanic or Latino
Residents with income below the poverty level (%) - American Indian and Alaska Native
Residents with income below the poverty level (%) - Multirace
Residents with income below the poverty level (%) - Other Race
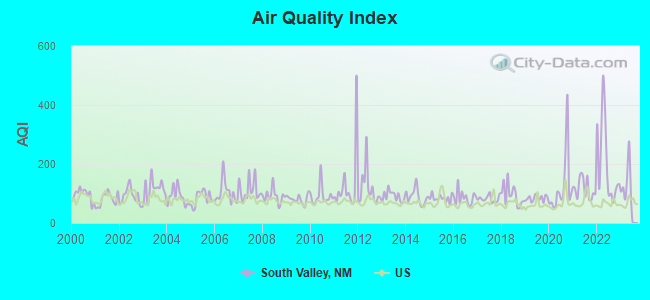
Air pollution - Air Quality Index (AQI)
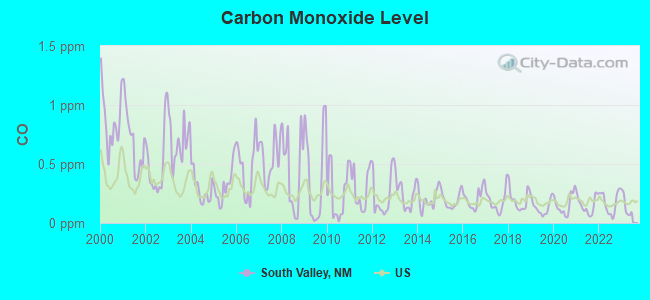
Air pollution - CO
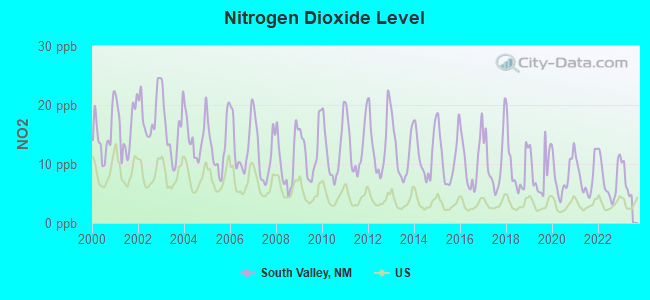
Air pollution - NO2
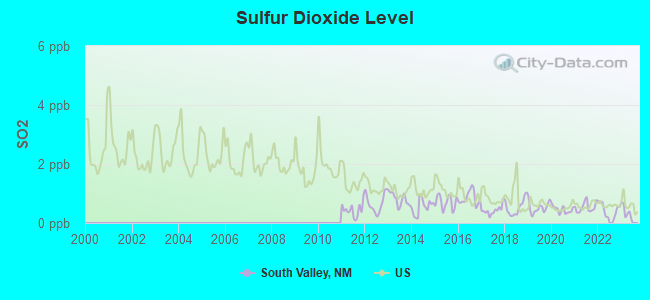
Air pollution - SO2
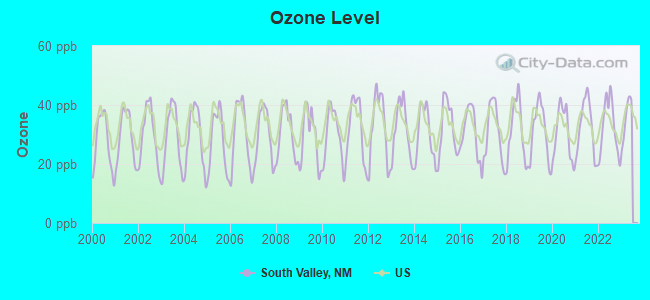
Air pollution - Ozone
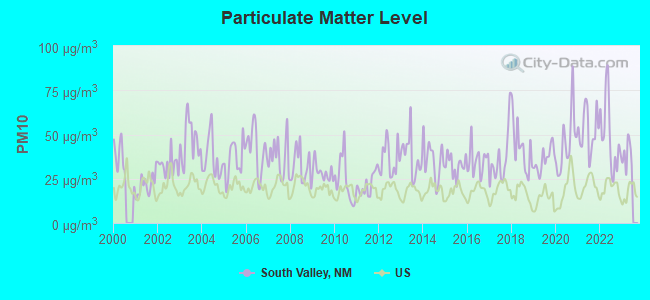
Air pollution - PM10
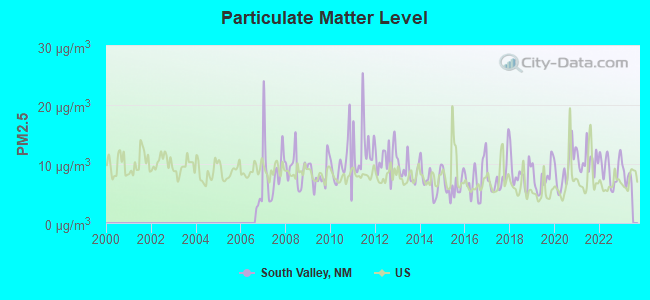
Air pollution - PM25
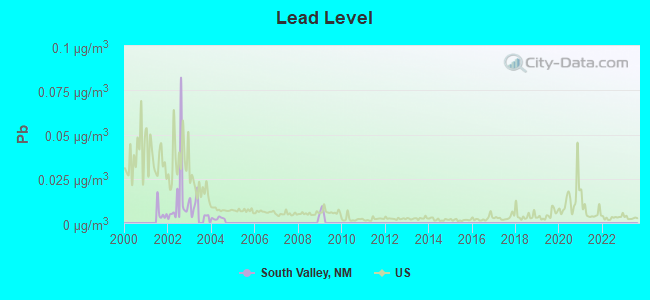
Air pollution - Pb
Crime - Murders per 100,000 population
Crime - Rapes per 100,000 population
Crime - Robberies per 100,000 population
Crime - Assaults per 100,000 population
Crime - Burglaries per 100,000 population
Crime - Thefts per 100,000 population
Crime - Auto thefts per 100,000 population
Crime - Arson per 100,000 population
Crime - City-data.com crime index
Crime - Violent crime index
Crime - Property crime index
Crime - Murders per 100,000 population (5 year average)
Crime - Rapes per 100,000 population (5 year average)
Crime - Robberies per 100,000 population (5 year average)
Crime - Assaults per 100,000 population (5 year average)
Crime - Burglaries per 100,000 population (5 year average)
Crime - Thefts per 100,000 population (5 year average)
Crime - Auto thefts per 100,000 population (5 year average)
Crime - Arson per 100,000 population (5 year average)
Crime - City-data.com crime index (5 year average)
Crime - Violent crime index (5 year average)
Crime - Property crime index (5 year average)
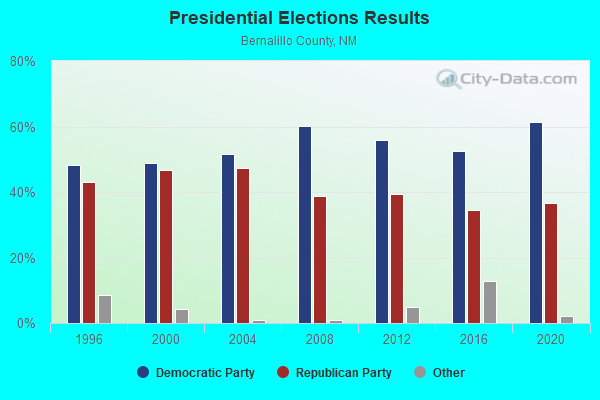
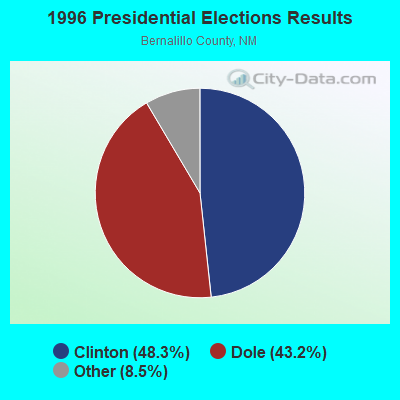
1996 Presidential Elections Results (%) - Democratic Party (Clinton)
1996 Presidential Elections Results (%) - Republican Party (Dole)
1996 Presidential Elections Results (%) - Other
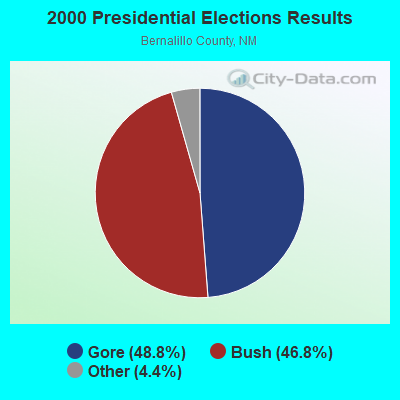
2000 Presidential Elections Results (%) - Democratic Party (Gore)
2000 Presidential Elections Results (%) - Republican Party (Bush)
2000 Presidential Elections Results (%) - Other
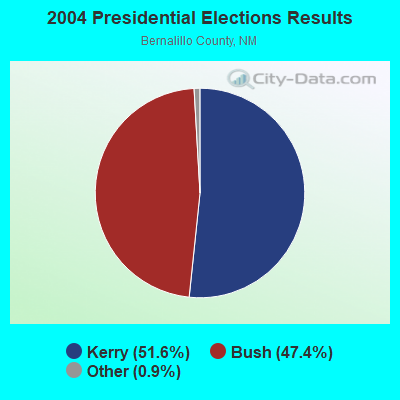
2004 Presidential Elections Results (%) - Democratic Party (Kerry)
2004 Presidential Elections Results (%) - Republican Party (Bush)
2004 Presidential Elections Results (%) - Other
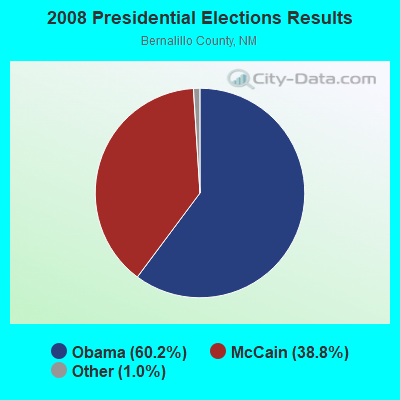
2008 Presidential Elections Results (%) - Democratic Party (Obama)
2008 Presidential Elections Results (%) - Republican Party (McCain)
2008 Presidential Elections Results (%) - Other
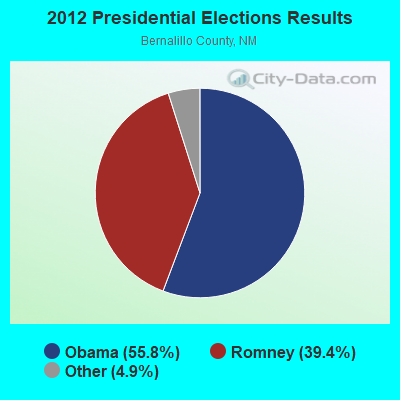
2012 Presidential Elections Results (%) - Democratic Party (Obama)
2012 Presidential Elections Results (%) - Republican Party (Romney)
2012 Presidential Elections Results (%) - Other
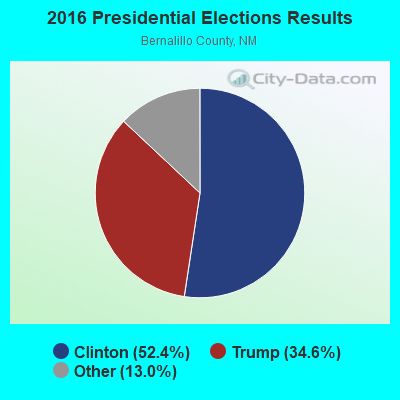
2016 Presidential Elections Results (%) - Democratic Party (Clinton)
2016 Presidential Elections Results (%) - Republican Party (Trump)
2016 Presidential Elections Results (%) - Other
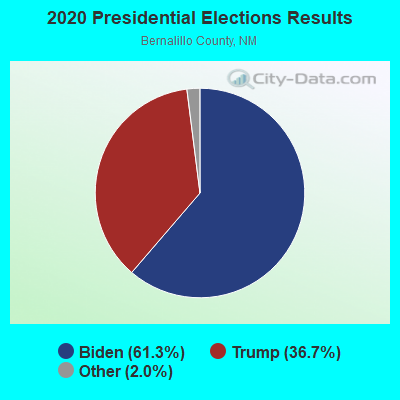
2020 Presidential Elections Results (%) - Democratic Party (Biden)
2020 Presidential Elections Results (%) - Republican Party (Trump)
2020 Presidential Elections Results (%) - Other
Ancestries Reported - Arab (%)
Ancestries Reported - Czech (%)
Ancestries Reported - Danish (%)
Ancestries Reported - Dutch (%)
Ancestries Reported - English (%)
Ancestries Reported - French (%)
Ancestries Reported - French Canadian (%)
Ancestries Reported - German (%)
Ancestries Reported - Greek (%)
Ancestries Reported - Hungarian (%)
Ancestries Reported - Irish (%)
Ancestries Reported - Italian (%)
Ancestries Reported - Lithuanian (%)
Ancestries Reported - Norwegian (%)
Ancestries Reported - Polish (%)
Ancestries Reported - Portuguese (%)
Ancestries Reported - Russian (%)
Ancestries Reported - Scotch-Irish (%)
Ancestries Reported - Scottish (%)
Ancestries Reported - Slovak (%)
Ancestries Reported - Subsaharan African (%)
Ancestries Reported - Swedish (%)
Ancestries Reported - Swiss (%)
Ancestries Reported - Ukrainian (%)
Ancestries Reported - United States (%)
Ancestries Reported - Welsh (%)
Ancestries Reported - West Indian (%)
Ancestries Reported - Other (%)
Educational Attainment - No schooling completed (%)
Educational Attainment - Less than high school (%)
Educational Attainment - High school or equivalent (%)
Educational Attainment - Less than 1 year of college (%)
Educational Attainment - 1 or more years of college (%)
Educational Attainment - Associate degree (%)
Educational Attainment - Bachelor's degree (%)
Educational Attainment - Master's degree (%)
Educational Attainment - Professional school degree (%)
Educational Attainment - Doctorate degree (%)
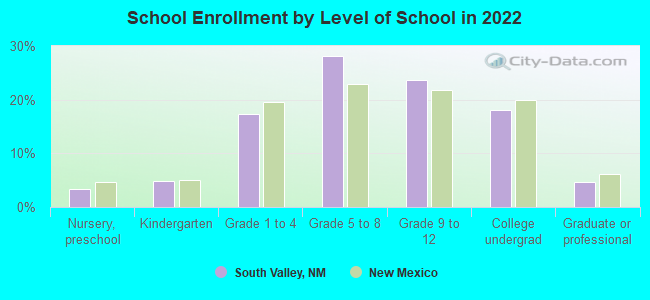
School Enrollment - Nursery, preschool (%)
School Enrollment - Kindergarten (%)
School Enrollment - Grade 1 to 4 (%)
School Enrollment - Grade 5 to 8 (%)
School Enrollment - Grade 9 to 12 (%)
School Enrollment - College undergrad (%)
School Enrollment - Graduate or professional (%)
School Enrollment - Not enrolled in school (%)
School enrollment - Public schools (%)
School enrollment - Private schools (%)
School enrollment - Not enrolled (%)
Median number of rooms in houses and condos
Median number of rooms in apartments
Housing units lacking complete plumbing facilities (%)
Housing units lacking complete kitchen facilities (%)
Density of houses
Urban houses (%)
Rural houses (%)
Households with people 60 years and over (%)
Households with people 65 years and over (%)
Households with people 75 years and over (%)
Households with one or more nonrelatives (%)
Households with no nonrelatives (%)
Population in households (%)
Family households (%)
Nonfamily households (%)
Population in families (%)
Family households with own children (%)
Median number of bedrooms in owner occupied houses
Mean number of bedrooms in owner occupied houses
Median number of bedrooms in renter occupied houses
Mean number of bedrooms in renter occupied houses
Median number of vehichles in owner occupied houses
Mean number of vehichles in owner occupied houses
Median number of vehichles in renter occupied houses
Mean number of vehichles in renter occupied houses
Mortgage status - with mortgage (%)
Mortgage status - with second mortgage (%)
Mortgage status - with home equity loan (%)
Mortgage status - with both second mortgage and home equity loan (%)
Mortgage status - without a mortgage (%)
Average family size
Average family size - White
Average family size - Black or African American
Average family size - Asian
Average family size - Hispanic or Latino
Average family size - American Indian and Alaska Native
Average family size - Multirace
Average family size - Other Race
Geographical mobility - Same house 1 year ago (%)
Geographical mobility - Moved within same county (%)
Geographical mobility - Moved from different county within same state (%)
Geographical mobility - Moved from different state (%)
Geographical mobility - Moved from abroad (%)
Place of birth - Born in state of residence (%)
Place of birth - Born in other state (%)
Place of birth - Native, outside of US (%)
Place of birth - Foreign born (%)
Housing units in structures - 1, detached (%)
Housing units in structures - 1, attached (%)
Housing units in structures - 2 (%)
Housing units in structures - 3 or 4 (%)
Housing units in structures - 5 to 9 (%)
Housing units in structures - 10 to 19 (%)
Housing units in structures - 20 to 49 (%)
Housing units in structures - 50 or more (%)
Housing units in structures - Mobile home (%)
Housing units in structures - Boat, RV, van, etc. (%)
House/condo owner moved in on average (years ago)
Renter moved in on average (years ago)
Year householder moved into unit - Moved in 1999 to March 2000 (%)
Year householder moved into unit - Moved in 1995 to 1998 (%)
Year householder moved into unit - Moved in 1990 to 1994 (%)
Year householder moved into unit - Moved in 1980 to 1989 (%)
Year householder moved into unit - Moved in 1970 to 1979 (%)
Year householder moved into unit - Moved in 1969 or earlier (%)
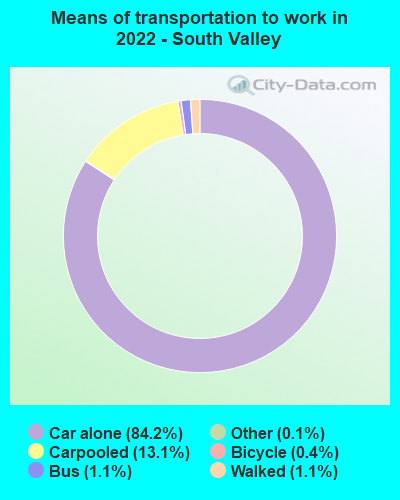
Means of transportation to work - Drove car alone (%)
Means of transportation to work - Carpooled (%)
Means of transportation to work - Public transportation (%)
Means of transportation to work - Bus or trolley bus (%)
Means of transportation to work - Streetcar or trolley car (%)
Means of transportation to work - Subway or elevated (%)
Means of transportation to work - Railroad (%)
Means of transportation to work - Ferryboat (%)
Means of transportation to work - Taxicab (%)
Means of transportation to work - Motorcycle (%)
Means of transportation to work - Bicycle (%)
Means of transportation to work - Walked (%)
Means of transportation to work - Other means (%)
Working at home (%)
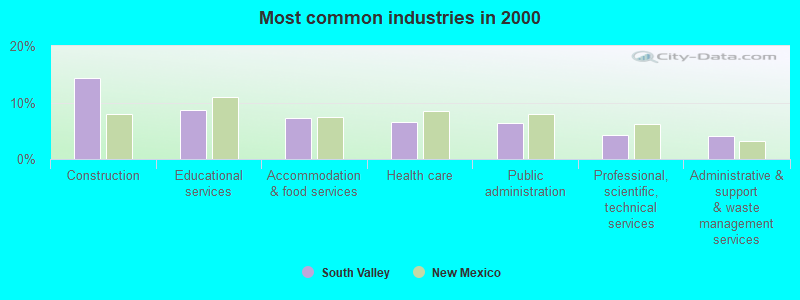
Industry diversity
Most Common Industries - Agriculture, forestry, fishing and hunting, and mining (%)
Most Common Industries - Agriculture, forestry, fishing and hunting (%)
Most Common Industries - Mining, quarrying, and oil and gas extraction (%)
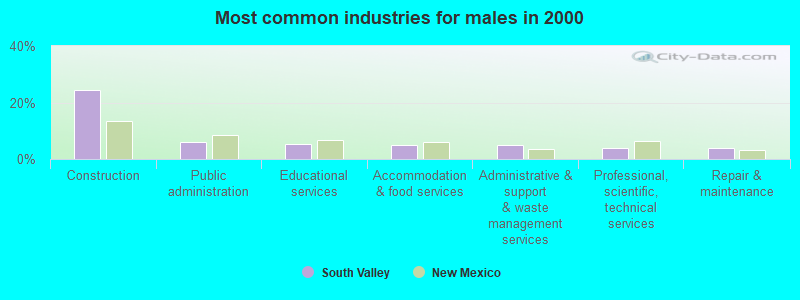
Most Common Industries - Construction (%)
Most Common Industries - Manufacturing (%)
Most Common Industries - Wholesale trade (%)
Most Common Industries - Retail trade (%)
Most Common Industries - Transportation and warehousing, and utilities (%)
Most Common Industries - Transportation and warehousing (%)
Most Common Industries - Utilities (%)
Most Common Industries - Information (%)
Most Common Industries - Finance and insurance, and real estate and rental and leasing (%)
Most Common Industries - Finance and insurance (%)
Most Common Industries - Real estate and rental and leasing (%)
Most Common Industries - Professional, scientific, and management, and administrative and waste management services (%)
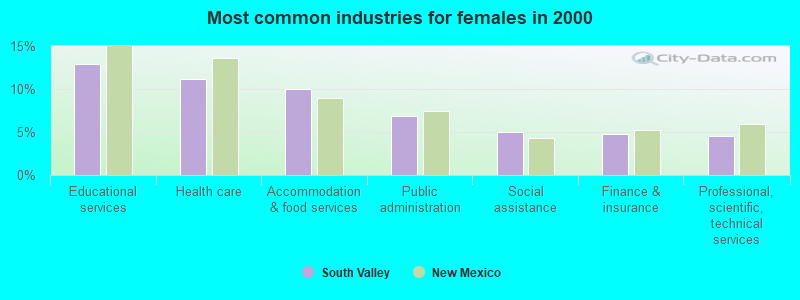
Most Common Industries - Professional, scientific, and technical services (%)
Most Common Industries - Management of companies and enterprises (%)
Most Common Industries - Administrative and support and waste management services (%)
Most Common Industries - Educational services, and health care and social assistance (%)
Most Common Industries - Educational services (%)
Most Common Industries - Health care and social assistance (%)
Most Common Industries - Arts, entertainment, and recreation, and accommodation and food services (%)
Most Common Industries - Arts, entertainment, and recreation (%)
Most Common Industries - Accommodation and food services (%)
Most Common Industries - Other services, except public administration (%)
Most Common Industries - Public administration (%)
Occupation diversity
Most Common Occupations - Management, business, science, and arts occupations (%)
Most Common Occupations - Management, business, and financial occupations (%)
Most Common Occupations - Management occupations (%)
Most Common Occupations - Business and financial operations occupations (%)
Most Common Occupations - Computer, engineering, and science occupations (%)
Most Common Occupations - Computer and mathematical occupations (%)
Most Common Occupations - Architecture and engineering occupations (%)
Most Common Occupations - Life, physical, and social science occupations (%)
Most Common Occupations - Education, legal, community service, arts, and media occupations (%)
Most Common Occupations - Community and social service occupations (%)
Most Common Occupations - Legal occupations (%)
Most Common Occupations - Education, training, and library occupations (%)
Most Common Occupations - Arts, design, entertainment, sports, and media occupations (%)
Most Common Occupations - Healthcare practitioners and technical occupations (%)
Most Common Occupations - Health diagnosing and treating practitioners and other technical occupations (%)
Most Common Occupations - Health technologists and technicians (%)
Most Common Occupations - Service occupations (%)
Most Common Occupations - Healthcare support occupations (%)
Most Common Occupations - Protective service occupations (%)
Most Common Occupations - Fire fighting and prevention, and other protective service workers including supervisors (%)
Most Common Occupations - Law enforcement workers including supervisors (%)
Most Common Occupations - Food preparation and serving related occupations (%)
Most Common Occupations - Building and grounds cleaning and maintenance occupations (%)
Most Common Occupations - Personal care and service occupations (%)
Most Common Occupations - Sales and office occupations (%)
Most Common Occupations - Sales and related occupations (%)
Most Common Occupations - Office and administrative support occupations (%)
Most Common Occupations - Natural resources, construction, and maintenance occupations (%)
Most Common Occupations - Farming, fishing, and forestry occupations (%)
Most Common Occupations - Construction and extraction occupations (%)
Most Common Occupations - Installation, maintenance, and repair occupations (%)
Most Common Occupations - Production, transportation, and material moving occupations (%)
Most Common Occupations - Production occupations (%)
Most Common Occupations - Transportation occupations (%)
Most Common Occupations - Material moving occupations (%)
People in Group quarters - Institutionalized population (%)
People in Group quarters - Correctional institutions (%)
People in Group quarters - Federal prisons and detention centers (%)
People in Group quarters - Halfway houses (%)
People in Group quarters - Local jails and other confinement facilities (including police lockups) (%)
People in Group quarters - Military disciplinary barracks (%)
People in Group quarters - State prisons (%)
People in Group quarters - Other types of correctional institutions (%)
People in Group quarters - Nursing homes (%)
People in Group quarters - Hospitals/wards, hospices, and schools for the handicapped (%)
People in Group quarters - Hospitals/wards and hospices for chronically ill (%)
People in Group quarters - Hospices or homes for chronically ill (%)
People in Group quarters - Military hospitals or wards for chronically ill (%)
People in Group quarters - Other hospitals or wards for chronically ill (%)
People in Group quarters - Hospitals or wards for drug/alcohol abuse (%)
People in Group quarters - Mental (Psychiatric) hospitals or wards (%)
People in Group quarters - Schools, hospitals, or wards for the mentally retarded (%)
People in Group quarters - Schools, hospitals, or wards for the physically handicapped (%)
People in Group quarters - Institutions for the deaf (%)
People in Group quarters - Institutions for the blind (%)
People in Group quarters - Orthopedic wards and institutions for the physically handicapped (%)
People in Group quarters - Wards in general hospitals for patients who have no usual home elsewhere (%)
People in Group quarters - Wards in military hospitals for patients who have no usual home elsewhere (%)
People in Group quarters - Juvenile institutions (%)
People in Group quarters - Long-term care (%)
People in Group quarters - Homes for abused, dependent, and neglected children (%)
People in Group quarters - Residential treatment centers for emotionally disturbed children (%)
People in Group quarters - Training schools for juvenile delinquents (%)
People in Group quarters - Short-term care, detention or diagnostic centers for delinquent children (%)
People in Group quarters - Type of juvenile institution unknown (%)
People in Group quarters - Noninstitutionalized population (%)
People in Group quarters - College dormitories (includes college quarters off campus) (%)
People in Group quarters - Military quarters (%)
People in Group quarters - On base (%)
People in Group quarters - Barracks, unaccompanied personnel housing (UPH), (Enlisted/Officer), ;and similar group living quarters for military personnel (%)
People in Group quarters - Transient quarters for temporary residents (%)
People in Group quarters - Military ships (%)
People in Group quarters - Group homes (%)
People in Group quarters - Homes or halfway houses for drug/alcohol abuse (%)
People in Group quarters - Homes for the mentally ill (%)
People in Group quarters - Homes for the mentally retarded (%)
People in Group quarters - Homes for the physically handicapped (%)
People in Group quarters - Other group homes (%)
People in Group quarters - Religious group quarters (%)
People in Group quarters - Dormitories (%)
People in Group quarters - Agriculture workers' dormitories on farms (%)
People in Group quarters - Job Corps and vocational training facilities (%)
People in Group quarters - Other workers' dormitories (%)
People in Group quarters - Crews of maritime vessels (%)
People in Group quarters - Other nonhousehold living situations (%)
People in Group quarters - Other noninstitutional group quarters (%)
Residents speaking English at home (%)
Residents speaking English at home - Born in the United States (%)
Residents speaking English at home - Native, born elsewhere (%)
Residents speaking English at home - Foreign born (%)
Residents speaking Spanish at home (%)
Residents speaking Spanish at home - Born in the United States (%)
Residents speaking Spanish at home - Native, born elsewhere (%)
Residents speaking Spanish at home - Foreign born (%)
Residents speaking other language at home (%)
Residents speaking other language at home - Born in the United States (%)
Residents speaking other language at home - Native, born elsewhere (%)
Residents speaking other language at home - Foreign born (%)
Class of Workers - Employee of private company (%)
Class of Workers - Self-employed in own incorporated business (%)
Class of Workers - Private not-for-profit wage and salary workers (%)
Class of Workers - Local government workers (%)
Class of Workers - State government workers (%)
Class of Workers - Federal government workers (%)
Class of Workers - Self-employed workers in own not incorporated business and Unpaid family workers (%)
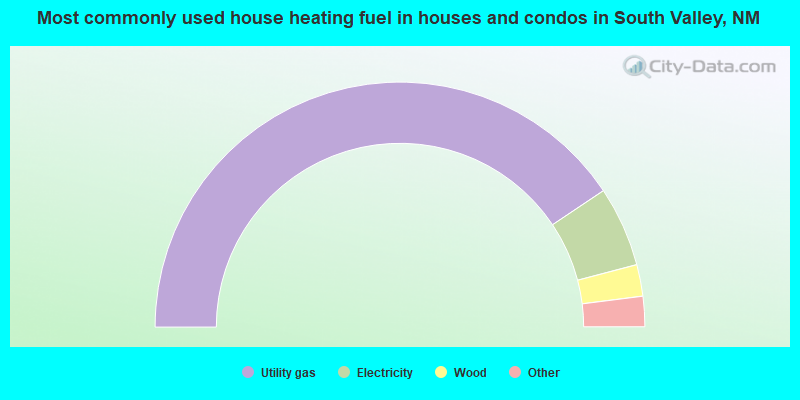
House heating fuel used in houses and condos - Utility gas (%)
House heating fuel used in houses and condos - Bottled, tank, or LP gas (%)
House heating fuel used in houses and condos - Electricity (%)
House heating fuel used in houses and condos - Fuel oil, kerosene, etc. (%)
House heating fuel used in houses and condos - Coal or coke (%)
House heating fuel used in houses and condos - Wood (%)
House heating fuel used in houses and condos - Solar energy (%)
House heating fuel used in houses and condos - Other fuel (%)
House heating fuel used in houses and condos - No fuel used (%)
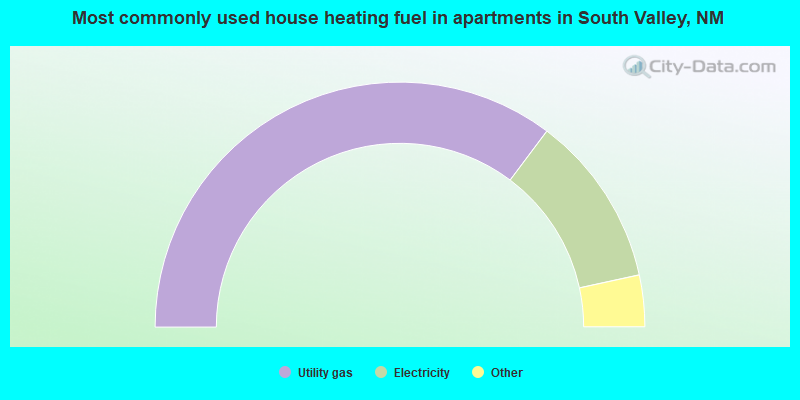
House heating fuel used in apartments - Utility gas (%)
House heating fuel used in apartments - Bottled, tank, or LP gas (%)
House heating fuel used in apartments - Electricity (%)
House heating fuel used in apartments - Fuel oil, kerosene, etc. (%)
House heating fuel used in apartments - Coal or coke (%)
House heating fuel used in apartments - Wood (%)
House heating fuel used in apartments - Solar energy (%)
House heating fuel used in apartments - Other fuel (%)
House heating fuel used in apartments - No fuel used (%)
Armed forces status - In Armed Forces (%)
Armed forces status - Civilian (%)
Armed forces status - Civilian - Veteran (%)
Armed forces status - Civilian - Nonveteran (%)
Fatal accidents locations in years 2005-2021
Fatal accidents locations in 2005
Fatal accidents locations in 2006
Fatal accidents locations in 2007
Fatal accidents locations in 2008
Fatal accidents locations in 2009
Fatal accidents locations in 2010
Fatal accidents locations in 2011
Fatal accidents locations in 2012
Fatal accidents locations in 2013
Fatal accidents locations in 2014
Fatal accidents locations in 2015
Fatal accidents locations in 2016
Fatal accidents locations in 2017
Fatal accidents locations in 2018
Fatal accidents locations in 2019
Fatal accidents locations in 2020
Fatal accidents locations in 2021
Alcohol use - People drinking some alcohol every month (%)
Alcohol use - People not drinking at all (%)
Alcohol use - Average days/month drinking alcohol
Alcohol use - Average drinks/week
Alcohol use - Average days/year people drink much
Audiometry - Average condition of hearing (%)
Audiometry - People that can hear a whisper from across a quiet room (%)
Audiometry - People that can hear normal voice from across a quiet room (%)
Audiometry - Ears ringing, roaring, buzzing (%)
Audiometry - Had a job exposure to loud noise (%)
Audiometry - Had off-work exposure to loud noise (%)
Blood Pressure & Cholesterol - Has high blood pressure (%)
Blood Pressure & Cholesterol - Checking blood pressure at home (%)
Blood Pressure & Cholesterol - Frequently checking blood cholesterol (%)
Blood Pressure & Cholesterol - Has high cholesterol level (%)
Consumer Behavior - Money monthly spent on food at supermarket/grocery store
Consumer Behavior - Money monthly spent on food at other stores
Consumer Behavior - Money monthly spent on eating out
Consumer Behavior - Money monthly spent on carryout/delivered foods
Consumer Behavior - Income spent on food at supermarket/grocery store (%)
Consumer Behavior - Income spent on food at other stores (%)
Consumer Behavior - Income spent on eating out (%)
Consumer Behavior - Income spent on carryout/delivered foods (%)
Current Health Status - General health condition (%)
Current Health Status - Blood donors (%)
Current Health Status - Has blood ever tested for HIV virus (%)
Current Health Status - Left-handed people (%)
Dermatology - People using sunscreen (%)
Diabetes - Diabetics (%)
Diabetes - Had a blood test for high blood sugar (%)
Diabetes - People taking insulin (%)
Diet Behavior & Nutrition - Diet health (%)
Diet Behavior & Nutrition - Milk product consumption (# of products/month)
Diet Behavior & Nutrition - Meals not home prepared (#/week)
Diet Behavior & Nutrition - Meals from fast food or pizza place (#/week)
Diet Behavior & Nutrition - Ready-to-eat foods (#/month)
Diet Behavior & Nutrition - Frozen meals/pizza (#/month)
Drug Use - People that ever used marijuana or hashish (%)
Drug Use - Ever used hard drugs (%)
Drug Use - Ever used any form of cocaine (%)
Drug Use - Ever used heroin (%)
Drug Use - Ever used methamphetamine (%)
Health Insurance - People covered by health insurance (%)
Kidney Conditions-Urology - Avg. # of times urinating at night
Medical Conditions - People with asthma (%)
Medical Conditions - People with anemia (%)
Medical Conditions - People with psoriasis (%)
Medical Conditions - People with overweight (%)
Medical Conditions - Elderly people having difficulties in thinking or remembering (%)
Medical Conditions - People who ever received blood transfusion (%)
Medical Conditions - People having trouble seeing even with glass/contacts (%)
Medical Conditions - People with arthritis (%)
Medical Conditions - People with gout (%)
Medical Conditions - People with congestive heart failure (%)
Medical Conditions - People with coronary heart disease (%)
Medical Conditions - People with angina pectoris (%)
Medical Conditions - People who ever had heart attack (%)
Medical Conditions - People who ever had stroke (%)
Medical Conditions - People with emphysema (%)
Medical Conditions - People with thyroid problem (%)
Medical Conditions - People with chronic bronchitis (%)
Medical Conditions - People with any liver condition (%)
Medical Conditions - People who ever had cancer or malignancy (%)
Mental Health - People who have little interest in doing things (%)
Mental Health - People feeling down, depressed, or hopeless (%)
Mental Health - People who have trouble sleeping or sleeping too much (%)
Mental Health - People feeling tired or having little energy (%)
Mental Health - People with poor appetite or overeating (%)
Mental Health - People feeling bad about themself (%)
Mental Health - People who have trouble concentrating on things (%)
Mental Health - People moving or speaking slowly or too fast (%)
Mental Health - People having thoughts they would be better off dead (%)
Oral Health - Average years since last visit a dentist
Oral Health - People embarrassed because of mouth (%)
Oral Health - People with gum disease (%)
Oral Health - General health of teeth and gums (%)
Oral Health - Average days a week using dental floss/device
Oral Health - Average days a week using mouthwash for dental problem
Oral Health - Average number of teeth
Pesticide Use - Households using pesticides to control insects (%)
Pesticide Use - Households using pesticides to kill weeds (%)
Physical Activity - People doing vigorous-intensity work activities (%)
Physical Activity - People doing moderate-intensity work activities (%)
Physical Activity - People walking or bicycling (%)
Physical Activity - People doing vigorous-intensity recreational activities (%)
Physical Activity - People doing moderate-intensity recreational activities (%)
Physical Activity - Average hours a day doing sedentary activities
Physical Activity - Average hours a day watching TV or videos
Physical Activity - Average hours a day using computer
Physical Functioning - People having limitations keeping them from working (%)
Physical Functioning - People limited in amount of work they can do (%)
Physical Functioning - People that need special equipment to walk (%)
Physical Functioning - People experiencing confusion/memory problems (%)
Physical Functioning - People requiring special healthcare equipment (%)
Prescription Medications - Average number of prescription medicines taking
Preventive Aspirin Use - Adults 40+ taking low-dose aspirin (%)
Reproductive Health - Vaginal deliveries (%)
Reproductive Health - Cesarean deliveries (%)
Reproductive Health - Deliveries resulted in a live birth (%)
Reproductive Health - Pregnancies resulted in a delivery (%)
Reproductive Health - Women breastfeeding newborns (%)
Reproductive Health - Women that had a hysterectomy (%)
Reproductive Health - Women that had both ovaries removed (%)
Reproductive Health - Women that have ever taken birth control pills (%)
Reproductive Health - Women taking birth control pills (%)
Reproductive Health - Women that have ever used Depo-Provera or injectables (%)
Reproductive Health - Women that have ever used female hormones (%)
Sexual Behavior - People 18+ that ever had sex (vaginal, anal, or oral) (%)
Sexual Behavior - Males 18+ that ever had vaginal sex with a woman (%)
Sexual Behavior - Males 18+ that ever performed oral sex on a woman (%)
Sexual Behavior - Males 18+ that ever had anal sex with a woman (%)
Sexual Behavior - Males 18+ that ever had any sex with a man (%)
Sexual Behavior - Females 18+ that ever had vaginal sex with a man (%)
Sexual Behavior - Females 18+ that ever performed oral sex on a man (%)
Sexual Behavior - Females 18+ that ever had anal sex with a man (%)
Sexual Behavior - Females 18+ that ever had any kind of sex with a woman (%)
Sexual Behavior - Average age people first had sex
Sexual Behavior - Average number of female sex partners in lifetime (males 18+)
Sexual Behavior - Average number of female vaginal sex partners in lifetime (males 18+)
Sexual Behavior - Average age people first performed oral sex on a woman (18+)
Sexual Behavior - Average number of woman performed oral sex on in lifetime (18+)
Sexual Behavior - Average number of male sex partners in lifetime (males 18+)
Sexual Behavior - Average number of male anal sex partners in lifetime (males 18+)
Sexual Behavior - Average age people first performed oral sex on a man (18+)
Sexual Behavior - Average number of male oral sex partners in lifetime (18+)
Sexual Behavior - People using protection when performing oral sex (%)
Sexual Behavior - Average number of times people have vaginal or anal sex a year
Sexual Behavior - People having sex without condom (%)
Sexual Behavior - Average number of male sex partners in lifetime (females 18+)
Sexual Behavior - Average number of male vaginal sex partners in lifetime (females 18+)
Sexual Behavior - Average number of female sex partners in lifetime (females 18+)
Sexual Behavior - Circumcised males 18+ (%)
Sleep Disorders - Average hours sleeping at night
Sleep Disorders - People that has trouble sleeping (%)
Smoking-Cigarette Use - People smoking cigarettes (%)
Taste & Smell - People 40+ having problems with smell (%)
Taste & Smell - People 40+ having problems with taste (%)
Taste & Smell - People 40+ that ever had wisdom teeth removed (%)
Taste & Smell - People 40+ that ever had tonsils teeth removed (%)
Taste & Smell - People 40+ that ever had a loss of consciousness because of a head injury (%)
Taste & Smell - People 40+ that ever had a broken nose or other serious injury to face or skull (%)
Taste & Smell - People 40+ that ever had two or more sinus infections (%)
Weight - Average height (inches)
Weight - Average weight (pounds)
Weight - Average BMI
Weight - People that are obese (%)
Weight - People that ever were obese (%)
Weight - People trying to lose weight (%)
Latest news from South Valley, NM collected exclusively by city-data.com from local newspapers, TV, and radio stations
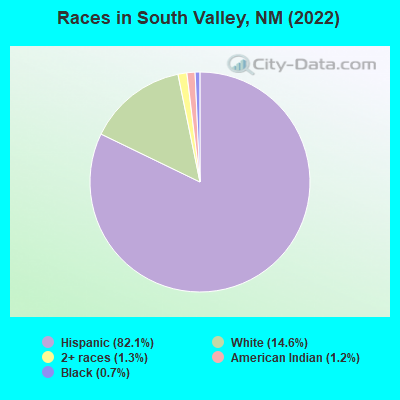
Ancestries: American (3.8%), German (2.1%), European (1.1%), English (1.1%).
Current Local Time:
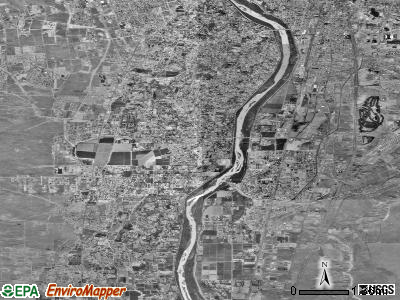
Land area: 29.5 square miles.
Population density: 1,388 people per square mile (low).
5,617 residents are foreign born (13.9% Latin America ).
This place:
15.0%New Mexico:
9.2%
Median real estate property taxes paid for housing units with mortgages in 2022: $1,616 (0.7%)Median real estate property taxes paid for housing units with no mortgage in 2022: $1,357 (0.7%)
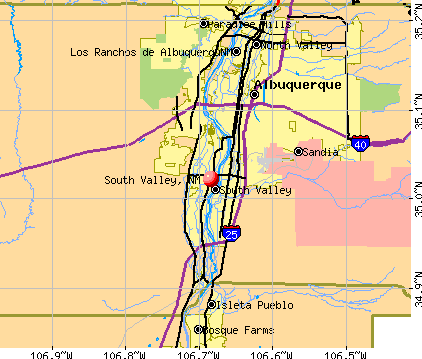
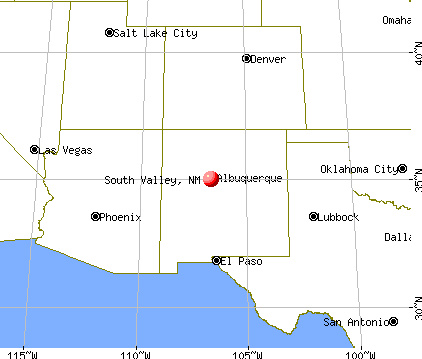
Nearest city with pop. 50,000+: Albuquerque, NM
Nearest city with pop. 1,000,000+: Phoenix, AZ
Nearest cities:
Chical, NM (3.3 miles),
Latitude: 35.02 N, Longitude: 106.68 W
Daytime population change due to commuting: -6,816 (-18.2%)Workers who live and work in this place: 2,787 (17.8%)
Area code commonly used in this area: 505
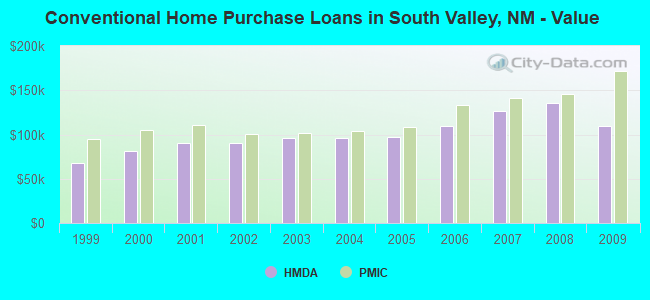
Property values in South Valley, NM
Unemployment in December 2023:
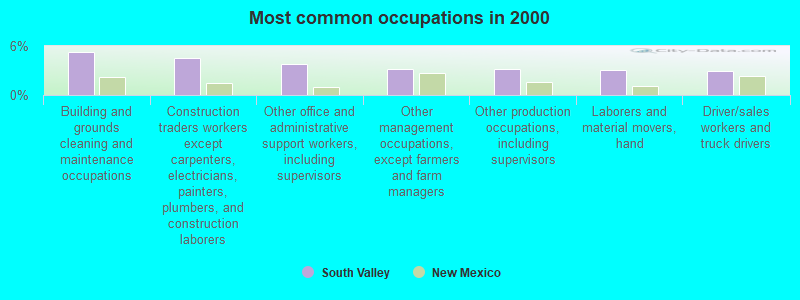
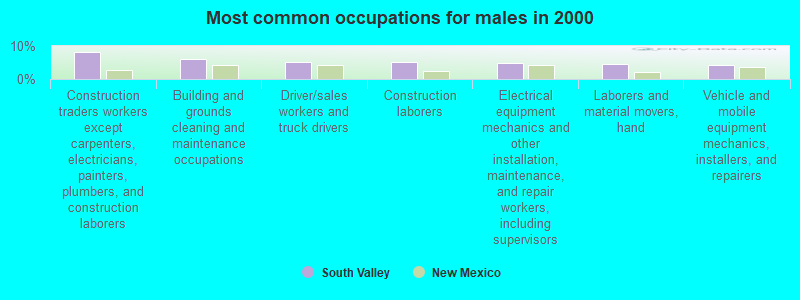
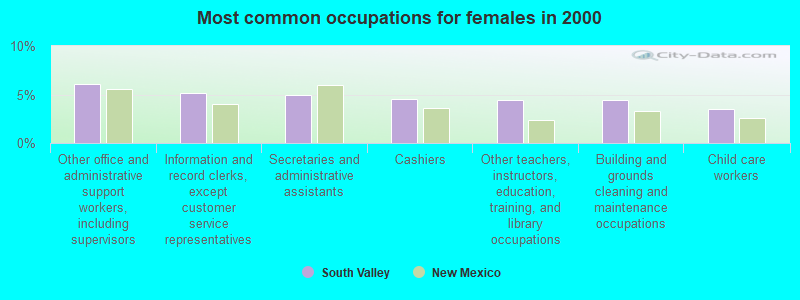
Most common occupations in South Valley, NM (%)
Both Males Females
Building and grounds cleaning and maintenance occupations (5.2%)
Construction traders workers except carpenters, electricians, painters, plumbers, and construction laborers (4.6%)
Other office and administrative support workers, including supervisors (3.8%)
Other management occupations, except farmers and farm managers (3.2%)
Other production occupations, including supervisors (3.2%)
Laborers and material movers, hand (3.1%)
Driver/sales workers and truck drivers (3.0%)
Construction traders workers except carpenters, electricians, painters, plumbers, and construction laborers (8.2%)
Building and grounds cleaning and maintenance occupations (5.9%)
Driver/sales workers and truck drivers (5.2%)
Construction laborers (5.1%)
Electrical equipment mechanics and other installation, maintenance, and repair workers, including supervisors (4.8%)
Laborers and material movers, hand (4.6%)
Vehicle and mobile equipment mechanics, installers, and repairers (4.4%)
Other office and administrative support workers, including supervisors (6.1%)
Information and record clerks, except customer service representatives (5.1%)
Secretaries and administrative assistants (4.9%)
Cashiers (4.5%)
Other teachers, instructors, education, training, and library occupations (4.4%)
Building and grounds cleaning and maintenance occupations (4.4%)
Child care workers (3.5%)
Earthquake activity:
South Valley-area historical earthquake activity is significantly above New Mexico state average. It is 708% greater than the overall U.S. average. On 6/28/1992 at 11:57:34, a magnitude 7.6 (6.2 MB, 7.6 MS, 7.3 MW, Depth: 0.7 mi, Class: Major, Intensity: VIII - XII) earthquake occurred 563.4 miles away from South Valley center, causing 3 deaths ( 1 shaking deaths, 2 other deaths) and 400 injuries, causing $100,000,000 total damage and $40,000,000 insured lossesOn 1/29/1990 at 13:16:10, a magnitude 4.8 (4.5 MB, 4.8 LG, Depth: 7.5 mi, Class: Light, Intensity: IV - V) earthquake occurred 40.2 miles away from South Valley center On 8/23/2011 at 05:46:18, a magnitude 5.3 (5.3 MW, Depth: 2.5 mi, Class: Moderate, Intensity: VI - VII) earthquake occurred 179.5 miles away from the city center On 10/16/1999 at 09:46:44, a magnitude 7.4 (6.3 MB, 7.4 MS, 7.2 MW, 7.3 ML) earthquake occurred 554.9 miles away from South Valley center On 5/19/1940 at 04:36:40, a magnitude 7.2 (7.2 UK) earthquake occurred 530.7 miles away from South Valley center, causing $33,000,000 total damage On 6/29/2014 at 04:59:35, a magnitude 5.3 (5.3 MW, Depth: 4.0 mi) earthquake occurred 221.0 miles away from South Valley center Magnitude types: regional Lg-wave magnitude (LG), body-wave magnitude (MB), local magnitude (ML), surface-wave magnitude (MS), moment magnitude (MW) Natural disasters: The number of natural disasters in Bernalillo County (9) is smaller than the US average (15).Major Disasters (Presidential) Declared: 3Emergencies Declared: 2Fires: 5, Floods: 2, Storms: 2, Hurricane: 1, Other: 1 (Note: some incidents may be assigned to more than one category). Hospitals and medical centers near South Valley: CASA ANGELICA (Hospital, about 2 miles away; ALBUQUERQUE, NM)
SOUTH VALLEY CARE CENTER, LLC (Nursing Home, about 3 miles away; ALBUQUERQUE, NM)
HOSPICE DE LA LUZ (Hospital, about 4 miles away; ALBUQUERQUE, NM)
NEW MEXICO ARTIFICIAL KIDNEY CENTER (FMC) (Dialysis Facility, about 4 miles away; ALBUQUERQUE, NM)
LEGACY HEALTHCARE, INC (Home Health Center, about 4 miles away; ALBUQUERQUE, NM)
MEMORIAL HOSPITAL (Hospital, about 5 miles away; ALBUQUERQUE, NM)
PRESBYTERIAN HOSPITAL (about 6 miles away; ALBUQUERQUE, NM)
Amtrak station near South Valley: 5 miles: ALBUQUERQUE (214 FIRST ST. SW) Services: ticket office, partially wheelchair accessible, enclosed waiting area, public restrooms, public payphones, vending machines, free short-term parking, call for car rental service, call for taxi service, intercity bus service, public transit connection.
Colleges/universities with over 2000 students nearest to South Valley:
Central New Mexico Community College (about 6 miles; Albuquerque, NM ; Full-time enrollment: 19,398)
University of New Mexico-Main Campus (about 6 miles; Albuquerque, NM ; FT enrollment: 23,042)
University of Phoenix-Albuquerque Campus (about 14 miles; Albuquerque, NM ; FT enrollment: 2,335)
Santa Fe Community College (about 55 miles; Santa Fe, NM ; FT enrollment: 3,047)
New Mexico Highlands University (about 92 miles; Las Vegas, NM ; FT enrollment: 2,931)
San Juan College (about 147 miles; Farmington, NM ; FT enrollment: 5,112)
Fort Lewis College (about 170 miles; Durango, CO ; FT enrollment: 3,631)
Notable locations in South Valley: (A) , Bernalillo County Fire and Rescue Station 4 (B) , Bernalillo County Fire and Rescue Station 2 (C) , Cathleen Groves Memorial Childrens Library (D) , Bernalillo County Fire and Rescue Station 8 (E) , Hubbell House Historic Site (F) . Display/hide their locations on the map
Shopping Center: (1) . Display/hide its location on the map
Churches in South Valley include: (A) , Mountainview Mission (B) . Display/hide their locations on the map
Cemetery: (1) . Display/hide its location on the map
Parks in South Valley include: (1) , Los Padillas Historical Marker (2) , Rio Bravo State Park (3) , Mountain View Park (4) , Adobe Acres Park (5) . Display/hide their locations on the map
Bernalillo County has a predicted average indoor radon screening level greater than 4 pCi/L (pico curies per liter) - Highest Potential Average household size: This place:
2.9 peopleNew Mexico:
2.5 people
Percentage of family households: This place:
73.1%Whole state:
65.5%
Percentage of households with unmarried partners: This place:
9.3%Whole state:
8.2%
Likely homosexual households (counted as self-reported same-sex unmarried-partner households)
Lesbian couples: 0.8% of all households Gay men: 0.3% of all households
People in group quarters in South Valley in 2010:
256 people in emergency and transitional shelters (with sleeping facilities) for people experiencing homelessness
108 people in other noninstitutional facilities
61 people in residential treatment centers for adults
56 people in nursing facilities/skilled-nursing facilities
31 people in group homes intended for adults
6 people in workers' group living quarters and job corps centers
People in group quarters in South Valley in 2000:
86 people in other noninstitutional group quarters
30 people in college dormitories (includes college quarters off campus)
21 people in hospitals or wards for drug/alcohol abuse
16 people in homes for the mentally retarded
12 people in homes for the physically handicapped
8 people in other group homes
6 people in religious group quarters
6 people in other nonhousehold living situations
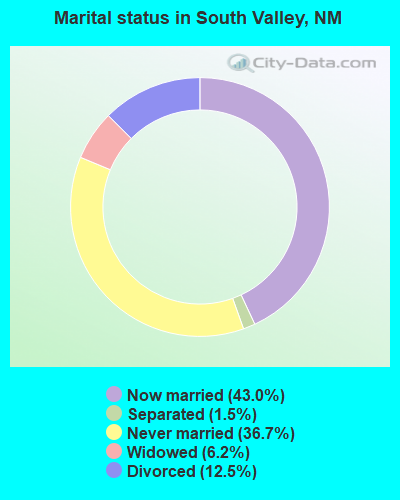
For population 15 years and over in South Valley:
Never married: 36.7%Now married: 43.0%Separated: 1.5%Widowed: 6.2%Divorced: 12.5% For population 25 years and over in South Valley:
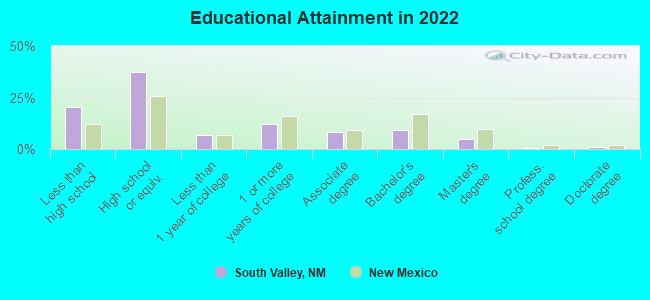
High school or higher: 79.6%Bachelor's degree or higher: 14.1%Graduate or professional degree: 5.4%Unemployed: 8.4%Mean travel time to work (commute): 24.9 minutes
Education Gini index (Inequality in education) Here:
14.6New Mexico average:
12.6
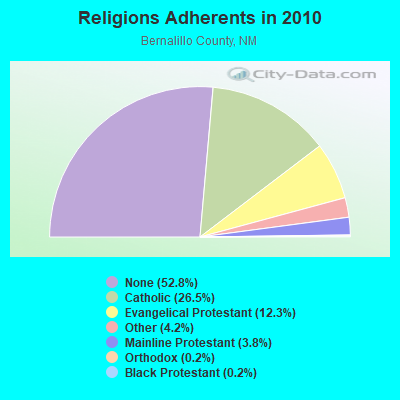
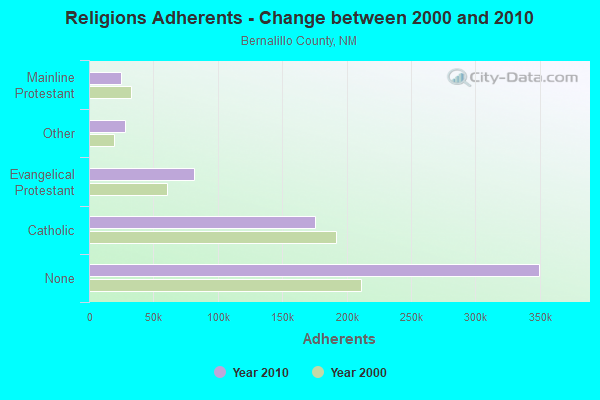
Religion statistics for South Valley, NM (based on Bernalillo County data)
Religion Adherents Congregations Catholic 175,266 44 Evangelical Protestant 81,470 220 Other 27,665 74 Mainline Protestant 25,031 59 Orthodox 1,644 3 Black Protestant 1,625 12 None 349,863 -
Source: Clifford Grammich, Kirk Hadaway, Richard Houseal, Dale E.Jones, Alexei Krindatch, Richie Stanley and Richard H.Taylor. 2012. 2010 U.S.Religion Census: Religious Congregations & Membership Study. Association of Statisticians of American Religious Bodies. Jones, Dale E., et al. 2002. Congregations and Membership in the United States 2000. Nashville, TN: Glenmary Research Center. Graphs represent county-level data
Food Environment Statistics: Number of grocery stores : 85Bernalillo County :
1.35 / 10,000 pop.New Mexico :
1.44 / 10,000 pop.
Number of supercenters and club stores : 11Bernalillo County :
0.18 / 10,000 pop.State :
0.21 / 10,000 pop.
Number of convenience stores (no gas) : 11This county :
0.18 / 10,000 pop.State :
0.32 / 10,000 pop.
Number of convenience stores (with gas) : 189Bernalillo County :
3.01 / 10,000 pop.New Mexico :
4.06 / 10,000 pop.
Number of full-service restaurants : 437Here :
6.96 / 10,000 pop.New Mexico :
7.12 / 10,000 pop.
Adult diabetes rate : This county :
5.3%New Mexico :
6.4%
Adult obesity rate : Bernalillo County :
20.0%State :
22.1%
Low-income preschool obesity rate : Here :
9.8%New Mexico :
11.5%
Health and Nutrition: Healthy diet rate : This city:
47.4%New Mexico:
49.0%
Average overall health of teeth and gums : South Valley:
47.2%New Mexico:
48.1%
Average BMI : South Valley:
28.6State:
28.6
People feeling badly about themselves : Here:
21.7%New Mexico:
20.7%
People not drinking alcohol at all : This city:
9.7%New Mexico:
10.1%
Average hours sleeping at night : South Valley:
6.7New Mexico:
6.8
Overweight people : Here:
33.9%New Mexico:
34.6%
General health condition : Average condition of hearing : This city:
80.8%State:
80.3%
More about Health and Nutrition of South Valley, NM Residents
5.56% of this county's 2021 resident taxpayers lived in other counties in 2020 ($59,103 average adjusted gross income )
Here:
5.56%New Mexico average:
6.50%
0.05% of residents moved from foreign countries ($562 average AGI )Bernalillo County:
0.05%New Mexico average:
0.07%
Top counties from which taxpayers relocated into this county between 2020 and 2021:
5.93% of this county's 2020 resident taxpayers moved to other counties in 2021 ($60,689 average adjusted gross income )
Here:
5.93%New Mexico average:
6.53%
0.05% of residents moved to foreign countries ($614 average AGI )Bernalillo County:
0.05%New Mexico average:
0.05%
Top counties to which taxpayers relocated from this county between 2020 and 2021: Strongest AM radio stations in South Valley:
KNML (610 AM; 5 kW; ALBUQUERQUE, NM; Owner: CITADEL BROADCASTING COMPANY)
KXKS (1190 AM; 10 kW; ALBUQUERQUE, NM; Owner: CLEAR CHANNEL BROADCASTING LICENSES, INC.)
KDAZ (730 AM; 1 kW; ALBUQUERQUE, NM; Owner: PAN AMERICAN BROADCASTING CO., INC.)
KABQ (1350 AM; 5 kW; ALBUQUERQUE, NM; Owner: CLEAR CHANNEL BROADCASTING LICENSES, INC.)
KKJY (1550 AM; 5 kW; ALBUQUERQUE, NM; Owner: VANGUARD MEDIA, L.L.C)
KKIM (1000 AM; 10 kW; ALBUQUERQUE, NM; Owner: AGM-NEVADA, LLC)
KANM (1600 AM; 10 kW; ALBUQUERQUE, NM; Owner: ARAGON BROADCASTING COMPANY, L.L.C.)
KTBL (1050 AM; 1 kW; LOS RANCHOS, NM; Owner: CITADEL BROADCASTING COMPANY)
KDEF (1150 AM; 5 kW; ALBUQUERQUE, NM; Owner: RAMH CORPORATION)
KKNS (1310 AM; 5 kW; CORRALES, NM; Owner: SIMMONS-NM, LS, LLC)
KKOB (770 AM; 50 kW; ALBUQUERQUE, NM; Owner: CITADEL BROADCASTING COMPANY)
KSVA (920 AM; 1 kW; ALBUQUERQUE, NM; Owner: LIFETALK RADIO, INC.)
KRZY (1450 AM; 1 kW; ALBUQUERQUE, NM; Owner: ENTRAVISION HOLDINGS, LLC)
Strongest FM radio stations in South Valley:
KNKT (107.1 FM; ARMIJO, NM; Owner: CALVARY CHAPEL OF ALBUQUERQUE, INC.)
KIOT (102.5 FM; LOS LUNAS, NM; Owner: HBC LICENSE CORPORATION)
KLYT (88.3 FM; ALBUQUERQUE, NM; Owner: CONNECTION COMMUNICATIONS ASSOCIATION, INC.)
KTZO (103.3 FM; ALBUQUERQUE, NM; Owner: CITADEL BROADCASTING COMPANY)
KKOB-FM (93.3 FM; ALBUQUERQUE, NM; Owner: CITADEL BROADCASTING COMPANY)
KUNM (89.9 FM; ALBUQUERQUE, NM; Owner: BOARD OF REGENTS UNIV. OF NEW MEXICO)
KANW (89.1 FM; ALBUQUERQUE, NM; Owner: BD. OF EDUC. CITY OF ALBUQUERQUE, NM)
KBZU (96.3 FM; ALBUQUERQUE, NM; Owner: CITADEL BROADCASTING COMPANY)
KBQI (107.9 FM; ALBUQUERQUE, NM; Owner: CITICASTERS LICENSES, L.P.)
KMGA (99.5 FM; ALBUQUERQUE, NM; Owner: CITADEL BROADCASTING COMPANY)
KZRR (94.1 FM; ALBUQUERQUE, NM; Owner: CLEAR CHANNEL BROADCASTING LICENSES, INC.)
KRST (92.3 FM; ALBUQUERQUE, NM; Owner: CITADEL BROADCASTING COMPANY)
KPEK (100.3 FM; ALBUQUERQUE, NM; Owner: CITICASTERS LICENSES, L.P.)
K265CA (100.9 FM; ALBUQUERQUE, NM; Owner: CITICASTERS LICENSES, L.P.)
KFLQ (91.5 FM; ALBUQUERQUE, NM; Owner: FAMILY LIFE BROADCASTING SYSTEM)
K213BT (90.5 FM; ALBUQUERQUE, NM; Owner: EDUCATIONAL MEDIA FOUNDATION)
KSYU (95.1 FM; CORRALES, NM; Owner: CITICASTERS LICENSES, INC.)
KJFA (101.3 FM; ALBUQUERQUE, NM; Owner: HBC LICENSE CORPORATION)
KTEG (104.7 FM; BOSQUE FARMS, NM; Owner: CLEAR CHANNEL BROADCASTING LICENSES, INC.)
KYLZ (106.3 FM; LOS LUNAS, NM; Owner: AGM-NEVADA, LLC)
TV broadcast stations around South Valley:
K43HW (Channel 43; ALBUQUERQUE, NM; Owner: JOSEPH W. SHAFFER)
KWBQ (Channel 19; SANTA FE, NM; Owner: ACME TV LICENSES OF NEW MEXICO, LLC)
K17DD (Channel 17; ALBUQUERQUE, NM; Owner: THREE ANGELS BROADCASTING NETWORK, INC.)
KTFQ (Channel 14; ALBUQUERQUE, NM; Owner: TELEFUTURA TELEVISION GROUP, INC.)
KQDF-LP (Channel 25; ALBUQUERQUE, NM; Owner: JOSEPH W. SHAFFER)
KASA-TV (Channel 2; SANTA FE, NM; Owner: RAYCOM NATIONAL, INC.)
KOAT-TV (Channel 7; ALBUQUERQUE, NM; Owner: KOAT HEARST-ARGYLE TELEVISION, INC.)
KNME-TV (Channel 5; ALBUQUERQUE, NM; Owner: REGENTS OF THE UNIV. OF NEW MEXICO)
KASY-TV (Channel 50; ALBUQUERQUE, NM; Owner: ACME TV LICENSES OF NEW MEXICO, LLC)
K46GY (Channel 46; SANTA FE, NM; Owner: RAMAR COMMUNICATIONS II, LTD.)
KYNM-LP (Channel 61; ALBUQUERQUE, NM; Owner: BELMAX BROADCASTING LLC)
KRQE (Channel 13; ALBUQUERQUE, NM; Owner: EMMIS TELEVISION LICENSE CORPORATION)
National Bridge Inventory (NBI) Statistics 37 Number of bridges1,171ft / 357m Total length $5,501,000 Total costs869,771 Total average daily traffic99,304 Total average daily truck traffic
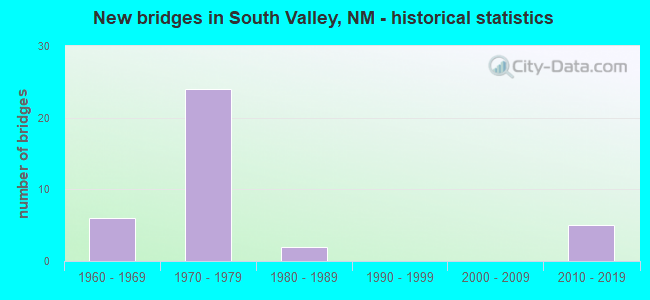
New bridges - historical statistics
6 1960-1969 24 1970-1979 2 1980-1989 5 2010-2019
See full National Bridge Inventory statistics for South Valley, NM
FCC Registered Microwave Towers: 4
RIO BRAVO, 2044 E Louise Avenue Sw (Lat: 34.984500 Lon: -106.695861), Type: Pole, Structure height: 26.8 m, Overall height: 28.6 m, Call Sign: WQOH408, Assigned Frequencies: 10715.0 MHz, 11115.0 MHz, Grant Date: 09/27/2011, Expiration Date: 09/27/2021, Cancellation Date: 12/19/2018, Certifier: Pamelia Y Hoof, Registrant: Verizon Wireless, 5055 North Point Pkwy, Np2ne Network Engineering, Alpharetta, GA 30022, Phone: (770) 797-1070, Fax: (678) 259-1319, Email:
EP03AL061, 8300 Broadway Blvd Se (Lat: 34.969778 Lon: -106.657167), Type: Bant, Structure height: 57.9 m, Overall height: 59.9 m, Call Sign: WQST528, Assigned Frequencies: 10775.0 MHz, 10975.0 MHz, 10775.0 MHz, 10975.0 MHz, 10775.0 MHz, 10975.0 MHz, 10775.0 MHz, 10975.0 MHz, 10775.0 MHz, 10975.0 MHz, 10775.0 MHz, 10975.0 MHz, Grant Date: 11/13/2013, Expiration Date: 11/13/2023, Cancellation Date: 05/10/2023, Certifier: David Werblow, Registrant: T-Mobile Usa, Inc., 12920 Se 38th Street, Bellevue, WA 98006, Phone: (425) 383-8401, Email:
ABQLED, 3630 Las Estancias Dr. Sw (Lat: 35.017778 Lon: -106.713611), Type: Mast, Structure height: 8 m, Overall height: 10 m, Call Sign: WRDB417, Licensee ID: L01166198, Assigned Frequencies: 11645.0 MHz, 11645.0 MHz, 11645.0 MHz, 11645.0 MHz, 11645.0 MHz, 11645.0 MHz, Grant Date: 03/19/2019, Expiration Date: 03/19/2029, Cancellation Date: 10/10/2019, Certifier: Brian Corman, Registrant: Business Only Broadband, LLC, 999 Oak Creek Drive, Lombard, IL 60148, Phone: (630) 590-6009, Fax: (630) 986-2496, Email:
SWRP, 4201 2nd St Sw (Lat: 35.018472 Lon: -106.663389), Type: Tank, Structure height: 53.3 m, Call Sign: WRWF209, Licensee ID: L00008333, Assigned Frequencies: 11385.0 MHz, 11385.0 MHz, 11385.0 MHz, 11385.0 MHz, 11385.0 MHz, 11385.0 MHz, 11385.0 MHz, 11385.0 MHz, 11385.0 MHz, 11385.0 MHz... (+20 more), Grant Date: 02/14/2023, Expiration Date: 02/14/2033, Certifier: Ivan Cortez, Registrant: Albuquerque Bernalillo County Water Util, Po Box 568, Albuquerque, NM 87103, Phone: (505) 938-3951, Email:
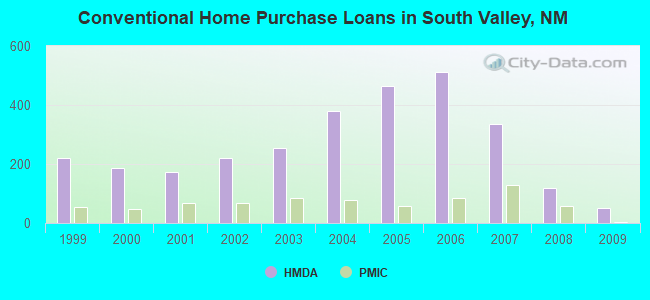
Home Mortgage Disclosure Act Aggregated Statistics For Year 2009(Based on 6 full and 5 partial tracts) A) FHA, FSA/RHS & VA B) Conventional C) Refinancings D) Home Improvement Loans F) Non-occupant Loans on G) Loans On Manufactured Number Average Value Number Average Value Number Average Value Number Average Value Number Average Value Number Average Value
LOANS ORIGINATED 85 $130,637 52 $109,378 447 $142,127 48 $53,995 30 $86,801 22 $103,661 APPLICATIONS APPROVED, NOT ACCEPTED 11 $125,207 8 $91,972 59 $156,660 9 $68,389 6 $112,435 4 $46,482 APPLICATIONS DENIED 21 $100,935 21 $92,830 335 $147,485 69 $36,300 23 $119,116 28 $94,404 APPLICATIONS WITHDRAWN 22 $109,535 6 $185,723 163 $158,514 13 $75,195 11 $203,881 11 $103,139 FILES CLOSED FOR INCOMPLETENESS 2 $72,230 2 $53,480 48 $141,377 7 $67,979 3 $123,157 3 $77,987
Aggregated Statistics For Year 2008(Based on 6 full and 5 partial tracts) A) FHA, FSA/RHS & VA B) Conventional C) Refinancings D) Home Improvement Loans E) Loans on Dwellings For 5+ Families F) Non-occupant Loans on G) Loans On Manufactured Number Average Value Number Average Value Number Average Value Number Average Value Number Average Value Number Average Value Number Average Value
LOANS ORIGINATED 70 $140,922 117 $135,334 448 $139,232 72 $62,472 2 $111,065 47 $108,088 25 $102,926 APPLICATIONS APPROVED, NOT ACCEPTED 7 $152,773 19 $162,213 93 $141,622 11 $61,473 0 $0 11 $97,129 7 $95,940 APPLICATIONS DENIED 14 $141,908 55 $129,819 512 $145,476 117 $55,734 2 $116,530 28 $104,649 34 $94,220 APPLICATIONS WITHDRAWN 17 $148,874 26 $122,949 194 $157,553 17 $123,352 0 $0 11 $105,945 11 $105,693 FILES CLOSED FOR INCOMPLETENESS 3 $134,133 5 $112,270 44 $132,280 8 $60,802 0 $0 4 $95,540 0 $0
Aggregated Statistics For Year 2007(Based on 6 full and 5 partial tracts) A) FHA, FSA/RHS & VA B) Conventional C) Refinancings D) Home Improvement Loans E) Loans on Dwellings For 5+ Families F) Non-occupant Loans on G) Loans On Manufactured Number Average Value Number Average Value Number Average Value Number Average Value Number Average Value Number Average Value Number Average Value
LOANS ORIGINATED 29 $147,434 337 $126,722 624 $131,131 140 $57,682 2 $1,704,520 87 $106,701 30 $85,251 APPLICATIONS APPROVED, NOT ACCEPTED 5 $100,962 65 $120,802 148 $140,334 23 $69,103 0 $0 23 $114,439 11 $73,355 APPLICATIONS DENIED 8 $130,995 169 $142,725 726 $134,752 163 $59,283 0 $0 76 $106,172 65 $80,444 APPLICATIONS WITHDRAWN 5 $156,036 54 $121,193 347 $133,908 37 $75,571 0 $0 21 $105,992 9 $63,377 FILES CLOSED FOR INCOMPLETENESS 1 $99,000 23 $145,492 77 $137,692 9 $87,726 0 $0 2 $197,835 2 $101,515
Aggregated Statistics For Year 2006(Based on 6 full and 5 partial tracts) A) FHA, FSA/RHS & VA B) Conventional C) Refinancings D) Home Improvement Loans E) Loans on Dwellings For 5+ Families F) Non-occupant Loans on G) Loans On Manufactured Number Average Value Number Average Value Number Average Value Number Average Value Number Average Value Number Average Value Number Average Value
LOANS ORIGINATED 41 $127,179 512 $109,243 691 $116,793 121 $48,189 2 $367,480 148 $89,780 41 $84,377 APPLICATIONS APPROVED, NOT ACCEPTED 12 $108,777 83 $107,524 131 $121,967 16 $59,124 0 $0 25 $93,457 15 $95,407 APPLICATIONS DENIED 7 $99,154 271 $96,455 746 $123,937 174 $48,955 0 $0 92 $95,059 75 $79,150 APPLICATIONS WITHDRAWN 7 $126,649 109 $92,527 423 $123,599 40 $65,744 1 $649,560 35 $84,828 13 $78,989 FILES CLOSED FOR INCOMPLETENESS 1 $170,000 24 $90,368 115 $133,738 7 $109,624 0 $0 6 $72,607 1 $100,000
Aggregated Statistics For Year 2005(Based on 6 full and 5 partial tracts) A) FHA, FSA/RHS & VA B) Conventional C) Refinancings D) Home Improvement Loans F) Non-occupant Loans on G) Loans On Manufactured Number Average Value Number Average Value Number Average Value Number Average Value Number Average Value Number Average Value
LOANS ORIGINATED 65 $118,923 463 $97,254 632 $107,279 84 $53,932 118 $91,837 36 $78,901 APPLICATIONS APPROVED, NOT ACCEPTED 8 $88,521 71 $98,515 145 $117,830 13 $30,597 23 $81,427 16 $74,222 APPLICATIONS DENIED 15 $99,682 157 $89,663 773 $111,250 133 $42,383 42 $84,518 59 $66,316 APPLICATIONS WITHDRAWN 8 $107,064 114 $102,181 444 $116,602 54 $128,241 36 $93,199 11 $72,025 FILES CLOSED FOR INCOMPLETENESS 0 $0 11 $101,971 49 $120,611 3 $28,597 7 $81,256 2 $81,070
Aggregated Statistics For Year 2004(Based on 6 full and 5 partial tracts) A) FHA, FSA/RHS & VA B) Conventional C) Refinancings D) Home Improvement Loans E) Loans on Dwellings For 5+ Families F) Non-occupant Loans on G) Loans On Manufactured Number Average Value Number Average Value Number Average Value Number Average Value Number Average Value Number Average Value Number Average Value
LOANS ORIGINATED 99 $104,102 378 $96,183 696 $99,514 88 $49,419 1 $94,000 96 $83,810 57 $72,751 APPLICATIONS APPROVED, NOT ACCEPTED 6 $97,307 94 $116,327 132 $108,347 17 $34,708 1 $38,200 21 $90,634 19 $75,639 APPLICATIONS DENIED 30 $106,347 163 $73,258 564 $99,951 118 $38,325 0 $0 36 $80,919 65 $51,364 APPLICATIONS WITHDRAWN 22 $96,476 61 $95,529 356 $114,282 19 $46,854 0 $0 24 $89,772 14 $94,374 FILES CLOSED FOR INCOMPLETENESS 0 $0 6 $81,233 42 $98,383 5 $23,868 0 $0 2 $56,775 0 $0
Aggregated Statistics For Year 2003(Based on 6 full and 5 partial tracts) A) FHA, FSA/RHS & VA B) Conventional C) Refinancings D) Home Improvement Loans E) Loans on Dwellings For 5+ Families F) Non-occupant Loans on Number Average Value Number Average Value Number Average Value Number Average Value Number Average Value Number Average Value
LOANS ORIGINATED 118 $108,490 253 $96,596 1,222 $95,767 79 $23,447 1 $131,580 95 $75,805 APPLICATIONS APPROVED, NOT ACCEPTED 14 $114,375 51 $80,835 168 $99,655 9 $36,550 0 $0 20 $75,980 APPLICATIONS DENIED 25 $99,956 84 $70,719 655 $99,340 70 $35,562 1 $141,000 26 $71,010 APPLICATIONS WITHDRAWN 11 $100,107 45 $98,383 386 $105,085 14 $46,531 0 $0 25 $82,471 FILES CLOSED FOR INCOMPLETENESS 5 $86,666 16 $85,869 47 $100,171 2 $27,105 0 $0 1 $70,050
Aggregated Statistics For Year 2002(Based on 6 full and 5 partial tracts) A) FHA, FSA/RHS & VA B) Conventional C) Refinancings D) Home Improvement Loans F) Non-occupant Loans on Number Average Value Number Average Value Number Average Value Number Average Value Number Average Value
LOANS ORIGINATED 91 $99,368 221 $90,070 824 $92,296 71 $22,809 84 $70,963 APPLICATIONS APPROVED, NOT ACCEPTED 6 $73,778 39 $72,094 183 $90,737 14 $22,727 9 $73,080 APPLICATIONS DENIED 18 $79,626 113 $60,909 546 $89,965 90 $22,950 35 $66,483 APPLICATIONS WITHDRAWN 14 $101,180 21 $99,375 278 $97,687 11 $35,138 14 $80,871 FILES CLOSED FOR INCOMPLETENESS 2 $124,230 18 $76,837 92 $97,364 0 $0 2 $82,145
Aggregated Statistics For Year 2001(Based on 6 full and 5 partial tracts) A) FHA, FSA/RHS & VA B) Conventional C) Refinancings D) Home Improvement Loans E) Loans on Dwellings For 5+ Families F) Non-occupant Loans on Number Average Value Number Average Value Number Average Value Number Average Value Number Average Value Number Average Value
LOANS ORIGINATED 89 $97,380 174 $90,543 795 $90,288 89 $19,372 0 $0 109 $82,275 APPLICATIONS APPROVED, NOT ACCEPTED 4 $89,960 81 $59,679 128 $88,197 13 $15,338 0 $0 11 $76,702 APPLICATIONS DENIED 11 $90,274 298 $48,924 663 $85,774 122 $14,714 1 $159,890 49 $100,672 APPLICATIONS WITHDRAWN 13 $95,059 49 $87,062 343 $89,901 21 $23,738 0 $0 14 $90,321 FILES CLOSED FOR INCOMPLETENESS 4 $97,052 7 $50,576 69 $99,791 2 $26,805 0 $0 3 $76,963
Aggregated Statistics For Year 2000(Based on 6 full and 5 partial tracts) A) FHA, FSA/RHS & VA B) Conventional C) Refinancings D) Home Improvement Loans E) Loans on Dwellings For 5+ Families F) Non-occupant Loans on Number Average Value Number Average Value Number Average Value Number Average Value Number Average Value Number Average Value
LOANS ORIGINATED 95 $89,497 187 $81,205 406 $77,219 72 $20,763 2 $193,835 40 $58,511 APPLICATIONS APPROVED, NOT ACCEPTED 9 $74,799 66 $68,558 158 $87,501 26 $14,966 0 $0 8 $73,516 APPLICATIONS DENIED 28 $83,002 248 $52,072 592 $78,703 67 $25,793 0 $0 42 $68,015 APPLICATIONS WITHDRAWN 18 $79,466 49 $99,006 264 $79,091 8 $41,690 0 $0 17 $77,987 FILES CLOSED FOR INCOMPLETENESS 3 $76,113 20 $88,010 80 $94,369 1 $22,110 0 $0 8 $68,929
Aggregated Statistics For Year 1999(Based on 6 full and 5 partial tracts) A) FHA, FSA/RHS & VA B) Conventional C) Refinancings D) Home Improvement Loans E) Loans on Dwellings For 5+ Families F) Non-occupant Loans on Number Average Value Number Average Value Number Average Value Number Average Value Number Average Value Number Average Value
LOANS ORIGINATED 103 $93,938 219 $67,860 779 $78,969 81 $19,486 0 $0 69 $61,893 APPLICATIONS APPROVED, NOT ACCEPTED 5 $105,892 131 $62,131 303 $77,028 26 $24,486 1 $17,840 11 $57,335 APPLICATIONS DENIED 22 $88,070 385 $54,682 597 $77,169 100 $22,468 1 $370,000 39 $58,910 APPLICATIONS WITHDRAWN 17 $90,288 71 $76,746 360 $78,895 23 $50,554 0 $0 21 $60,197 FILES CLOSED FOR INCOMPLETENESS 10 $83,893 12 $69,733 90 $83,504 1 $25,000 0 $0 6 $47,033
Detailed mortgage data for all 10 tracts in South Valley, NM
Private Mortgage Insurance Companies Aggregated Statistics For Year 2009(Based on 5 full and 5 partial tracts) A) Conventional B) Refinancings Number Average Value Number Average Value
LOANS ORIGINATED 5 $171,496 12 $202,676 APPLICATIONS APPROVED, NOT ACCEPTED 3 $138,103 11 $216,291 APPLICATIONS DENIED 0 $0 3 $245,333 APPLICATIONS WITHDRAWN 0 $0 0 $0 FILES CLOSED FOR INCOMPLETENESS 1 $68,000 0 $0
Aggregated Statistics For Year 2008(Based on 6 full and 5 partial tracts) A) Conventional B) Refinancings C) Non-occupant Loans on Number Average Value Number Average Value Number Average Value
LOANS ORIGINATED 57 $145,905 55 $175,405 11 $147,569 APPLICATIONS APPROVED, NOT ACCEPTED 27 $176,393 24 $162,803 6 $139,018 APPLICATIONS DENIED 2 $174,160 7 $157,204 3 $175,467 APPLICATIONS WITHDRAWN 3 $173,817 0 $0 0 $0 FILES CLOSED FOR INCOMPLETENESS 3 $111,030 0 $0 2 $94,720
Aggregated Statistics For Year 2007(Based on 6 full and 5 partial tracts) A) Conventional B) Refinancings C) Non-occupant Loans on D) Loans On Manufactured Number Average Value Number Average Value Number Average Value Number Average Value
LOANS ORIGINATED 129 $140,882 81 $166,913 10 $125,089 1 $117,790 APPLICATIONS APPROVED, NOT ACCEPTED 15 $141,209 21 $200,465 1 $144,220 0 $0 APPLICATIONS DENIED 4 $167,232 0 $0 0 $0 0 $0 APPLICATIONS WITHDRAWN 3 $103,763 5 $154,616 1 $58,000 0 $0 FILES CLOSED FOR INCOMPLETENESS 0 $0 1 $133,700 0 $0 0 $0
Aggregated Statistics For Year 2006(Based on 6 full and 5 partial tracts) A) Conventional B) Refinancings C) Non-occupant Loans on D) Loans On Manufactured Number Average Value Number Average Value Number Average Value Number Average Value
LOANS ORIGINATED 84 $132,953 46 $150,674 15 $117,759 4 $82,885 APPLICATIONS APPROVED, NOT ACCEPTED 11 $133,175 11 $157,553 1 $157,620 0 $0 APPLICATIONS DENIED 0 $0 0 $0 0 $0 0 $0 APPLICATIONS WITHDRAWN 1 $150,000 5 $115,148 0 $0 0 $0 FILES CLOSED FOR INCOMPLETENESS 0 $0 0 $0 0 $0 0 $0
Aggregated Statistics For Year 2005(Based on 6 full and 5 partial tracts) A) Conventional B) Refinancings C) Non-occupant Loans on D) Loans On Manufactured Number Average Value Number Average Value Number Average Value Number Average Value
LOANS ORIGINATED 58 $108,731 52 $120,538 12 $107,952 3 $48,423 APPLICATIONS APPROVED, NOT ACCEPTED 20 $94,948 28 $136,140 6 $102,460 2 $47,020 APPLICATIONS DENIED 1 $28,610 1 $51,510 1 $80,120 0 $0 APPLICATIONS WITHDRAWN 2 $166,500 6 $131,083 2 $121,965 1 $68,000 FILES CLOSED FOR INCOMPLETENESS 0 $0 1 $103,140 0 $0 0 $0
Aggregated Statistics For Year 2004(Based on 6 full and 5 partial tracts) A) Conventional B) Refinancings C) Non-occupant Loans on D) Loans On Manufactured Number Average Value Number Average Value Number Average Value Number Average Value
LOANS ORIGINATED 78 $104,189 78 $128,376 23 $88,473 4 $122,542 APPLICATIONS APPROVED, NOT ACCEPTED 14 $141,159 28 $126,560 1 $102,680 0 $0 APPLICATIONS DENIED 0 $0 0 $0 0 $0 0 $0 APPLICATIONS WITHDRAWN 7 $114,151 6 $131,113 3 $118,430 0 $0 FILES CLOSED FOR INCOMPLETENESS 2 $79,750 2 $90,725 1 $110,780 0 $0
Aggregated Statistics For Year 2003(Based on 6 full and 5 partial tracts) A) Conventional B) Refinancings C) Non-occupant Loans on Number Average Value Number Average Value Number Average Value
LOANS ORIGINATED 86 $101,752 141 $114,221 15 $95,959 APPLICATIONS APPROVED, NOT ACCEPTED 12 $105,555 25 $117,898 3 $161,360 APPLICATIONS DENIED 2 $50,125 2 $102,905 0 $0 APPLICATIONS WITHDRAWN 4 $71,698 5 $102,518 3 $83,577 FILES CLOSED FOR INCOMPLETENESS 2 $111,640 1 $95,500 1 $103,280
Aggregated Statistics For Year 2002(Based on 6 full and 5 partial tracts) A) Conventional B) Refinancings C) Non-occupant Loans on Number Average Value Number Average Value Number Average Value
LOANS ORIGINATED 69 $100,547 91 $115,876 16 $59,791 APPLICATIONS APPROVED, NOT ACCEPTED 15 $99,871 29 $110,901 2 $128,035 APPLICATIONS DENIED 3 $121,457 1 $81,170 0 $0 APPLICATIONS WITHDRAWN 5 $87,044 7 $113,700 0 $0 FILES CLOSED FOR INCOMPLETENESS 0 $0 0 $0 0 $0
Aggregated Statistics For Year 2001(Based on 6 full and 5 partial tracts) A) Conventional B) Refinancings C) Non-occupant Loans on Number Average Value Number Average Value Number Average Value
LOANS ORIGINATED 67 $110,721 99 $109,927 15 $86,597 APPLICATIONS APPROVED, NOT ACCEPTED 14 $110,956 24 $124,923 3 $71,803 APPLICATIONS DENIED 3 $148,897 4 $131,162 2 $94,000 APPLICATIONS WITHDRAWN 2 $119,950 2 $138,635 2 $119,950 FILES CLOSED FOR INCOMPLETENESS 1 $73,960 0 $0 0 $0
Aggregated Statistics For Year 2000(Based on 6 full and 5 partial tracts) A) Conventional B) Refinancings C) Non-occupant Loans on Number Average Value Number Average Value Number Average Value
LOANS ORIGINATED 48 $105,095 43 $94,645 8 $75,834 APPLICATIONS APPROVED, NOT ACCEPTED 8 $146,366 11 $112,039 1 $79,550 APPLICATIONS DENIED 5 $87,174 6 $104,758 1 $74,820 APPLICATIONS WITHDRAWN 0 $0 1 $148,390 0 $0 FILES CLOSED FOR INCOMPLETENESS 0 $0 1 $62,000 1 $62,000
Aggregated Statistics For Year 1999(Based on 6 full and 5 partial tracts) A) Conventional B) Refinancings C) Non-occupant Loans on Number Average Value Number Average Value Number Average Value
LOANS ORIGINATED 53 $94,861 52 $103,230 7 $80,321 APPLICATIONS APPROVED, NOT ACCEPTED 4 $100,142 7 $84,219 0 $0 APPLICATIONS DENIED 4 $119,562 4 $100,222 0 $0 APPLICATIONS WITHDRAWN 0 $0 4 $89,665 1 $74,000 FILES CLOSED FOR INCOMPLETENESS 1 $163,000 2 $82,610 0 $0
South Valley compared to New Mexico state average:
Unemployed percentage below state average. Black race population percentage below state average. Foreign-born population percentage above state average. Length of stay since moving in significantly above state average. South Valley on our top lists :
#31 on the list of "Top 101 cities where residents moved in more then 10 years ago (10,000+ households)"
#12 on the list of "Top 101 counties with highest percentage of residents voting for 3rd party candidates in the 2012 Presidential Election"
#21 on the list of "Top 101 counties with the highest Particulate Matter (PM10 ) Annual air pollution readings in 2012 (µg/m3 )"
#22 on the list of "Top 101 counties with the highest ground withdrawal of fresh water for public supply"
#38 on the list of "Top 101 counties with the lowest surface withdrawal of fresh water for public supply"
#59 on the list of "Top 101 counties with the highest percentage of residents that exercised in the past month"


 Recent articles from our blog. Our writers, many of them Ph.D. graduates or candidates, create easy-to-read articles on a wide variety of topics.

 (7.4 miles
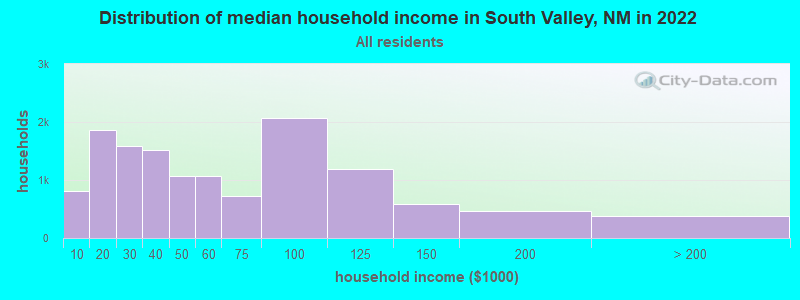


 Based on the data from the years 2006 - 2018 the average number of fire incidents per year is 15. The highest number of reported fire incidents - 39 took place in 2007, and the least - 6 in 2015. The data has a decreasing trend.
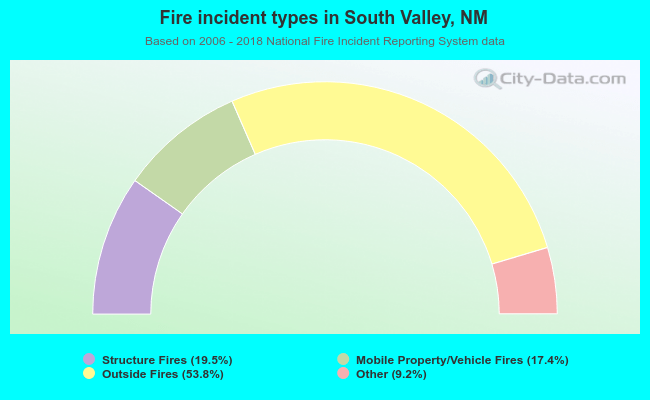 When looking into fire subcategories, the most incidents belonged to: Outside Fires (53.8%), and Structure Fires (19.5%).