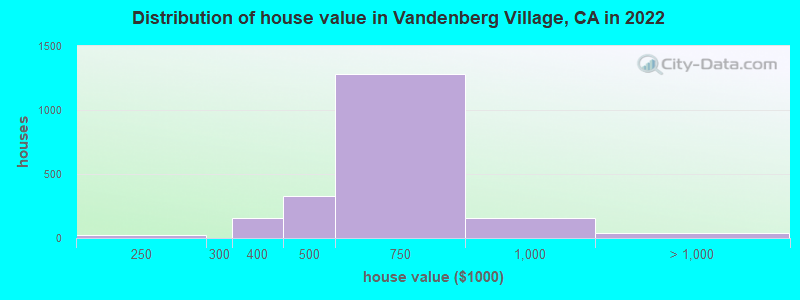
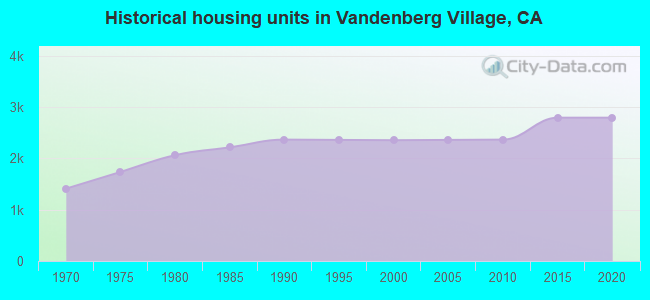
Estimated median house or condo value in 2022: $575,194 (it was $169,400 in 2000)
Vandenberg Village:
$575,194
CA:
$715,900
Mean prices in 2022:all housing units: over $1,000,000; detached houses: over $1,000,000; townhouses or other attached units: $846,704; in 2-unit structures: $831,856; in 3-to-4-unit structures: $952,887; in 5-or-more-unit structures: $595,438; mobile homes: $232,814; occupied boats, rvs, vans, etc.: $45,964
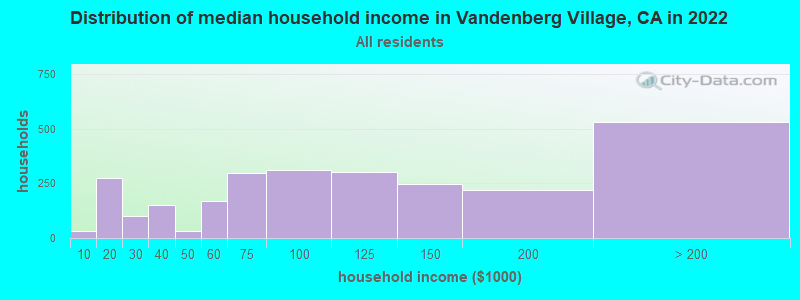
Median gross rent in 2022: $1,902.
March 2022 cost of living index in Vandenberg Village: 111.0 (more than average, U.S. average is 100)
Percentage of residents living in poverty in 2022: 5.4%
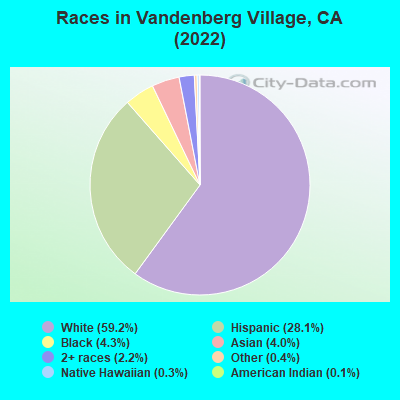
(3.3% for White Non-Hispanic residents, 53.1% for Black residents, 2.5% for Hispanic or Latino residents, 2.4% for other race residents, 2.1% for two or more races residents)
210.3%Native Hawaiian and Other Pacific Islander alone
90.1%American Indian alone
According to our research of California and other state lists, there was 1 registered sex offender living in Vandenberg Village, California as of May 04, 2024. The ratio of all residents to sex offenders in Vandenberg Village is 7,256 to 1. The ratio of registered sex offenders to all residents in this city is much lower than the state average.
Recent articles from our blog. Our writers, many of them Ph.D. graduates or candidates, create easy-to-read articles on a wide variety of topics.
Latest news from Vandenberg Village, CA collected exclusively by city-data.com from local newspapers, TV, and radio stations
Ancestries: American (10.7%), English (8.0%), German (6.5%), European (6.0%), Irish (3.5%), French (2.2%).
Current Local Time: PST time zone
Elevation: 365 feet
Land area: 5.22 square miles.
Population density: 1,244 people per square mile (low).
844 residents are foreign born (4.3% Asia, 3.7% Latin America, 3.4% Europe).
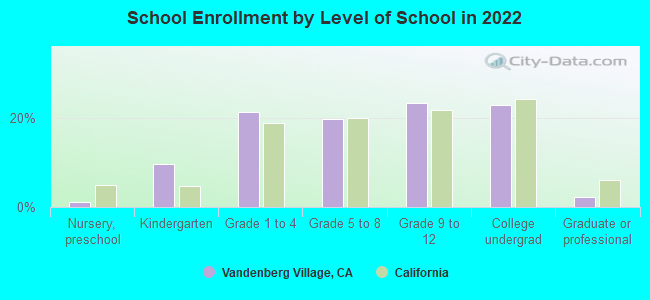
This place:
12.6%
California:
26.5%
Median real estate property taxes paid for housing units with mortgages in 2022: $3,805 (0.6%) Median real estate property taxes paid for housing units with no mortgage in 2022: $3,057 (0.6%)
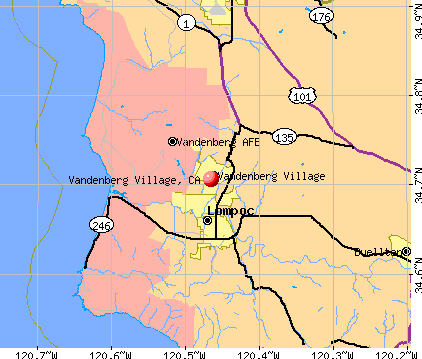
Nearest city with pop. 50,000+: Lompoc Valley, CA (5.2 miles , pop. 58,301).
Nearest city with pop. 200,000+: Bakersfield, CA (92.9 miles , pop. 247,057).
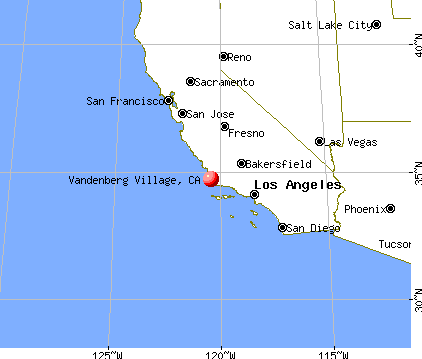
Nearest city with pop. 1,000,000+: Los Angeles, CA (126.7 miles , pop. 3,694,820).
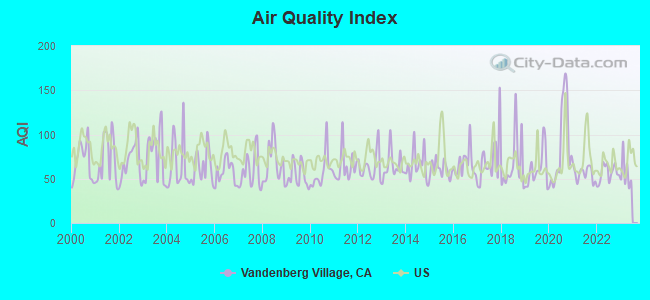
Air Quality Index (AQI) level in 2022 was 56.4. This is better than average.
City:
56.4
U.S.:
72.6
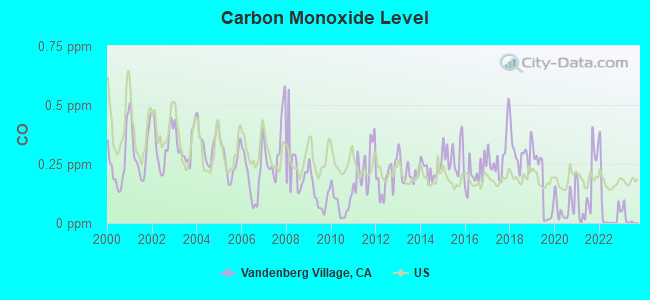
Carbon Monoxide (CO) [ppm] level in 2022 was 0.0525. This is significantly better than average.Closest monitor was 4.0 miles away from the city center.
City:
0.0525
U.S.:
0.2513
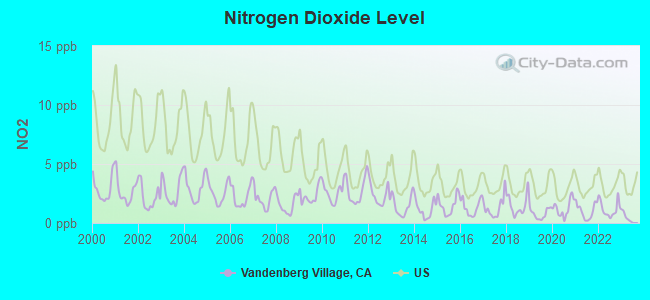
Nitrogen Dioxide (NO2) [ppb] level in 2022 was 1.19. This is significantly better than average.Closest monitor was 2.5 miles away from the city center.
City:
1.19
U.S.:
5.11
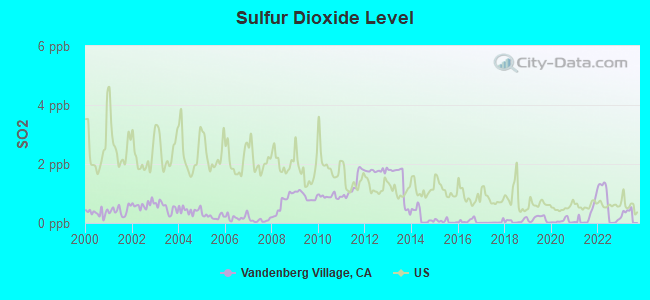
Sulfur Dioxide (SO2) [ppb] level in 2022 was 0.611. This is significantly better than average.Closest monitor was 2.5 miles away from the city center.
City:
0.611
U.S.:
1.515
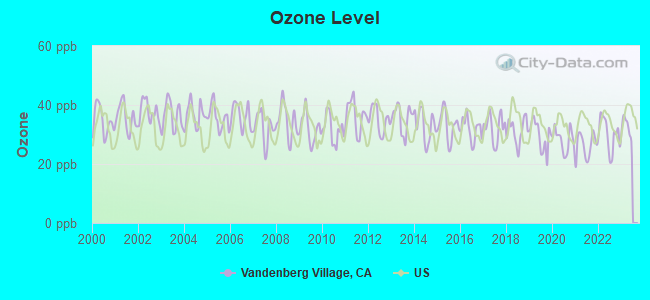
Ozone [ppb] level in 2022 was 30.0. This is about average.Closest monitor was 2.5 miles away from the city center.
City:
30.0
U.S.:
33.3
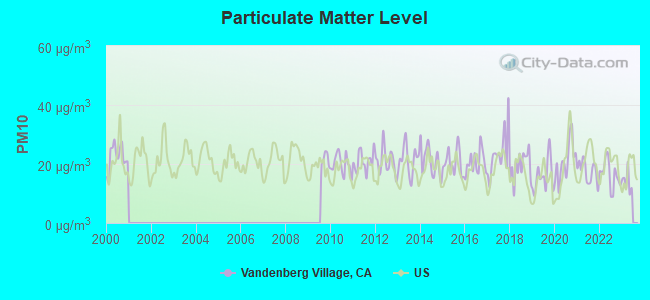
Particulate Matter (PM10) [µg/m3] level in 2022 was 16.5. This is about average.Closest monitor was 4.8 miles away from the city center.
City:
16.5
U.S.:
19.2
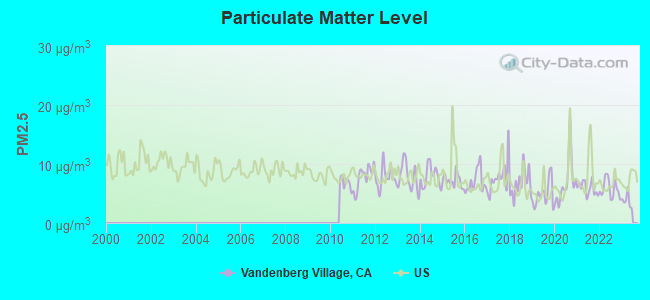
Particulate Matter (PM2.5) [µg/m3] level in 2022 was 5.81. This is better than average.Closest monitor was 4.8 miles away from the city center.
City:
5.81
U.S.:
8.11
Earthquake activity:
Vandenberg Village-area historical earthquake activity is significantly above California state average. It is 6327% greater than the overall U.S. average.
On 7/21/1952 at 11:52:14, a magnitude 7.7 (7.7 UK, Class: Major, Intensity: VIII - XII) earthquake occurred 85.6 miles away from the city center, causing $50,000,000 total damage On 11/4/1927 at 13:51:53, a magnitude 7.5 (7.5 UK) earthquake occurred 35.2 miles away from the city center On 4/18/1906 at 13:12:21, a magnitude 7.9 (7.9 UK) earthquake occurred 268.0 miles away from the city center, causing $524,000,000 total damage On 6/28/1992 at 11:57:34, a magnitude 7.6 (6.2 MB, 7.6 MS, 7.3 MW, Depth: 0.7 mi) earthquake occurred 227.2 miles away from the city center, causing 3 deaths (1 shaking deaths, 2 other deaths) and 400 injuries, causing $100,000,000 total damage and $40,000,000 insured losses On 10/16/1999 at 09:46:44, a magnitude 7.4 (6.3 MB, 7.4 MS, 7.2 MW, 7.3 ML) earthquake occurred 229.8 miles away from the city center On 10/18/1989 at 00:04:15, a magnitude 7.1 (6.5 MB, 7.1 MS, 6.9 MW, 7.0 ML) earthquake occurred 181.6 miles away from Vandenberg Village center, causing 62 deaths (62 shaking deaths) and 3757 injuries, causing $1,305,032,704 total damage Magnitude types: body-wave magnitude (MB), local magnitude (ML), surface-wave magnitude (MS), moment magnitude (MW)
Natural disasters:
The number of natural disasters in Santa Barbara County (31) is a lot greater than the US average (15). Major Disasters (Presidential) Declared: 19 Emergencies Declared: 3
Causes of natural disasters: Floods: 17, Fires: 10, Storms: 8, Winter Storms: 8, Mudslides: 7, Landslides: 4, Drought: 1, Earthquake: 1, Freeze: 1, Hurricane: 1, Tornado: 1, Wind: 1, Other: 1 (Note: some incidents may be assigned to more than one category).
Hospitals and medical centers near Vandenberg Village:
LOMPOC SKILLED AND REHAB CENTER (Nursing Home, about 4 miles away; LOMPOC, CA)
LOMPOC ARTIFICIAL KIDNEY CENTER, LLC (Dialysis Facility, about 4 miles away; LOMPOC, CA)
LA PALOMA GROUP HOME (Hospital, about 5 miles away; LOMPOC, CA)
LOMPOC VALLEY MEDICAL CENTER Acute Care Hospitals (about 5 miles away; LOMPOC, CA)
GENESIS DEVELOPMENTAL SERVICES - MOONCREST (Hospital, about 12 miles away; SANTA MARIA, CA)
CENTRAL COAST KIDNEY DISEASE CENTER (Dialysis Facility, about 15 miles away; SANTA MARIA, CA)
Amtrak stations near Vandenberg Village:
5 miles: LOMPOC (LAUREL & N. H STS.) - Bus Station . Services: fully wheelchair accessible, public payphones, snack bar, free short-term parking, call for taxi service.
8 miles: LOMPOC-SURF STATION (LOMPOC, END OF OCEAN AVE.)
17 miles: BUELLTON (PEA SOUP ANDERSON REST., 376 AVE. OF FLA) - Bus Station
Colleges/universities with over 2000 students nearest to Vandenberg Village:
Allan Hancock College (about 17 miles; Santa Maria, CA; Full-time enrollment: 6,639)
University of California-Santa Barbara (about 41 miles; Santa Barbara, CA; FT enrollment: 22,806)
California Polytechnic State University-San Luis Obispo (about 43 miles; San Luis Obispo, CA; FT enrollment: 17,345)
Cuesta College (about 46 miles; San Luis Obispo, CA; FT enrollment: 6,518)
Santa Barbara City College (about 49 miles; Santa Barbara, CA; FT enrollment: 12,568)
Taft College (about 65 miles; Taft, CA; FT enrollment: 2,121)
Ventura College (about 77 miles; Ventura, CA; FT enrollment: 8,460)
Public elementary/middle schools in Vandenberg Village:
Santa Barbara County has a predicted average indoor radon screening level greater than 4 pCi/L (pico curies per liter) - Highest Potential
Average household size:
This place:
2.5 people
California:
2.9 people
Percentage of family households:
This place:
72.0%
Whole state:
68.7%
Percentage of households with unmarried partners:
This place:
3.8%
Whole state:
7.2%
Likely homosexual households (counted as self-reported same-sex unmarried-partner households)
Lesbian couples: 0.3% of all households
Gay men: 0.2% of all households
15 people in group homes intended for adults in 2010
4 people in group homes for juveniles (non-correctional) in 2010
64 people in nursing homes in 2000
6 people in homes for the mentally retarded in 2000
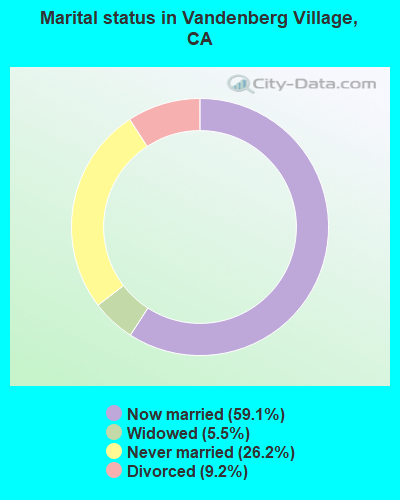
For population 15 years and over in Vandenberg Village:
Never married: 26.2%
Now married: 59.1%
Separated: 0.0%
Widowed: 5.5%
Divorced: 9.2%
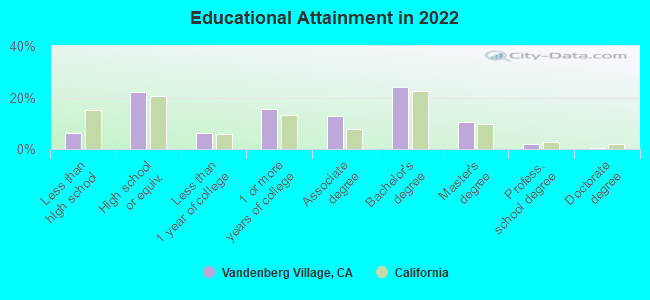
For population 25 years and over in Vandenberg Village:
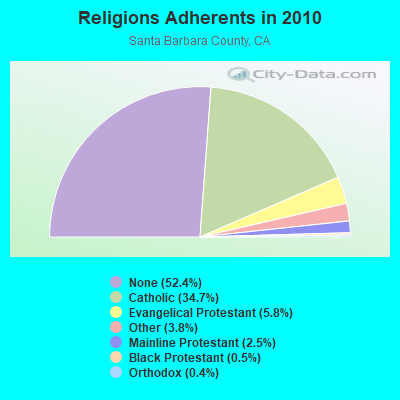
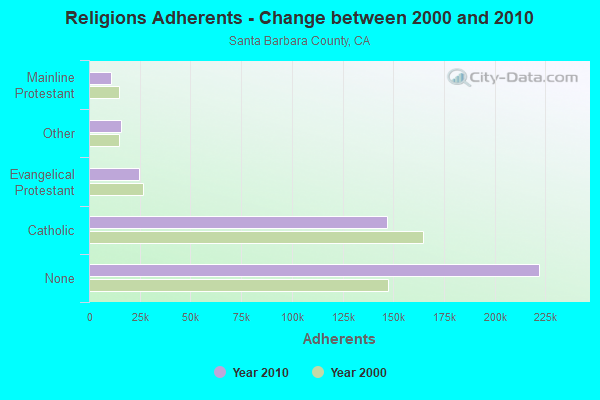
Religion statistics for Vandenberg Village, CA (based on Santa Barbara County data)
Religion
Adherents
Congregations
Catholic
146,940
17
Evangelical Protestant
24,775
161
Other
15,951
58
Mainline Protestant
10,610
43
Black Protestant
1,979
13
Orthodox
1,536
7
None
222,104
-
Source: Clifford Grammich, Kirk Hadaway, Richard Houseal, Dale E.Jones, Alexei Krindatch, Richie Stanley and Richard H.Taylor. 2012. 2010 U.S.Religion Census: Religious Congregations & Membership Study. Association of Statisticians of American Religious Bodies. Jones, Dale E., et al. 2002. Congregations and Membership in the United States 2000. Nashville, TN: Glenmary Research Center. Graphs represent county-level data
38,356Total future (year 2037) average daily traffic
FCC Registered Amateur Radio Licenses:
1
Call Sign: W6SAF, Grant Date: 06/25/1999, Expiration Date: 06/25/2009, Cancellation Date: 06/28/2011, Registrant: John R Nowak, 146 Oakhill Dr, Vandenberg Village, CA 93436
Home Mortgage Disclosure Act Aggregated Statistics For Year 2009 (Based on 1 partial tract)
A) FHA, FSA/RHS & VA Home Purchase Loans
B) Conventional Home Purchase Loans
C) Refinancings
D) Home Improvement Loans
F) Non-occupant Loans on < 5 Family Dwellings (A B C & D)
Number
Average Value
Number
Average Value
Number
Average Value
Number
Average Value
Number
Average Value
LOANS ORIGINATED
25
$305,810
14
$237,389
55
$250,268
3
$130,463
7
$214,449
APPLICATIONS APPROVED, NOT ACCEPTED
2
$303,715
0
$0
4
$304,835
0
$0
1
$169,530
APPLICATIONS DENIED
1
$282,250
1
$170,420
28
$280,984
1
$28,180
3
$178,770
APPLICATIONS WITHDRAWN
4
$287,390
1
$154,770
16
$261,866
1
$110,930
1
$141,350
FILES CLOSED FOR INCOMPLETENESS
0
$0
0
$0
2
$224,320
0
$0
0
$0
Aggregated Statistics For Year 2008 (Based on 1 partial tract)
A) FHA, FSA/RHS & VA Home Purchase Loans
B) Conventional Home Purchase Loans
C) Refinancings
D) Home Improvement Loans
F) Non-occupant Loans on < 5 Family Dwellings (A B C & D)
Number
Average Value
Number
Average Value
Number
Average Value
Number
Average Value
Number
Average Value
LOANS ORIGINATED
16
$312,635
19
$291,404
38
$207,288
5
$83,288
5
$237,784
APPLICATIONS APPROVED, NOT ACCEPTED
1
$236,170
4
$303,158
8
$208,834
0
$0
0
$0
APPLICATIONS DENIED
2
$394,965
0
$0
27
$299,459
2
$28,625
1
$259,430
APPLICATIONS WITHDRAWN
2
$267,710
6
$286,495
7
$336,497
1
$161,480
0
$0
FILES CLOSED FOR INCOMPLETENESS
0
$0
1
$106,900
1
$527,370
0
$0
0
$0
Aggregated Statistics For Year 2007 (Based on 1 partial tract)
A) FHA, FSA/RHS & VA Home Purchase Loans
B) Conventional Home Purchase Loans
C) Refinancings
D) Home Improvement Loans
F) Non-occupant Loans on < 5 Family Dwellings (A B C & D)
Number
Average Value
Number
Average Value
Number
Average Value
Number
Average Value
Number
Average Value
LOANS ORIGINATED
3
$356,050
45
$278,250
72
$219,997
8
$180,709
9
$258,539
APPLICATIONS APPROVED, NOT ACCEPTED
0
$0
5
$301,032
21
$277,603
2
$98,630
3
$245,120
APPLICATIONS DENIED
0
$0
12
$223,091
52
$281,205
3
$144,927
7
$234,577
APPLICATIONS WITHDRAWN
0
$0
9
$256,452
21
$300,096
3
$282,843
2
$384,680
FILES CLOSED FOR INCOMPLETENESS
0
$0
1
$320,270
7
$288,700
0
$0
1
$368,580
Aggregated Statistics For Year 2006 (Based on 1 partial tract)
B) Conventional Home Purchase Loans
C) Refinancings
D) Home Improvement Loans
F) Non-occupant Loans on < 5 Family Dwellings (A B C & D)
G) Loans On Manufactured Home Dwelling (A B C & D)
Number
Average Value
Number
Average Value
Number
Average Value
Number
Average Value
Number
Average Value
LOANS ORIGINATED
95
$264,077
88
$243,224
9
$114,658
7
$258,540
0
$0
APPLICATIONS APPROVED, NOT ACCEPTED
8
$285,769
14
$292,566
3
$45,623
1
$334,130
0
$0
APPLICATIONS DENIED
29
$226,503
49
$314,762
9
$146,913
2
$210,230
1
$505,000
APPLICATIONS WITHDRAWN
18
$280,854
37
$297,455
3
$102,283
1
$427,170
0
$0
FILES CLOSED FOR INCOMPLETENESS
2
$157,675
4
$343,528
0
$0
0
$0
0
$0
Aggregated Statistics For Year 2005 (Based on 1 partial tract)
B) Conventional Home Purchase Loans
C) Refinancings
D) Home Improvement Loans
F) Non-occupant Loans on < 5 Family Dwellings (A B C & D)
G) Loans On Manufactured Home Dwelling (A B C & D)
Number
Average Value
Number
Average Value
Number
Average Value
Number
Average Value
Number
Average Value
LOANS ORIGINATED
92
$312,633
110
$274,801
15
$192,279
18
$266,218
0
$0
APPLICATIONS APPROVED, NOT ACCEPTED
9
$304,064
13
$287,786
3
$117,790
1
$374,840
0
$0
APPLICATIONS DENIED
12
$317,397
29
$285,701
12
$224,134
6
$264,057
1
$63,960
APPLICATIONS WITHDRAWN
8
$376,068
38
$298,738
5
$240,648
4
$317,695
0
$0
FILES CLOSED FOR INCOMPLETENESS
2
$412,185
16
$261,922
1
$39,360
0
$0
0
$0
Aggregated Statistics For Year 2004 (Based on 1 partial tract)
A) FHA, FSA/RHS & VA Home Purchase Loans
B) Conventional Home Purchase Loans
C) Refinancings
D) Home Improvement Loans
F) Non-occupant Loans on < 5 Family Dwellings (A B C & D)
G) Loans On Manufactured Home Dwelling (A B C & D)
Number
Average Value
Number
Average Value
Number
Average Value
Number
Average Value
Number
Average Value
Number
Average Value
LOANS ORIGINATED
1
$326,530
84
$273,050
111
$233,184
34
$91,249
18
$232,944
0
$0
APPLICATIONS APPROVED, NOT ACCEPTED
0
$0
9
$286,471
13
$234,178
1
$118,090
1
$181,160
0
$0
APPLICATIONS DENIED
0
$0
11
$222,186
28
$244,098
4
$146,825
2
$284,260
1
$105,120
APPLICATIONS WITHDRAWN
0
$0
9
$255,160
39
$249,857
4
$141,570
4
$201,732
0
$0
FILES CLOSED FOR INCOMPLETENESS
0
$0
1
$442,830
7
$234,001
0
$0
1
$169,080
0
$0
Aggregated Statistics For Year 2003 (Based on 1 partial tract)
A) FHA, FSA/RHS & VA Home Purchase Loans
B) Conventional Home Purchase Loans
C) Refinancings
D) Home Improvement Loans
F) Non-occupant Loans on < 5 Family Dwellings (A B C & D)
Number
Average Value
Number
Average Value
Number
Average Value
Number
Average Value
Number
Average Value
LOANS ORIGINATED
4
$248,700
56
$223,019
297
$171,320
4
$52,782
25
$195,631
APPLICATIONS APPROVED, NOT ACCEPTED
0
$0
5
$216,582
30
$187,389
1
$138,220
3
$138,663
APPLICATIONS DENIED
0
$0
6
$197,930
34
$172,724
8
$47,581
3
$217,090
APPLICATIONS WITHDRAWN
0
$0
4
$231,812
57
$194,905
4
$66,312
5
$165,322
FILES CLOSED FOR INCOMPLETENESS
0
$0
1
$219,180
6
$188,910
1
$84,090
1
$81,410
Aggregated Statistics For Year 2002 (Based on 1 partial tract)
A) FHA, FSA/RHS & VA Home Purchase Loans
B) Conventional Home Purchase Loans
C) Refinancings
D) Home Improvement Loans
F) Non-occupant Loans on < 5 Family Dwellings (A B C & D)
Number
Average Value
Number
Average Value
Number
Average Value
Number
Average Value
Number
Average Value
LOANS ORIGINATED
7
$185,693
41
$202,801
127
$165,681
7
$49,331
11
$154,888
APPLICATIONS APPROVED, NOT ACCEPTED
0
$0
3
$199,943
9
$172,459
2
$23,930
1
$186,080
APPLICATIONS DENIED
0
$0
3
$166,993
19
$172,611
2
$23,035
2
$114,285
APPLICATIONS WITHDRAWN
1
$237,960
2
$244,225
18
$187,344
1
$72,020
3
$159,240
FILES CLOSED FOR INCOMPLETENESS
0
$0
0
$0
5
$174,536
0
$0
0
$0
Aggregated Statistics For Year 2001 (Based on 1 partial tract)
A) FHA, FSA/RHS & VA Home Purchase Loans
B) Conventional Home Purchase Loans
C) Refinancings
D) Home Improvement Loans
E) Loans on Dwellings For 5+ Families
F) Non-occupant Loans on < 5 Family Dwellings (A B C & D)
Number
Average Value
Number
Average Value
Number
Average Value
Number
Average Value
Number
Average Value
Number
Average Value
LOANS ORIGINATED
8
$164,159
36
$172,409
104
$151,372
4
$47,302
1
$2,467,750
12
$144,180
APPLICATIONS APPROVED, NOT ACCEPTED
0
$0
2
$258,540
7
$161,923
2
$78,500
0
$0
0
$0
APPLICATIONS DENIED
0
$0
2
$150,070
23
$144,303
5
$16,908
0
$0
2
$114,955
APPLICATIONS WITHDRAWN
1
$163,710
3
$193,083
13
$141,863
1
$42,490
0
$0
1
$165,500
FILES CLOSED FOR INCOMPLETENESS
0
$0
0
$0
4
$153,088
0
$0
0
$0
0
$0
Aggregated Statistics For Year 2000 (Based on 1 partial tract)
A) FHA, FSA/RHS & VA Home Purchase Loans
B) Conventional Home Purchase Loans
C) Refinancings
D) Home Improvement Loans
F) Non-occupant Loans on < 5 Family Dwellings (A B C & D)
Number
Average Value
Number
Average Value
Number
Average Value
Number
Average Value
Number
Average Value
LOANS ORIGINATED
9
$156,307
29
$143,984
21
$102,325
4
$29,188
4
$134,078
APPLICATIONS APPROVED, NOT ACCEPTED
0
$0
4
$118,758
2
$110,260
1
$46,970
1
$130,610
APPLICATIONS DENIED
0
$0
4
$174,782
10
$111,378
3
$56,957
1
$123,010
APPLICATIONS WITHDRAWN
1
$171,760
3
$172,957
9
$104,519
0
$0
0
$0
FILES CLOSED FOR INCOMPLETENESS
0
$0
0
$0
2
$178,695
0
$0
0
$0
Aggregated Statistics For Year 1999 (Based on 2 partial tracts)
A) FHA, FSA/RHS & VA Home Purchase Loans
B) Conventional Home Purchase Loans
C) Refinancings
D) Home Improvement Loans
F) Non-occupant Loans on < 5 Family Dwellings (A B C & D)
#5 on the list of "Top 101 cities with largest percentage of males in occupations: fire fighting and prevention workers including supervisors (population 5,000+)"
#10 on the list of "Top 101 cities with largest percentage of females in occupations: fire fighting and prevention workers including supervisors (population 5,000+)"
#43 on the list of "Top 101 cities with the most people taking a bicycle to work (population 5,000+)"
#69 on the list of "Top 101 cities with largest percentage of females in industries: administrative and support and waste management services (population 5,000+)"
#98 on the list of "Top 101 cities with the most people taking a motorcycle to work (population 5,000+)"
#17 on the list of "Top 101 counties with the lowest Sulfur Oxides Annual air pollution readings in 2012 (µg/m3)"
#32 on the list of "Top 101 counties with the highest Nitrogen Dioxide air pollution readings in 2012 (ppm)"
#38 on the list of "Top 101 counties with the lowest number of infant deaths per 1000 residents 2007-2013 (pop. 50,000+)"
#78 on the list of "Top 101 counties with the highest carbon monoxide air pollution readings in 2012 (ppm)"
#81 on the list of "Top 101 counties with the largest decrease in the number of infant deaths per 1000 residents 2000-2006 to 2007-2013 (pop. 50,000+)"


 Recent articles from our blog. Our writers, many of them Ph.D. graduates or candidates, create easy-to-read articles on a wide variety of topics.

 , pop. 58,301).