Races in Clayton, Ohio (OH) Detailed Stats
Ancestries, Foreign-born residents, place of birth
Settings
X


Recent posts about races in Clayton, Ohio on our local forum with over 2,400,000 registered users:
 | Englewood, Clayton, Trotwood, Dayton, and Race (12 replies) |
| Thoughts on Clayton area (11 replies) |
| Best Dayton Ohio area to live for a retiree (24 replies) |
| Moving to Dayton -where to buy a house??? (20 replies) |
| Hey Dayton, We Made National News! (99 replies) |
| So about this snow stuff--plowing and commuting details? (29 replies) |
Latest news about races in Clayton, OH collected exclusively by city-data.com from local newspapers, TV, and radio stations
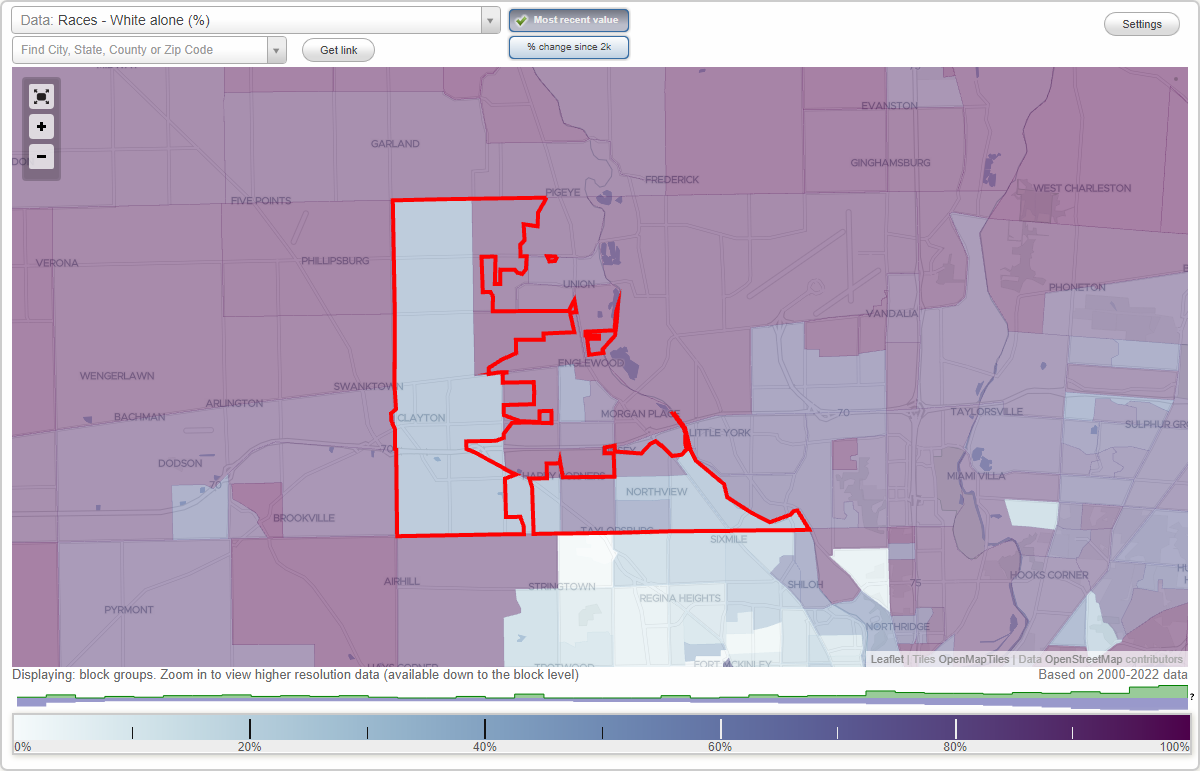
According to 2022 data, the most numerous races in Clayton, OH are White alone (8,066 residents), Black alone (3,817 residents), and Two or more races (774 residents). 95.2% of Clayton residents speak English at home. 3.7% of Clayton, OH residents are foreign-born (1.9% born in Asia, 0.8% born in Latin America, 0.5% born in Africa), which is 7.8% less than the foreign-born rate of 4.0% across the entire state of Ohio.
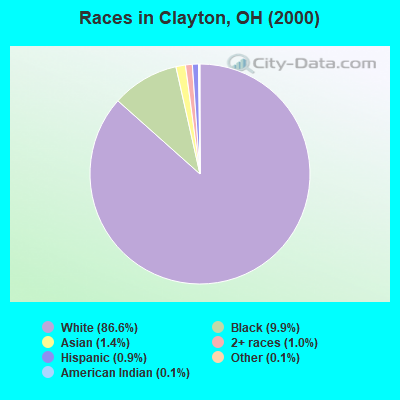
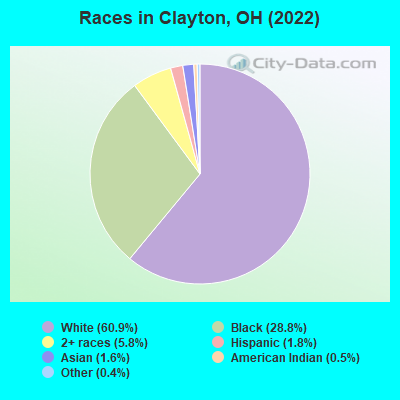
Race distribution in Clayton
2000
2022

- 11,55386.6%White alone
- 1,3159.9%Black alone
- 1881.4%Asian alone
- 1301.0%Two or more races
- 1200.9%Hispanic
- 180.1%Other race alone
- 170.1%American Indian alone
- 60.04%Native Hawaiian and Other
Pacific Islander alone
-
- 8,06660.9%White alone
- 3,81728.8%Black alone
- 7745.8%Two or more races
- 2361.8%Hispanic
- 2171.6%Asian alone
- 620.5%American Indian alone
- 550.4%Other race alone
2000
2022
-
- 9,538,11184.0%White alone
- 1,290,66211.4%Black alone
- 217,1231.9%Hispanic
- 137,7701.2%Two or more races
- 131,6701.2%Asian alone
- 21,9850.2%American Indian alone
- 13,4830.1%Other race alone
- 2,3360.02%Native Hawaiian and Other
Pacific Islander alone

-
- 8,948,79376.1%White alone
- 1,401,40311.9%Black alone
- 529,2914.5%Two or more races
- 517,2324.4%Hispanic
- 293,3872.5%Asian alone
- 52,8050.4%Other race alone
- 9,7850.08%American Indian alone
- 3,3620.03%Native Hawaiian and Other
Pacific Islander alone

Income and house value in Clayton
- Median household income in 2022
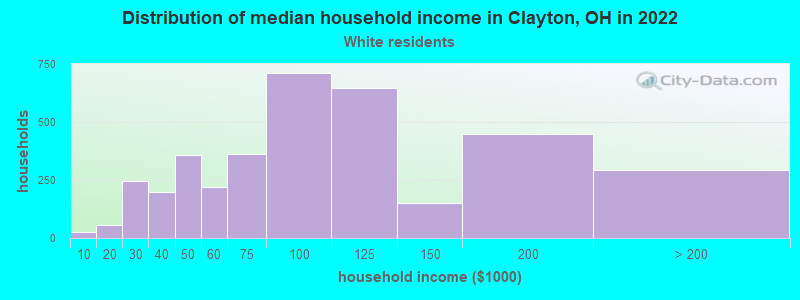
- $92,082White non-Hispanic householders
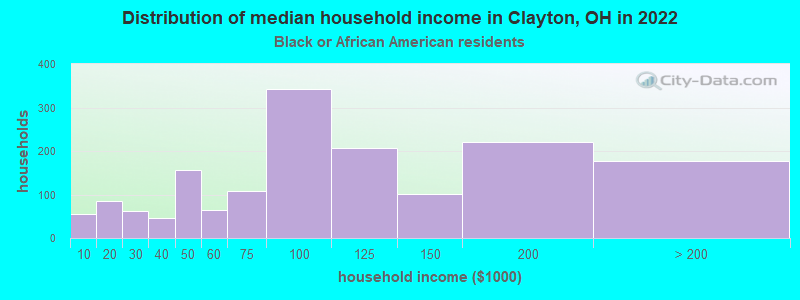
- $96,462Black householders
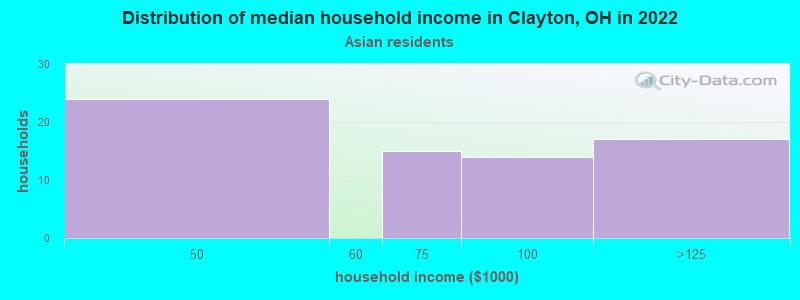
- $47,838Asian householders
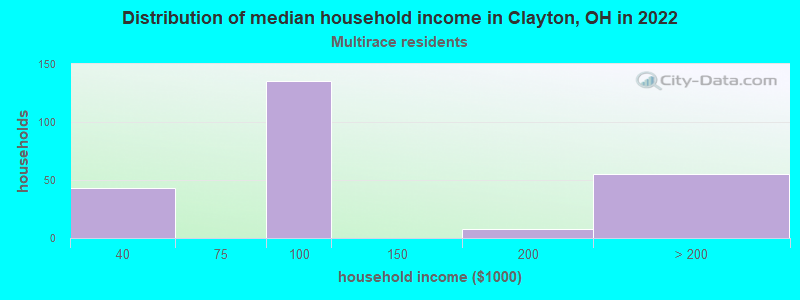
- $78,558Two or more races householders
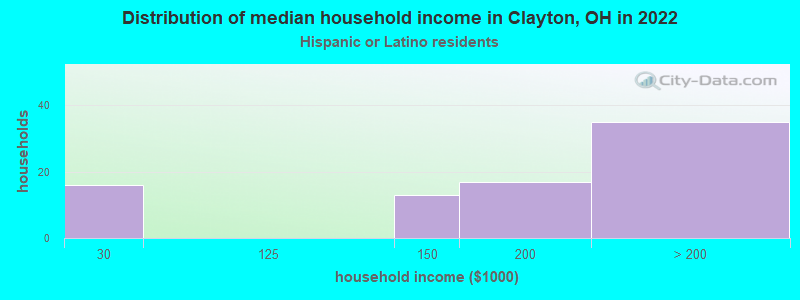
- over $200,000Hispanic or Latino race householders
- Median 2022 house value
- $207,353White Non-Hispanic householders
- $235,206Black or African American householders
- $234,229Asian householders
- $223,967Some other race householders
- $241,396Two or more races householders
- $142,524Hispanic or Latino householders
Household income for White non-Hispanic householders
Household income for Black householders
Household income for Asian householders
Household income for Two or more races householders
Household income for Hispanic or Latino race householders
Median age by race in Clayton
- 53.8Median age for White residents
- 53.3Males
- 54.4Females
- 31.5Median age for Black or African American residents
- 30.7Males
- 33.5Females
- 98.0Median age for American Indian / Alaska Native residents
- -685,185,184.5Males
- -1,438,172,041.6Females
- 46.4Median age for Asian residents
- 53.2Males
- 44.4Females
- -800,387,596.1Median age for Native Hawaiian / Pacific Islander residents
- -750,242,953.6Males
- -805,394,989.6Females
- -804,123,710.5Median age for Other race residents
- -856,799,036.4Males
- -622,779,518.7Females
- 26.1Median age for Two or more races residents
- 16.0Males
- 26.1Females
- 54.4Median age for White alone residents
- 54.3Males
- 54.8Females
- 32.9Median age for Hispanic or Latino residents
- 33.3Males
- 17.7Females
Owner/renter occupied households by race in Clayton
- House owners and renters - White residents
- 3,49792.8%Owner occupied
- 2727.2%Renter occupied
- House owners and renters - Black or African American residents
- 95960.6%Owner occupied
- 62439.4%Renter occupied
- House owners and renters - Asian residents
- 3238.8%Owner occupied
- 5061.2%Renter occupied
- House owners and renters - Two or more races residents
- 11859.2%Owner occupied
- 8240.8%Renter occupied
- House owners and renters - White alone residents
- 3,46593.3%Owner occupied
- 2486.7%Renter occupied
- House owners and renters - Hispanic or Latino residents
- 5667.1%Owner occupied
- 2832.9%Renter occupied
Language usage in Clayton
- English speakers - Total
- 95.2% of residents of Clayton speak English at home.
- 1.8% of residents speak Spanish at home
- 17980.3%Speak English very well
- 4419.7%Speak English less than very well
- 2.7% of residents speak other language at home
- 20060.2%Speak English very well
- 13239.8%Speak English less than very well
- English speakers - Born in the United States
- 97.5% of residents of Clayton speak English at home.
- 1.0% of residents speak Spanish at home
- 27100.0%Speak English very well
- 1.0% of residents speak other language at home
- 2492.3%Speak English very well
- 27.7%Speak English less than very well
All residents speak only English at home
- English speakers - Foreign-born
- 33.8% of residents of Clayton speak English at home.
- 7.5% of residents speak Spanish at home
- 1542.9%Speak English very well
- 2057.1%Speak English less than very well
- 57.8% of residents speak other language at home
- 14052.0%Speak English very well
- 12948.0%Speak English less than very well
White (Caucasian) - Speak only English
| Native: | 97.6% (7,577) |
| Foreign-born: | 26.7% (32) |
White (Caucasian) - Speak another language
| Native: | 2.5% (196) |
| Foreign-born: | 73.4% (88) |
Black or African American - Speak only English
| Native: | 99.3% (3,258) |
| Foreign-born: | 100.0% (83) |
Black or African American - Speak another language
| Native: | 0.7% (24) |
| Foreign-born: | 14.4% (12) |
American Indian / Alaska Native - Speak only English
| Native: | 89.9% (46) |
| Foreign-born: | 100.0% (23) |
White alone - Speak only English
| Native: | 98.0% (7,533) |
| Foreign-born: | 36.0% (32) |
White alone - Speak another language
| Native: | 2.1% (164) |
| Foreign-born: | 63.6% (56) |
Hispanic or Latino - Speak another language
| Native: | 29.5% (59) |
| Foreign-born: | 97.0% (40) |
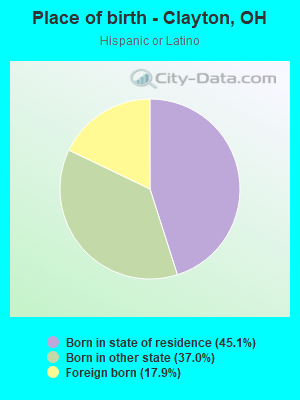
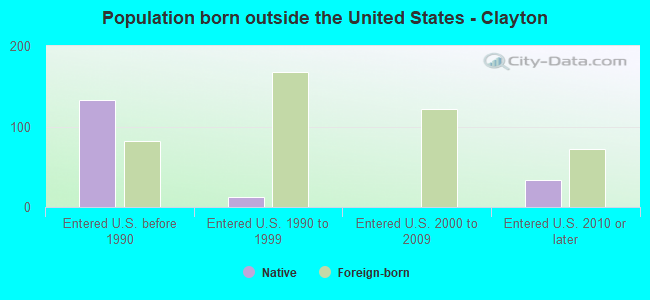
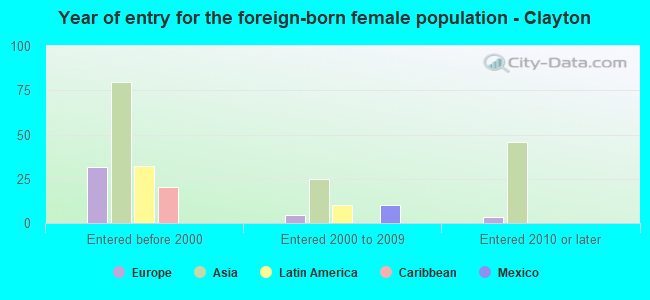
Foreign-born residents in Clayton
491 residents are foreign born (1.9% Asia, 0.8% Latin America, 0.5% Africa).
| This city: | 3.7% |
| Ohio: | 4.9% |
Marital status for residents in Clayton
Marital status - White (Caucasian) population 15 years and over
- Males
- 21.7%Never married
- 59.0%Now married
- 2.3%Separated
- 4.1%Widowed
- 12.8%Divorced
- Females
- 18.0%Never married
- 59.4%Now married
- 3.1%Separated
- 8.2%Widowed
- 11.3%Divorced
Women who gave birth in the past 12 months
| Now married: | 100.0% (20) |
| Unmarried: | 0.0% (0) |
Women who did not give birth in the past 12 months
| Now married: | 47.6% (625) |
| Unmarried: | 52.4% (688) |
Marital status - Black or African American population 15 years and over
- Males
- 40.3%Never married
- 53.5%Now married
- 3.4%Separated
- 0.0%Widowed
- 2.9%Divorced
- Females
- 32.5%Never married
- 46.4%Now married
- 1.6%Separated
- 6.7%Widowed
- 12.8%Divorced
Women who gave birth in the past 12 months
| Now married: | 0.0% (0) |
| Unmarried: | 100.0% (24) |
Women who did not give birth in the past 12 months
| Now married: | 34.7% (273) |
| Unmarried: | 65.3% (513) |
Marital status - American Indian / Alaska Native population 15 years and over
- Males
- 0.0%Never married
- 100.0%Now married
- 0.0%Separated
- 0.0%Widowed
- 0.0%Divorced
- Females
- 0.0%Never married
- 100.0%Now married
- 0.0%Separated
- 0.0%Widowed
- 0.0%Divorced
Women who did not give birth in the past 12 months
| Now married: | 100.0% (35) |
| Unmarried: | 0.0% (0) |
Marital status - Asian population 15 years and over
- Males
- 9.3%Never married
- 59.8%Now married
- 0.0%Separated
- 16.5%Widowed
- 14.4%Divorced
- Females
- 20.2%Never married
- 79.8%Now married
- 0.0%Separated
- 0.0%Widowed
- 0.0%Divorced
Women who did not give birth in the past 12 months
| Now married: | 67.7% (44) |
| Unmarried: | 32.3% (21) |
Marital status - Other race population 15 years and over
- Males
- 100.0%Never married
- 0.0%Now married
- 0.0%Separated
- 0.0%Widowed
- 0.0%Divorced
- Females
- 0.0%Never married
- 0.0%Now married
- 0.0%Separated
- 0.0%Widowed
- 100.0%Divorced
Women who did not give birth in the past 12 months
| Now married: | 0.0% (0) |
| Unmarried: | 100.0% (35) |
Marital status - Two or more races population 15 years and over
- Males
- 7.0%Never married
- 41.4%Now married
- 0.0%Separated
- 0.0%Widowed
- 51.6%Divorced
- Females
- 42.6%Never married
- 36.7%Now married
- 0.0%Separated
- 0.0%Widowed
- 20.8%Divorced
Women who did not give birth in the past 12 months
| Now married: | 26.8% (72) |
| Unmarried: | 73.2% (197) |
Marital status - White alone, not Hispanic / Latino population 15 years and over
- Males
- 20.8%Never married
- 60.4%Now married
- 2.4%Separated
- 4.2%Widowed
- 12.3%Divorced
- Females
- 18.1%Never married
- 59.5%Now married
- 3.2%Separated
- 8.3%Widowed
- 10.9%Divorced
Women who gave birth in the past 12 months
| Now married: | 100.0% (20) |
| Unmarried: | 0.0% (0) |
Women who did not give birth in the past 12 months
| Now married: | 48.2% (632) |
| Unmarried: | 51.8% (679) |
Marital status - Hispanic or Latino population 15 years and over
- Males
- 58.5%Never married
- 14.2%Now married
- 0.0%Separated
- 0.0%Widowed
- 27.4%Divorced
- Females
- 33.8%Never married
- 40.0%Now married
- 0.0%Separated
- 0.0%Widowed
- 26.2%Divorced
Women who did not give birth in the past 12 months
| Now married: | 0.0% (0) |
| Unmarried: | 100.0% (42) |
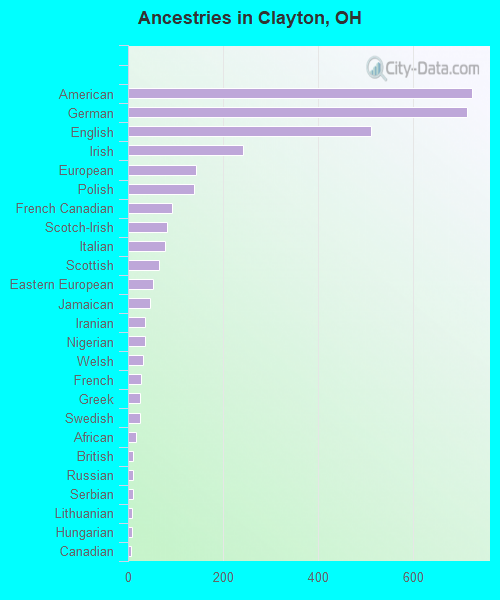
Ancestries in Clayton

- 72310.7%American
- 71310.5%German
- 5117.6%English
- 2413.6%Irish
- 1442.1%European
- 1382.0%Polish
- 921.4%French Canadian
- 811.2%Scotch-Irish
- 781.2%Italian
- 651.0%Scottish
- 530.8%Eastern European
- 470.7%Jamaican
- 360.5%Iranian
- 360.5%Nigerian
- 310.5%Welsh
- 280.4%French
- 260.4%Greek
- 250.4%Swedish
- 160.2%African
- 110.2%British
- 110.2%Russian
- 110.2%Serbian
- 90.1%Lithuanian
- 80.1%Hungarian
- 70.1%Canadian
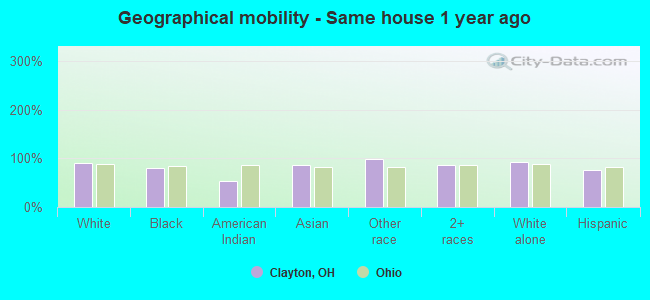
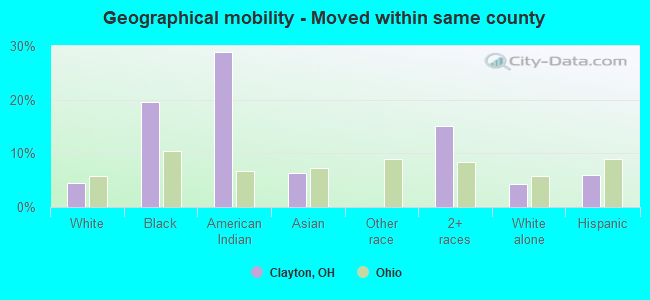
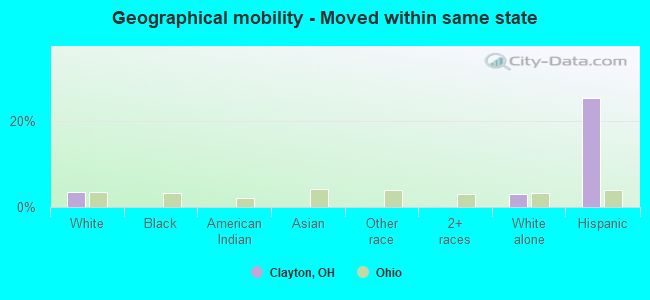
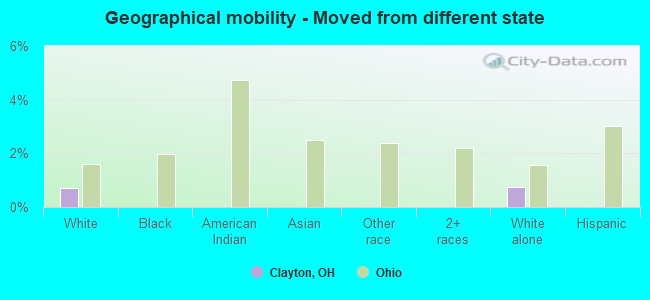
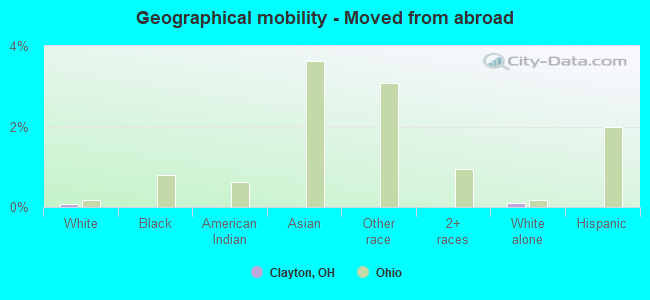
Geographical mobility in Clayton

- Same house 1 year ago
- 7,45291.2%White (Caucasian)
- 3,06680.2%Black or African American
- 3853.2%American Indian / Alaska Native
- 18887.1%Asian
- 5098.6%Other race
- 77385.4%Two or more races
- 7,41391.9%White alone, not Hispanic / Latino
- 17875.1%Hispanic or Latino
-
- Moved within same county
- 3594.4%White / Caucasian
- 74819.6%Black or African American
- 2128.8%American Indian / Alaska Native
- 146.4%Asian
- 13715.2%Two or more races
- 3464.3%White alone, not Hispanic / Latino
- 146.0%Hispanic or Latino
-
- Moved within same state
- 2883.5%White / Caucasian
- 2403.0%White alone, not Hispanic / Latino
- 6025.4%Hispanic or Latino
-
- Moved from different state
- 590.7%White / Caucasian
- 590.7%White alone, not Hispanic / Latino
-
- Moved from abroad
- 70.1%White
- 70.1%White alone, not Hispanic / Latino
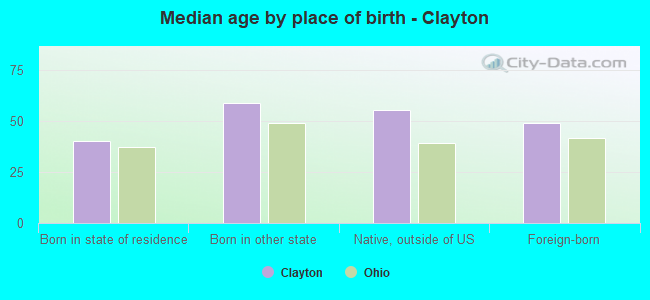
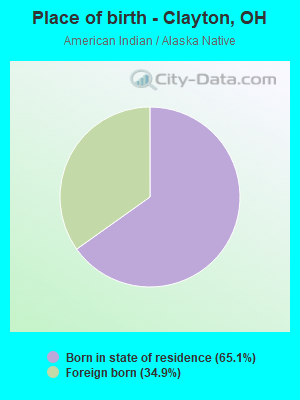
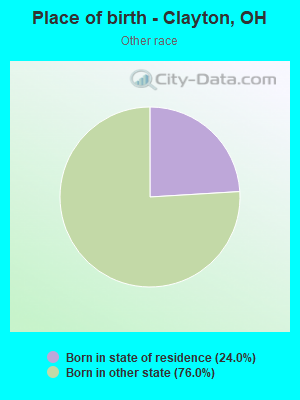
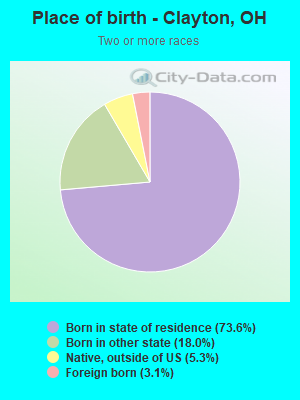
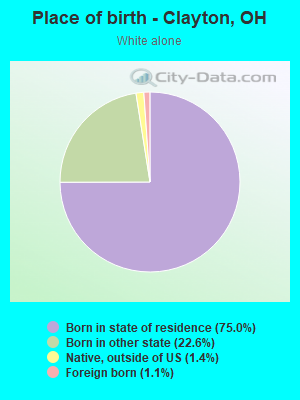
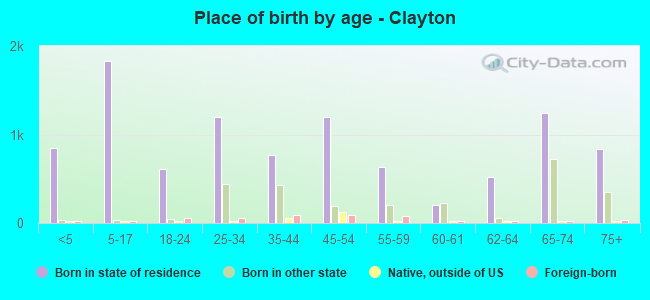
Children Nativity (place of birth) in Clayton
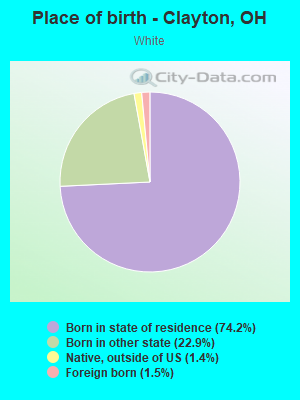
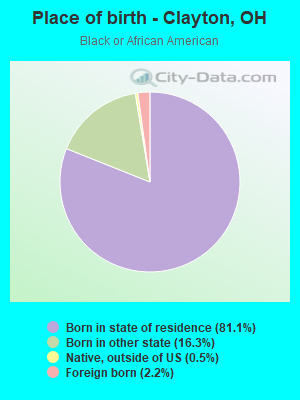
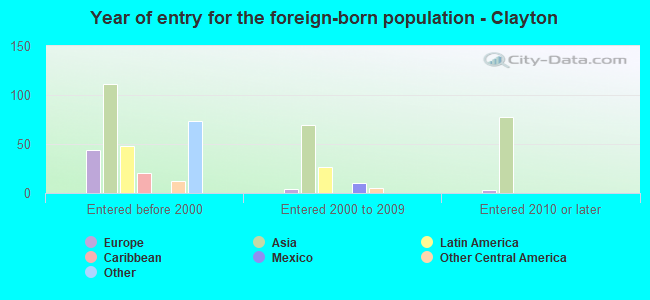
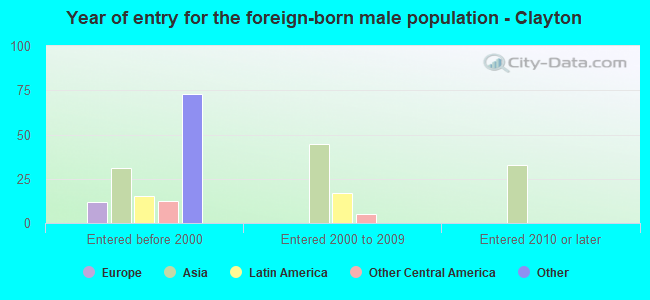
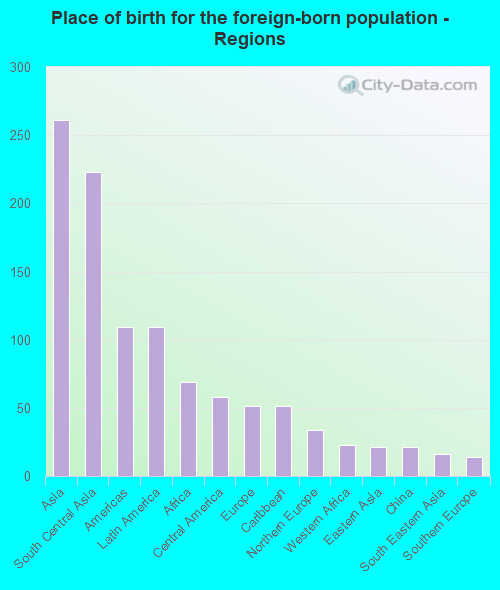
Place of birth for residents in Clayton
![Place of birth for the foreign-born population - Regions]()
- 261Asia
- 223South Central Asia
- 109Americas
- 109Latin America
- 69Africa
- 58Central America
- 51Europe
- 51Caribbean
- 34Northern Europe
- 23Western Africa
- 21Eastern Asia
- 21China
- 16South Eastern Asia
- 14Southern Europe
- 2Eastern Europe
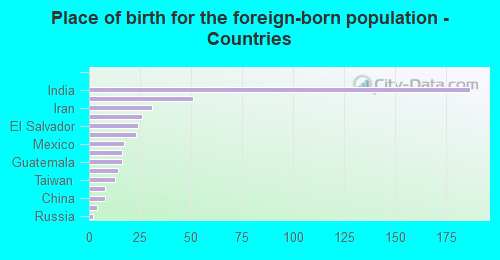
![Place of birth for the foreign-born population - Countries]()
- 187India
- 51Bahamas
- 31Iran
- 26United Kingdom
- 24El Salvador
- 23Nigeria
- 17Mexico
- 16Philippines
- 16Guatemala
- 14Greece
- 13Taiwan
- 8England
- 8China
- 4Uzbekistan
- 2Russia