Races in Des Moines, Iowa (IA) Detailed Stats
Data:
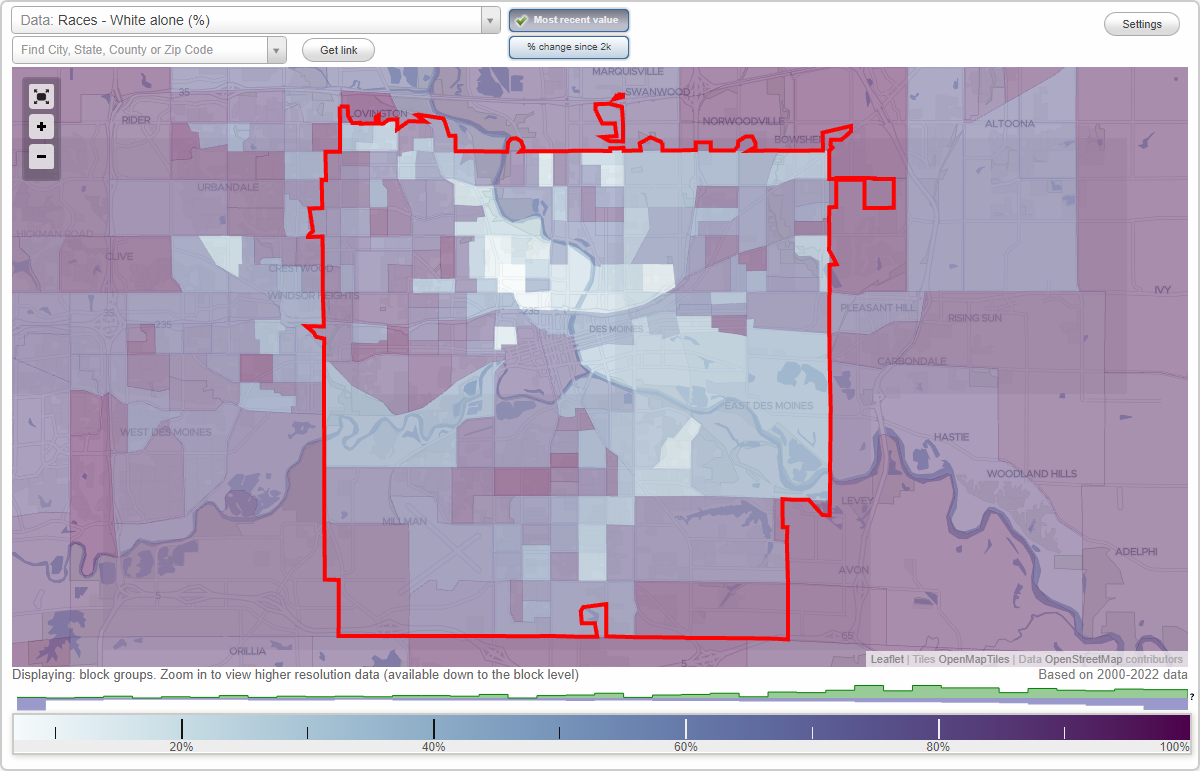
Races - White alone (%)
Races - White alone (% change since 2000)
Races - Black alone (%)
Races - Black alone (% change since 2000)
Races - American Indian alone (%)
Races - American Indian alone (% change since 2000)
Races - Asian alone (%)
Races - Asian alone (% change since 2000)
Races - Hispanic (%)
Races - Hispanic (% change since 2000)
Races - Native Hawaiian and Other Pacific Islander alone (%)
Races - Native Hawaiian and Other Pacific Islander alone (% change since 2000)
Races - Two or more races(%)
Races - Two or more races(% change since 2000)
Races - Other race alone (%)
Races - Other race alone (% change since 2000)
Racial diversity
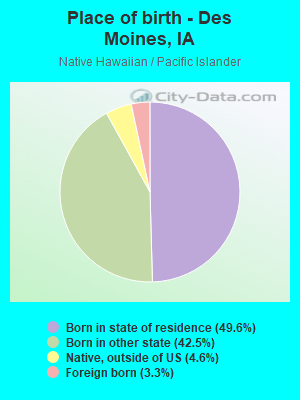
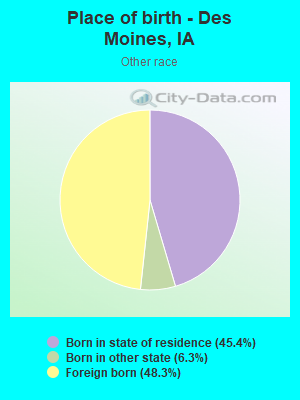
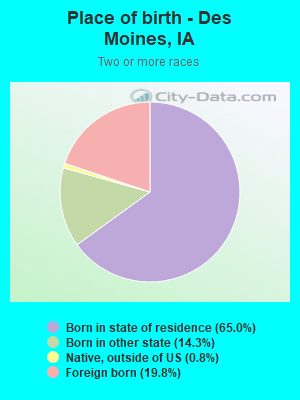
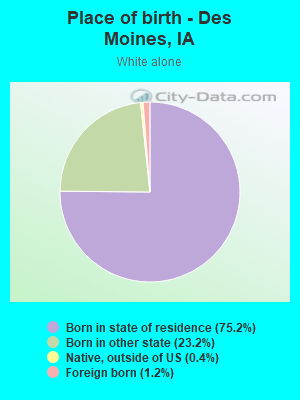
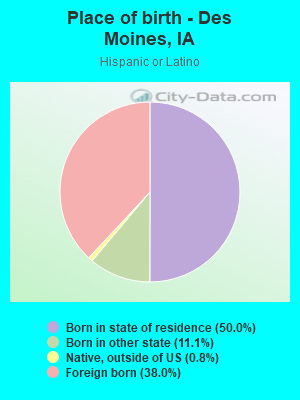
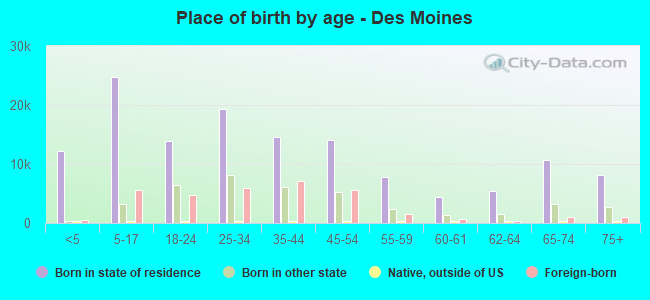
Place of birth - Born in state of residence (%)
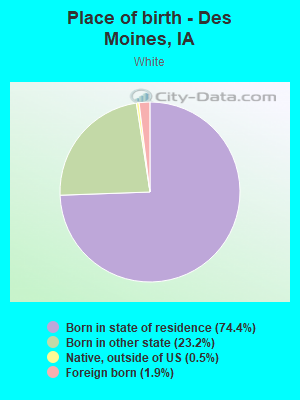
Place of birth - Born in state of residence (%) - White
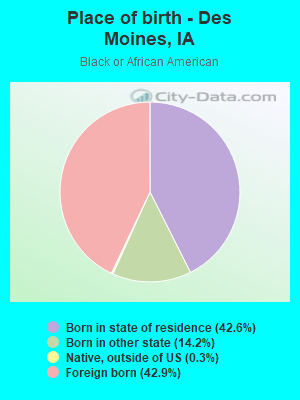
Place of birth - Born in state of residence (%) - Black or African American
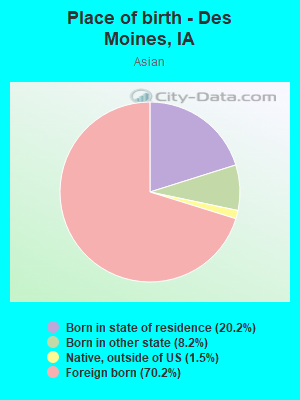
Place of birth - Born in state of residence (%) - Asian
Place of birth - Born in state of residence (%) - Hispanic or Latino
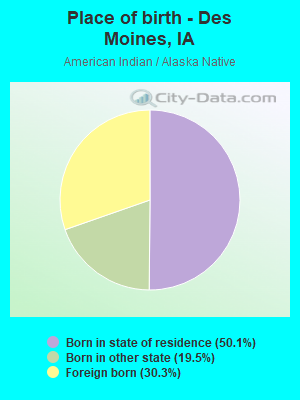
Place of birth - Born in state of residence (%) - American Indian and Alaska Native
Place of birth - Born in state of residence (%) - Multirace
Place of birth - Born in state of residence (%) - Other Race
Place of birth - Born in other state (%)
Place of birth - Born in other state (%) - White
Place of birth - Born in other state (%) - Black or African American
Place of birth - Born in other state (%) - Asian
Place of birth - Born in other state (%) - Hispanic or Latino
Place of birth - Born in other state (%) - American Indian and Alaska Native
Place of birth - Born in other state (%) - Multirace
Place of birth - Born in other state (%) - Other Race
Place of birth - Native, outside of US (%)
Place of birth - Native, outside of US (%) - White
Place of birth - Native, outside of US (%) - Black or African American
Place of birth - Native, outside of US (%) - Asian
Place of birth - Native, outside of US (%) - Hispanic or Latino
Place of birth - Native, outside of US (%) - American Indian and Alaska Native
Place of birth - Native, outside of US (%) - Multirace
Place of birth - Native, outside of US (%) - Other Race
Place of birth - Foreign born (%)
Place of birth - Foreign born (%) - White
Place of birth - Foreign born (%) - Black or African American
Place of birth - Foreign born (%) - Asian
Place of birth - Foreign born (%) - Hispanic or Latino
Place of birth - Foreign born (%) - American Indian and Alaska Native
Place of birth - Foreign born (%) - Multirace
Place of birth - Foreign born (%) - Other Race
Residents speaking English at home (%)
Residents speaking English at home - Born in the United States (%)
Residents speaking English at home - Native, born elsewhere (%)
Residents speaking English at home - Foreign born (%)
Residents speaking Spanish at home (%)
Residents speaking Spanish at home - Born in the United States (%)
Residents speaking Spanish at home - Native, born elsewhere (%)
Residents speaking Spanish at home - Foreign born (%)
Residents speaking other language at home (%)
Residents speaking other language at home - Born in the United States (%)
Residents speaking other language at home - Native, born elsewhere (%)
Residents speaking other language at home - Foreign born (%)
Marital status - Never married (%)
Marital status - Now married (%)
Marital status - Separated (%)
Marital status - Widowed (%)
Marital status - Divorced (%)
Ancestries Reported - Arab (%)
Ancestries Reported - Czech (%)
Ancestries Reported - Danish (%)
Ancestries Reported - Dutch (%)
Ancestries Reported - English (%)
Ancestries Reported - French (%)
Ancestries Reported - French Canadian (%)
Ancestries Reported - German (%)
Ancestries Reported - Greek (%)
Ancestries Reported - Hungarian (%)
Ancestries Reported - Irish (%)
Ancestries Reported - Italian (%)
Ancestries Reported - Lithuanian (%)
Ancestries Reported - Norwegian (%)
Ancestries Reported - Polish (%)
Ancestries Reported - Portuguese (%)
Ancestries Reported - Russian (%)
Ancestries Reported - Scotch-Irish (%)
Ancestries Reported - Scottish (%)
Ancestries Reported - Slovak (%)
Ancestries Reported - Subsaharan African (%)
Ancestries Reported - Swedish (%)
Ancestries Reported - Swiss (%)
Ancestries Reported - Ukrainian (%)
Ancestries Reported - United States (%)
Ancestries Reported - Welsh (%)
Ancestries Reported - West Indian (%)
Ancestries Reported - Other (%)
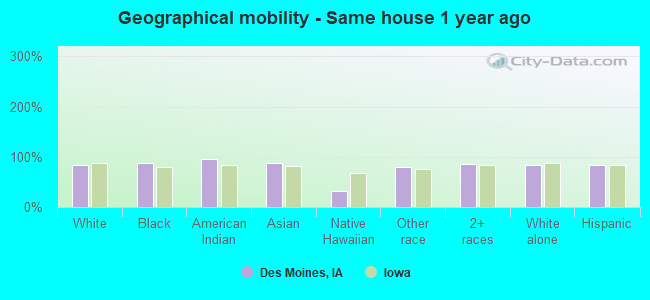
Geographical mobility - Same house 1 year ago (%)
Geographical mobility - Same house 1 year ago (%) - White
Geographical mobility - Same house 1 year ago (%) - Black or African American
Geographical mobility - Same house 1 year ago (%) - Asian
Geographical mobility - Same house 1 year ago (%) - Hispanic or Latino
Geographical mobility - Same house 1 year ago (%) - American Indian and Alaska Native
Geographical mobility - Same house 1 year ago (%) - Multirace
Geographical mobility - Same house 1 year ago (%) - Other Race
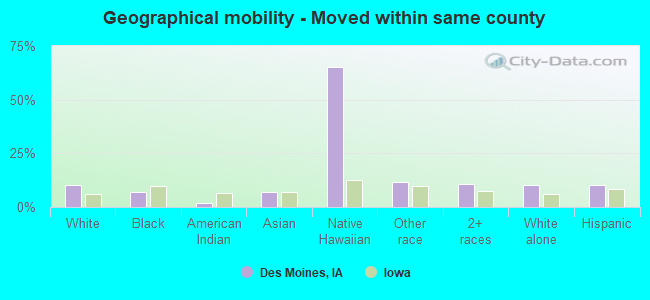
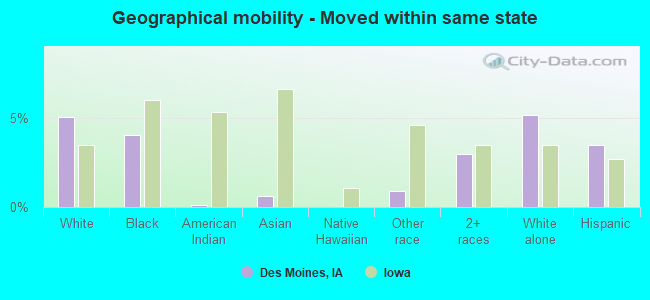
Geographical mobility - Moved within same county (%)
Geographical mobility - Moved within same county (%) - White
Geographical mobility - Moved within same county (%) - Black or African American
Geographical mobility - Moved within same county (%) - Asian
Geographical mobility - Moved within same county (%) - Hispanic or Latino
Geographical mobility - Moved within same county (%) - American Indian and Alaska Native
Geographical mobility - Moved within same county (%) - Multirace
Geographical mobility - Moved within same county (%) - Other Race
Geographical mobility - Moved from different county within same state (%)
Geographical mobility - Moved from different county within same state (%) - White
Geographical mobility - Moved from different county within same state (%) - Black or African American
Geographical mobility - Moved from different county within same state (%) - Asian
Geographical mobility - Moved from different county within same state (%) - Hispanic or Latino
Geographical mobility - Moved from different county within same state (%) - American Indian and Alaska Native
Geographical mobility - Moved from different county within same state (%) - Multirace
Geographical mobility - Moved from different county within same state (%) - Other Race
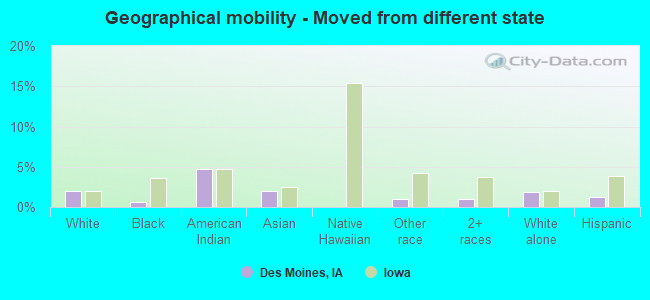
Geographical mobility - Moved from different state (%)
Geographical mobility - Moved from different state (%) - White
Geographical mobility - Moved from different state (%) - Black or African American
Geographical mobility - Moved from different state (%) - Asian
Geographical mobility - Moved from different state (%) - Hispanic or Latino
Geographical mobility - Moved from different state (%) - American Indian and Alaska Native
Geographical mobility - Moved from different state (%) - Multirace
Geographical mobility - Moved from different state (%) - Other Race
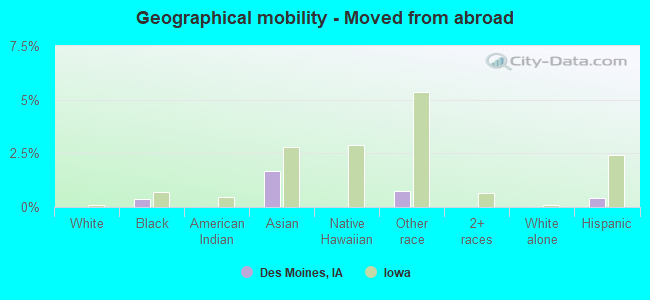
Geographical mobility - Moved from abroad (%)
Geographical mobility - Moved from abroad (%) - White
Geographical mobility - Moved from abroad (%) - Black or African American
Geographical mobility - Moved from abroad (%) - Asian
Geographical mobility - Moved from abroad (%) - Hispanic or Latino
Geographical mobility - Moved from abroad (%) - American Indian and Alaska Native
Geographical mobility - Moved from abroad (%) - Multirace
Geographical mobility - Moved from abroad (%) - Other Race
Place of birth for the foreign-born population - Ireland (%)
Place of birth for the foreign-born population - Denmark (%)
Place of birth for the foreign-born population - Norway (%)
Place of birth for the foreign-born population - Sweden (%)
Place of birth for the foreign-born population - United Kingdom (%)
Place of birth for the foreign-born population - England (%)
Place of birth for the foreign-born population - Scotland (%)
Place of birth for the foreign-born population - Other Northern Europe (%)
Place of birth for the foreign-born population - Austria (%)
Place of birth for the foreign-born population - Belgium (%)
Place of birth for the foreign-born population - France (%)
Place of birth for the foreign-born population - Germany (%)
Place of birth for the foreign-born population - Netherlands (%)
Place of birth for the foreign-born population - Switzerland (%)
Place of birth for the foreign-born population - Other Western Europe (%)
Place of birth for the foreign-born population - Greece (%)
Place of birth for the foreign-born population - Italy (%)
Place of birth for the foreign-born population - Portugal (%)
Place of birth for the foreign-born population - Spain (%)
Place of birth for the foreign-born population - Other Southern Europe (%)
Place of birth for the foreign-born population - Albania (%)
Place of birth for the foreign-born population - Belarus (%)
Place of birth for the foreign-born population - Bosnia and Herzegovina (%)
Place of birth for the foreign-born population - Bulgaria (%)
Place of birth for the foreign-born population - Croatia (%)
Place of birth for the foreign-born population - Czechoslovakia (%)
Place of birth for the foreign-born population - Hungary (%)
Place of birth for the foreign-born population - Latvia (%)
Place of birth for the foreign-born population - Lithuania (%)
Place of birth for the foreign-born population - North Macedonia (Macedonia) (%)
Place of birth for the foreign-born population - Moldova (%)
Place of birth for the foreign-born population - Poland (%)
Place of birth for the foreign-born population - Romania (%)
Place of birth for the foreign-born population - Russia (%)
Place of birth for the foreign-born population - Serbia (%)
Place of birth for the foreign-born population - Ukraine (%)
Place of birth for the foreign-born population - Other Eastern Europe (%)
Place of birth for the foreign-born population - China (%)
Place of birth for the foreign-born population - Hong Kong (%)
Place of birth for the foreign-born population - Taiwan (%)
Place of birth for the foreign-born population - Japan (%)
Place of birth for the foreign-born population - Korea (%)
Place of birth for the foreign-born population - Other Eastern Asia (%)
Place of birth for the foreign-born population - Afghanistan (%)
Place of birth for the foreign-born population - Bangladesh (%)
Place of birth for the foreign-born population - India (%)
Place of birth for the foreign-born population - Iran (%)
Place of birth for the foreign-born population - Kazakhstan (%)
Place of birth for the foreign-born population - Nepal (%)
Place of birth for the foreign-born population - Pakistan (%)
Place of birth for the foreign-born population - Sri Lanka (%)
Place of birth for the foreign-born population - Uzbekistan (%)
Place of birth for the foreign-born population - Other South Central Asia (%)
Place of birth for the foreign-born population - Burma (%)
Place of birth for the foreign-born population - Cambodia (%)
Place of birth for the foreign-born population - Indonesia (%)
Place of birth for the foreign-born population - Laos (%)
Place of birth for the foreign-born population - Malaysia (%)
Place of birth for the foreign-born population - Philippines (%)
Place of birth for the foreign-born population - Singapore (%)
Place of birth for the foreign-born population - Thailand (%)
Place of birth for the foreign-born population - Vietnam (%)
Place of birth for the foreign-born population - Other South Eastern Asia (%)
Place of birth for the foreign-born population - Armenia (%)
Place of birth for the foreign-born population - Iraq (%)
Place of birth for the foreign-born population - Israel (%)
Place of birth for the foreign-born population - Jordan (%)
Place of birth for the foreign-born population - Kuwait (%)
Place of birth for the foreign-born population - Lebanon (%)
Place of birth for the foreign-born population - Saudi Arabia (%)
Place of birth for the foreign-born population - Syria (%)
Place of birth for the foreign-born population - Turkey (%)
Place of birth for the foreign-born population - Yemen (%)
Place of birth for the foreign-born population - Other Western Asia (%)
Place of birth for the foreign-born population - Eritrea (%)
Place of birth for the foreign-born population - Ethiopia (%)
Place of birth for the foreign-born population - Kenya (%)
Place of birth for the foreign-born population - Somalia (%)
Place of birth for the foreign-born population - Uganda (%)
Place of birth for the foreign-born population - Zimbabwe (%)
Place of birth for the foreign-born population - Other Eastern Africa (%)
Place of birth for the foreign-born population - Cameroon (%)
Place of birth for the foreign-born population - Congo (%)
Place of birth for the foreign-born population - Democratic Republic of Congo (Zaire) (%)
Place of birth for the foreign-born population - Other Middle Africa (%)
Place of birth for the foreign-born population - Egypt (%)
Place of birth for the foreign-born population - Morocco (%)
Place of birth for the foreign-born population - Sudan (%)
Place of birth for the foreign-born population - Other Northern Africa (%)
Place of birth for the foreign-born population - South Africa (%)
Place of birth for the foreign-born population - Other Southern Africa (%)
Place of birth for the foreign-born population - Cabo Verde (%)
Place of birth for the foreign-born population - Ghana (%)
Place of birth for the foreign-born population - Liberia (%)
Place of birth for the foreign-born population - Nigeria (%)
Place of birth for the foreign-born population - Senegal (%)
Place of birth for the foreign-born population - Sierra Leone (%)
Place of birth for the foreign-born population - Other Western Africa (%)
Place of birth for the foreign-born population - Australia (%)
Place of birth for the foreign-born population - New Zealand (%)
Place of birth for the foreign-born population - Fiji (%)
Place of birth for the foreign-born population - Micronesia (%)
Place of birth for the foreign-born population - Bahamas (%)
Place of birth for the foreign-born population - Barbados (%)
Place of birth for the foreign-born population - Cuba (%)
Place of birth for the foreign-born population - Dominica (%)
Place of birth for the foreign-born population - Dominican Republic (%)
Place of birth for the foreign-born population - Grenada (%)
Place of birth for the foreign-born population - Haiti (%)
Place of birth for the foreign-born population - Jamaica (%)
Place of birth for the foreign-born population - St. Vincent and the Grenadines (%)
Place of birth for the foreign-born population - Trinidad and Tobago (%)
Place of birth for the foreign-born population - West Indies (%)
Place of birth for the foreign-born population - Other Caribbean (%)
Place of birth for the foreign-born population - Belize (%)
Place of birth for the foreign-born population - Costa Rica (%)
Place of birth for the foreign-born population - El Salvador (%)
Place of birth for the foreign-born population - Guatemala (%)
Place of birth for the foreign-born population - Honduras (%)
Place of birth for the foreign-born population - Mexico (%)
Place of birth for the foreign-born population - Nicaragua (%)
Place of birth for the foreign-born population - Panama (%)
Place of birth for the foreign-born population - Other Central America (%)
Place of birth for the foreign-born population - Argentina (%)
Place of birth for the foreign-born population - Bolivia (%)
Place of birth for the foreign-born population - Brazil (%)
Place of birth for the foreign-born population - Chile (%)
Place of birth for the foreign-born population - Colombia (%)
Place of birth for the foreign-born population - Ecuador (%)
Place of birth for the foreign-born population - Guyana (%)
Place of birth for the foreign-born population - Peru (%)
Place of birth for the foreign-born population - Uruguay (%)
Place of birth for the foreign-born population - Venezuela (%)
Place of birth for the foreign-born population - Other South America (%)
Place of birth for the foreign-born population - Canada (%)
Place of birth for the foreign-born population - Other Northern America (%)
Place of birth for the foreign-born population - Other (%)
According to 2022 data, the most numerous races in Des Moines, IA are White alone (130,412 residents), Hispanic (27,592 residents), and Black alone (30,629 residents). 78.3% of Des Moines residents speak English at home. 13.7% of Des Moines, IA residents are foreign-born (4.9% born in Asia, 4.9% born in Latin America, 3.1% born in Africa), which is 63.5% greater than the foreign-born rate of 5.0% across the entire state of Iowa.
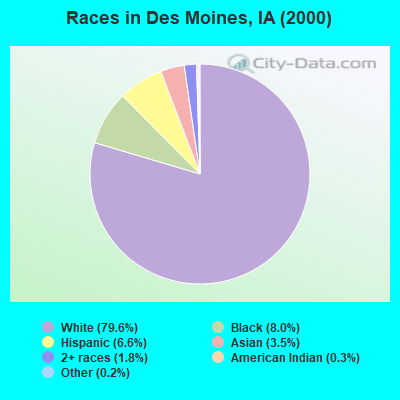
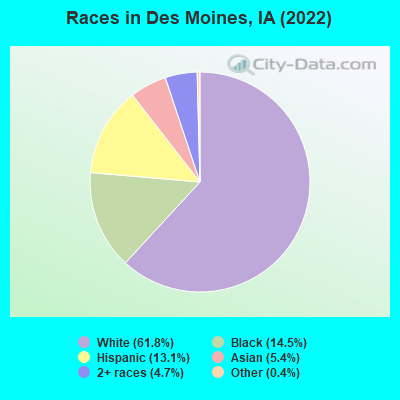
Race distribution in Des Moines
2000 2022
158,095 79.6% White alone 15,813 8.0% Black alone 13,138 6.6% Hispanic 6,885 3.5% Asian alone 3,614 1.8% Two or more races 616 0.3% American Indian alone 439 0.2% Other race alone 82 0.04% Native Hawaiian and Other
130,412 61.8% White alone 30,629 14.5% Black alone 27,592 13.1% Hispanic 11,426 5.4% Asian alone 9,914 4.7% Two or more races 924 0.4% Other race alone 39 0.02% American Indian alone
2000 2022
2,710,344 92.6% White alone 82,473 2.8% Hispanic 60,744 2.1% Black alone 36,345 1.2% Asian alone 25,472 0.9% Two or more races 7,955 0.3% American Indian alone 2,103 0.07% Other race alone 888 0.03% Native Hawaiian and Other
2,650,110 82.8% White alone 218,024 6.8% Hispanic 119,004 3.7% Black alone 115,286 3.6% Two or more races 74,892 2.3% Asian alone 9,260 0.3% Other race alone 8,595 0.3% Native Hawaiian and Other 5,346 0.2% American Indian alone
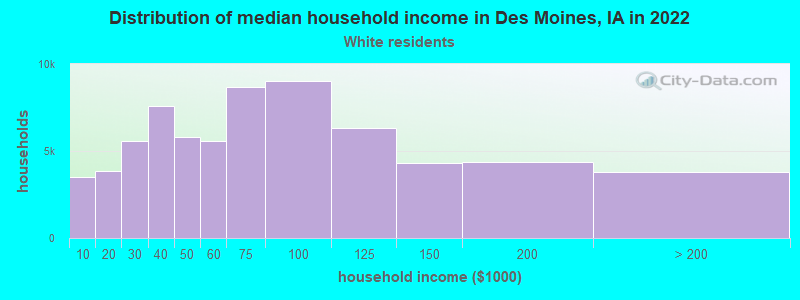
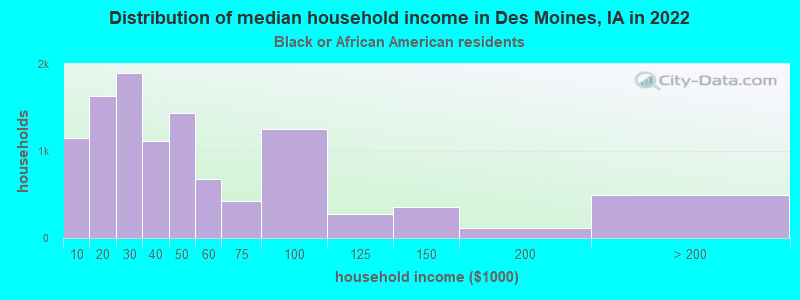
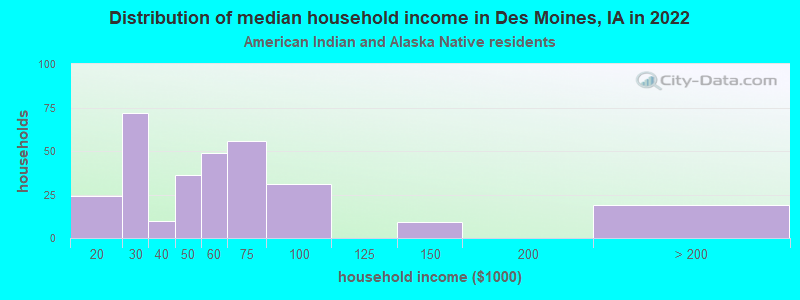
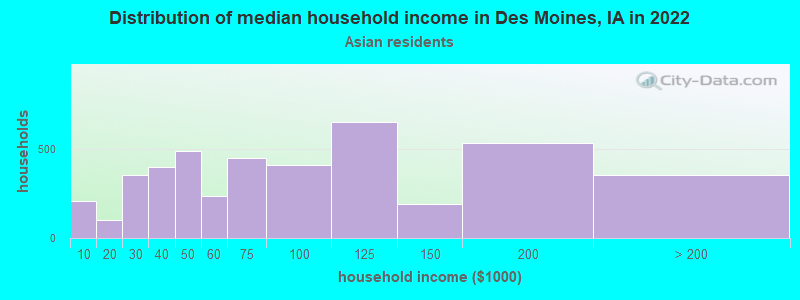
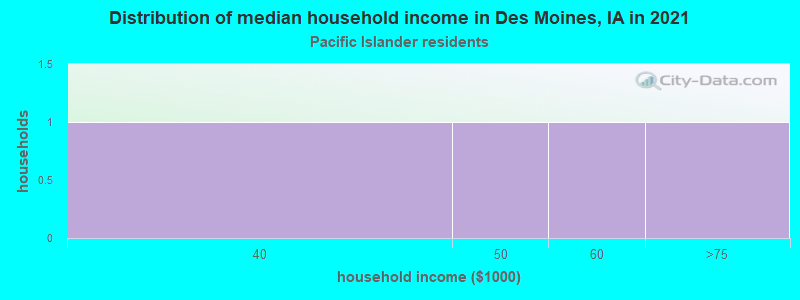
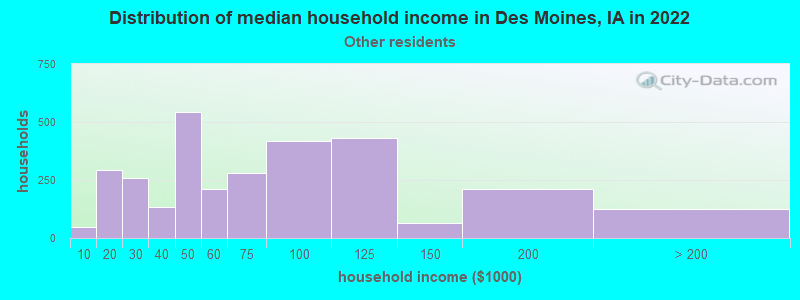
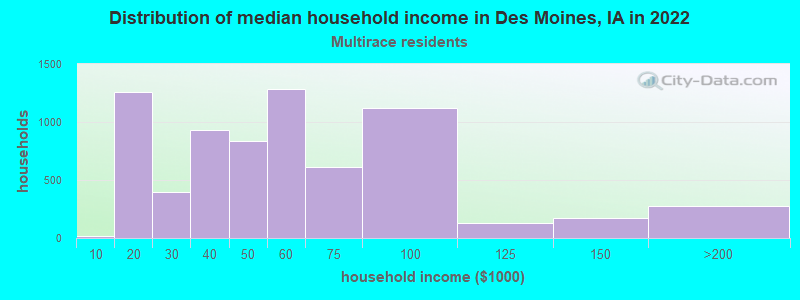
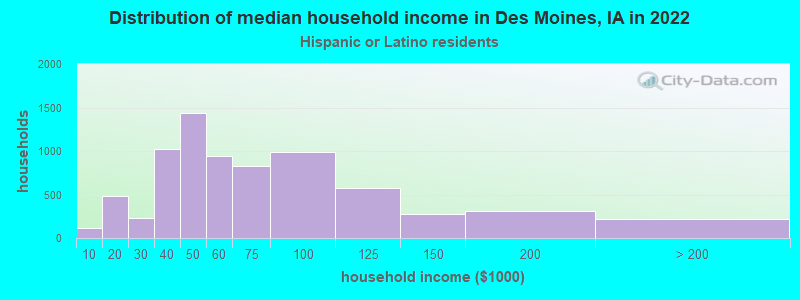
Income and house value in Des Moines Median household income in 2022 $64,384 White non-Hispanic householders$37,494 Black householders$50,567 American Indian and Alaska Native householders$49,990 Asian householders$48,908 Some other race householders$50,849 Two or more races householders$54,519 Hispanic or Latino race householdersMedian 2022 house value $184,411 White Non-Hispanic householders$144,400 Black or African American householders$197,823 American Indian or Alaska Native householders $163,176 Asian householders$484,388 Native Hawaiian and other Pacific Islander householders$157,141 Some other race householders$148,870 Two or more races householders$156,470 Hispanic or Latino householders
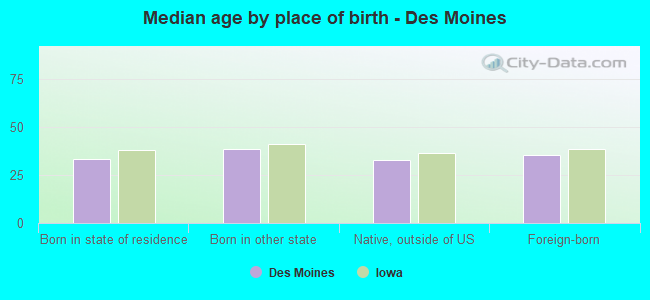
Median age by race in Des Moines
40.6 Median age for White residents40.3 40.9 25.8 Median age for Black or African American residents23.7 27.3 27.9 Median age for American Indian / Alaska Native residents27.6 29.5 35.7 Median age for Asian residents37.0 35.2 -666,666,666.0 Median age for Native Hawaiian / Pacific Islander residents-666,666,666.0 -666,666,666.0 24.7 Median age for Other race residents26.3 23.0 22.0 Median age for Two or more races residents21.0 23.7 41.2 Median age for White alone residents41.0 41.5 23.2 Median age for Hispanic or Latino residents23.8 22.7
Owner/renter occupied households by race in Des Moines
House owners and renters - White residents 43,242 63.2% Owner occupied25,150 36.8% Renter occupiedHouse owners and renters - Black or African American residents 3,823 35.3% Owner occupied7,016 64.7% Renter occupiedHouse owners and renters - American Indian / Alaska Native residents 283 74.2% Owner occupied99 25.8% Renter occupiedHouse owners and renters - Asian residents 3,027 86.7% Owner occupied463 13.3% Renter occupiedHouse owners and renters - Native Hawaiian / Pacific Islander residents 2 33.5% Owner occupied3 66.5% Renter occupiedHouse owners and renters - Other race residents 2,088 68.0% Owner occupied981 32.0% Renter occupiedHouse owners and renters - Two or more races residents 3,876 55.0% Owner occupied3,165 45.0% Renter occupiedHouse owners and renters - White alone residents 42,179 63.3% Owner occupied24,448 36.7% Renter occupiedHouse owners and renters - Hispanic or Latino residents 4,852 65.5% Owner occupied2,550 34.5% Renter occupied
Language usage in Des Moines
English speakers - Total 78.3% of residents of Des Moines speak English at home.
9.4% of residents speak Spanish at home 11,025 59.2% Speak English very well7,606 40.8% Speak English less than very well12.3% of residents speak other language at home 9,760 40.0% Speak English very well14,641 60.0% Speak English less than very well
English speakers - Born in the United States 93.0% of residents of Des Moines speak English at home.
3.8% of residents speak Spanish at home 1,381 91.2% Speak English very well134 8.8% Speak English less than very well3.2% of residents speak other language at home 1,034 79.6% Speak English very well265 20.4% Speak English less than very well
English speakers - Native, born elsewhere 70.2% of residents of Des Moines speak English at home.
17.5% of residents speak Spanish at home 46 25.6% Speak English very well134 74.4% Speak English less than very well12.3% of residents speak other language at home 56 44.4% Speak English very well70 55.6% Speak English less than very well
English speakers - Foreign-born 12.0% of residents of Des Moines speak English at home.
28.3% of residents speak Spanish at home 2,924 30.7% Speak English very well6,612 69.3% Speak English less than very well59.7% of residents speak other language at home 6,525 32.5% Speak English very well13,551 67.5% Speak English less than very well
White (Caucasian) - Speak only English Native:
97.6% (122,918)Foreign-born:
35.4% (924)
White (Caucasian) - Speak another language Native:
2.4% (3,026)Foreign-born:
64.6% (1,683)
Black or African American - Speak only English Native:
88.1% (12,949)Foreign-born:
13.5% (1,735)
Black or African American - Speak another language Native:
11.9% (1,755)Foreign-born:
86.5% (11,161)
American Indian / Alaska Native - Speak only English Native:
81.3% (358)Foreign-born:
6.8% (16)
American Indian / Alaska Native - Speak another language Native:
17.1% (75)Foreign-born:
88.7% (212)
Asian - Speak only English Native:
41.7% (1,335)Foreign-born:
7.3% (592)
Asian - Speak another language Native:
58.3% (1,863)Foreign-born:
92.7% (7,566)
Native Hawaiian / Pacific Islander - Speak another language Native:
6.8% (5)Foreign-born:
93.3% (7)
Other race - Speak only English Native:
52.4% (2,737)Foreign-born:
2.7% (145)
Other race - Speak another language Native:
47.6% (2,488)Foreign-born:
97.3% (5,269)
Two or more races - Speak only English Native:
71.6% (10,729)Foreign-born:
14.8% (630)
Two or more races - Speak another language Native:
28.4% (4,261)Foreign-born:
85.2% (3,635)
White alone - Speak only English Native:
98.2% (121,165)Foreign-born:
51.9% (829)
White alone - Speak another language Native:
1.8% (2,184)Foreign-born:
48.1% (769)
Hispanic or Latino - Speak only English Native:
46.5% (6,555)Foreign-born:
7.1% (739)
Hispanic or Latino - Speak another language Native:
53.5% (7,546)Foreign-born:
92.9% (9,732)
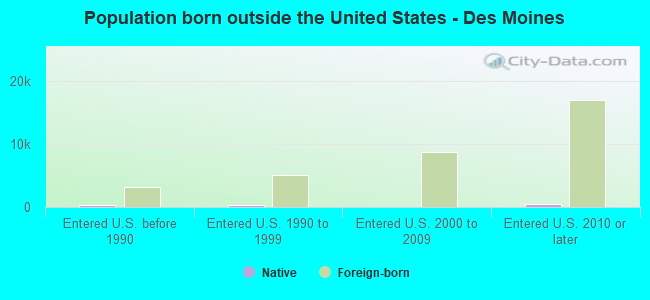
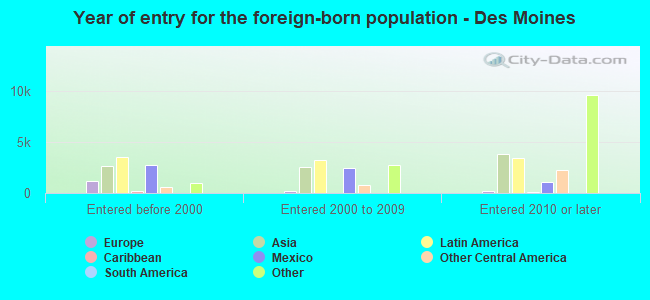
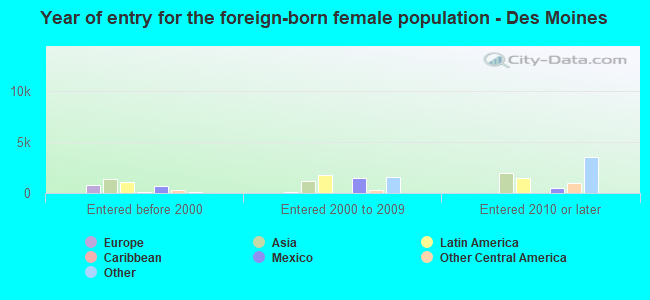
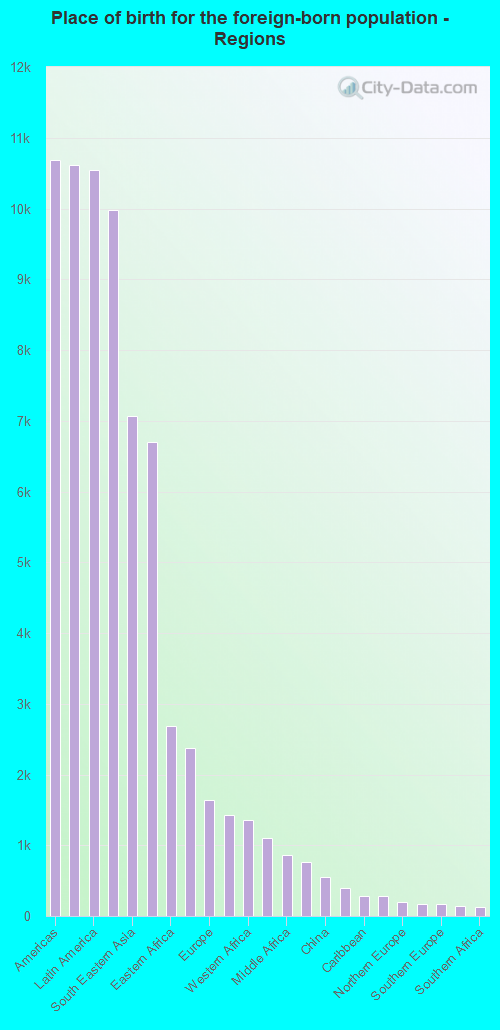
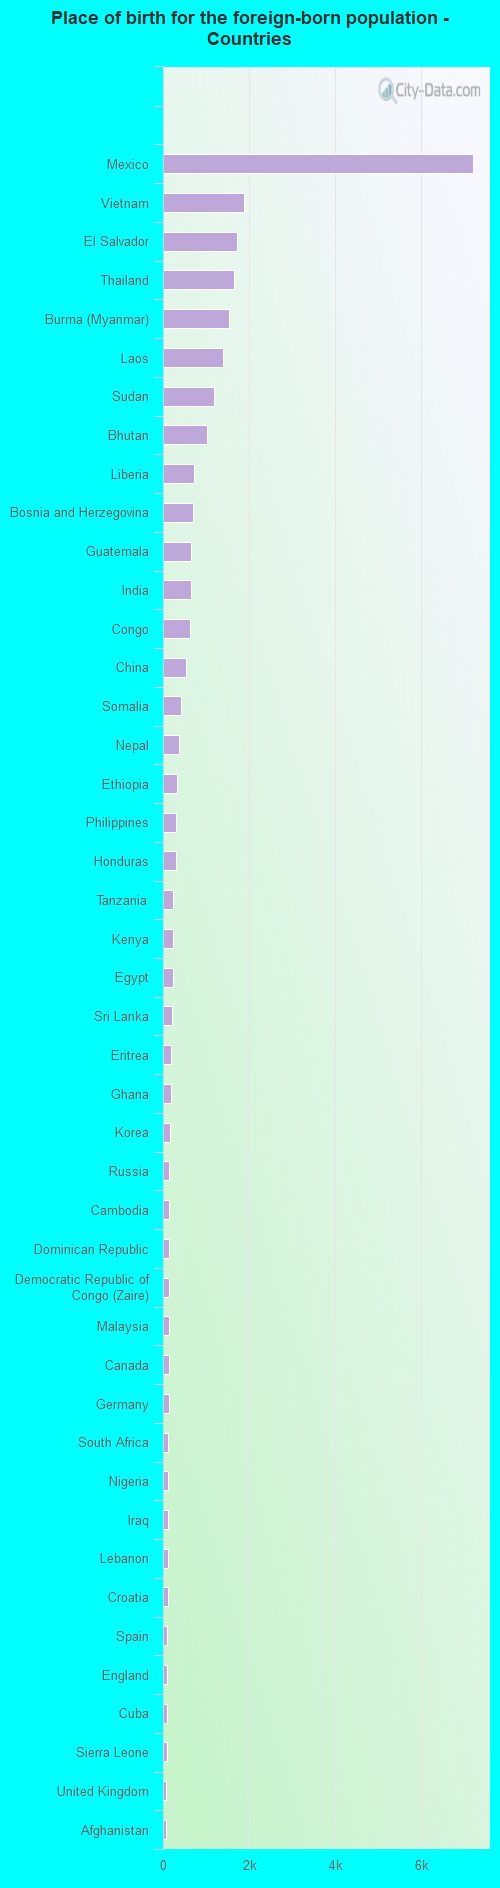
Foreign-born residents in Des Moines 29,687 residents are foreign born (4.9% Asia , 4.9% Latin America , 3.1% Africa ).
Marital status for residents in Des Moines Marital status - White (Caucasian) population 15 years and over
Males 40.1% Never married42.3% Now married0.8% Separated4.1% Widowed12.8% DivorcedFemales 35.6% Never married37.4% Now married1.5% Separated8.7% Widowed16.9% DivorcedWomen who gave birth in the past 12 months Now married:
64.5% (800)Unmarried:
35.5% (440)
Women who did not give birth in the past 12 months Now married:
31.1% (10,064)Unmarried:
68.9% (22,288)
Marital status - Black or African American population 15 years and over
Males 46.9% Never married26.0% Now married11.3% Separated5.2% Widowed10.7% DivorcedFemales 46.2% Never married24.3% Now married10.4% Separated3.9% Widowed15.1% DivorcedWomen who gave birth in the past 12 months Now married:
100.0% (258)Unmarried:
0.0% (0)
Women who did not give birth in the past 12 months Now married:
32.8% (2,460)Unmarried:
67.2% (5,045)
Marital status - American Indian / Alaska Native population 15 years and over
Males 37.1% Never married15.8% Now married2.3% Separated0.0% Widowed44.8% DivorcedFemales 39.9% Never married31.5% Now married11.7% Separated5.2% Widowed11.7% DivorcedWomen who did not give birth in the past 12 months Now married:
45.1% (106)Unmarried:
54.9% (129)
Marital status - Asian population 15 years and over
Males 30.4% Never married65.4% Now married1.4% Separated0.0% Widowed2.8% DivorcedFemales 30.1% Never married54.1% Now married4.5% Separated6.8% Widowed4.6% DivorcedWomen who gave birth in the past 12 months Now married:
97.7% (265)Unmarried:
2.3% (6)
Women who did not give birth in the past 12 months Now married:
44.2% (2,009)Unmarried:
55.8% (2,540)
Marital status - Native Hawaiian / Pacific Islander population 15 years and over
Males 31.8% Never married68.2% Now married0.0% Separated0.0% Widowed0.0% DivorcedFemales 50.0% Never married50.0% Now married0.0% Separated0.0% Widowed0.0% DivorcedWomen who did not give birth in the past 12 months Now married:
40.0% (3)Unmarried:
60.0% (5)
Marital status - Other race population 15 years and over
Males 49.6% Never married37.5% Now married1.4% Separated2.0% Widowed9.5% DivorcedFemales 48.9% Never married36.4% Now married1.3% Separated7.1% Widowed6.3% DivorcedWomen who gave birth in the past 12 months Now married:
34.9% (38)Unmarried:
65.1% (70)
Women who did not give birth in the past 12 months Now married:
36.2% (1,038)Unmarried:
63.8% (1,833)
Marital status - Two or more races population 15 years and over
Males 66.3% Never married26.6% Now married0.0% Separated0.6% Widowed6.6% DivorcedFemales 50.2% Never married27.0% Now married3.0% Separated6.5% Widowed13.3% DivorcedWomen who gave birth in the past 12 months Now married:
65.7% (226)Unmarried:
34.3% (118)
Women who did not give birth in the past 12 months Now married:
22.5% (1,268)Unmarried:
77.5% (4,373)
Marital status - White alone, not Hispanic / Latino population 15 years and over
Males 39.8% Never married42.9% Now married0.8% Separated4.2% Widowed12.3% DivorcedFemales 35.3% Never married37.3% Now married1.3% Separated8.8% Widowed17.3% DivorcedWomen who gave birth in the past 12 months Now married:
69.3% (767)Unmarried:
30.7% (339)
Women who did not give birth in the past 12 months Now married:
31.0% (9,740)Unmarried:
69.0% (21,724)
Marital status - Hispanic or Latino population 15 years and over
Males 47.6% Never married41.3% Now married0.0% Separated0.0% Widowed11.1% DivorcedFemales 49.3% Never married41.9% Now married1.4% Separated2.5% Widowed5.0% DivorcedWomen who gave birth in the past 12 months Now married:
48.7% (208)Unmarried:
51.3% (219)
Women who did not give birth in the past 12 months Now married:
34.8% (2,328)Unmarried:
65.2% (4,355)
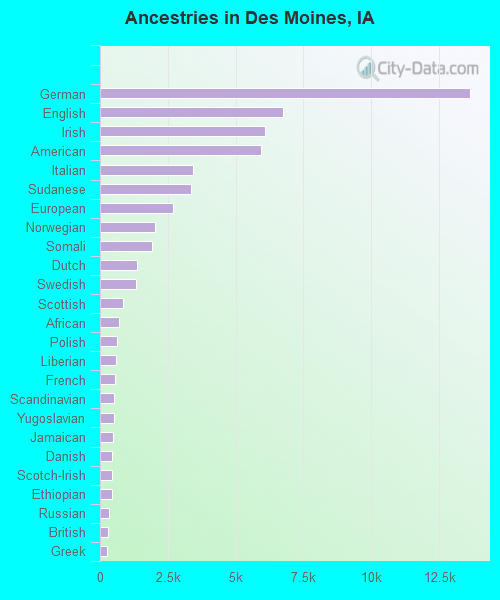
Ancestries in Des Moines
13,659 12.7% German6,750 6.3% English6,101 5.7% Irish5,937 5.5% American3,437 3.2% Italian3,362 3.1% Sudanese2,679 2.5% European2,011 1.9% Norwegian1,913 1.8% Somali1,351 1.3% Dutch1,325 1.2% Swedish835 0.8% Scottish718 0.7% African633 0.6% Polish594 0.6% Liberian559 0.5% French515 0.5% Scandinavian510 0.5% Yugoslavian486 0.5% Jamaican444 0.4% Danish437 0.4% Scotch-Irish427 0.4% Ethiopian341 0.3% Russian288 0.3% British264 0.2% Greek251 0.2% Czech181 0.2% Haitian181 0.2% Afghan169 0.2% Croatian164 0.2% Northern European164 0.2% Nigerian161 0.1% Eastern European113 0.1% Austrian110 0.1% Welsh85 0.08% Canadian66 0.06% Lebanese58 0.05% Czechoslovakian51 0.05% French Canadian45 0.04% Maltese44 0.04% Senegalese40 0.04% Iraqi40 0.04% Iranian39 0.04% Pennsylvania German37 0.03% Hungarian34 0.03% Romanian30 0.03% Slovak29 0.03% Ukrainian28 0.03% Latvian25 0.02% Swiss25 0.02% Australian22 0.02% Brazilian18 0.02% Finnish18 0.02% Turkish17 0.02% Celtic17 0.02% Belgian16 0.01% Egyptian16 0.01% Moroccan15 0.01% Trinidadian and Tobagonian14 0.01% German Russian11 0.01% Kenyan9 0.01% Luxembourger8 0.01% Arab7 0.01% Slovene7 0.01% New Zealander7 0.01% Bulgarian
Geographical mobility in Des Moines Same house 1 year ago 110,620 82.9% White (Caucasian)27,164 88.2% Black or African American682 95.7% American Indian / Alaska Native11,614 86.9% Asian23 31.2% Native Hawaiian / Pacific Islander9,964 80.2% Other race18,002 85.4% Two or more races107,111 82.8% White alone, not Hispanic / Latino22,895 84.5% Hispanic or LatinoMoved within same county 13,582 10.2% White / Caucasian2,107 6.8% Black or African American13 1.8% American Indian / Alaska Native932 7.0% Asian47 65.4% Native Hawaiian / Pacific Islander1,436 11.6% Other race2,220 10.5% Two or more races13,171 10.2% White alone, not Hispanic / Latino2,804 10.3% Hispanic or LatinoMoved within same state 6,681 5.0% White / Caucasian1,236 4.0% Black or African American1 0.1% American Indian / Alaska Native81 0.6% Asian109 0.9% Other race630 3.0% Two or more races6,633 5.1% White alone, not Hispanic / Latino932 3.4% Hispanic or LatinoMoved from different state 2,616 2.0% White / Caucasian180 0.6% Black or African American33 4.7% American Indian / Alaska Native266 2.0% Asian125 1.0% Other race219 1.0% Two or more races2,470 1.9% White alone, not Hispanic / Latino352 1.3% Hispanic or LatinoMoved from abroad 5 0.0% White109 0.4% Black or African American222 1.7% Asian91 0.7% Other race5 0.0% White alone, not Hispanic / Latino114 0.4% Hispanic or Latino
Children Nativity (place of birth) in Des Moines
Children under 6 years - Living with two parents Both parents native 5,610 100.0% NativeBoth parents foreign-born 2,353 89.6% Native273 10.4% Foreign-bornOne native, one foreign-born parent 618 100.0% NativeChildren under 6 years - Living with one parent Native parent 4,706 100.0% NativeForeign-born parent 1,893 84.5% Native348 15.5% Foreign-bornChildren 6 to 17 years - Living with two parents Both parents native 7,852 100.0% NativeBoth parents foreign-born 3,464 52.2% Native3,175 47.8% Foreign-bornOne native, one foreign-born parent 1,680 89.5% Native197 10.5% Foreign-bornChildren 6 to 17 years - Living with one parent Native parent 7,325 100.0% NativeForeign-born parent 4,011 57.2% Native3,006 42.8% Foreign-born
Place of birth for residents in Des Moines 10,684 Americas10,610 Asia10,545 Latin America9,976 Central America7,067 South Eastern Asia6,706 Africa2,692 Eastern Africa2,376 South Central Asia1,636 Europe1,427 Northern Africa1,352 Western Africa1,097 Eastern Europe868 Middle Africa760 Eastern Asia553 China395 Western Asia289 Caribbean279 South America197 Northern Europe171 Western Europe170 Southern Europe138 Northern America126 Southern Africa48 Oceania41 Australia and New Zealand Subregion7,214 Mexico1,883 Vietnam1,731 El Salvador1,657 Thailand1,543 Burma (Myanmar)1,391 Laos1,177 Sudan1,013 Bhutan710 Liberia688 Bosnia and Herzegovina657 Guatemala648 India623 Congo524 China417 Somalia383 Nepal328 Ethiopia303 Philippines300 Honduras243 Tanzania239 Kenya238 Egypt205 Sri Lanka189 Eritrea176 Ghana156 Korea150 Russia143 Cambodia140 Dominican Republic139 Democratic Republic of Congo (Zaire)139 Malaysia138 Canada129 Germany126 South Africa125 Nigeria116 Iraq110 Lebanon108 Croatia98 Spain83 England83 Cuba83 Sierra Leone81 United Kingdom75 Afghanistan62 Ecuador60 Brazil53 Argentina52 Italy50 Japan49 Pakistan44 Senegal42 Poland42 Costa Rica41 Turkey38 Colombia35 Australia34 Saudi Arabia34 Venezuela29 Azerbaijan28 Israel27 Netherlands25 Haiti24 Jamaica23 Syria23 Latvia21 Hong Kong21 Cameroon20 Zimbabwe18 Peru17 Ukraine16 Scotland15 Trinidad and Tobago15 Belize13 Serbia11 Kuwait11 Denmark11 Morocco10 Togo10 Bulgaria8 Taiwan7 Romania7 Micronesia7 Chile7 France6 New Zealand5 Indonesia5 Ireland5 Bolivia3 Ivory Coast
Grandparents responsible for own grandchildren in Des Moines
Grandparents (30 to 59 years) White / Caucasian 581 51.7% Responsible for grandchildren544 48.3% Not responsible for grandchildrenBlack or African American 146 48.5% Responsible for grandchildren155 51.5% Not responsible for grandchildrenAmerican Indian / Alaska Native 3 46.3% Responsible for grandchildren3 53.7% Not responsible for grandchildrenAsian 13 14.5% Responsible for grandchildren77 85.5% Not responsible for grandchildrenOther race 17 16.8% Responsible for grandchildren84 83.2% Not responsible for grandchildrenTwo or more races 67 41.2% Responsible for grandchildren95 58.8% Not responsible for grandchildrenWhite alone, not Hispanic / Latino 453 53.7% Responsible for grandchildren390 46.3% Not responsible for grandchildrenHispanic or Latino 188 50.7% Responsible for grandchildren183 49.3% Not responsible for grandchildrenGrandparents (60 years and over) White / Caucasian 170 33.2% Responsible for grandchildren342 66.8% Not responsible for grandchildrenBlack or African American 36 19.2% Responsible for grandchildren150 80.8% Not responsible for grandchildrenAsian 20 4.7% Responsible for grandchildren397 95.3% Not responsible for grandchildrenOther race 33 12.6% Responsible for grandchildren227 87.4% Not responsible for grandchildrenTwo or more races 1 10.5% Responsible for grandchildren7 89.5% Not responsible for grandchildrenWhite alone, not Hispanic / Latino 170 33.8% Responsible for grandchildren334 66.2% Not responsible for grandchildrenHispanic or Latino 0 0.2% Responsible for grandchildren321 99.8% Not responsible for grandchildren