Races in El Paso, Texas (TX) Detailed Stats
Data:
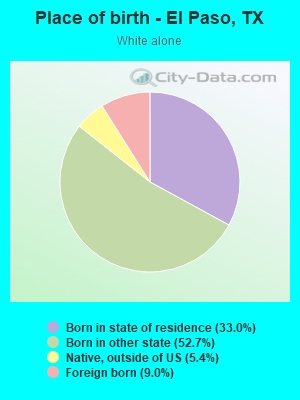
Races - White alone (%)
Races - White alone (% change since 2000)
Races - Black alone (%)
Races - Black alone (% change since 2000)
Races - American Indian alone (%)
Races - American Indian alone (% change since 2000)
Races - Asian alone (%)
Races - Asian alone (% change since 2000)
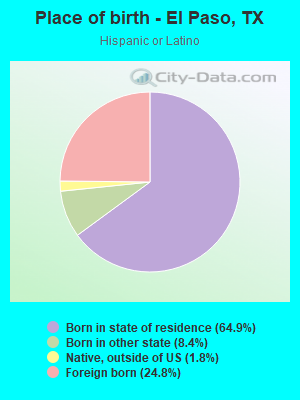
Races - Hispanic (%)
Races - Hispanic (% change since 2000)
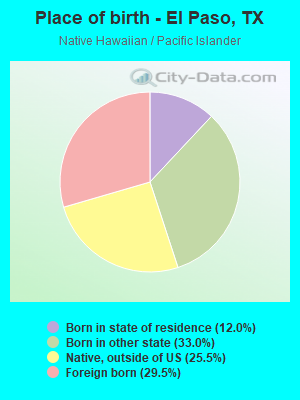
Races - Native Hawaiian and Other Pacific Islander alone (%)
Races - Native Hawaiian and Other Pacific Islander alone (% change since 2000)
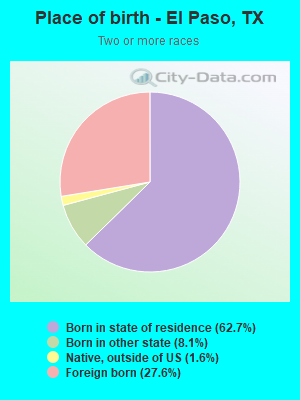
Races - Two or more races(%)
Races - Two or more races(% change since 2000)
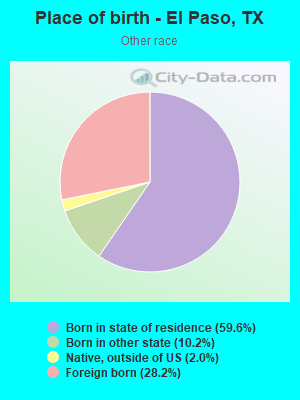
Races - Other race alone (%)
Races - Other race alone (% change since 2000)
Racial diversity
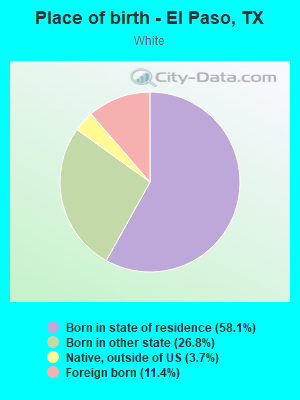
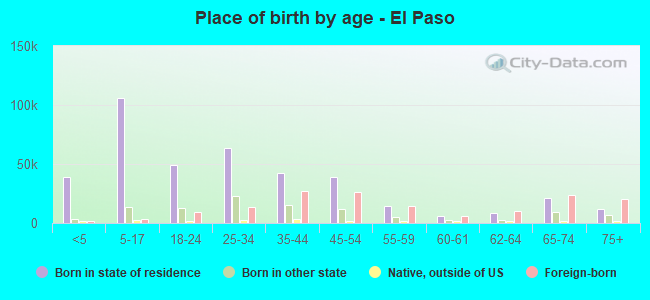
Place of birth - Born in state of residence (%)
Place of birth - Born in state of residence (%) - White
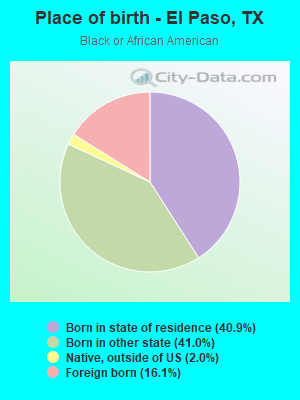
Place of birth - Born in state of residence (%) - Black or African American
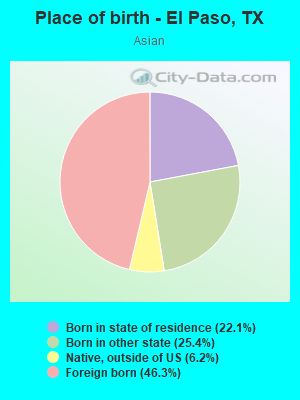
Place of birth - Born in state of residence (%) - Asian
Place of birth - Born in state of residence (%) - Hispanic or Latino
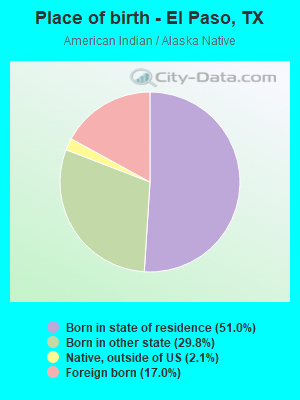
Place of birth - Born in state of residence (%) - American Indian and Alaska Native
Place of birth - Born in state of residence (%) - Multirace
Place of birth - Born in state of residence (%) - Other Race
Place of birth - Born in other state (%)
Place of birth - Born in other state (%) - White
Place of birth - Born in other state (%) - Black or African American
Place of birth - Born in other state (%) - Asian
Place of birth - Born in other state (%) - Hispanic or Latino
Place of birth - Born in other state (%) - American Indian and Alaska Native
Place of birth - Born in other state (%) - Multirace
Place of birth - Born in other state (%) - Other Race
Place of birth - Native, outside of US (%)
Place of birth - Native, outside of US (%) - White
Place of birth - Native, outside of US (%) - Black or African American
Place of birth - Native, outside of US (%) - Asian
Place of birth - Native, outside of US (%) - Hispanic or Latino
Place of birth - Native, outside of US (%) - American Indian and Alaska Native
Place of birth - Native, outside of US (%) - Multirace
Place of birth - Native, outside of US (%) - Other Race
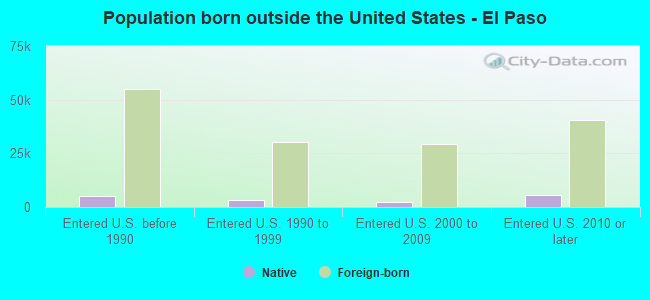
Place of birth - Foreign born (%)
Place of birth - Foreign born (%) - White
Place of birth - Foreign born (%) - Black or African American
Place of birth - Foreign born (%) - Asian
Place of birth - Foreign born (%) - Hispanic or Latino
Place of birth - Foreign born (%) - American Indian and Alaska Native
Place of birth - Foreign born (%) - Multirace
Place of birth - Foreign born (%) - Other Race
Residents speaking English at home (%)
Residents speaking English at home - Born in the United States (%)
Residents speaking English at home - Native, born elsewhere (%)
Residents speaking English at home - Foreign born (%)
Residents speaking Spanish at home (%)
Residents speaking Spanish at home - Born in the United States (%)
Residents speaking Spanish at home - Native, born elsewhere (%)
Residents speaking Spanish at home - Foreign born (%)
Residents speaking other language at home (%)
Residents speaking other language at home - Born in the United States (%)
Residents speaking other language at home - Native, born elsewhere (%)
Residents speaking other language at home - Foreign born (%)
Marital status - Never married (%)
Marital status - Now married (%)
Marital status - Separated (%)
Marital status - Widowed (%)
Marital status - Divorced (%)
Ancestries Reported - Arab (%)
Ancestries Reported - Czech (%)
Ancestries Reported - Danish (%)
Ancestries Reported - Dutch (%)
Ancestries Reported - English (%)
Ancestries Reported - French (%)
Ancestries Reported - French Canadian (%)
Ancestries Reported - German (%)
Ancestries Reported - Greek (%)
Ancestries Reported - Hungarian (%)
Ancestries Reported - Irish (%)
Ancestries Reported - Italian (%)
Ancestries Reported - Lithuanian (%)
Ancestries Reported - Norwegian (%)
Ancestries Reported - Polish (%)
Ancestries Reported - Portuguese (%)
Ancestries Reported - Russian (%)
Ancestries Reported - Scotch-Irish (%)
Ancestries Reported - Scottish (%)
Ancestries Reported - Slovak (%)
Ancestries Reported - Subsaharan African (%)
Ancestries Reported - Swedish (%)
Ancestries Reported - Swiss (%)
Ancestries Reported - Ukrainian (%)
Ancestries Reported - United States (%)
Ancestries Reported - Welsh (%)
Ancestries Reported - West Indian (%)
Ancestries Reported - Other (%)
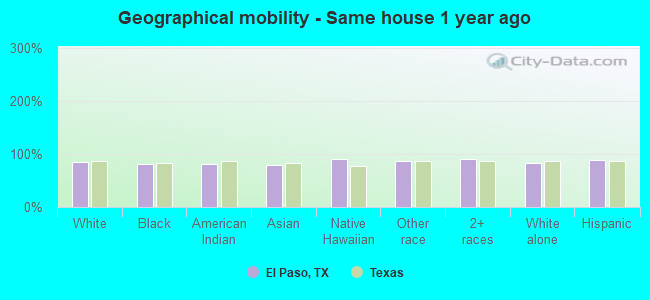
Geographical mobility - Same house 1 year ago (%)
Geographical mobility - Same house 1 year ago (%) - White
Geographical mobility - Same house 1 year ago (%) - Black or African American
Geographical mobility - Same house 1 year ago (%) - Asian
Geographical mobility - Same house 1 year ago (%) - Hispanic or Latino
Geographical mobility - Same house 1 year ago (%) - American Indian and Alaska Native
Geographical mobility - Same house 1 year ago (%) - Multirace
Geographical mobility - Same house 1 year ago (%) - Other Race
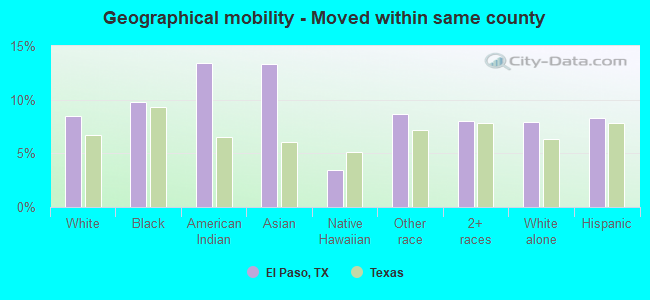
Geographical mobility - Moved within same county (%)
Geographical mobility - Moved within same county (%) - White
Geographical mobility - Moved within same county (%) - Black or African American
Geographical mobility - Moved within same county (%) - Asian
Geographical mobility - Moved within same county (%) - Hispanic or Latino
Geographical mobility - Moved within same county (%) - American Indian and Alaska Native
Geographical mobility - Moved within same county (%) - Multirace
Geographical mobility - Moved within same county (%) - Other Race
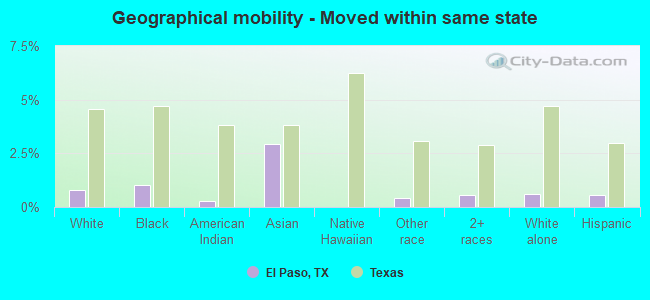
Geographical mobility - Moved from different county within same state (%)
Geographical mobility - Moved from different county within same state (%) - White
Geographical mobility - Moved from different county within same state (%) - Black or African American
Geographical mobility - Moved from different county within same state (%) - Asian
Geographical mobility - Moved from different county within same state (%) - Hispanic or Latino
Geographical mobility - Moved from different county within same state (%) - American Indian and Alaska Native
Geographical mobility - Moved from different county within same state (%) - Multirace
Geographical mobility - Moved from different county within same state (%) - Other Race
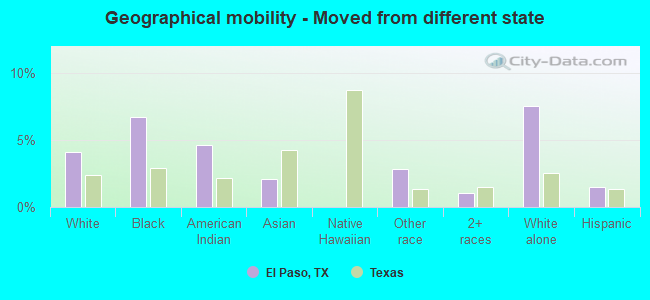
Geographical mobility - Moved from different state (%)
Geographical mobility - Moved from different state (%) - White
Geographical mobility - Moved from different state (%) - Black or African American
Geographical mobility - Moved from different state (%) - Asian
Geographical mobility - Moved from different state (%) - Hispanic or Latino
Geographical mobility - Moved from different state (%) - American Indian and Alaska Native
Geographical mobility - Moved from different state (%) - Multirace
Geographical mobility - Moved from different state (%) - Other Race
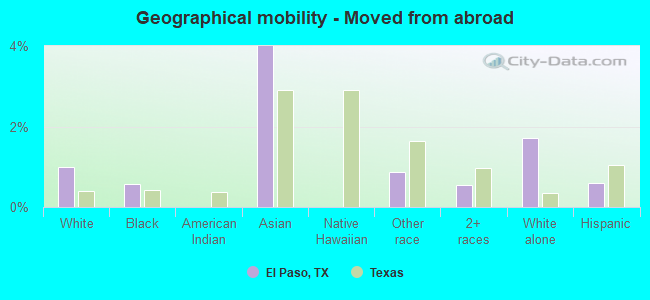
Geographical mobility - Moved from abroad (%)
Geographical mobility - Moved from abroad (%) - White
Geographical mobility - Moved from abroad (%) - Black or African American
Geographical mobility - Moved from abroad (%) - Asian
Geographical mobility - Moved from abroad (%) - Hispanic or Latino
Geographical mobility - Moved from abroad (%) - American Indian and Alaska Native
Geographical mobility - Moved from abroad (%) - Multirace
Geographical mobility - Moved from abroad (%) - Other Race
Place of birth for the foreign-born population - Ireland (%)
Place of birth for the foreign-born population - Denmark (%)
Place of birth for the foreign-born population - Norway (%)
Place of birth for the foreign-born population - Sweden (%)
Place of birth for the foreign-born population - United Kingdom (%)
Place of birth for the foreign-born population - England (%)
Place of birth for the foreign-born population - Scotland (%)
Place of birth for the foreign-born population - Other Northern Europe (%)
Place of birth for the foreign-born population - Austria (%)
Place of birth for the foreign-born population - Belgium (%)
Place of birth for the foreign-born population - France (%)
Place of birth for the foreign-born population - Germany (%)
Place of birth for the foreign-born population - Netherlands (%)
Place of birth for the foreign-born population - Switzerland (%)
Place of birth for the foreign-born population - Other Western Europe (%)
Place of birth for the foreign-born population - Greece (%)
Place of birth for the foreign-born population - Italy (%)
Place of birth for the foreign-born population - Portugal (%)
Place of birth for the foreign-born population - Spain (%)
Place of birth for the foreign-born population - Other Southern Europe (%)
Place of birth for the foreign-born population - Albania (%)
Place of birth for the foreign-born population - Belarus (%)
Place of birth for the foreign-born population - Bosnia and Herzegovina (%)
Place of birth for the foreign-born population - Bulgaria (%)
Place of birth for the foreign-born population - Croatia (%)
Place of birth for the foreign-born population - Czechoslovakia (%)
Place of birth for the foreign-born population - Hungary (%)
Place of birth for the foreign-born population - Latvia (%)
Place of birth for the foreign-born population - Lithuania (%)
Place of birth for the foreign-born population - North Macedonia (Macedonia) (%)
Place of birth for the foreign-born population - Moldova (%)
Place of birth for the foreign-born population - Poland (%)
Place of birth for the foreign-born population - Romania (%)
Place of birth for the foreign-born population - Russia (%)
Place of birth for the foreign-born population - Serbia (%)
Place of birth for the foreign-born population - Ukraine (%)
Place of birth for the foreign-born population - Other Eastern Europe (%)
Place of birth for the foreign-born population - China (%)
Place of birth for the foreign-born population - Hong Kong (%)
Place of birth for the foreign-born population - Taiwan (%)
Place of birth for the foreign-born population - Japan (%)
Place of birth for the foreign-born population - Korea (%)
Place of birth for the foreign-born population - Other Eastern Asia (%)
Place of birth for the foreign-born population - Afghanistan (%)
Place of birth for the foreign-born population - Bangladesh (%)
Place of birth for the foreign-born population - India (%)
Place of birth for the foreign-born population - Iran (%)
Place of birth for the foreign-born population - Kazakhstan (%)
Place of birth for the foreign-born population - Nepal (%)
Place of birth for the foreign-born population - Pakistan (%)
Place of birth for the foreign-born population - Sri Lanka (%)
Place of birth for the foreign-born population - Uzbekistan (%)
Place of birth for the foreign-born population - Other South Central Asia (%)
Place of birth for the foreign-born population - Burma (%)
Place of birth for the foreign-born population - Cambodia (%)
Place of birth for the foreign-born population - Indonesia (%)
Place of birth for the foreign-born population - Laos (%)
Place of birth for the foreign-born population - Malaysia (%)
Place of birth for the foreign-born population - Philippines (%)
Place of birth for the foreign-born population - Singapore (%)
Place of birth for the foreign-born population - Thailand (%)
Place of birth for the foreign-born population - Vietnam (%)
Place of birth for the foreign-born population - Other South Eastern Asia (%)
Place of birth for the foreign-born population - Armenia (%)
Place of birth for the foreign-born population - Iraq (%)
Place of birth for the foreign-born population - Israel (%)
Place of birth for the foreign-born population - Jordan (%)
Place of birth for the foreign-born population - Kuwait (%)
Place of birth for the foreign-born population - Lebanon (%)
Place of birth for the foreign-born population - Saudi Arabia (%)
Place of birth for the foreign-born population - Syria (%)
Place of birth for the foreign-born population - Turkey (%)
Place of birth for the foreign-born population - Yemen (%)
Place of birth for the foreign-born population - Other Western Asia (%)
Place of birth for the foreign-born population - Eritrea (%)
Place of birth for the foreign-born population - Ethiopia (%)
Place of birth for the foreign-born population - Kenya (%)
Place of birth for the foreign-born population - Somalia (%)
Place of birth for the foreign-born population - Uganda (%)
Place of birth for the foreign-born population - Zimbabwe (%)
Place of birth for the foreign-born population - Other Eastern Africa (%)
Place of birth for the foreign-born population - Cameroon (%)
Place of birth for the foreign-born population - Congo (%)
Place of birth for the foreign-born population - Democratic Republic of Congo (Zaire) (%)
Place of birth for the foreign-born population - Other Middle Africa (%)
Place of birth for the foreign-born population - Egypt (%)
Place of birth for the foreign-born population - Morocco (%)
Place of birth for the foreign-born population - Sudan (%)
Place of birth for the foreign-born population - Other Northern Africa (%)
Place of birth for the foreign-born population - South Africa (%)
Place of birth for the foreign-born population - Other Southern Africa (%)
Place of birth for the foreign-born population - Cabo Verde (%)
Place of birth for the foreign-born population - Ghana (%)
Place of birth for the foreign-born population - Liberia (%)
Place of birth for the foreign-born population - Nigeria (%)
Place of birth for the foreign-born population - Senegal (%)
Place of birth for the foreign-born population - Sierra Leone (%)
Place of birth for the foreign-born population - Other Western Africa (%)
Place of birth for the foreign-born population - Australia (%)
Place of birth for the foreign-born population - New Zealand (%)
Place of birth for the foreign-born population - Fiji (%)
Place of birth for the foreign-born population - Micronesia (%)
Place of birth for the foreign-born population - Bahamas (%)
Place of birth for the foreign-born population - Barbados (%)
Place of birth for the foreign-born population - Cuba (%)
Place of birth for the foreign-born population - Dominica (%)
Place of birth for the foreign-born population - Dominican Republic (%)
Place of birth for the foreign-born population - Grenada (%)
Place of birth for the foreign-born population - Haiti (%)
Place of birth for the foreign-born population - Jamaica (%)
Place of birth for the foreign-born population - St. Vincent and the Grenadines (%)
Place of birth for the foreign-born population - Trinidad and Tobago (%)
Place of birth for the foreign-born population - West Indies (%)
Place of birth for the foreign-born population - Other Caribbean (%)
Place of birth for the foreign-born population - Belize (%)
Place of birth for the foreign-born population - Costa Rica (%)
Place of birth for the foreign-born population - El Salvador (%)
Place of birth for the foreign-born population - Guatemala (%)
Place of birth for the foreign-born population - Honduras (%)
Place of birth for the foreign-born population - Mexico (%)
Place of birth for the foreign-born population - Nicaragua (%)
Place of birth for the foreign-born population - Panama (%)
Place of birth for the foreign-born population - Other Central America (%)
Place of birth for the foreign-born population - Argentina (%)
Place of birth for the foreign-born population - Bolivia (%)
Place of birth for the foreign-born population - Brazil (%)
Place of birth for the foreign-born population - Chile (%)
Place of birth for the foreign-born population - Colombia (%)
Place of birth for the foreign-born population - Ecuador (%)
Place of birth for the foreign-born population - Guyana (%)
Place of birth for the foreign-born population - Peru (%)
Place of birth for the foreign-born population - Uruguay (%)
Place of birth for the foreign-born population - Venezuela (%)
Place of birth for the foreign-born population - Other South America (%)
Place of birth for the foreign-born population - Canada (%)
Place of birth for the foreign-born population - Other Northern America (%)
Place of birth for the foreign-born population - Other (%)
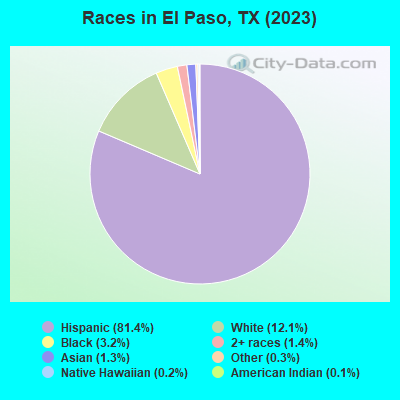
According to 2022 data, the most numerous races in El Paso, TX are Hispanic (552,378 residents), White alone (77,141 residents), and Black alone (24,074 residents). 33.0% of El Paso residents speak English at home. 23.3% of El Paso, TX residents are foreign-born (20.6% born in Latin America), which is 27.1% greater than the foreign-born rate of 17.0% across the entire state of Texas.
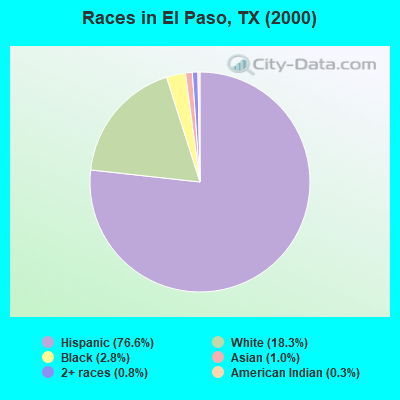
Race distribution in El Paso
2000 2022
431,875 76.6% Hispanic 103,422 18.3% White alone 15,768 2.8% Black alone 5,874 1.0% Asian alone 4,269 0.8% Two or more races 1,616 0.3% American Indian alone 460 0.08% Other race alone 378 0.07% Native Hawaiian and Other
552,378 81.5% Hispanic 77,141 11.4% White alone 24,074 3.6% Black alone 10,470 1.5% Asian alone 8,507 1.3% Two or more races 2,392 0.4% Other race alone 1,513 0.2% American Indian alone 994 0.1% Native Hawaiian and Other
2000 2022
10,933,313 52.4% White alone 6,669,666 32.0% Hispanic 2,364,255 11.3% Black alone 554,445 2.7% Asian alone 230,567 1.1% Two or more races 68,859 0.3% American Indian alone 19,958 0.10% Other race alone 10,757 0.05% Native Hawaiian and Other
12,070,642 40.2% Hispanic 11,683,430 38.9% White alone 3,508,706 11.7% Black alone 1,608,173 5.4% Asian alone 956,560 3.2% Two or more races 125,763 0.4% Other race alone 47,023 0.2% American Indian alone 29,275 0.10% Native Hawaiian and Other
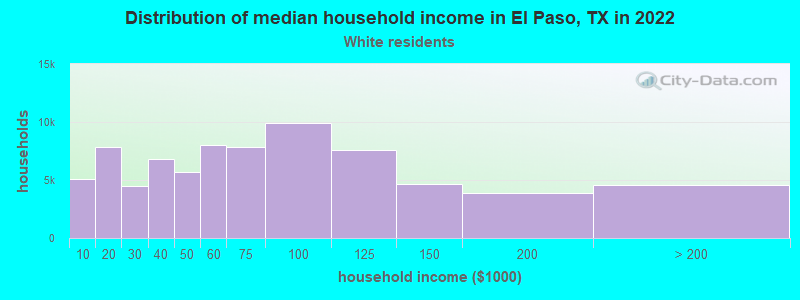
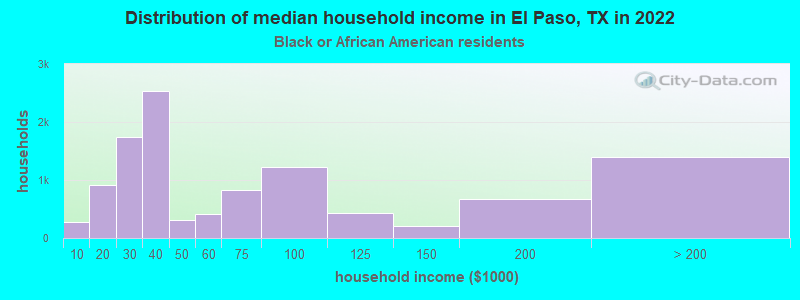
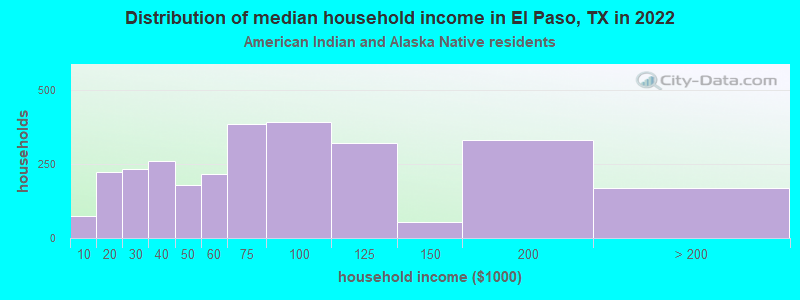
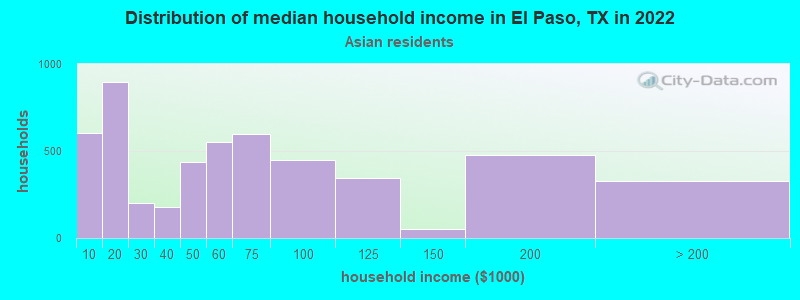
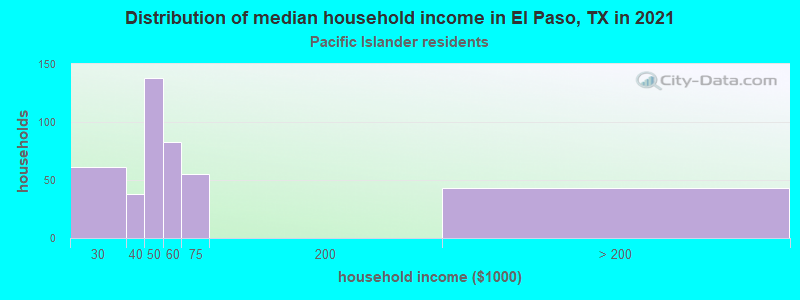
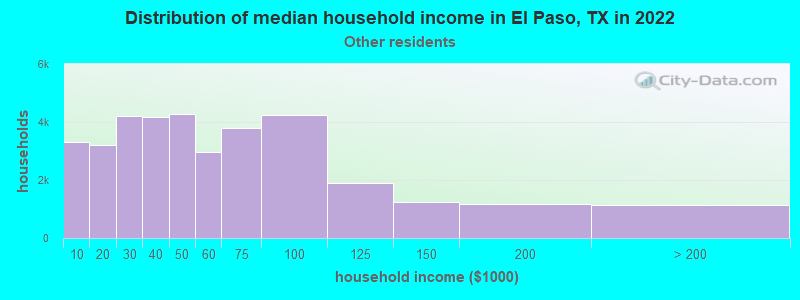
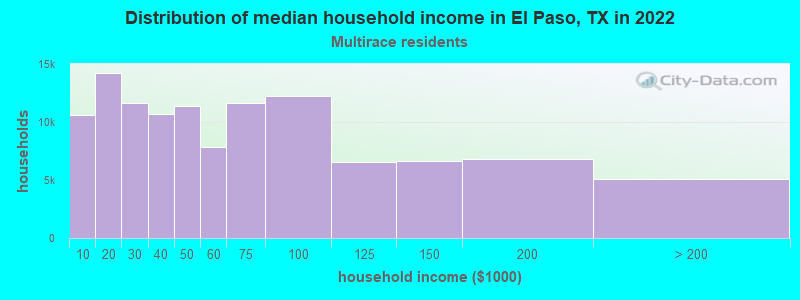
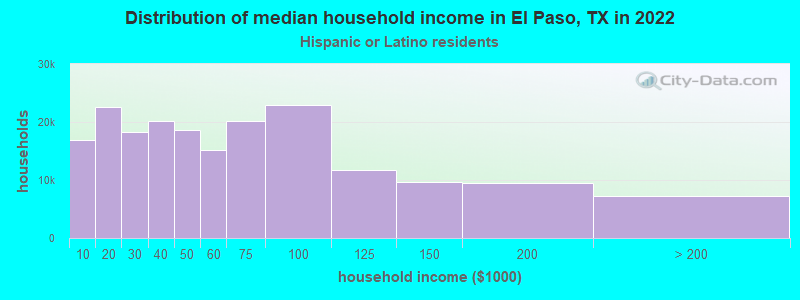
Income and house value in El Paso Median household income in 2022 $66,864 White non-Hispanic householders$42,665 Black householders$58,664 American Indian and Alaska Native householders$53,506 Asian householders$56,472 Native Hawaiian and other Pacific Islander householders$46,659 Some other race householders$49,141 Two or more races householders$49,980 Hispanic or Latino race householdersMedian 2022 house value $218,157 White Non-Hispanic householders$189,592 Black or African American householders$162,796 American Indian or Alaska Native householders $217,651 Asian householders$237,116 Native Hawaiian and other Pacific Islander householders$164,818 Some other race householders$170,885 Two or more races householders$168,105 Hispanic or Latino householders
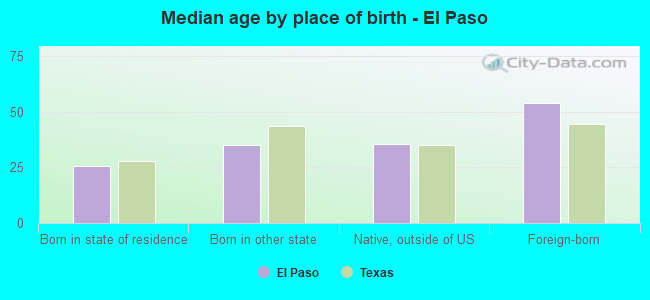
Median age by race in El Paso
34.9 Median age for White residents33.9 35.7 30.3 Median age for Black or African American residents31.0 26.4 34.2 Median age for American Indian / Alaska Native residents36.9 26.3 30.6 Median age for Asian residents29.5 33.2 59.5 Median age for Native Hawaiian / Pacific Islander residents59.7 59.4 34.5 Median age for Other race residents32.7 35.7 34.4 Median age for Two or more races residents31.3 36.9 41.0 Median age for White alone residents40.4 42.3 33.4 Median age for Hispanic or Latino residents31.3 35.7
Owner/renter occupied households by race in El Paso
House owners and renters - White residents 48,702 63.7% Owner occupied27,696 36.3% Renter occupiedHouse owners and renters - Black or African American residents 3,829 34.9% Owner occupied7,129 65.1% Renter occupiedHouse owners and renters - American Indian / Alaska Native residents 1,742 57.9% Owner occupied1,267 42.1% Renter occupiedHouse owners and renters - Asian residents 2,508 49.1% Owner occupied2,605 50.9% Renter occupiedHouse owners and renters - Native Hawaiian / Pacific Islander residents 169 38.1% Owner occupied275 61.9% Renter occupiedHouse owners and renters - Other race residents 20,336 57.1% Owner occupied15,303 42.9% Renter occupiedHouse owners and renters - Two or more races residents 68,592 59.5% Owner occupied46,686 40.5% Renter occupiedHouse owners and renters - White alone residents 23,021 65.8% Owner occupied11,970 34.2% Renter occupiedHouse owners and renters - Hispanic or Latino residents 114,403 59.4% Owner occupied78,344 40.6% Renter occupied
Language usage in El Paso
English speakers - Total 33.0% of residents of El Paso speak English at home.
64.2% of residents speak Spanish at home 248,379 61.2% Speak English very well157,442 38.8% Speak English less than very well2.8% of residents speak other language at home 13,945 77.8% Speak English very well3,987 22.2% Speak English less than very well
English speakers - Born in the United States 66.9% of residents of El Paso speak English at home.
30.6% of residents speak Spanish at home 23,474 74.9% Speak English very well7,872 25.1% Speak English less than very well2.5% of residents speak other language at home 2,018 78.7% Speak English very well546 21.3% Speak English less than very well
English speakers - Native, born elsewhere 43.2% of residents of El Paso speak English at home.
54.7% of residents speak Spanish at home 4,625 57.6% Speak English very well3,404 42.4% Speak English less than very well2.1% of residents speak other language at home 305 100.0% Speak English very well
English speakers - Foreign-born 7.6% of residents of El Paso speak English at home.
83.8% of residents speak Spanish at home 41,666 32.2% Speak English very well87,892 67.8% Speak English less than very well8.5% of residents speak other language at home 9,874 74.9% Speak English very well3,302 25.1% Speak English less than very well
White (Caucasian) - Speak only English Native:
59.6% (93,716)Foreign-born:
15.6% (3,275)
White (Caucasian) - Speak another language Native:
40.4% (63,490)Foreign-born:
84.4% (17,668)
Black or African American - Speak only English Native:
91.0% (19,532)Foreign-born:
21.0% (974)
Black or African American - Speak another language Native:
9.0% (1,924)Foreign-born:
79.0% (3,670)
American Indian / Alaska Native - Speak another language Native:
58.6% (2,683)Foreign-born:
100.0% (1,042)
Asian - Speak only English Native:
65.5% (3,710)Foreign-born:
13.7% (768)
Asian - Speak another language Native:
34.5% (1,955)Foreign-born:
86.3% (4,842)
Native Hawaiian / Pacific Islander - Speak another language Native:
20.9% (217)Foreign-born:
100.0% (237)
Other race - Speak only English Native:
24.2% (17,961)Foreign-born:
7.4% (2,349)
Other race - Speak another language Native:
75.8% (56,411)Foreign-born:
92.6% (29,492)
Two or more races - Speak only English Native:
28.0% (59,988)Foreign-born:
4.9% (4,453)
Two or more races - Speak another language Native:
72.0% (154,344)Foreign-born:
95.1% (85,522)
White alone - Speak only English Native:
92.3% (61,655)Foreign-born:
30.3% (1,952)
White alone - Speak another language Native:
7.7% (5,166)Foreign-born:
69.7% (4,499)
Hispanic or Latino - Speak only English Native:
28.4% (107,592)Foreign-born:
5.7% (7,794)
Hispanic or Latino - Speak another language Native:
71.6% (270,771)Foreign-born:
94.3% (128,994)
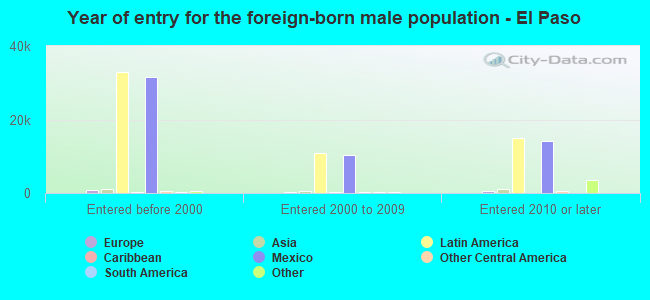
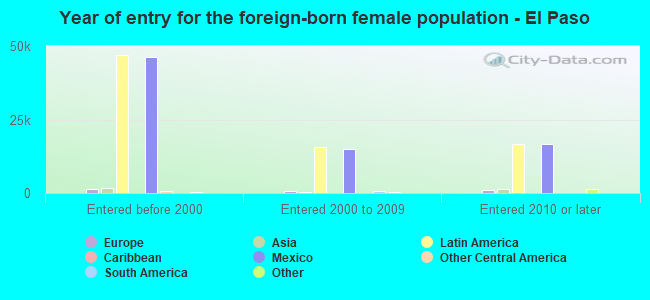
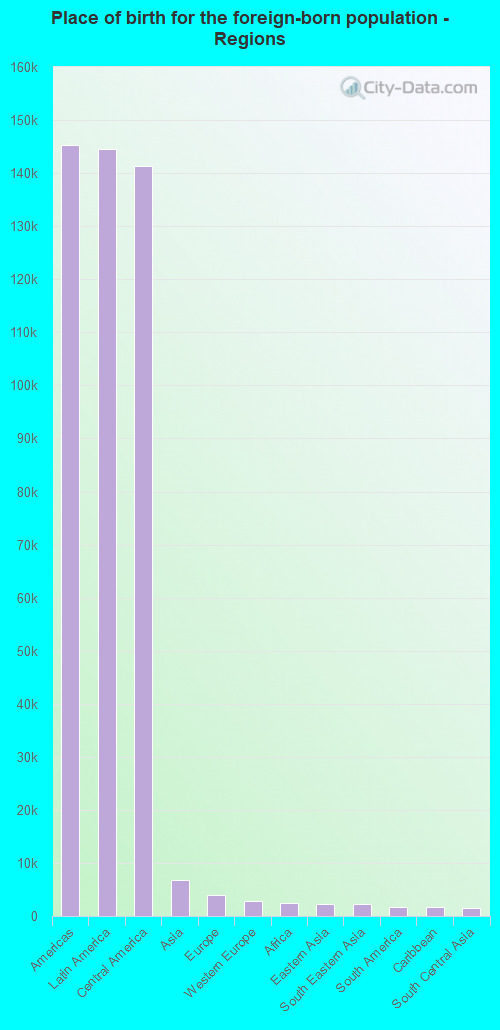
Foreign-born residents in El Paso 158,789 residents are foreign born (20.6% Latin America ).
This city:
23.3%Texas:
17.1%
Marital status for residents in El Paso Marital status - White (Caucasian) population 15 years and over
Males 34.6% Never married48.3% Now married2.9% Separated2.4% Widowed11.8% DivorcedFemales 29.1% Never married43.7% Now married2.6% Separated10.2% Widowed14.5% DivorcedWomen who gave birth in the past 12 months Now married:
81.8% (1,544)Unmarried:
18.2% (343)
Women who did not give birth in the past 12 months Now married:
43.8% (19,233)Unmarried:
56.2% (24,673)
Marital status - Black or African American population 15 years and over
Males 44.9% Never married41.8% Now married1.9% Separated4.2% Widowed7.2% DivorcedFemales 39.9% Never married42.8% Now married1.1% Separated4.4% Widowed11.9% DivorcedWomen who gave birth in the past 12 months Now married:
73.1% (611)Unmarried:
26.9% (225)
Women who did not give birth in the past 12 months Now married:
35.9% (1,708)Unmarried:
64.1% (3,055)
Marital status - American Indian / Alaska Native population 15 years and over
Males 27.0% Never married55.8% Now married4.3% Separated3.2% Widowed9.7% DivorcedFemales 35.9% Never married50.1% Now married6.9% Separated3.8% Widowed3.3% DivorcedWomen who gave birth in the past 12 months Now married:
83.3% (65)Unmarried:
16.7% (13)
Women who did not give birth in the past 12 months Now married:
48.8% (860)Unmarried:
51.2% (902)
Marital status - Asian population 15 years and over
Males 26.2% Never married64.9% Now married0.0% Separated1.2% Widowed7.6% DivorcedFemales 27.8% Never married50.6% Now married4.3% Separated6.0% Widowed11.2% DivorcedWomen who gave birth in the past 12 months Now married:
100.0% (241)Unmarried:
0.0% (0)
Women who did not give birth in the past 12 months Now married:
46.7% (1,513)Unmarried:
53.3% (1,729)
Marital status - Native Hawaiian / Pacific Islander population 15 years and over
Males 39.9% Never married60.1% Now married0.0% Separated0.0% Widowed0.0% DivorcedFemales 11.8% Never married64.9% Now married0.0% Separated16.7% Widowed6.6% DivorcedWomen who gave birth in the past 12 months Now married:
100.0% (85)Unmarried:
0.0% (0)
Women who did not give birth in the past 12 months Now married:
74.6% (178)Unmarried:
25.4% (61)
Marital status - Other race population 15 years and over
Males 39.9% Never married44.9% Now married2.8% Separated1.9% Widowed10.4% DivorcedFemales 34.4% Never married42.2% Now married3.2% Separated8.5% Widowed11.7% DivorcedWomen who gave birth in the past 12 months Now married:
58.3% (1,076)Unmarried:
41.7% (771)
Women who did not give birth in the past 12 months Now married:
40.6% (10,221)Unmarried:
59.4% (14,973)
Marital status - Two or more races population 15 years and over
Males 41.0% Never married45.8% Now married2.6% Separated2.5% Widowed8.1% DivorcedFemales 36.6% Never married40.3% Now married3.2% Separated8.2% Widowed11.7% DivorcedWomen who gave birth in the past 12 months Now married:
69.6% (3,347)Unmarried:
30.4% (1,463)
Women who did not give birth in the past 12 months Now married:
36.5% (28,028)Unmarried:
63.5% (48,855)
Marital status - White alone, not Hispanic / Latino population 15 years and over
Males 23.9% Never married56.7% Now married2.5% Separated1.9% Widowed14.9% DivorcedFemales 18.8% Never married53.0% Now married1.5% Separated11.7% Widowed14.9% DivorcedWomen who gave birth in the past 12 months Now married:
91.7% (604)Unmarried:
8.3% (55)
Women who did not give birth in the past 12 months Now married:
59.7% (8,861)Unmarried:
40.3% (5,977)
Marital status - Hispanic or Latino population 15 years and over
Males 42.3% Never married44.1% Now married2.7% Separated2.4% Widowed8.6% DivorcedFemales 36.2% Never married40.0% Now married3.2% Separated8.5% Widowed12.1% DivorcedWomen who gave birth in the past 12 months Now married:
68.6% (5,413)Unmarried:
31.4% (2,474)
Women who did not give birth in the past 12 months Now married:
36.6% (47,725)Unmarried:
63.4% (82,760)
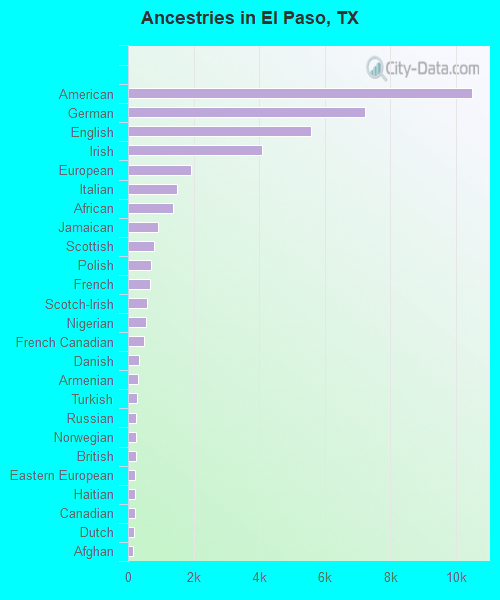
Ancestries in El Paso
10,494 2.1% American7,224 1.5% German5,585 1.1% English4,082 0.8% Irish1,938 0.4% European1,510 0.3% Italian1,371 0.3% African927 0.2% Jamaican784 0.2% Scottish701 0.1% Polish664 0.1% French565 0.1% Scotch-Irish541 0.1% Nigerian493 0.10% French Canadian346 0.07% Danish296 0.06% Armenian285 0.06% Turkish253 0.05% Russian236 0.05% Norwegian236 0.05% British205 0.04% Eastern European203 0.04% Haitian203 0.04% Canadian188 0.04% Dutch158 0.03% Afghan151 0.03% Ghanaian143 0.03% Finnish138 0.03% Austrian135 0.03% Lebanese131 0.03% Welsh124 0.03% Iranian124 0.03% Senegalese120 0.02% Portuguese113 0.02% Czech111 0.02% Greek109 0.02% Northern European98 0.02% Syrian98 0.02% Hungarian96 0.02% Scandinavian88 0.02% Swedish85 0.02% Ethiopian83 0.02% Czechoslovakian68 0.01% Cajun66 0.01% Yugoslavian66 0.01% West Indian61 0.01% Brazilian58 0.01% Moroccan57 0.01% Jordanian53 0.01% Basque50 0.01% Trinidadian and Tobagonian45 0.01% Egyptian45 0.01% Barbadian42 0.01% Ukrainian39 0.01% Swiss35 0.01% Ugandan33 0.01% Lithuanian26 0.01% Slovene
Geographical mobility in El Paso Same house 1 year ago 160,403 85.6% White (Caucasian)23,174 81.9% Black or African American4,913 81.7% American Indian / Alaska Native9,390 79.4% Asian1,314 90.5% Native Hawaiian / Pacific Islander97,487 87.2% Other race288,833 89.8% Two or more races62,862 82.2% White alone, not Hispanic / Latino484,661 89.0% Hispanic or LatinoMoved within same county 15,954 8.5% White / Caucasian2,774 9.8% Black or African American805 13.4% American Indian / Alaska Native1,577 13.3% Asian50 3.5% Native Hawaiian / Pacific Islander9,705 8.7% Other race25,901 8.1% Two or more races6,045 7.9% White alone, not Hispanic / Latino45,259 8.3% Hispanic or LatinoMoved within same state 1,528 0.8% White / Caucasian288 1.0% Black or African American16 0.3% American Indian / Alaska Native345 2.9% Asian469 0.4% Other race1,786 0.6% Two or more races477 0.6% White alone, not Hispanic / Latino3,123 0.6% Hispanic or LatinoMoved from different state 7,622 4.1% White / Caucasian1,900 6.7% Black or African American277 4.6% American Indian / Alaska Native247 2.1% Asian3,144 2.8% Other race3,329 1.0% Two or more races5,757 7.5% White alone, not Hispanic / Latino8,015 1.5% Hispanic or LatinoMoved from abroad 1,869 1.0% White159 0.6% Black or African American476 4.0% Asian967 0.9% Other race1,786 0.6% Two or more races1,316 1.7% White alone, not Hispanic / Latino3,306 0.6% Hispanic or Latino
Children Nativity (place of birth) in El Paso
Children under 6 years - Living with two parents Both parents native 20,278 100.0% NativeBoth parents foreign-born 4,670 91.1% Native455 8.9% Foreign-bornOne native, one foreign-born parent 5,981 100.0% NativeChildren under 6 years - Living with one parent Native parent 15,858 99.0% Native153 1.0% Foreign-bornForeign-born parent 4,276 94.8% Native234 5.2% Foreign-bornChildren 6 to 17 years - Living with two parents Both parents native 32,642 99.4% Native209 0.6% Foreign-bornBoth parents foreign-born 13,470 88.8% Native1,696 11.2% Foreign-bornOne native, one foreign-born parent 14,684 95.2% Native734 4.8% Foreign-bornChildren 6 to 17 years - Living with one parent Native parent 34,747 100.0% NativeForeign-born parent 12,018 51.3% Native11,399 48.7% Foreign-born
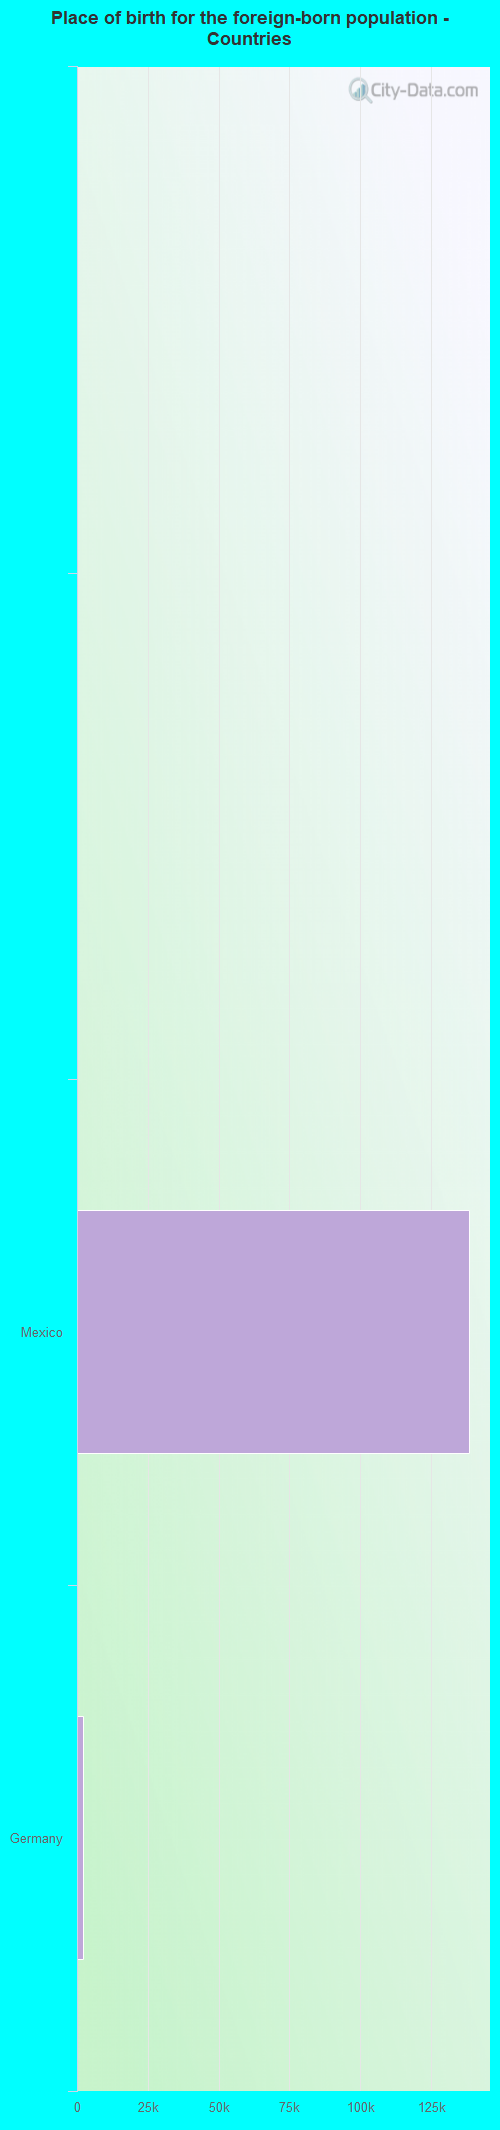
Place of birth for residents in El Paso 145,271 Americas144,594 Latin America141,364 Central America6,789 Asia3,967 Europe2,828 Western Europe2,458 Africa2,349 Eastern Asia2,230 South Eastern Asia1,617 South America1,612 Caribbean1,484 South Central Asia1,301 Western Africa1,016 China725 Western Asia676 Northern America404 Eastern Europe380 Northern Europe345 Southern Europe340 Middle Africa303 Oceania235 Eastern Africa86 Northern Africa69 Australia and New Zealand Subregion34 Southern Africa138,522 Mexico2,264 Germany1,126 Philippines1,057 Korea897 India808 Costa Rica722 Guatemala711 China674 Vietnam639 Nigeria615 El Salvador604 Canada572 Jamaica476 Colombia443 France438 Dominican Republic334 Honduras303 Cameroon294 Cuba275 Peru275 Japan262 Ivory Coast251 Panama232 Argentina224 Turkey221 Taiwan202 Ghana178 Russia175 Italy175 Ecuador150 Malaysia148 Iran136 Spain134 Jordan133 United Kingdom120 Bolivia120 Venezuela119 Afghanistan116 England112 Ethiopia96 Togo94 Chile91 Nicaragua89 Poland88 Thailand88 Nepal84 Brazil83 Burma (Myanmar)82 Micronesia82 Hong Kong76 Lebanon71 Haiti70 Pakistan69 Bhutan65 Iraq65 Ireland65 Fiji61 Egypt60 Belgium59 Trinidad and Tobago58 Indonesia58 Armenia56 Kenya55 Scotland46 Australia42 Austria42 Barbados42 Syria40 Uzbekistan40 Kuwait40 Hungary38 United Arab Emirates37 Congo36 Bangladesh34 Czechoslovakia34 South Africa33 Eritrea30 Cambodia27 Saudi Arabia26 Ukraine25 Uganda25 West Indies24 Liberia22 New Zealand21 Morocco20 Croatia19 St. Lucia18 Singapore18 Uruguay17 Belize17 Portugal17 Netherlands16 Senegal15 Greece14 Sri Lanka9 Israel9 Denmark7 Yemen4 St. Vincent and the Grenadines3 Algeria
Grandparents responsible for own grandchildren in El Paso
Grandparents (30 to 59 years) White / Caucasian 650 28.2% Responsible for grandchildren1,651 71.8% Not responsible for grandchildrenBlack or African American 33 23.3% Responsible for grandchildren109 76.7% Not responsible for grandchildrenAmerican Indian / Alaska Native 4 9.9% Responsible for grandchildren34 90.1% Not responsible for grandchildrenAsian 3 100.0% Not responsible for grandchildrenOther race 606 31.1% Responsible for grandchildren1,345 68.9% Not responsible for grandchildrenTwo or more races 784 26.2% Responsible for grandchildren2,211 73.8% Not responsible for grandchildrenWhite alone, not Hispanic / Latino 469 33.2% Responsible for grandchildren943 66.8% Not responsible for grandchildrenHispanic or Latino 1,571 27.8% Responsible for grandchildren4,074 72.2% Not responsible for grandchildrenGrandparents (60 years and over) White / Caucasian 1,171 47.8% Responsible for grandchildren1,281 52.2% Not responsible for grandchildrenBlack or African American 113 81.0% Responsible for grandchildren27 19.0% Not responsible for grandchildrenAmerican Indian / Alaska Native 105 100.0% Not responsible for grandchildrenAsian 6 4.3% Responsible for grandchildren137 95.7% Not responsible for grandchildrenOther race 537 22.0% Responsible for grandchildren1,904 78.0% Not responsible for grandchildrenTwo or more races 1,951 28.9% Responsible for grandchildren4,799 71.1% Not responsible for grandchildrenWhite alone, not Hispanic / Latino 599 71.0% Responsible for grandchildren245 29.0% Not responsible for grandchildrenHispanic or Latino 3,166 29.0% Responsible for grandchildren7,739 71.0% Not responsible for grandchildren
Zip codes: 79901 , 79902 , 79903 , 79904 , 79905 , 79906 , 79907 , 79908 , 79911 , 79912 , 79915 , 79920 , 79922 , 79924 , 79925 , 79927 , 79930 , 79934 , 79935 , 79936 .