Races in Euclid, Ohio (OH) Detailed Stats
Data:
Races - White alone (%)
Races - White alone (% change since 2000)
Races - Black alone (%)
Races - Black alone (% change since 2000)
Races - American Indian alone (%)
Races - American Indian alone (% change since 2000)
Races - Asian alone (%)
Races - Asian alone (% change since 2000)
Races - Hispanic (%)
Races - Hispanic (% change since 2000)
Races - Native Hawaiian and Other Pacific Islander alone (%)
Races - Native Hawaiian and Other Pacific Islander alone (% change since 2000)
Races - Two or more races(%)
Races - Two or more races(% change since 2000)
Races - Other race alone (%)
Races - Other race alone (% change since 2000)
Racial diversity
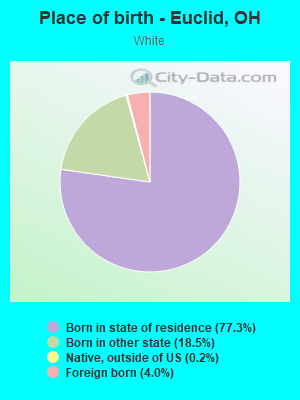
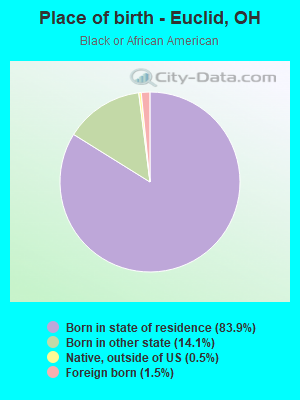
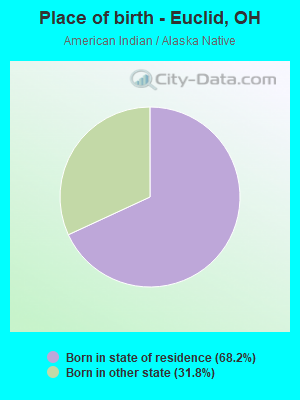
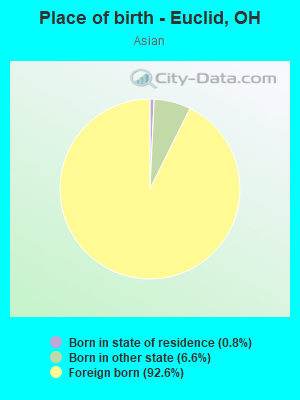
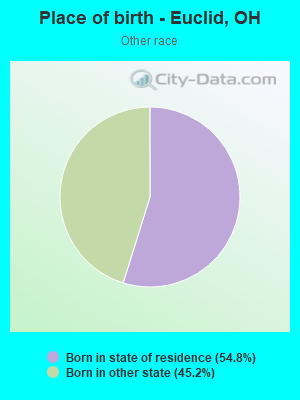
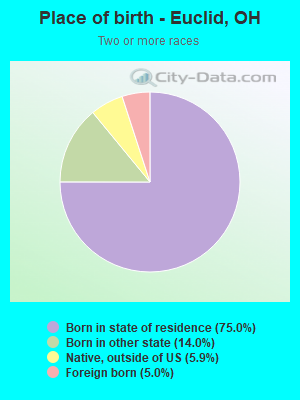
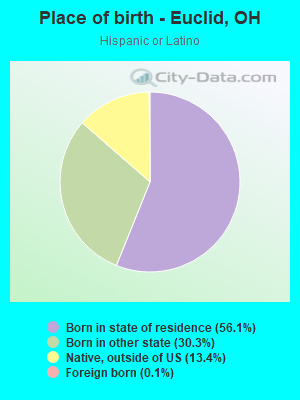
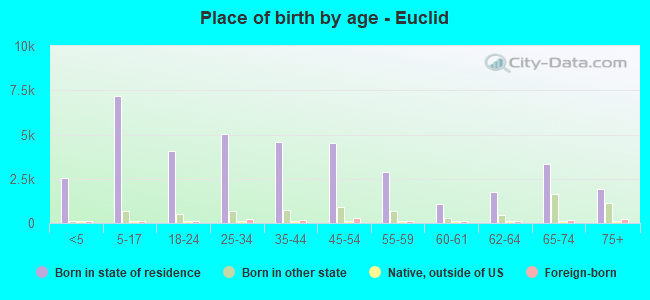
Place of birth - Born in state of residence (%)
Place of birth - Born in state of residence (%) - White
Place of birth - Born in state of residence (%) - Black or African American
Place of birth - Born in state of residence (%) - Asian
Place of birth - Born in state of residence (%) - Hispanic or Latino
Place of birth - Born in state of residence (%) - American Indian and Alaska Native
Place of birth - Born in state of residence (%) - Multirace
Place of birth - Born in state of residence (%) - Other Race
Place of birth - Born in other state (%)
Place of birth - Born in other state (%) - White
Place of birth - Born in other state (%) - Black or African American
Place of birth - Born in other state (%) - Asian
Place of birth - Born in other state (%) - Hispanic or Latino
Place of birth - Born in other state (%) - American Indian and Alaska Native
Place of birth - Born in other state (%) - Multirace
Place of birth - Born in other state (%) - Other Race
Place of birth - Native, outside of US (%)
Place of birth - Native, outside of US (%) - White
Place of birth - Native, outside of US (%) - Black or African American
Place of birth - Native, outside of US (%) - Asian
Place of birth - Native, outside of US (%) - Hispanic or Latino
Place of birth - Native, outside of US (%) - American Indian and Alaska Native
Place of birth - Native, outside of US (%) - Multirace
Place of birth - Native, outside of US (%) - Other Race
Place of birth - Foreign born (%)
Place of birth - Foreign born (%) - White
Place of birth - Foreign born (%) - Black or African American
Place of birth - Foreign born (%) - Asian
Place of birth - Foreign born (%) - Hispanic or Latino
Place of birth - Foreign born (%) - American Indian and Alaska Native
Place of birth - Foreign born (%) - Multirace
Place of birth - Foreign born (%) - Other Race
Residents speaking English at home (%)
Residents speaking English at home - Born in the United States (%)
Residents speaking English at home - Native, born elsewhere (%)
Residents speaking English at home - Foreign born (%)
Residents speaking Spanish at home (%)
Residents speaking Spanish at home - Born in the United States (%)
Residents speaking Spanish at home - Native, born elsewhere (%)
Residents speaking Spanish at home - Foreign born (%)
Residents speaking other language at home (%)
Residents speaking other language at home - Born in the United States (%)
Residents speaking other language at home - Native, born elsewhere (%)
Residents speaking other language at home - Foreign born (%)
Marital status - Never married (%)
Marital status - Now married (%)
Marital status - Separated (%)
Marital status - Widowed (%)
Marital status - Divorced (%)
Ancestries Reported - Arab (%)
Ancestries Reported - Czech (%)
Ancestries Reported - Danish (%)
Ancestries Reported - Dutch (%)
Ancestries Reported - English (%)
Ancestries Reported - French (%)
Ancestries Reported - French Canadian (%)
Ancestries Reported - German (%)
Ancestries Reported - Greek (%)
Ancestries Reported - Hungarian (%)
Ancestries Reported - Irish (%)
Ancestries Reported - Italian (%)
Ancestries Reported - Lithuanian (%)
Ancestries Reported - Norwegian (%)
Ancestries Reported - Polish (%)
Ancestries Reported - Portuguese (%)
Ancestries Reported - Russian (%)
Ancestries Reported - Scotch-Irish (%)
Ancestries Reported - Scottish (%)
Ancestries Reported - Slovak (%)
Ancestries Reported - Subsaharan African (%)
Ancestries Reported - Swedish (%)
Ancestries Reported - Swiss (%)
Ancestries Reported - Ukrainian (%)
Ancestries Reported - United States (%)
Ancestries Reported - Welsh (%)
Ancestries Reported - West Indian (%)
Ancestries Reported - Other (%)
Geographical mobility - Same house 1 year ago (%)
Geographical mobility - Same house 1 year ago (%) - White
Geographical mobility - Same house 1 year ago (%) - Black or African American
Geographical mobility - Same house 1 year ago (%) - Asian
Geographical mobility - Same house 1 year ago (%) - Hispanic or Latino
Geographical mobility - Same house 1 year ago (%) - American Indian and Alaska Native
Geographical mobility - Same house 1 year ago (%) - Multirace
Geographical mobility - Same house 1 year ago (%) - Other Race
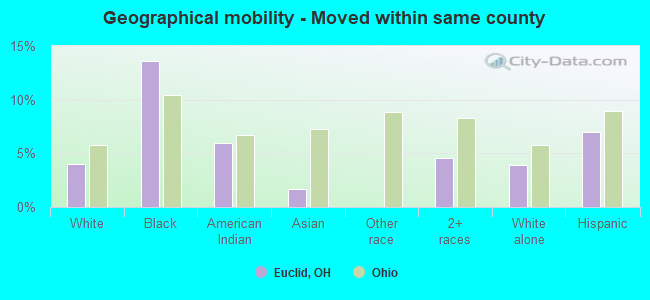
Geographical mobility - Moved within same county (%)
Geographical mobility - Moved within same county (%) - White
Geographical mobility - Moved within same county (%) - Black or African American
Geographical mobility - Moved within same county (%) - Asian
Geographical mobility - Moved within same county (%) - Hispanic or Latino
Geographical mobility - Moved within same county (%) - American Indian and Alaska Native
Geographical mobility - Moved within same county (%) - Multirace
Geographical mobility - Moved within same county (%) - Other Race
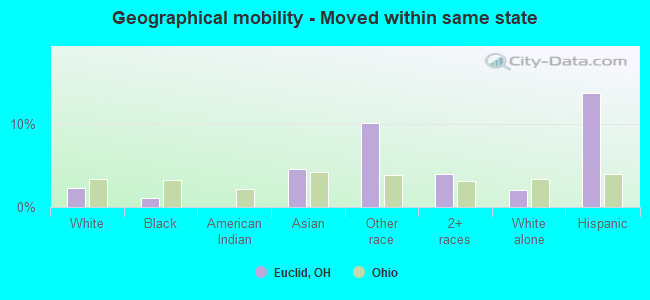
Geographical mobility - Moved from different county within same state (%)
Geographical mobility - Moved from different county within same state (%) - White
Geographical mobility - Moved from different county within same state (%) - Black or African American
Geographical mobility - Moved from different county within same state (%) - Asian
Geographical mobility - Moved from different county within same state (%) - Hispanic or Latino
Geographical mobility - Moved from different county within same state (%) - American Indian and Alaska Native
Geographical mobility - Moved from different county within same state (%) - Multirace
Geographical mobility - Moved from different county within same state (%) - Other Race
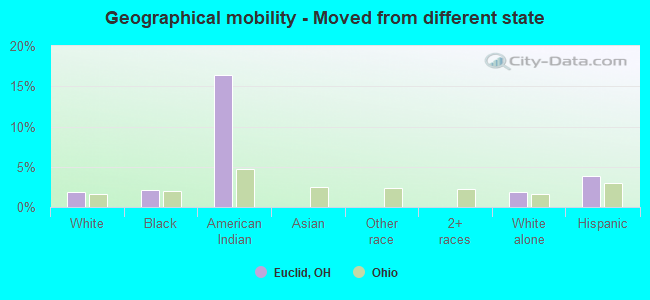
Geographical mobility - Moved from different state (%)
Geographical mobility - Moved from different state (%) - White
Geographical mobility - Moved from different state (%) - Black or African American
Geographical mobility - Moved from different state (%) - Asian
Geographical mobility - Moved from different state (%) - Hispanic or Latino
Geographical mobility - Moved from different state (%) - American Indian and Alaska Native
Geographical mobility - Moved from different state (%) - Multirace
Geographical mobility - Moved from different state (%) - Other Race
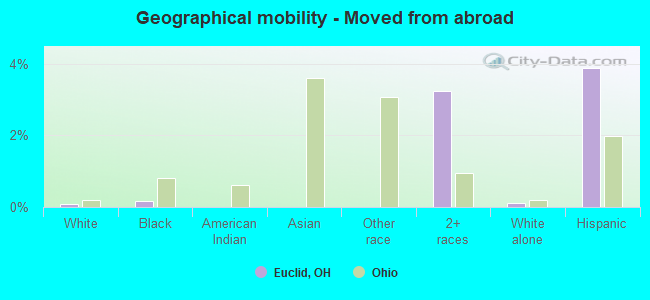
Geographical mobility - Moved from abroad (%)
Geographical mobility - Moved from abroad (%) - White
Geographical mobility - Moved from abroad (%) - Black or African American
Geographical mobility - Moved from abroad (%) - Asian
Geographical mobility - Moved from abroad (%) - Hispanic or Latino
Geographical mobility - Moved from abroad (%) - American Indian and Alaska Native
Geographical mobility - Moved from abroad (%) - Multirace
Geographical mobility - Moved from abroad (%) - Other Race
Place of birth for the foreign-born population - Ireland (%)
Place of birth for the foreign-born population - Denmark (%)
Place of birth for the foreign-born population - Norway (%)
Place of birth for the foreign-born population - Sweden (%)
Place of birth for the foreign-born population - United Kingdom (%)
Place of birth for the foreign-born population - England (%)
Place of birth for the foreign-born population - Scotland (%)
Place of birth for the foreign-born population - Other Northern Europe (%)
Place of birth for the foreign-born population - Austria (%)
Place of birth for the foreign-born population - Belgium (%)
Place of birth for the foreign-born population - France (%)
Place of birth for the foreign-born population - Germany (%)
Place of birth for the foreign-born population - Netherlands (%)
Place of birth for the foreign-born population - Switzerland (%)
Place of birth for the foreign-born population - Other Western Europe (%)
Place of birth for the foreign-born population - Greece (%)
Place of birth for the foreign-born population - Italy (%)
Place of birth for the foreign-born population - Portugal (%)
Place of birth for the foreign-born population - Spain (%)
Place of birth for the foreign-born population - Other Southern Europe (%)
Place of birth for the foreign-born population - Albania (%)
Place of birth for the foreign-born population - Belarus (%)
Place of birth for the foreign-born population - Bosnia and Herzegovina (%)
Place of birth for the foreign-born population - Bulgaria (%)
Place of birth for the foreign-born population - Croatia (%)
Place of birth for the foreign-born population - Czechoslovakia (%)
Place of birth for the foreign-born population - Hungary (%)
Place of birth for the foreign-born population - Latvia (%)
Place of birth for the foreign-born population - Lithuania (%)
Place of birth for the foreign-born population - North Macedonia (Macedonia) (%)
Place of birth for the foreign-born population - Moldova (%)
Place of birth for the foreign-born population - Poland (%)
Place of birth for the foreign-born population - Romania (%)
Place of birth for the foreign-born population - Russia (%)
Place of birth for the foreign-born population - Serbia (%)
Place of birth for the foreign-born population - Ukraine (%)
Place of birth for the foreign-born population - Other Eastern Europe (%)
Place of birth for the foreign-born population - China (%)
Place of birth for the foreign-born population - Hong Kong (%)
Place of birth for the foreign-born population - Taiwan (%)
Place of birth for the foreign-born population - Japan (%)
Place of birth for the foreign-born population - Korea (%)
Place of birth for the foreign-born population - Other Eastern Asia (%)
Place of birth for the foreign-born population - Afghanistan (%)
Place of birth for the foreign-born population - Bangladesh (%)
Place of birth for the foreign-born population - India (%)
Place of birth for the foreign-born population - Iran (%)
Place of birth for the foreign-born population - Kazakhstan (%)
Place of birth for the foreign-born population - Nepal (%)
Place of birth for the foreign-born population - Pakistan (%)
Place of birth for the foreign-born population - Sri Lanka (%)
Place of birth for the foreign-born population - Uzbekistan (%)
Place of birth for the foreign-born population - Other South Central Asia (%)
Place of birth for the foreign-born population - Burma (%)
Place of birth for the foreign-born population - Cambodia (%)
Place of birth for the foreign-born population - Indonesia (%)
Place of birth for the foreign-born population - Laos (%)
Place of birth for the foreign-born population - Malaysia (%)
Place of birth for the foreign-born population - Philippines (%)
Place of birth for the foreign-born population - Singapore (%)
Place of birth for the foreign-born population - Thailand (%)
Place of birth for the foreign-born population - Vietnam (%)
Place of birth for the foreign-born population - Other South Eastern Asia (%)
Place of birth for the foreign-born population - Armenia (%)
Place of birth for the foreign-born population - Iraq (%)
Place of birth for the foreign-born population - Israel (%)
Place of birth for the foreign-born population - Jordan (%)
Place of birth for the foreign-born population - Kuwait (%)
Place of birth for the foreign-born population - Lebanon (%)
Place of birth for the foreign-born population - Saudi Arabia (%)
Place of birth for the foreign-born population - Syria (%)
Place of birth for the foreign-born population - Turkey (%)
Place of birth for the foreign-born population - Yemen (%)
Place of birth for the foreign-born population - Other Western Asia (%)
Place of birth for the foreign-born population - Eritrea (%)
Place of birth for the foreign-born population - Ethiopia (%)
Place of birth for the foreign-born population - Kenya (%)
Place of birth for the foreign-born population - Somalia (%)
Place of birth for the foreign-born population - Uganda (%)
Place of birth for the foreign-born population - Zimbabwe (%)
Place of birth for the foreign-born population - Other Eastern Africa (%)
Place of birth for the foreign-born population - Cameroon (%)
Place of birth for the foreign-born population - Congo (%)
Place of birth for the foreign-born population - Democratic Republic of Congo (Zaire) (%)
Place of birth for the foreign-born population - Other Middle Africa (%)
Place of birth for the foreign-born population - Egypt (%)
Place of birth for the foreign-born population - Morocco (%)
Place of birth for the foreign-born population - Sudan (%)
Place of birth for the foreign-born population - Other Northern Africa (%)
Place of birth for the foreign-born population - South Africa (%)
Place of birth for the foreign-born population - Other Southern Africa (%)
Place of birth for the foreign-born population - Cabo Verde (%)
Place of birth for the foreign-born population - Ghana (%)
Place of birth for the foreign-born population - Liberia (%)
Place of birth for the foreign-born population - Nigeria (%)
Place of birth for the foreign-born population - Senegal (%)
Place of birth for the foreign-born population - Sierra Leone (%)
Place of birth for the foreign-born population - Other Western Africa (%)
Place of birth for the foreign-born population - Australia (%)
Place of birth for the foreign-born population - New Zealand (%)
Place of birth for the foreign-born population - Fiji (%)
Place of birth for the foreign-born population - Micronesia (%)
Place of birth for the foreign-born population - Bahamas (%)
Place of birth for the foreign-born population - Barbados (%)
Place of birth for the foreign-born population - Cuba (%)
Place of birth for the foreign-born population - Dominica (%)
Place of birth for the foreign-born population - Dominican Republic (%)
Place of birth for the foreign-born population - Grenada (%)
Place of birth for the foreign-born population - Haiti (%)
Place of birth for the foreign-born population - Jamaica (%)
Place of birth for the foreign-born population - St. Vincent and the Grenadines (%)
Place of birth for the foreign-born population - Trinidad and Tobago (%)
Place of birth for the foreign-born population - West Indies (%)
Place of birth for the foreign-born population - Other Caribbean (%)
Place of birth for the foreign-born population - Belize (%)
Place of birth for the foreign-born population - Costa Rica (%)
Place of birth for the foreign-born population - El Salvador (%)
Place of birth for the foreign-born population - Guatemala (%)
Place of birth for the foreign-born population - Honduras (%)
Place of birth for the foreign-born population - Mexico (%)
Place of birth for the foreign-born population - Nicaragua (%)
Place of birth for the foreign-born population - Panama (%)
Place of birth for the foreign-born population - Other Central America (%)
Place of birth for the foreign-born population - Argentina (%)
Place of birth for the foreign-born population - Bolivia (%)
Place of birth for the foreign-born population - Brazil (%)
Place of birth for the foreign-born population - Chile (%)
Place of birth for the foreign-born population - Colombia (%)
Place of birth for the foreign-born population - Ecuador (%)
Place of birth for the foreign-born population - Guyana (%)
Place of birth for the foreign-born population - Peru (%)
Place of birth for the foreign-born population - Uruguay (%)
Place of birth for the foreign-born population - Venezuela (%)
Place of birth for the foreign-born population - Other South America (%)
Place of birth for the foreign-born population - Canada (%)
Place of birth for the foreign-born population - Other Northern America (%)
Place of birth for the foreign-born population - Other (%)
Latest news about races in Euclid, OH collected exclusively by city-data.com from local newspapers, TV, and radio stations
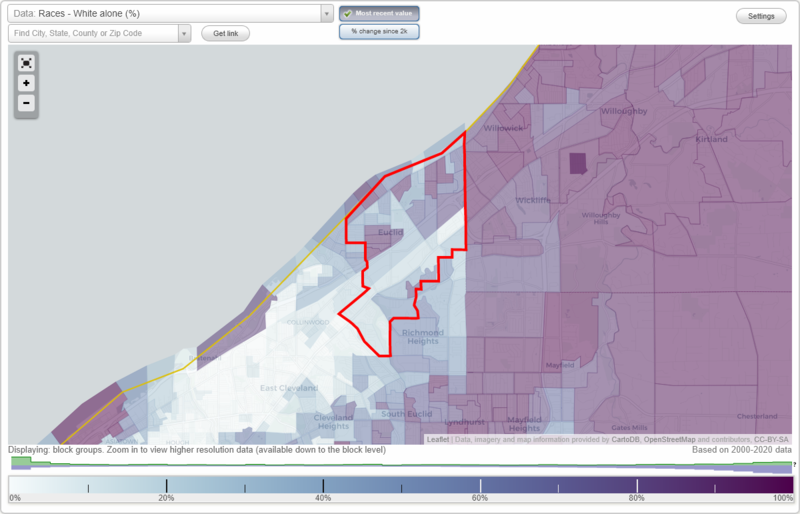
According to 2022 data, the most numerous races in Euclid, OH are White alone (13,455 residents), Black alone (32,133 residents), and Two or more races (1,609 residents). 94.4% of Euclid residents speak English at home. 2.8% of Euclid, OH residents are foreign-born (1.1% born in Europe, 0.7% born in Asia, 0.6% born in Africa), which is 43.8% less than the foreign-born rate of 4.0% across the entire state of Ohio.
Race distribution in Euclid
2000 2022
9,538,111 84.0% White alone 1,290,662 11.4% Black alone 217,123 1.9% Hispanic 137,770 1.2% Two or more races 131,670 1.2% Asian alone 21,985 0.2% American Indian alone 13,483 0.1% Other race alone 2,336 0.02% Native Hawaiian and Other
8,948,793 76.1% White alone 1,401,403 11.9% Black alone 529,291 4.5% Two or more races 517,232 4.4% Hispanic 293,387 2.5% Asian alone 52,805 0.4% Other race alone 9,785 0.08% American Indian alone 3,362 0.03% Native Hawaiian and Other
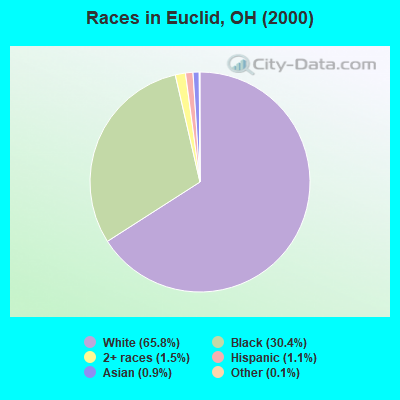
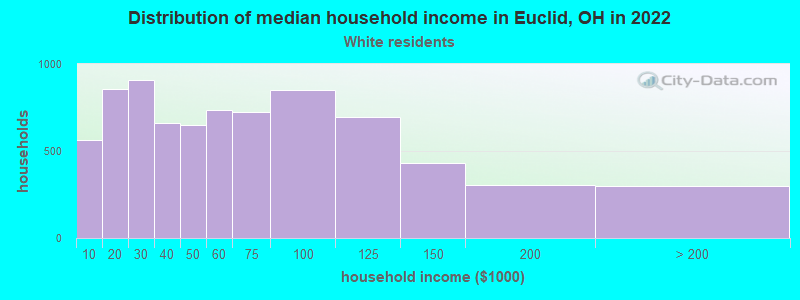
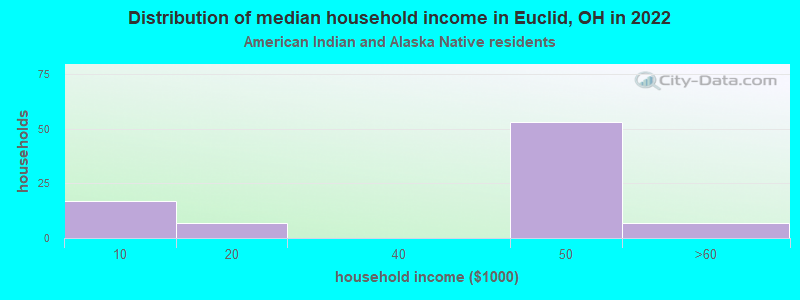
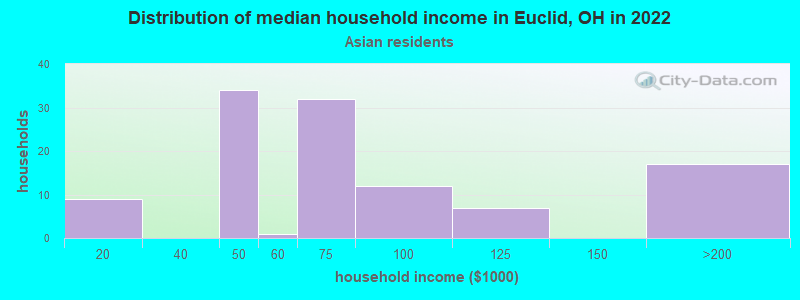
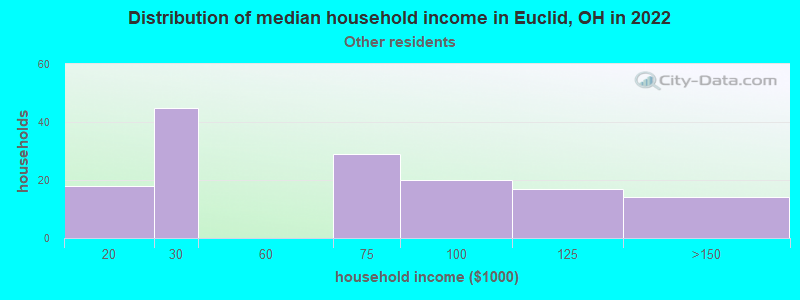
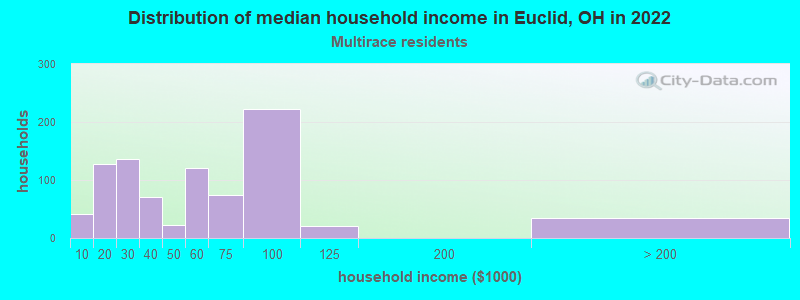
Income and house value in Euclid Median household income in 2022 $52,136 White non-Hispanic householders$44,001 Black householders$41,606 American Indian and Alaska Native householders$68,476 Asian householders$50,256 Two or more races householdersMedian 2022 house value $116,016 White Non-Hispanic householders$119,349 Black or African American householders $129,092 Asian householders$139,604 Some other race householders$112,555 Two or more races householders$107,427 Hispanic or Latino householders
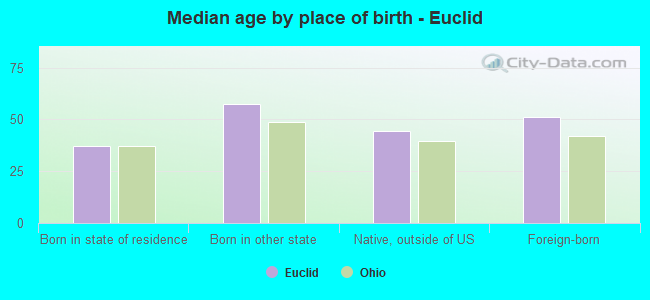
Median age by race in Euclid
57.3 Median age for White residents54.3 59.8 33.4 Median age for Black or African American residents31.5 36.0 42.1 Median age for American Indian / Alaska Native residents32.4 -499,999,999.5 53.4 Median age for Asian residents50.5 53.2 -706,093,189.3 Median age for Native Hawaiian / Pacific Islander residents-750,242,953.6 -805,394,989.6 27.8 Median age for Other race residents25.6 27.4 28.8 Median age for Two or more races residents24.4 31.1 57.1 Median age for White alone residents54.5 59.5 24.2 Median age for Hispanic or Latino residents26.9 22.7
Owner/renter occupied households by race in Euclid
House owners and renters - White residents 5,740 74.6% Owner occupied1,958 25.4% Renter occupiedHouse owners and renters - Black or African American residents 4,018 29.2% Owner occupied9,723 70.8% Renter occupiedHouse owners and renters - American Indian / Alaska Native residents 26 64.8% Owner occupied14 35.2% Renter occupiedHouse owners and renters - Asian residents 88 79.9% Owner occupied22 20.1% Renter occupiedHouse owners and renters - Other race residents 131 84.8% Owner occupied23 15.2% Renter occupiedHouse owners and renters - Two or more races residents 260 29.2% Owner occupied629 70.8% Renter occupiedHouse owners and renters - White alone residents 5,686 74.4% Owner occupied1,959 25.6% Renter occupiedHouse owners and renters - Hispanic or Latino residents 189 53.6% Owner occupied164 46.4% Renter occupied
Language usage in Euclid
English speakers - Total 94.4% of residents of Euclid speak English at home.
1.9% of residents speak Spanish at home 692 80.0% Speak English very well173 20.0% Speak English less than very well3.6% of residents speak other language at home 1,228 74.8% Speak English very well413 25.2% Speak English less than very well
English speakers - Born in the United States 95.4% of residents of Euclid speak English at home.
2.5% of residents speak Spanish at home 162 85.3% Speak English very well28 14.7% Speak English less than very well1.3% of residents speak other language at home 71 71.0% Speak English very well29 29.0% Speak English less than very well
English speakers - Native, born elsewhere 52.9% of residents of Euclid speak English at home.
27.0% of residents speak Spanish at home 63 84.0% Speak English very well12 16.0% Speak English less than very well14.0% of residents speak other language at home 39 100.0% Speak English very well
English speakers - Foreign-born 25.3% of residents of Euclid speak English at home.
0.1% of residents speak Spanish at home 1 100.0% Speak English less than very well73.7% of residents speak other language at home 643 67.3% Speak English very well312 32.7% Speak English less than very well
White (Caucasian) - Speak only English Native:
96.8% (12,205)Foreign-born:
28.4% (155)
White (Caucasian) - Speak another language Native:
3.4% (425)Foreign-born:
71.8% (392)
Black or African American - Speak only English Native:
98.0% (28,755)Foreign-born:
17.4% (86)
Black or African American - Speak another language Native:
1.9% (552)Foreign-born:
86.2% (426)
Asian - Speak only English Native:
58.9% (10)Foreign-born:
8.4% (20)
Asian - Speak another language Native:
39.7% (7)Foreign-born:
91.6% (216)
Two or more races - Speak only English Native:
87.7% (1,776)Foreign-born:
83.7% (89)
Two or more races - Speak another language Native:
10.1% (206)Foreign-born:
11.9% (13)
White alone - Speak only English Native:
96.5% (12,120)Foreign-born:
27.6% (157)
White alone - Speak another language Native:
3.5% (436)Foreign-born:
72.4% (413)
Hispanic or Latino - Speak another language Native:
30.4% (231)Foreign-born:
100.0% (1)
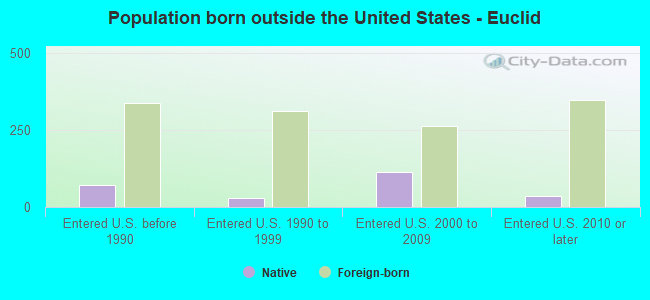
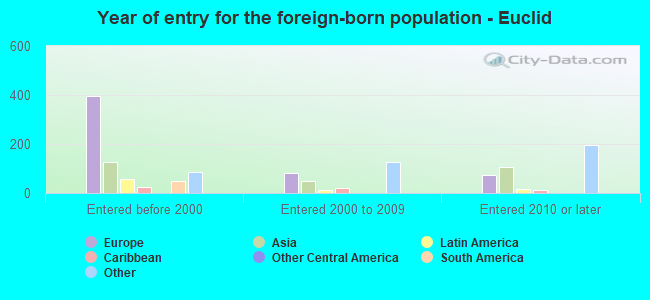
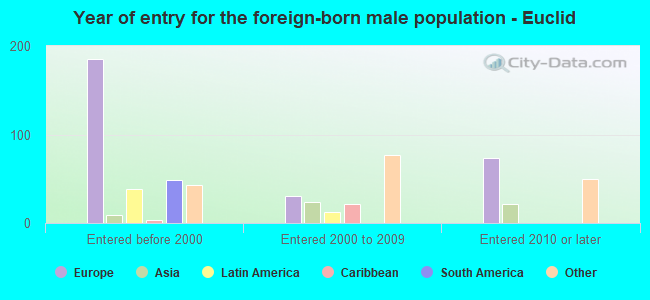
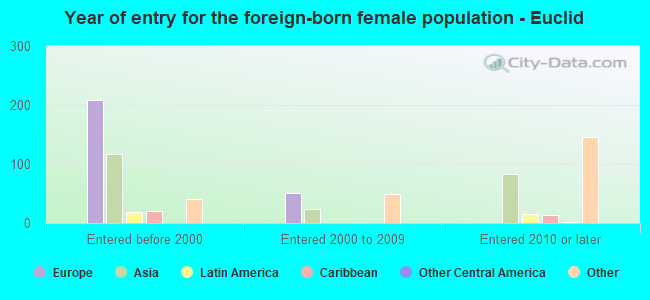
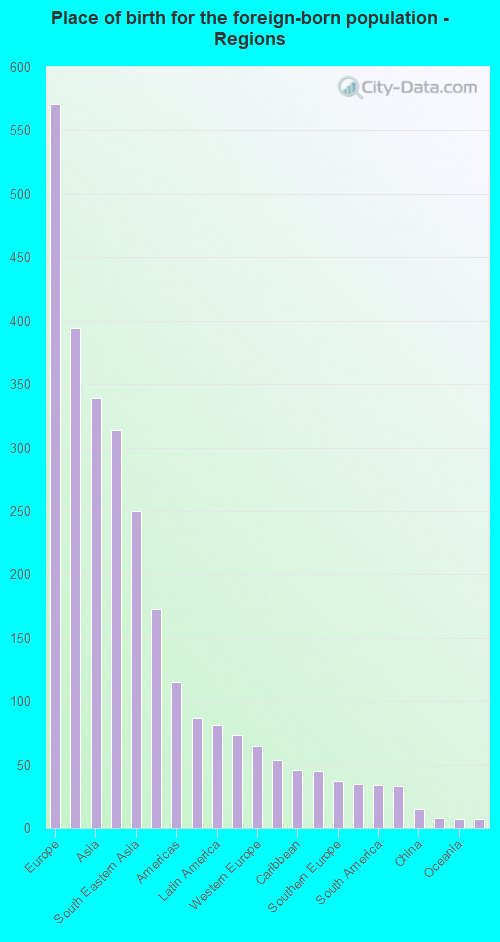
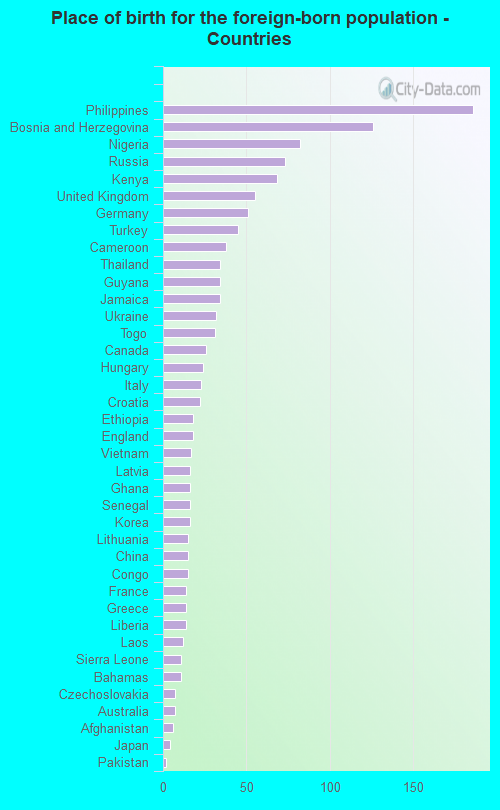
Foreign-born residents in Euclid 1,348 residents are foreign born (1.1% Europe , 0.7% Asia , 0.6% Africa ).
Marital status for residents in Euclid Marital status - White (Caucasian) population 15 years and over
Males 37.2% Never married41.7% Now married0.4% Separated2.1% Widowed18.5% DivorcedFemales 27.8% Never married35.2% Now married0.3% Separated16.6% Widowed20.2% DivorcedWomen who gave birth in the past 12 months Now married:
76.9% (38)Unmarried:
23.1% (11)
Women who did not give birth in the past 12 months Now married:
39.9% (728)Unmarried:
60.1% (1,097)
Marital status - Black or African American population 15 years and over
Males 56.9% Never married25.3% Now married2.1% Separated3.0% Widowed12.7% DivorcedFemales 56.1% Never married18.8% Now married5.4% Separated7.5% Widowed12.2% DivorcedWomen who gave birth in the past 12 months Now married:
29.5% (221)Unmarried:
70.5% (528)
Women who did not give birth in the past 12 months Now married:
19.8% (1,651)Unmarried:
80.2% (6,669)
Marital status - American Indian / Alaska Native population 15 years and over
Males 71.4% Never married28.6% Now married0.0% Separated0.0% Widowed0.0% DivorcedFemales 0.0% Never married0.0% Now married0.0% Separated0.0% Widowed100.0% DivorcedMarital status - Asian population 15 years and over
Males 27.0% Never married73.0% Now married0.0% Separated0.0% Widowed0.0% DivorcedFemales 17.5% Never married68.0% Now married0.0% Separated3.9% Widowed10.7% DivorcedWomen who gave birth in the past 12 months Now married:
100.0% (4)Unmarried:
0.0% (0)
Women who did not give birth in the past 12 months Now married:
25.4% (15)Unmarried:
74.6% (45)
Marital status - Other race population 15 years and over
Males 41.8% Never married43.9% Now married0.0% Separated0.0% Widowed14.3% DivorcedFemales 69.6% Never married11.6% Now married18.7% Separated0.0% Widowed0.0% DivorcedWomen who did not give birth in the past 12 months Now married:
16.0% (6)Unmarried:
84.0% (30)
Marital status - Two or more races population 15 years and over
Males 90.9% Never married3.7% Now married0.0% Separated0.0% Widowed5.4% DivorcedFemales 50.9% Never married9.3% Now married21.7% Separated9.9% Widowed8.2% DivorcedWomen who gave birth in the past 12 months Now married:
40.0% (7)Unmarried:
60.0% (11)
Women who did not give birth in the past 12 months Now married:
34.0% (220)Unmarried:
66.0% (427)
Marital status - White alone, not Hispanic / Latino population 15 years and over
Males 37.0% Never married41.4% Now married0.4% Separated2.2% Widowed19.0% DivorcedFemales 27.5% Never married35.4% Now married0.3% Separated16.5% Widowed20.3% DivorcedWomen who gave birth in the past 12 months Now married:
76.9% (39)Unmarried:
23.1% (12)
Women who did not give birth in the past 12 months Now married:
40.5% (737)Unmarried:
59.5% (1,083)
Marital status - Hispanic or Latino population 15 years and over
Males 61.1% Never married33.0% Now married0.0% Separated2.3% Widowed3.6% DivorcedFemales 73.2% Never married7.1% Now married0.0% Separated9.5% Widowed10.2% DivorcedWomen who did not give birth in the past 12 months Now married:
8.6% (17)Unmarried:
91.4% (177)
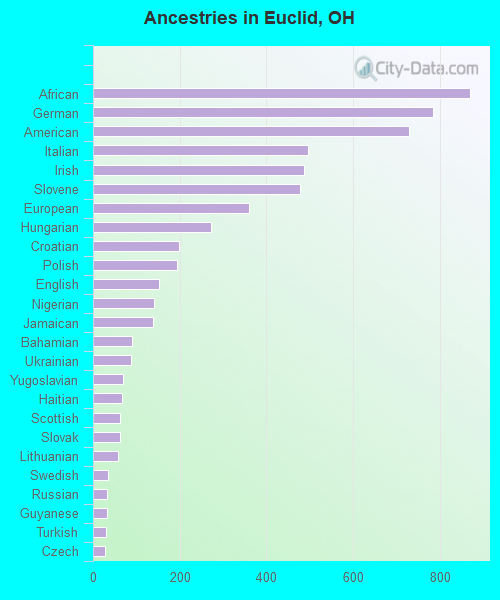
Ancestries in Euclid
870 2.8% African784 2.5% German729 2.4% American496 1.6% Italian487 1.6% Irish477 1.5% Slovene359 1.2% European272 0.9% Hungarian198 0.6% Croatian193 0.6% Polish153 0.5% English141 0.5% Nigerian138 0.4% Jamaican91 0.3% Bahamian87 0.3% Ukrainian70 0.2% Yugoslavian66 0.2% Haitian63 0.2% Scottish62 0.2% Slovak57 0.2% Lithuanian35 0.1% Swedish32 0.1% Russian32 0.1% Guyanese30 0.10% Turkish28 0.09% Czech26 0.08% French21 0.07% Dutch20 0.06% Northern European19 0.06% Scotch-Irish19 0.06% Welsh17 0.06% Senegalese14 0.05% Finnish14 0.05% Latvian13 0.04% Austrian13 0.04% Barbadian12 0.04% French Canadian10 0.03% Lebanese8 0.03% Slavic7 0.02% British7 0.02% Bermudan6 0.02% Czechoslovakian6 0.02% Eastern European6 0.02% Ethiopian4 0.01% Romanian3 0.01% Arab
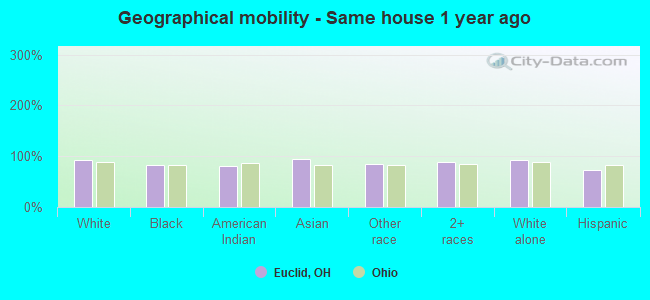
Geographical mobility in Euclid Same house 1 year ago 12,329 92.1% White (Caucasian)26,110 82.5% Black or African American58 80.7% American Indian / Alaska Native245 94.5% Asian342 85.1% Other race1,929 88.3% Two or more races12,324 92.1% White alone, not Hispanic / Latino584 72.7% Hispanic or LatinoMoved within same county 534 4.0% White / Caucasian4,310 13.6% Black or African American4 6.0% American Indian / Alaska Native4 1.7% Asian101 4.6% Two or more races530 4.0% White alone, not Hispanic / Latino56 6.9% Hispanic or LatinoMoved within same state 306 2.3% White / Caucasian329 1.0% Black or African American12 4.6% Asian41 10.2% Other race89 4.1% Two or more races271 2.0% White alone, not Hispanic / Latino111 13.8% Hispanic or LatinoMoved from different state 242 1.8% White / Caucasian661 2.1% Black or African American12 16.4% American Indian / Alaska Native256 1.9% White alone, not Hispanic / Latino31 3.8% Hispanic or LatinoMoved from abroad 10 0.1% White56 0.2% Black or African American71 3.2% Two or more races13 0.1% White alone, not Hispanic / Latino31 3.9% Hispanic or Latino
Children Nativity (place of birth) in Euclid
Children under 6 years - Living with two parents Both parents native 927 100.0% NativeBoth parents foreign-born 34 100.0% NativeOne native, one foreign-born parent 226 100.0% NativeChildren under 6 years - Living with one parent Native parent 2,035 100.0% NativeChildren 6 to 17 years - Living with two parents Both parents native 1,566 100.0% NativeBoth parents foreign-born 60 83.5% Native12 16.5% Foreign-bornOne native, one foreign-born parent 211 93.4% Native15 6.6% Foreign-bornChildren 6 to 17 years - Living with one parent Native parent 4,419 100.0% NativeForeign-born parent 19 53.9% Native16 46.1% Foreign-born
Grandparents responsible for own grandchildren in Euclid
Grandparents (30 to 59 years) White / Caucasian 23 59.7% Responsible for grandchildren15 40.3% Not responsible for grandchildrenBlack or African American 97 22.6% Responsible for grandchildren333 77.4% Not responsible for grandchildrenOther race 6 100.0% Responsible for grandchildrenTwo or more races 48 100.0% Responsible for grandchildrenWhite alone, not Hispanic / Latino 24 61.0% Responsible for grandchildren15 39.0% Not responsible for grandchildrenHispanic or Latino 7 100.0% Responsible for grandchildrenGrandparents (60 years and over) White / Caucasian 81 73.2% Responsible for grandchildren30 26.8% Not responsible for grandchildrenBlack or African American 90 33.4% Responsible for grandchildren179 66.6% Not responsible for grandchildrenOther race 15 100.0% Responsible for grandchildrenWhite alone, not Hispanic / Latino 82 72.7% Responsible for grandchildren31 27.3% Not responsible for grandchildren