Races in Forest Hills, Michigan (MI) Detailed Stats
Data:
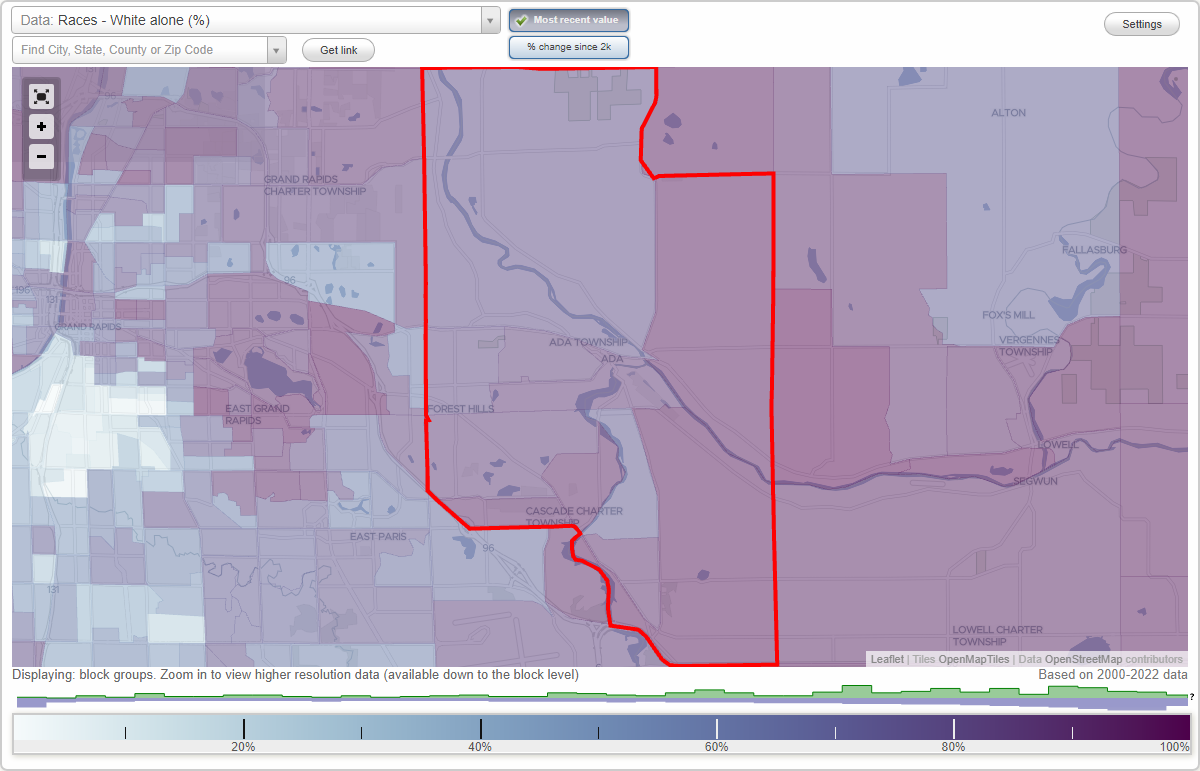
Races - White alone (%)
Races - White alone (% change since 2000)
Races - Black alone (%)
Races - Black alone (% change since 2000)
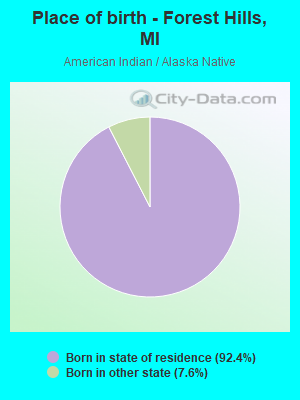
Races - American Indian alone (%)
Races - American Indian alone (% change since 2000)
Races - Asian alone (%)
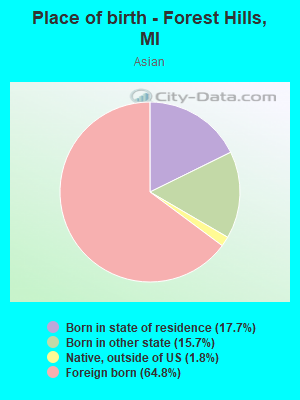
Races - Asian alone (% change since 2000)
Races - Hispanic (%)
Races - Hispanic (% change since 2000)
Races - Native Hawaiian and Other Pacific Islander alone (%)
Races - Native Hawaiian and Other Pacific Islander alone (% change since 2000)
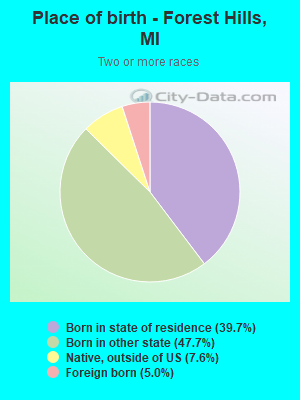
Races - Two or more races(%)
Races - Two or more races(% change since 2000)
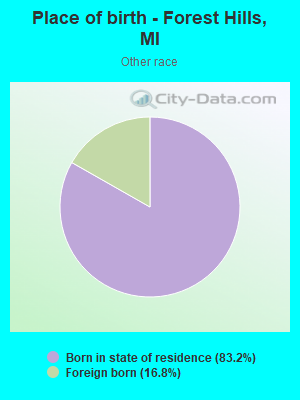
Races - Other race alone (%)
Races - Other race alone (% change since 2000)
Racial diversity
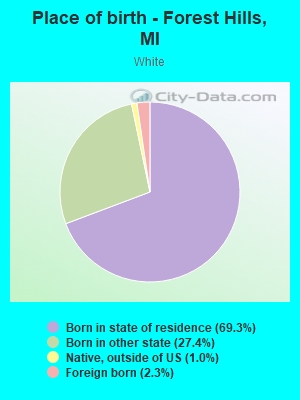
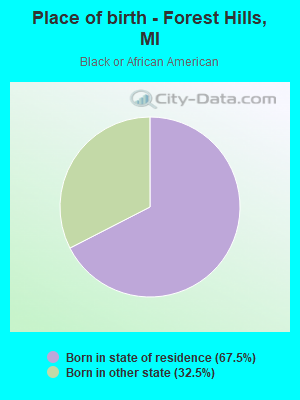
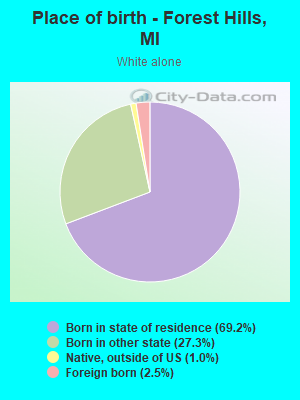
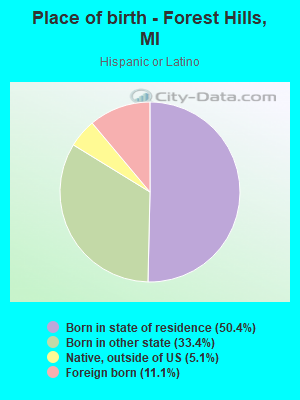
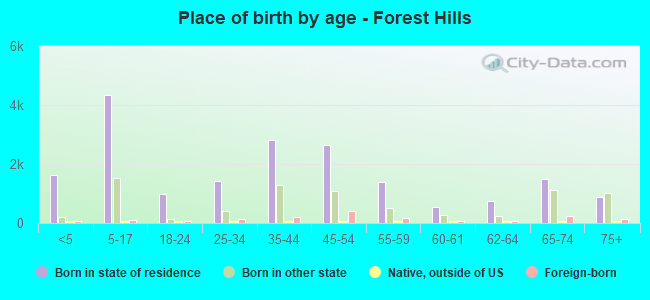
Place of birth - Born in state of residence (%)
Place of birth - Born in state of residence (%) - White
Place of birth - Born in state of residence (%) - Black or African American
Place of birth - Born in state of residence (%) - Asian
Place of birth - Born in state of residence (%) - Hispanic or Latino
Place of birth - Born in state of residence (%) - American Indian and Alaska Native
Place of birth - Born in state of residence (%) - Multirace
Place of birth - Born in state of residence (%) - Other Race
Place of birth - Born in other state (%)
Place of birth - Born in other state (%) - White
Place of birth - Born in other state (%) - Black or African American
Place of birth - Born in other state (%) - Asian
Place of birth - Born in other state (%) - Hispanic or Latino
Place of birth - Born in other state (%) - American Indian and Alaska Native
Place of birth - Born in other state (%) - Multirace
Place of birth - Born in other state (%) - Other Race
Place of birth - Native, outside of US (%)
Place of birth - Native, outside of US (%) - White
Place of birth - Native, outside of US (%) - Black or African American
Place of birth - Native, outside of US (%) - Asian
Place of birth - Native, outside of US (%) - Hispanic or Latino
Place of birth - Native, outside of US (%) - American Indian and Alaska Native
Place of birth - Native, outside of US (%) - Multirace
Place of birth - Native, outside of US (%) - Other Race
Place of birth - Foreign born (%)
Place of birth - Foreign born (%) - White
Place of birth - Foreign born (%) - Black or African American
Place of birth - Foreign born (%) - Asian
Place of birth - Foreign born (%) - Hispanic or Latino
Place of birth - Foreign born (%) - American Indian and Alaska Native
Place of birth - Foreign born (%) - Multirace
Place of birth - Foreign born (%) - Other Race
Residents speaking English at home (%)
Residents speaking English at home - Born in the United States (%)
Residents speaking English at home - Native, born elsewhere (%)
Residents speaking English at home - Foreign born (%)
Residents speaking Spanish at home (%)
Residents speaking Spanish at home - Born in the United States (%)
Residents speaking Spanish at home - Native, born elsewhere (%)
Residents speaking Spanish at home - Foreign born (%)
Residents speaking other language at home (%)
Residents speaking other language at home - Born in the United States (%)
Residents speaking other language at home - Native, born elsewhere (%)
Residents speaking other language at home - Foreign born (%)
Marital status - Never married (%)
Marital status - Now married (%)
Marital status - Separated (%)
Marital status - Widowed (%)
Marital status - Divorced (%)
Ancestries Reported - Arab (%)
Ancestries Reported - Czech (%)
Ancestries Reported - Danish (%)
Ancestries Reported - Dutch (%)
Ancestries Reported - English (%)
Ancestries Reported - French (%)
Ancestries Reported - French Canadian (%)
Ancestries Reported - German (%)
Ancestries Reported - Greek (%)
Ancestries Reported - Hungarian (%)
Ancestries Reported - Irish (%)
Ancestries Reported - Italian (%)
Ancestries Reported - Lithuanian (%)
Ancestries Reported - Norwegian (%)
Ancestries Reported - Polish (%)
Ancestries Reported - Portuguese (%)
Ancestries Reported - Russian (%)
Ancestries Reported - Scotch-Irish (%)
Ancestries Reported - Scottish (%)
Ancestries Reported - Slovak (%)
Ancestries Reported - Subsaharan African (%)
Ancestries Reported - Swedish (%)
Ancestries Reported - Swiss (%)
Ancestries Reported - Ukrainian (%)
Ancestries Reported - United States (%)
Ancestries Reported - Welsh (%)
Ancestries Reported - West Indian (%)
Ancestries Reported - Other (%)
Geographical mobility - Same house 1 year ago (%)
Geographical mobility - Same house 1 year ago (%) - White
Geographical mobility - Same house 1 year ago (%) - Black or African American
Geographical mobility - Same house 1 year ago (%) - Asian
Geographical mobility - Same house 1 year ago (%) - Hispanic or Latino
Geographical mobility - Same house 1 year ago (%) - American Indian and Alaska Native
Geographical mobility - Same house 1 year ago (%) - Multirace
Geographical mobility - Same house 1 year ago (%) - Other Race
Geographical mobility - Moved within same county (%)
Geographical mobility - Moved within same county (%) - White
Geographical mobility - Moved within same county (%) - Black or African American
Geographical mobility - Moved within same county (%) - Asian
Geographical mobility - Moved within same county (%) - Hispanic or Latino
Geographical mobility - Moved within same county (%) - American Indian and Alaska Native
Geographical mobility - Moved within same county (%) - Multirace
Geographical mobility - Moved within same county (%) - Other Race
Geographical mobility - Moved from different county within same state (%)
Geographical mobility - Moved from different county within same state (%) - White
Geographical mobility - Moved from different county within same state (%) - Black or African American
Geographical mobility - Moved from different county within same state (%) - Asian
Geographical mobility - Moved from different county within same state (%) - Hispanic or Latino
Geographical mobility - Moved from different county within same state (%) - American Indian and Alaska Native
Geographical mobility - Moved from different county within same state (%) - Multirace
Geographical mobility - Moved from different county within same state (%) - Other Race
Geographical mobility - Moved from different state (%)
Geographical mobility - Moved from different state (%) - White
Geographical mobility - Moved from different state (%) - Black or African American
Geographical mobility - Moved from different state (%) - Asian
Geographical mobility - Moved from different state (%) - Hispanic or Latino
Geographical mobility - Moved from different state (%) - American Indian and Alaska Native
Geographical mobility - Moved from different state (%) - Multirace
Geographical mobility - Moved from different state (%) - Other Race
Geographical mobility - Moved from abroad (%)
Geographical mobility - Moved from abroad (%) - White
Geographical mobility - Moved from abroad (%) - Black or African American
Geographical mobility - Moved from abroad (%) - Asian
Geographical mobility - Moved from abroad (%) - Hispanic or Latino
Geographical mobility - Moved from abroad (%) - American Indian and Alaska Native
Geographical mobility - Moved from abroad (%) - Multirace
Geographical mobility - Moved from abroad (%) - Other Race
Place of birth for the foreign-born population - Ireland (%)
Place of birth for the foreign-born population - Denmark (%)
Place of birth for the foreign-born population - Norway (%)
Place of birth for the foreign-born population - Sweden (%)
Place of birth for the foreign-born population - United Kingdom (%)
Place of birth for the foreign-born population - England (%)
Place of birth for the foreign-born population - Scotland (%)
Place of birth for the foreign-born population - Other Northern Europe (%)
Place of birth for the foreign-born population - Austria (%)
Place of birth for the foreign-born population - Belgium (%)
Place of birth for the foreign-born population - France (%)
Place of birth for the foreign-born population - Germany (%)
Place of birth for the foreign-born population - Netherlands (%)
Place of birth for the foreign-born population - Switzerland (%)
Place of birth for the foreign-born population - Other Western Europe (%)
Place of birth for the foreign-born population - Greece (%)
Place of birth for the foreign-born population - Italy (%)
Place of birth for the foreign-born population - Portugal (%)
Place of birth for the foreign-born population - Spain (%)
Place of birth for the foreign-born population - Other Southern Europe (%)
Place of birth for the foreign-born population - Albania (%)
Place of birth for the foreign-born population - Belarus (%)
Place of birth for the foreign-born population - Bosnia and Herzegovina (%)
Place of birth for the foreign-born population - Bulgaria (%)
Place of birth for the foreign-born population - Croatia (%)
Place of birth for the foreign-born population - Czechoslovakia (%)
Place of birth for the foreign-born population - Hungary (%)
Place of birth for the foreign-born population - Latvia (%)
Place of birth for the foreign-born population - Lithuania (%)
Place of birth for the foreign-born population - North Macedonia (Macedonia) (%)
Place of birth for the foreign-born population - Moldova (%)
Place of birth for the foreign-born population - Poland (%)
Place of birth for the foreign-born population - Romania (%)
Place of birth for the foreign-born population - Russia (%)
Place of birth for the foreign-born population - Serbia (%)
Place of birth for the foreign-born population - Ukraine (%)
Place of birth for the foreign-born population - Other Eastern Europe (%)
Place of birth for the foreign-born population - China (%)
Place of birth for the foreign-born population - Hong Kong (%)
Place of birth for the foreign-born population - Taiwan (%)
Place of birth for the foreign-born population - Japan (%)
Place of birth for the foreign-born population - Korea (%)
Place of birth for the foreign-born population - Other Eastern Asia (%)
Place of birth for the foreign-born population - Afghanistan (%)
Place of birth for the foreign-born population - Bangladesh (%)
Place of birth for the foreign-born population - India (%)
Place of birth for the foreign-born population - Iran (%)
Place of birth for the foreign-born population - Kazakhstan (%)
Place of birth for the foreign-born population - Nepal (%)
Place of birth for the foreign-born population - Pakistan (%)
Place of birth for the foreign-born population - Sri Lanka (%)
Place of birth for the foreign-born population - Uzbekistan (%)
Place of birth for the foreign-born population - Other South Central Asia (%)
Place of birth for the foreign-born population - Burma (%)
Place of birth for the foreign-born population - Cambodia (%)
Place of birth for the foreign-born population - Indonesia (%)
Place of birth for the foreign-born population - Laos (%)
Place of birth for the foreign-born population - Malaysia (%)
Place of birth for the foreign-born population - Philippines (%)
Place of birth for the foreign-born population - Singapore (%)
Place of birth for the foreign-born population - Thailand (%)
Place of birth for the foreign-born population - Vietnam (%)
Place of birth for the foreign-born population - Other South Eastern Asia (%)
Place of birth for the foreign-born population - Armenia (%)
Place of birth for the foreign-born population - Iraq (%)
Place of birth for the foreign-born population - Israel (%)
Place of birth for the foreign-born population - Jordan (%)
Place of birth for the foreign-born population - Kuwait (%)
Place of birth for the foreign-born population - Lebanon (%)
Place of birth for the foreign-born population - Saudi Arabia (%)
Place of birth for the foreign-born population - Syria (%)
Place of birth for the foreign-born population - Turkey (%)
Place of birth for the foreign-born population - Yemen (%)
Place of birth for the foreign-born population - Other Western Asia (%)
Place of birth for the foreign-born population - Eritrea (%)
Place of birth for the foreign-born population - Ethiopia (%)
Place of birth for the foreign-born population - Kenya (%)
Place of birth for the foreign-born population - Somalia (%)
Place of birth for the foreign-born population - Uganda (%)
Place of birth for the foreign-born population - Zimbabwe (%)
Place of birth for the foreign-born population - Other Eastern Africa (%)
Place of birth for the foreign-born population - Cameroon (%)
Place of birth for the foreign-born population - Congo (%)
Place of birth for the foreign-born population - Democratic Republic of Congo (Zaire) (%)
Place of birth for the foreign-born population - Other Middle Africa (%)
Place of birth for the foreign-born population - Egypt (%)
Place of birth for the foreign-born population - Morocco (%)
Place of birth for the foreign-born population - Sudan (%)
Place of birth for the foreign-born population - Other Northern Africa (%)
Place of birth for the foreign-born population - South Africa (%)
Place of birth for the foreign-born population - Other Southern Africa (%)
Place of birth for the foreign-born population - Cabo Verde (%)
Place of birth for the foreign-born population - Ghana (%)
Place of birth for the foreign-born population - Liberia (%)
Place of birth for the foreign-born population - Nigeria (%)
Place of birth for the foreign-born population - Senegal (%)
Place of birth for the foreign-born population - Sierra Leone (%)
Place of birth for the foreign-born population - Other Western Africa (%)
Place of birth for the foreign-born population - Australia (%)
Place of birth for the foreign-born population - New Zealand (%)
Place of birth for the foreign-born population - Fiji (%)
Place of birth for the foreign-born population - Micronesia (%)
Place of birth for the foreign-born population - Bahamas (%)
Place of birth for the foreign-born population - Barbados (%)
Place of birth for the foreign-born population - Cuba (%)
Place of birth for the foreign-born population - Dominica (%)
Place of birth for the foreign-born population - Dominican Republic (%)
Place of birth for the foreign-born population - Grenada (%)
Place of birth for the foreign-born population - Haiti (%)
Place of birth for the foreign-born population - Jamaica (%)
Place of birth for the foreign-born population - St. Vincent and the Grenadines (%)
Place of birth for the foreign-born population - Trinidad and Tobago (%)
Place of birth for the foreign-born population - West Indies (%)
Place of birth for the foreign-born population - Other Caribbean (%)
Place of birth for the foreign-born population - Belize (%)
Place of birth for the foreign-born population - Costa Rica (%)
Place of birth for the foreign-born population - El Salvador (%)
Place of birth for the foreign-born population - Guatemala (%)
Place of birth for the foreign-born population - Honduras (%)
Place of birth for the foreign-born population - Mexico (%)
Place of birth for the foreign-born population - Nicaragua (%)
Place of birth for the foreign-born population - Panama (%)
Place of birth for the foreign-born population - Other Central America (%)
Place of birth for the foreign-born population - Argentina (%)
Place of birth for the foreign-born population - Bolivia (%)
Place of birth for the foreign-born population - Brazil (%)
Place of birth for the foreign-born population - Chile (%)
Place of birth for the foreign-born population - Colombia (%)
Place of birth for the foreign-born population - Ecuador (%)
Place of birth for the foreign-born population - Guyana (%)
Place of birth for the foreign-born population - Peru (%)
Place of birth for the foreign-born population - Uruguay (%)
Place of birth for the foreign-born population - Venezuela (%)
Place of birth for the foreign-born population - Other South America (%)
Place of birth for the foreign-born population - Canada (%)
Place of birth for the foreign-born population - Other Northern America (%)
Place of birth for the foreign-born population - Other (%)
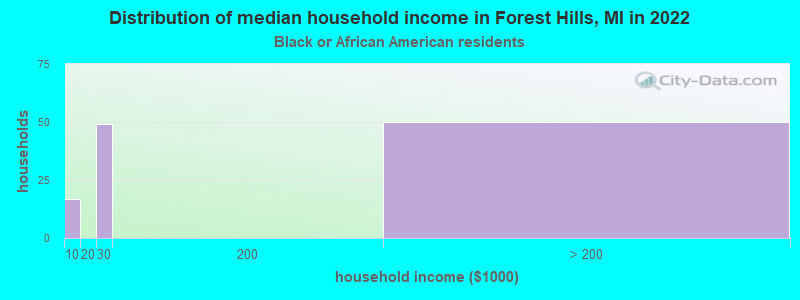
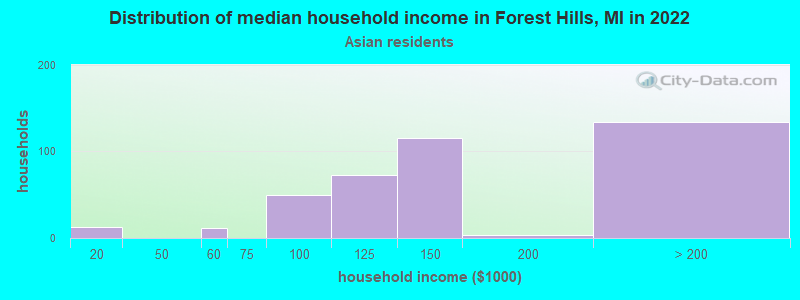
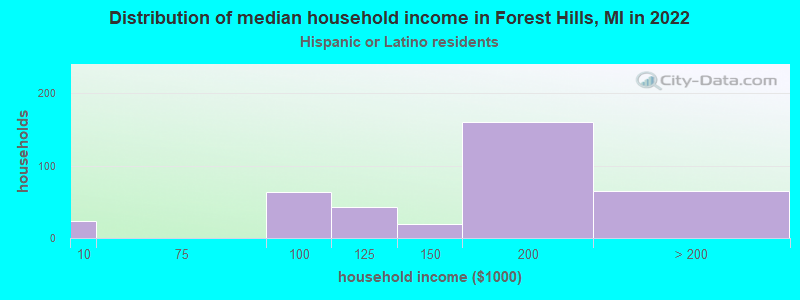
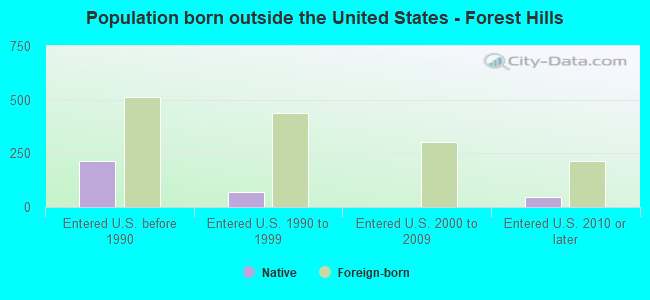
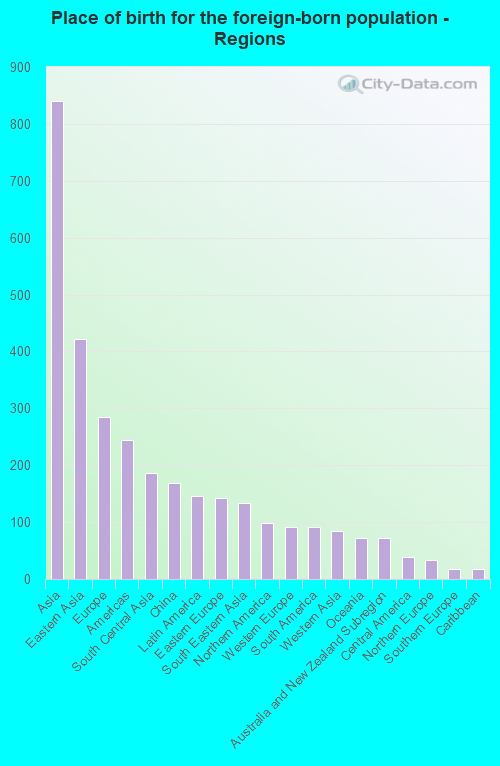
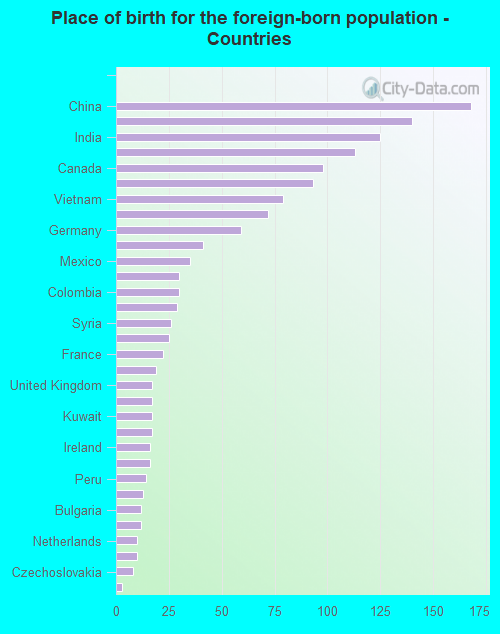
According to 2022 data, the most numerous races in Forest Hills, MI are White alone (24,551 residents), Black alone (289 residents), and Hispanic (1,261 residents). 90.4% of Forest Hills residents speak English at home. 5.1% of Forest Hills, MI residents are foreign-born (3.0% born in Asia, 1.0% born in Europe, 0.5% born in Latin America), which is 18.8% less than the foreign-born rate of 6.0% across the entire state of Michigan.
Race distribution in Forest Hills
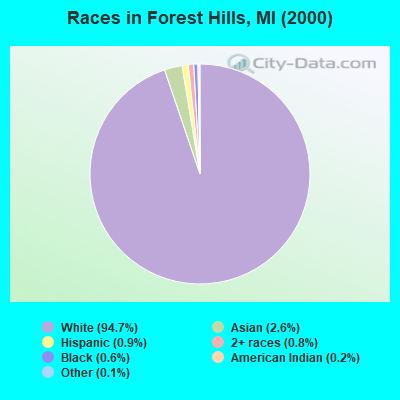
2000 2022
7,806,691 78.6% White alone 1,402,047 14.1% Black alone 323,877 3.3% Hispanic 175,311 1.8% Asian alone 163,487 1.6% Two or more races 53,421 0.5% American Indian alone 11,465 0.1% Other race alone 2,145 0.02% Native Hawaiian and Other
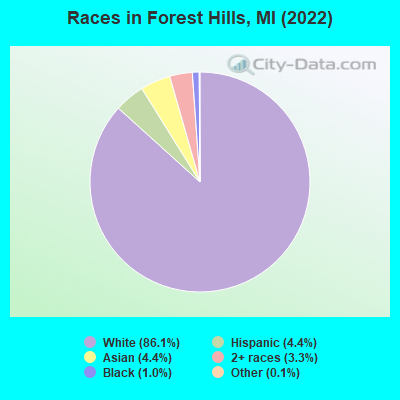
7,289,051 72.6% White alone 1,310,464 13.1% Black alone 572,405 5.7% Hispanic 450,031 4.5% Two or more races 335,732 3.3% Asian alone 45,217 0.5% Other race alone 29,011 0.3% American Indian alone 2,207 0.02% Native Hawaiian and Other
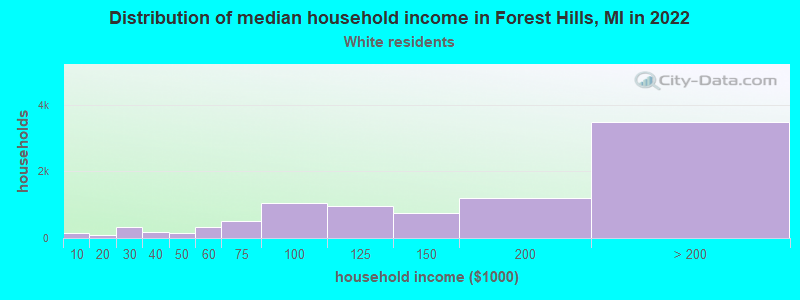
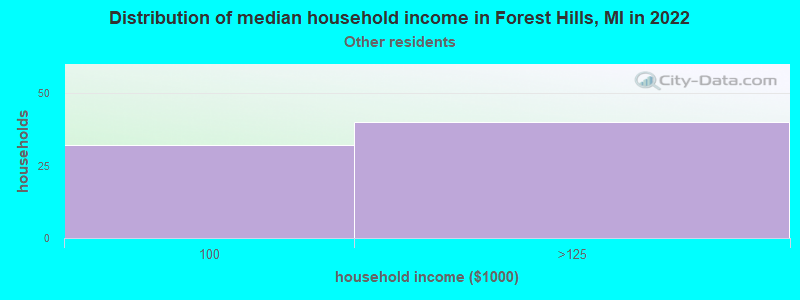
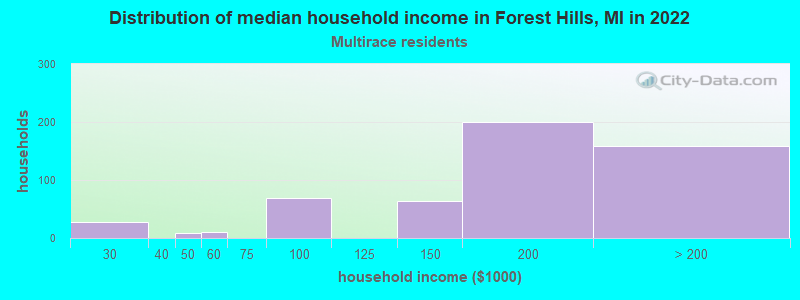
Income and house value in Forest Hills Median household income in 2022 $150,811 White non-Hispanic householders$144,971 Asian householdersover $200,000 Two or more races householders$162,855 Hispanic or Latino race householdersMedian 2022 house value $503,158 White Non-Hispanic householders$713,699 Black or African American householders$386,587 American Indian or Alaska Native householders $850,967 Asian householders$792,919 Some other race householders$379,925 Two or more races householders$495,545 Hispanic or Latino householders
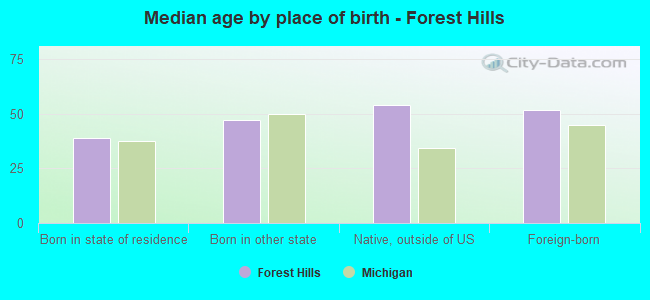
Median age by race in Forest Hills
44.5 Median age for White residents44.3 44.7 45.5 Median age for Black or African American residents46.4 64.0 -697,722,566.6 Median age for American Indian / Alaska Native residents-697,626,418.3 -677,018,632.9 39.0 Median age for Asian residents35.1 41.2 -670,531,400.3 Median age for Native Hawaiian / Pacific Islander residents-674,772,035.8 -699,588,476.7 49.0 Median age for Other race residents-654,501,215.9 48.0 30.0 Median age for Two or more races residents27.6 41.0 44.5 Median age for White alone residents44.3 45.0 23.3 Median age for Hispanic or Latino residents16.1 29.8
Owner/renter occupied households by race in Forest Hills
House owners and renters - White residents 8,463 94.9% Owner occupied450 5.1% Renter occupiedHouse owners and renters - Black or African American residents 80 82.9% Owner occupied16 17.1% Renter occupiedHouse owners and renters - American Indian / Alaska Native residents 26 100.0% Owner occupiedHouse owners and renters - Asian residents 283 74.5% Owner occupied97 25.5% Renter occupiedHouse owners and renters - Other race residents 45 100.0% Owner occupiedHouse owners and renters - Two or more races residents 481 93.6% Owner occupied33 6.4% Renter occupiedHouse owners and renters - White alone residents 8,333 94.9% Owner occupied449 5.1% Renter occupiedHouse owners and renters - Hispanic or Latino residents 380 100.0% Owner occupied
Language usage in Forest Hills
English speakers - Total 90.4% of residents of Forest Hills speak English at home.
2.7% of residents speak Spanish at home 520 71.5% Speak English very well207 28.5% Speak English less than very well6.6% of residents speak other language at home 1,123 63.7% Speak English very well640 36.3% Speak English less than very well
English speakers - Born in the United States 97.1% of residents of Forest Hills speak English at home.
1.1% of residents speak Spanish at home 84 100.0% Speak English very well2.3% of residents speak other language at home 46 26.0% Speak English very well131 74.0% Speak English less than very well
English speakers - Native, born elsewhere 82.2% of residents of Forest Hills speak English at home.
15.3% of residents speak Spanish at home 49 100.0% Speak English very well7.8% of residents speak other language at home 25 100.0% Speak English very well
English speakers - Foreign-born 27.1% of residents of Forest Hills speak English at home.
4.8% of residents speak Spanish at home 71 100.0% Speak English very well64.4% of residents speak other language at home 532 55.5% Speak English very well426 44.5% Speak English less than very well
White (Caucasian) - Speak only English Native:
97.2% (22,100)Foreign-born:
39.9% (230)
White (Caucasian) - Speak another language Native:
2.8% (633)Foreign-born:
60.7% (350)
Asian - Speak only English Native:
43.8% (159)Foreign-born:
18.9% (150)
Asian - Speak another language Native:
56.4% (204)Foreign-born:
81.1% (641)
Other race - Speak only English Native:
93.1% (89)Foreign-born:
95.5% (19)
Other race - Speak another language Native:
20.0% (19)Foreign-born:
9.6% (2)
Two or more races - Speak only English Native:
64.7% (844)Foreign-born:
35.3% (30)
Two or more races - Speak another language Native:
38.5% (503)Foreign-born:
64.6% (54)
White alone - Speak only English Native:
98.0% (21,961)Foreign-born:
33.8% (206)
White alone - Speak another language Native:
2.1% (466)Foreign-born:
65.7% (401)
Hispanic or Latino - Speak only English Native:
55.6% (518)Foreign-born:
47.1% (64)
Hispanic or Latino - Speak another language Native:
44.0% (410)Foreign-born:
54.8% (74)
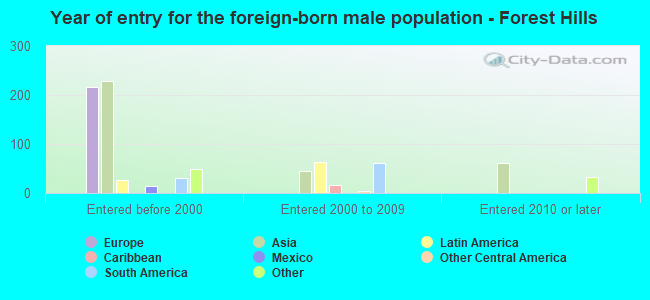
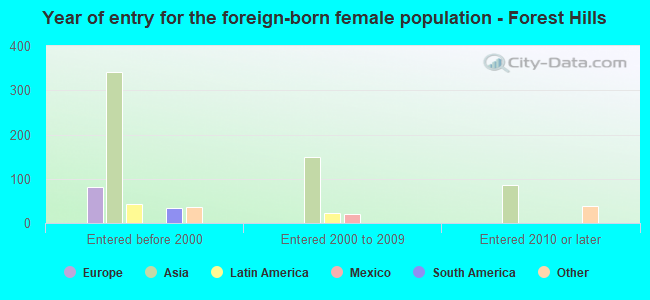
Foreign-born residents in Forest Hills 1,440 residents are foreign born (3.0% Asia , 1.0% Europe , 0.5% Latin America ).
This city:
5.1%Michigan:
6.9%
Marital status for residents in Forest Hills Marital status - White (Caucasian) population 15 years and over
Males 19.5% Never married72.9% Now married0.2% Separated1.6% Widowed5.7% DivorcedFemales 15.1% Never married72.2% Now married0.3% Separated5.2% Widowed7.2% DivorcedWomen who gave birth in the past 12 months Now married:
100.0% (352)Unmarried:
0.0% (0)
Women who did not give birth in the past 12 months Now married:
65.5% (2,819)Unmarried:
34.5% (1,484)
Marital status - Black or African American population 15 years and over
Males 23.9% Never married59.1% Now married0.0% Separated0.0% Widowed17.0% DivorcedFemales 29.9% Never married70.1% Now married0.0% Separated0.0% Widowed0.0% DivorcedWomen who did not give birth in the past 12 months Now married:
29.9% (20)Unmarried:
70.1% (47)
Marital status - Asian population 15 years and over
Males 41.4% Never married58.6% Now married0.0% Separated0.0% Widowed0.0% DivorcedFemales 17.6% Never married63.9% Now married0.0% Separated12.6% Widowed5.9% DivorcedWomen who gave birth in the past 12 months Now married:
100.0% (41)Unmarried:
0.0% (0)
Women who did not give birth in the past 12 months Now married:
57.6% (194)Unmarried:
42.4% (143)
Marital status - Other race population 15 years and over
Males 0.0% Never married100.0% Now married0.0% Separated0.0% Widowed0.0% DivorcedFemales 27.7% Never married72.3% Now married0.0% Separated0.0% Widowed0.0% DivorcedWomen who did not give birth in the past 12 months Now married:
50.0% (22)Unmarried:
50.0% (22)
Marital status - Two or more races population 15 years and over
Males 40.0% Never married60.0% Now married0.0% Separated0.0% Widowed0.0% DivorcedFemales 21.8% Never married74.3% Now married0.0% Separated0.0% Widowed3.9% DivorcedWomen who gave birth in the past 12 months Now married:
100.0% (28)Unmarried:
0.0% (0)
Women who did not give birth in the past 12 months Now married:
67.3% (311)Unmarried:
32.7% (151)
Marital status - White alone, not Hispanic / Latino population 15 years and over
Males 19.1% Never married73.7% Now married0.2% Separated1.6% Widowed5.3% DivorcedFemales 14.4% Never married73.0% Now married0.3% Separated5.3% Widowed7.0% DivorcedWomen who gave birth in the past 12 months Now married:
100.0% (356)Unmarried:
0.0% (0)
Women who did not give birth in the past 12 months Now married:
66.9% (2,768)Unmarried:
33.1% (1,371)
Marital status - Hispanic or Latino population 15 years and over
Males 40.9% Never married44.3% Now married0.0% Separated0.0% Widowed14.9% DivorcedFemales 29.9% Never married62.0% Now married0.0% Separated0.0% Widowed8.1% DivorcedWomen who gave birth in the past 12 months Now married:
100.0% (22)Unmarried:
0.0% (0)
Women who did not give birth in the past 12 months Now married:
56.2% (239)Unmarried:
43.8% (187)
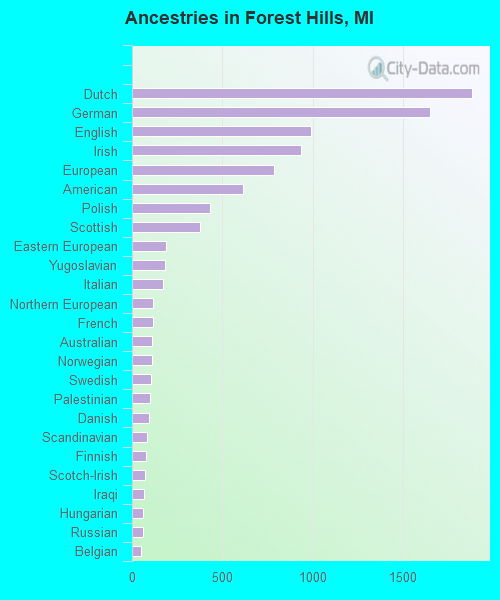
Ancestries in Forest Hills
1,882 15.7% Dutch1,647 13.7% German992 8.3% English934 7.8% Irish784 6.5% European612 5.1% American433 3.6% Polish379 3.2% Scottish188 1.6% Eastern European182 1.5% Yugoslavian170 1.4% Italian117 1.0% Northern European116 1.0% French113 0.9% Australian111 0.9% Norwegian104 0.9% Swedish100 0.8% Palestinian94 0.8% Danish81 0.7% Scandinavian78 0.6% Finnish73 0.6% Scotch-Irish65 0.5% Iraqi62 0.5% Hungarian61 0.5% Russian51 0.4% Belgian50 0.4% Luxembourger50 0.4% Lebanese50 0.4% Estonian47 0.4% French Canadian37 0.3% Czechoslovakian32 0.3% British30 0.2% Portuguese29 0.2% Slovak27 0.2% Lithuanian20 0.2% Canadian20 0.2% Romanian15 0.1% Czech15 0.1% Latvian13 0.1% Greek12 0.10% Bulgarian12 0.10% Ukrainian9 0.07% Guyanese
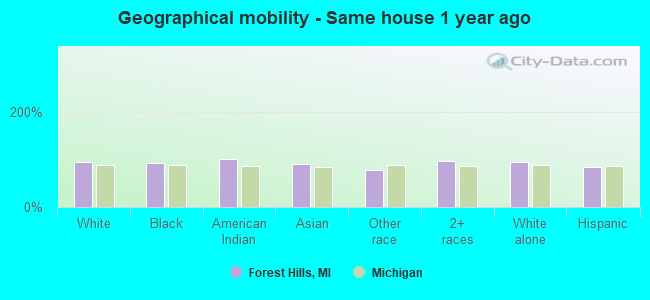
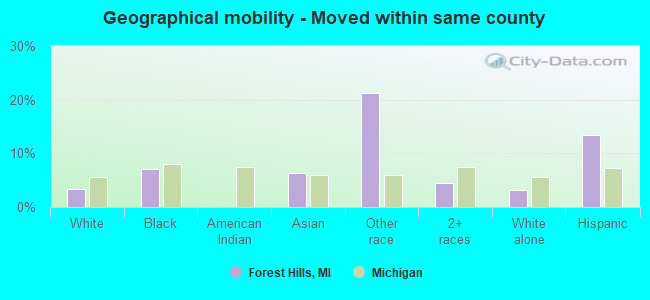
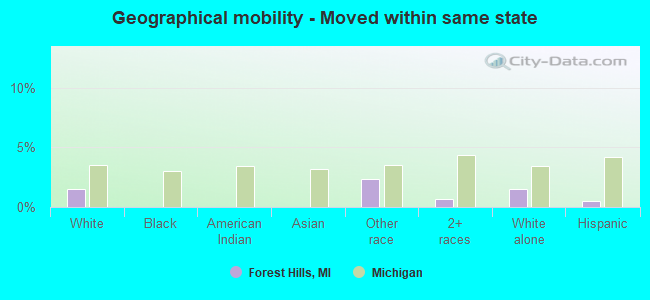
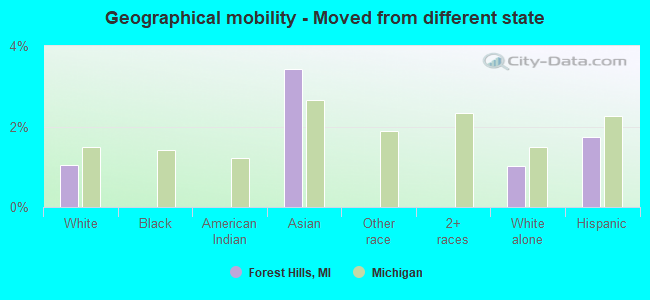
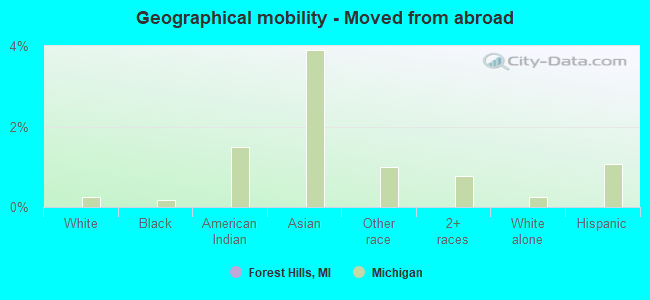
Geographical mobility in Forest Hills Same house 1 year ago 23,039 94.0% White (Caucasian)263 91.7% Black or African American15 100.0% American Indian / Alaska Native1,115 90.9% Asian86 77.9% Other race1,547 95.8% Two or more races22,769 94.1% White alone, not Hispanic / Latino1,052 84.3% Hispanic or LatinoMoved within same county 809 3.3% White / Caucasian20 7.1% Black or African American78 6.4% Asian23 21.2% Other race72 4.5% Two or more races759 3.1% White alone, not Hispanic / Latino167 13.4% Hispanic or LatinoMoved within same state 367 1.5% White / Caucasian3 2.4% Other race11 0.7% Two or more races359 1.5% White alone, not Hispanic / Latino7 0.5% Hispanic or LatinoMoved from different state 255 1.0% White / Caucasian42 3.4% Asian248 1.0% White alone, not Hispanic / Latino22 1.7% Hispanic or LatinoMoved from abroad 3 0.0% White3 0.0% White alone, not Hispanic / Latino
Children Nativity (place of birth) in Forest Hills
Children under 6 years - Living with two parents Both parents native 1,919 100.0% NativeBoth parents foreign-born 27 51.1% Native26 48.9% Foreign-bornOne native, one foreign-born parent 98 100.0% NativeChildren under 6 years - Living with one parent Native parent 99 100.0% NativeChildren 6 to 17 years - Living with two parents Both parents native 4,400 98.9% Native50 1.1% Foreign-bornBoth parents foreign-born 162 100.0% NativeOne native, one foreign-born parent 294 92.4% Native24 7.6% Foreign-bornChildren 6 to 17 years - Living with one parent Native parent 550 100.0% NativeForeign-born parent 101 51.4% Native95 48.6% Foreign-born