Estimated zip code population in 2022: 17,480 Zip code population in 2010: 16,627 Zip code population in 2000: 14,689
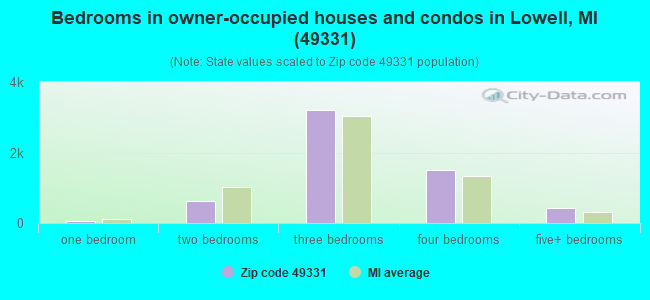
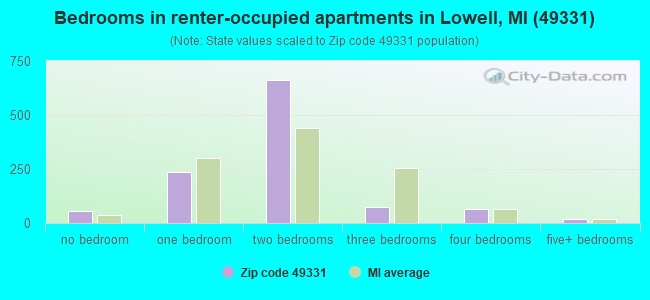
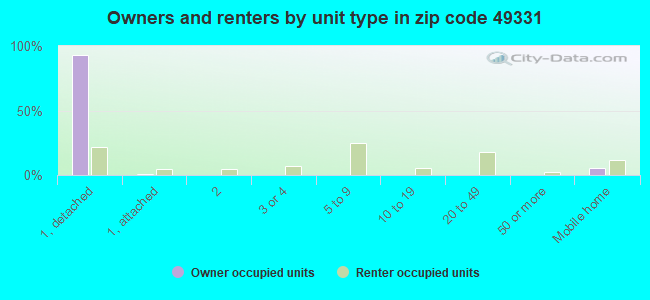
Houses and condos: 6,998 Renter-occupied apartments: 1,107
% of renters here:
16%
State:
27%
March 2022 cost of living index in zip code 49331: 82.3 (low, U.S. average is 100)
Land area: 90.5 sq. mi. Water area: 2.8 sq. mi.
Population density: 193 people per square mile
(very low).
OSM Map
General Map
Google Map
MSN Map
OSM Map
General Map
Google Map
MSN Map
OSM Map
General Map
Google Map
MSN Map
OSM Map
General Map
Google Map
MSN Map
Please wait while loading the map...
Real estate property taxes paid for housing units in 2022:
This zip code:
1.1% ($3,275)
Michigan:
1.2% ($2,746)
Median real estate property taxes paid for housing units with mortgages in 2022: $3,330 (1.1%) Median real estate property taxes paid for housing units with no mortgage in 2022: $3,194 (1.2%)
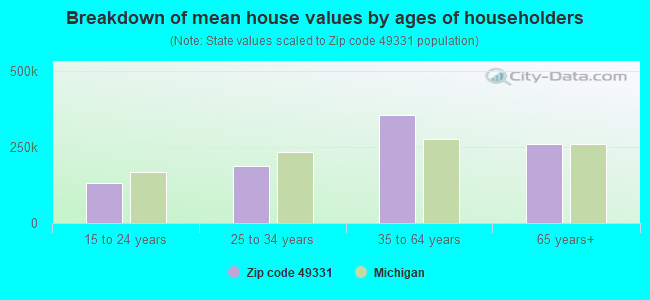
Estimated median house/condo value in 2022: $306,751
49331:
$306,751
Michigan:
$224,400
According to our research of Michigan and other state lists, there were 38 registered sex offenders living in 49331 zip code as of April 27, 2024. The ratio of all residents to sex offenders in zip code 49331 is 466 to 1. The ratio of registered sex offenders to all residents in this zip code is lower than the state average.
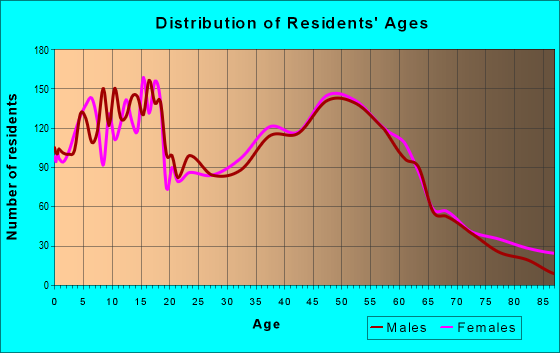
Median resident age:
This zip code:
38.5 years
Michigan median age:
40.3 years
Average household size:
This zip code:
2.5 people
Michigan:
2.4 people
Averages for the 2020 tax year for zip code 49331, filed in 2021:
Average Adjusted Gross Income (AGI) in 2020: $79,598 (Individual Income Tax Returns)
Here:
$79,598
State:
$68,945
Salary/wage: $64,842 (reported on 83.5% of returns)
Here:
$64,842
State:
$57,142
(% of AGI for various income ranges: 1128.5% for AGIs below $25k, 3389.4% for AGIs $25k-50k, 6439.9% for AGIs $50k-75k, 9210.8% for AGIs $75k-100k, 18042.6% for AGIs $100k-200k, 74611.4% for AGIs over 200k)
Taxable interest for individuals: $1,115 (reported on 39.7% of returns)
This zip code:
$1,115
Michigan:
$1,630
(% of AGI for various income ranges: 20.2% for AGIs below $25k, 21.9% for AGIs $25k-50k, 29.5% for AGIs $50k-75k, 60.1% for AGIs $75k-100k, 107.9% for AGIs $100k-200k, 1052.9% for AGIs over 200k)
Ordinary dividends: $5,233 (reported on 20.1% of returns)
Here:
$5,233
State:
$6,972
(% of AGI for various income ranges: 29.4% for AGIs below $25k, 39.3% for AGIs $25k-50k, 71.1% for AGIs $50k-75k, 116.6% for AGIs $75k-100k, 205.2% for AGIs $100k-200k, 3345.7% for AGIs over 200k)
Net capital gain/loss in AGI: +$13,249 (reported on 18.9% of returns)
Here:
+$13,249
State:
+$20,064
(% of AGI for various income ranges: 18.0% for AGIs below $25k, 31.6% for AGIs $25k-50k, 116.0% for AGIs $50k-75k, 131.9% for AGIs $75k-100k, 470.1% for AGIs $100k-200k, 10415.7% for AGIs over 200k)
Profit/loss from business: +$13,499 (reported on 15.2% of returns)
Here:
+$13,499
State:
+$11,172
(% of AGI for various income ranges: 76.7% for AGIs below $25k, 166.9% for AGIs $25k-50k, 210.2% for AGIs $50k-75k, 269.0% for AGIs $75k-100k, 589.0% for AGIs $100k-200k, 3360.7% for AGIs over 200k)
Taxable individual retirement arrangement distribution: $19,535 (reported on 11.9% of returns)
49331:
$19,535
Michigan:
$19,803
(% of AGI for various income ranges: 96.1% for AGIs below $25k, 187.2% for AGIs $25k-50k, 308.6% for AGIs $50k-75k, 477.9% for AGIs $75k-100k, 735.9% for AGIs $100k-200k, 1877.9% for AGIs over 200k)
Self-employed (Keogh) retirement plans: $24,975 (reported on 0.5% of returns)
49331:
$24,975
Michigan:
$25,132
(% of AGI for various income ranges: 101.9% for AGIs $100k-200k)
Total itemized deductions: $32,518 (reported on 6.9% of returns)
Here:
$32,518
State:
$34,117
(% of AGI for various income ranges: 34.2% for AGIs below $25k, 78.0% for AGIs $25k-50k, 153.1% for AGIs $50k-75k, 229.5% for AGIs $75k-100k, 625.3% for AGIs $100k-200k, 6360.7% for AGIs over 200k)
Charity contributions: $15,241 (reported on 5.6% of returns)
Here:
$15,241
State:
$13,548
(% of AGI for various income ranges: 13.3% for AGIs $25k-50k, 34.1% for AGIs $50k-75k, 50.8% for AGIs $75k-100k, 186.4% for AGIs $100k-200k, 3397.1% for AGIs over 200k)
Taxes paid: $8,254 (reported on 6.9% of returns)
49331:
$8,254
State:
$7,972
(% of AGI for various income ranges: 6.1% for AGIs below $25k, 16.0% for AGIs $25k-50k, 46.2% for AGIs $50k-75k, 78.4% for AGIs $75k-100k, 188.9% for AGIs $100k-200k, 1318.6% for AGIs over 200k)
Earned income credit: $1,932 (reported on 8.6% of returns)
Here:
$1,932
State:
$2,251
(% of AGI for various income ranges: 46.7% for AGIs below $25k, 47.9% for AGIs $25k-50k, 1.3% for AGIs $50k-75k)
Percentage of individuals using paid preparers for their 2020 taxes: 94.1%
Here:
94%
State:
93%
(% for various income ranges: 92.7% for AGIs below $25k, 93.5% for AGIs $25k-50k, 92.4% for AGIs $50k-75k, 96.1% for AGIs $75k-100k, 95.8% for AGIs $100k-200k, 97.9% for AGIs over 200k)
Averages for the 2012 tax year for zip code 49331, filed in 2013:
Average Adjusted Gross Income (AGI) in 2012: $55,656 (Individual Income Tax Returns)
Here:
$55,656
State:
$55,609
Salary/wage: $49,140 (reported on 86.7% of returns)
Here:
$49,140
State:
$46,782
(% of AGI for various income ranges: 73.2% for AGIs below $25k, 78.7% for AGIs $25k-50k, 79.8% for AGIs $50k-75k, 82.5% for AGIs $75k-100k, 81.8% for AGIs $100k-200k, 54.7% for AGIs over 200k)
Taxable interest for individuals: $1,048 (reported on 37.4% of returns)
This zip code:
$1,048
Michigan:
$1,491
(% of AGI for various income ranges: 1.0% for AGIs below $25k, 0.6% for AGIs $25k-50k, 0.5% for AGIs $50k-75k, 0.4% for AGIs $75k-100k, 0.6% for AGIs $100k-200k, 1.4% for AGIs over 200k)
Ordinary dividends: $2,978 (reported on 18.8% of returns)
Here:
$2,978
State:
$6,225
(% of AGI for various income ranges: 1.6% for AGIs below $25k, 0.6% for AGIs $25k-50k, 0.8% for AGIs $50k-75k, 0.6% for AGIs $75k-100k, 1.0% for AGIs $100k-200k, 1.8% for AGIs over 200k)
Net capital gain/loss in AGI: +$7,482 (reported on 14.3% of returns)
Here:
+$7,482
State:
+$9,326
(% of AGI for various income ranges: 0.1% for AGIs $25k-50k, 0.4% for AGIs $50k-75k, 0.7% for AGIs $75k-100k, 1.7% for AGIs $100k-200k, 8.5% for AGIs over 200k)
Profit/loss from business: +$9,702 (reported on 15.0% of returns)
Here:
+$9,702
State:
+$11,523
(% of AGI for various income ranges: 6.3% for AGIs below $25k, 2.1% for AGIs $25k-50k, 1.9% for AGIs $50k-75k, 1.9% for AGIs $75k-100k, 2.5% for AGIs $100k-200k, 3.2% for AGIs over 200k)
Taxable individual retirement arrangement distribution: $14,168 (reported on 10.9% of returns)
49331:
$14,168
Michigan:
$15,298
(% of AGI for various income ranges: 4.6% for AGIs below $25k, 3.4% for AGIs $25k-50k, 3.3% for AGIs $50k-75k, 2.6% for AGIs $75k-100k, 3.2% for AGIs $100k-200k)
Self-employment retirement plans: $15,433 (reported on 0.4% of returns)
49331:
$15,433
Michigan:
$20,834
Total itemized deductions: $19,249 (19% of AGI, reported on 34.2% of returns)
Here:
$19,249
State:
$21,628
Here:
19.0% of AGI
State:
18.4% of AGI
(% of AGI for various income ranges: 8.1% for AGIs below $25k, 9.1% for AGIs $25k-50k, 11.9% for AGIs $50k-75k, 12.7% for AGIs $75k-100k, 13.8% for AGIs $100k-200k, 11.3% for AGIs over 200k)
Charity contributions: $3,715 (reported on 28.3% of returns)
Here:
$3,715
State:
$4,225
(% of AGI for various income ranges: 0.8% for AGIs below $25k, 1.0% for AGIs $25k-50k, 1.7% for AGIs $50k-75k, 1.9% for AGIs $75k-100k, 2.4% for AGIs $100k-200k, 2.5% for AGIs over 200k)
Taxes paid: $7,314 (reported on 34.1% of returns)
49331:
$7,314
State:
$8,327
(% of AGI for various income ranges: 1.6% for AGIs below $25k, 2.5% for AGIs $25k-50k, 3.8% for AGIs $50k-75k, 4.5% for AGIs $75k-100k, 5.8% for AGIs $100k-200k, 5.9% for AGIs over 200k)
Earned income credit: $1,980 (reported on 13.4% of returns)
Here:
$1,980
State:
$2,306
(% of AGI for various income ranges: 4.6% for AGIs below $25k, 1.0% for AGIs $25k-50k)
Percentage of individuals using paid preparers for their 2012 taxes: 53.3%
Here:
53%
State:
57%
(% for various income ranges: 48.8% for AGIs below $25k, 53.9% for AGIs $25k-50k, 57.6% for AGIs $50k-75k, 55.7% for AGIs $75k-100k, 54.6% for AGIs $100k-200k, 70.6% for AGIs over 200k)
Averages for the 2004 tax year for zip code 49331, filed in 2005:
Average Adjusted Gross Income (AGI) in 2004: $48,154 (Individual Income Tax Returns)
Here:
$48,154
State:
$48,204
Salary/wage: $44,281 (reported on 88.6% of returns)
Here:
$44,281
State:
$42,791
(% of AGI for various income ranges: 126.1% for AGIs below $10k, 73.7% for AGIs $10k-25k, 82.2% for AGIs $25k-50k, 86.6% for AGIs $50k-75k, 88.9% for AGIs $75k-100k, 72.4% for AGIs over 100k)
Taxable interest for individuals: $1,162 (reported on 47.7% of returns)
This zip code:
$1,162
Michigan:
$1,725
(% of AGI for various income ranges: 5.4% for AGIs below $10k, 2.2% for AGIs $10k-25k, 1.1% for AGIs $25k-50k, 0.7% for AGIs $50k-75k, 0.7% for AGIs $75k-100k, 1.4% for AGIs over 100k)
Taxable dividends: $1,936 (reported on 23.7% of returns)
Here:
$1,936
State:
$3,420
(% of AGI for various income ranges: 3.5% for AGIs below $10k, 1.3% for AGIs $10k-25k, 0.7% for AGIs $25k-50k, 0.5% for AGIs $50k-75k, 0.4% for AGIs $75k-100k, 1.5% for AGIs over 100k)
Net capital gain/loss: +$7,866 (reported on 18.1% of returns)
Here:
+$7,866
State:
+$8,532
(% of AGI for various income ranges: 0.7% for AGIs below $10k, -0.1% for AGIs $10k-25k, 0.9% for AGIs $25k-50k, 0.5% for AGIs $50k-75k, 1.0% for AGIs $75k-100k, 7.8% for AGIs over 100k)
Profit/loss from business: +$9,554 (reported on 15.5% of returns)
Here:
+$9,554
State:
+$9,547
(% of AGI for various income ranges: 2.1% for AGIs below $10k, 5.9% for AGIs $10k-25k, 3.7% for AGIs $25k-50k, 2.7% for AGIs $50k-75k, 2.0% for AGIs $75k-100k, 3.1% for AGIs over 100k)
IRA payment deduction: $2,861 (reported on 2.2% of returns)
49331:
$2,861
Michigan:
$2,875
(% of AGI for various income ranges: 0.2% for AGIs $10k-25k, 0.2% for AGIs $25k-50k, 0.1% for AGIs $50k-75k, 0.1% for AGIs $75k-100k, 0.1% for AGIs over 100k)
Self-employed pension: $14,884 (reported on 0.6% of returns)
Here:
$14,884
Michigan:
$13,826
(% of AGI for various income ranges: 0.1% for AGIs $10k-25k, 0.1% for AGIs $50k-75k, 0.5% for AGIs over 100k)
Total itemized deductions: $16,938 (22% of AGI, reported on 42.3% of returns)
Here:
$16,938
State:
$18,509
Here:
21.6% of AGI
State:
20.7% of AGI
(% of AGI for various income ranges: 18.9% for AGIs below $10k, 10.8% for AGIs $10k-25k, 13.5% for AGIs $25k-50k, 16.0% for AGIs $50k-75k, 16.4% for AGIs $75k-100k, 14.5% for AGIs over 100k)
Charity contributions deductions: $2,945 (4% of AGI, reported on 36.2% of returns)
Here:
$2,945
State:
$3,365
Here:
3.6% of AGI
State:
3.6% of AGI
(% of AGI for various income ranges: 1.0% for AGIs below $10k, 1.3% for AGIs $10k-25k, 1.4% for AGIs $25k-50k, 2.0% for AGIs $50k-75k, 2.3% for AGIs $75k-100k, 3.0% for AGIs over 100k)
Total tax: $6,316 (reported on 77.7% of returns)
49331:
$6,316
State:
$7,691
(% of AGI for various income ranges: 2.7% for AGIs below $10k, 4.6% for AGIs $10k-25k, 6.5% for AGIs $25k-50k, 7.7% for AGIs $50k-75k, 9.5% for AGIs $75k-100k, 16.0% for AGIs over 100k)
Earned income credit: $1,530 (reported on 9.9% of returns)
Here:
$1,530
State:
$1,737
Percentage of individuals using paid preparers for their 2004 taxes: 56.4%
Here:
56%
State:
60%
(% for various income ranges: 47.5% for AGIs below $10k, 57.1% for AGIs $10k-25k, 59.1% for AGIs $25k-50k, 59.0% for AGIs $50k-75k, 53.9% for AGIs $75k-100k, 64.8% for AGIs over 100k)
Likely homosexual households (counted as self-reported same-sex unmarried-partner households)
Lesbian couples: 0.0% of all households
Gay men: 0.1% of all households
Household received Food Stamps/SNAP in the past 12 months: 428 Household did not receive Food Stamps/SNAP in the past 12 months: 6,442
Women who had a birth in the past 12 months: 128 (109 now married, 20 unmarried) Women who did not have a birth in the past 12 months: 4,033 (2,165 now married, 1,855 unmarried)
Housing units in zip code 49331 with a mortgage: 4,040 (371 second mortgage, 281 both second mortgage and home equity loan) Houses without a mortgage: 304
Median monthly owner costs for units with a mortgage: $1,610 Median monthly owner costs for units without a mortgage: $605
Residents with income below the poverty level in 2022:
This zip code:
6.1%
Whole state:
13.4%
Residents with income below 50% of the poverty level in 2022:
This zip code:
3.5%
Whole state:
6.9%
Median number of rooms in houses and condos:
Here:
7.2
State:
6.5
Median number of rooms in apartments:
Here:
3.7
State:
4.3
Notable locations in this zip code not listed on our city pages
Notable locations in zip code 49331: Deer Run Golf Course (A), Alton Station (B), Arrowhead Golf Club (C), Lowell Fairgrounds (D), Lowell Station (E), Lowell Area Fire Department (F), Lowell Area Historical Museum (G), Lowell City Hall (H), Lowell Police Department (I), Englehardt Library (J), Honey Creek Childrens Home (K). Display/hide their locations on the map
Churches in zip code 49331 include: South Boston Church (A), Vergennes Church (B), Alton Bible Church (C), Lowell First United Methodist Church (D), Church of the Nazarene (E), Congregational Church (F), Saint Mary Church (G), Evergreen Missionary Church (H), Impact of Wesleyan Church (I). Display/hide their locations on the map
Cemeteries: McBride Cemetery (1), Krum Cemetery (2), Vergennes Cemetery (3), Fallass Cemetery (4), Alton Cemetery (5), Parnell Cemetery (6), Fox's Corner Cemetery (7). Display/hide their locations on the map
Lakes: Pratt Lake (A), Lewis Lake (B), Murray Lake (C), Howard Lake (D), Morse Lake (E), McEwen Lake (F), Swan Ponds (G), Cole Lake (H). Display/hide their locations on the map
Rivers and creeks: Toles Creek (A), Dairy Farm Creek (B), Page Creek (C), Flat River (D), Lee Creek (E), Pratt Lake Creek (F). Display/hide their locations on the map
Parks in zip code 49331 include: Upper Bridge Park (1), Rogers Field (2), Richards Park (3), Recreation Park (4), Grand River Riverfront Park (5), Stoney Lakeside Park and Dog Park (6), Creekside Park (7), Cooper Woodland Preserve (8), McMahen Park (9). Display/hide their locations on the map
In group quarters: 180 (-1 institutionalized population)
Size of family households: 2,383 2-persons, 1,163 3-persons, 925 4-persons, 342 5-persons, 119 6-persons, 66 7-or-more-persons
Size of nonfamily households: 1,388 1-person, 403 2-persons, 92 3-persons
2,952 married couples with children.
842 single-parent households (130 men, 712 women).
96.5% of residents of 49331 zip code speak English at home.
1.1% of residents speak Spanish at home (73% very well, 9% well, 18% not well, 1% not at all).
1.4% of residents speak other Indo-European language at home (46% very well, 15% well, 39% not well).
0.4% of residents speak Asian or Pacific Island language at home (37% very well, 63% not well).
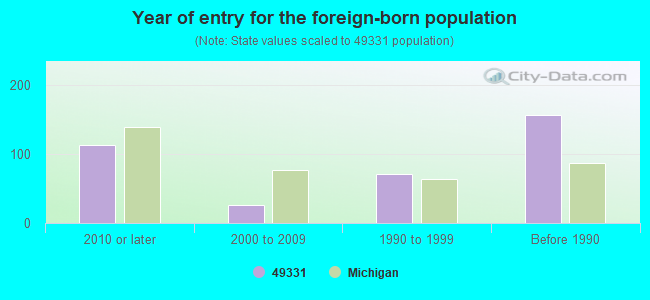
Foreign born population: 226 (1.3%) (33.5% of them are naturalized citizens)
This zip code:
1.3%
Whole state:
6.9%
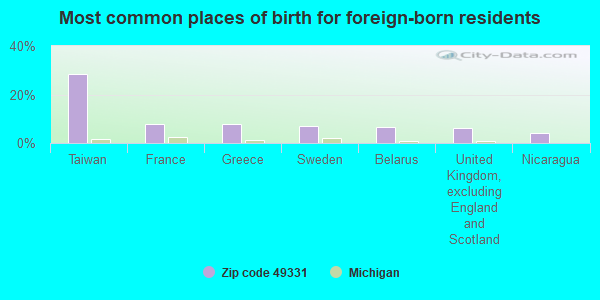
28%Taiwan
8%France
8%Greece
7%Sweden
7%Belarus
6%United Kingdom, excluding England and Scotland
4%Nicaragua
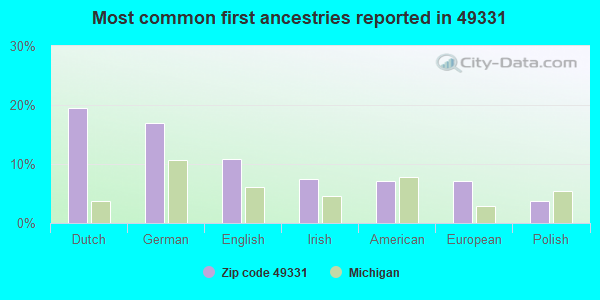
19%Dutch
17%German
11%English
7%Irish
7%American
7%European
4%Polish
Year of entry for the foreign-born population
1132010 or later
262000 to 2009
711990 to 1999
157Before 1990
Major facilities with environmental interests located in this zip code:
ATTWOOD CORPORATION (1016 N MONROE in LOWELL, MI)
AIR MINOR (AIRS/AFS) (Integrated Compliance Information System) - ICIS-05-1988-0108, FORMAL ENFORCEMENT ACTION COMPLIANCE ACTIVITY (Tracking inspections of insecticide, fungicide, and rodenticide, and toxic substances) CRITERIA AND HAZARDOUS AIR POLLUTANT INVENTORY (Inventory of air pollution sources) Conditionally Exempt Small Quantity Generators, less than 100 kg/month of hazardous waste (Resource Conservation and Recovery Act (tracking hazardous waste)) TRI REPORTER (Tracking of toxic chemicals releasing facilities) Business SIC classification: UNSUPPORTED PLASTICS PROFILE SHAPES; PLASTICS PRODUCTS; NONFERROUS DIE-CASTINGS, EXCEPT ALUMINUM; ELECTROPLATING, PLATING, POLISHING, ANODIZING, AND COLORING Business NAICS classification: OFFICE FURNITURE (EXCEPT WOOD) MANUFACTURING. Organizations: STEELCASE (CONTACT/OPERATOR)
CHERRY CREEK ELEMENTARY SCHOOL (12675 FORMAN ROAD in LOWELL, MI)
(National Center for Education Statistics) - STATE ID-08003 Organizations: LOWELL AREA SCHOOLS (SCHOOL DISTRICT)
ADMIRAL PETROLEUM CORP (2001 W MAIN in LOWELL, MI)
(Resource Conservation and Recovery Act (tracking hazardous waste)) Conditionally Exempt Small Quantity Generators, less than 100 kg/month of hazardous waste (Resource Conservation and Recovery Act (tracking hazardous waste)) Organizations: DENNIS LEMMEN (CONTACT/OPERATOR)
AMOCO OIL CO (403 W MAIN AND HUDSON in LOWELL, MI)
(Resource Conservation and Recovery Act (tracking hazardous waste)) Organizations: AMOCO OIL COMPANY (CONTACT/OWNER)
, B P PRODUCTS N AMERICA INC (CONTACT/OWNER)
Alternative names: AMOCO OIL CO 0036
413 MAIN STREET INVESTMENTS LLC (413 E MAIN in LOWELL, MI)
(Resource Conservation and Recovery Act (tracking hazardous waste))
METRIC MANUFACTURING CO INC (1001 FOREMAN RD in LOWELL, MI)
(Resource Conservation and Recovery Act (tracking hazardous waste))
ACTION AUTO STORE 064 (2001 W MAIN ST in LOWELL, MI)
(Resource Conservation and Recovery Act (tracking hazardous waste))
BIG BARNEYS FAST FREIGHT (I-96 WEST MM 4905 in LOWELL, MI)
(Resource Conservation and Recovery Act (tracking hazardous waste)) Alternative names: BIG BARNEYS FAST FREIGHT (E)
MI DEPT/ENVIRONMENTAL QUALITY (WHITES BRIDGE RD in LOWELL, MI)
(Resource Conservation and Recovery Act (tracking hazardous waste)) Alternative names: WHITES BRIDGE ROAD AREA
AERO LIQUID TRANSIT INC (13565 GRAND RIVER DR in LOWELL, MI)
TRANSPORTER (Resource Conservation and Recovery Act (tracking hazardous waste)) Organizations: BIELIK J BRILL R KOZERA D PETTENGILL T (CONTACT/OPERATOR)
BOBS BODY SHOP (689 LINCOLN LAKE RD in LOWELL, MI)
Conditionally Exempt Small Quantity Generators, less than 100 kg/month of hazardous waste (Resource Conservation and Recovery Act (tracking hazardous waste)) - notification Organizations: WILCZEWSKI ROBERT (CONTACT/OWNER)
MEIJER INC (11901 FULTON in LOWELL, MI)
Conditionally Exempt Small Quantity Generators, less than 100 kg/month of hazardous waste (Resource Conservation and Recovery Act (tracking hazardous waste)) Business NAICS classification: DISCOUNT DEPARTMENT STORES. Alternative names: MEIJER INC 205
Housing units lacking complete plumbing facilities: 0.2% Housing units lacking complete kitchen facilities: 0.2%
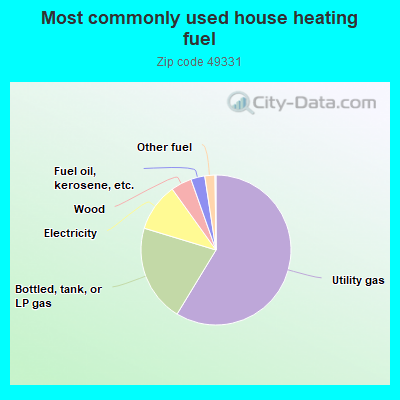
58.7%Utility gas
21.0%Bottled, tank, or LP gas
10.4%Electricity
4.5%Wood
3.0%Fuel oil, kerosene, etc.
2.2%Other fuel
Population in 1990: 12,732. Population change in the 1990s: +1,957 (+15.4%).
Place of birth for U.S.-born residents:
This state: 15,009
Northeast: 266
Midwest: 854
South: 669
West: 282
61% of the 49331 zip code residents lived in the same house 5 years ago. Out of people who lived in different houses, 68% lived in this county. Out of people who lived in different counties, 50% lived in Michigan.
93% of the 49331 zip code residents lived in the same house 1 year ago. Out of people who lived in different houses, 31% moved from this county. Out of people who lived in different houses, 37% moved from different county within same state. Out of people who lived in different houses, 36% moved from different state.
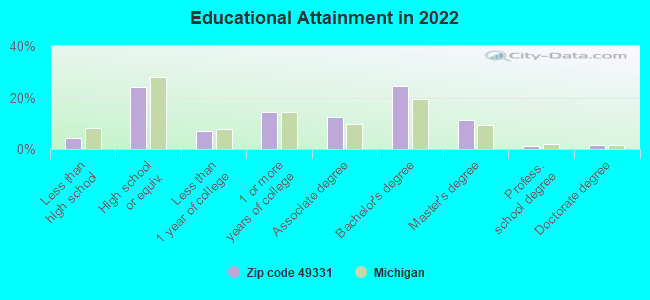
Private vs. public school enrollment:
Students in private schools in grades 1 to 8 (elementary and middle school): 150
Here:
8.9%
Michigan:
12.4%
Students in private schools in grades 9 to 12 (high school): 75
Here:
9.0%
Michigan:
9.8%
Students in private undergraduate colleges: 76
Here:
14.1%
Michigan:
14.9%
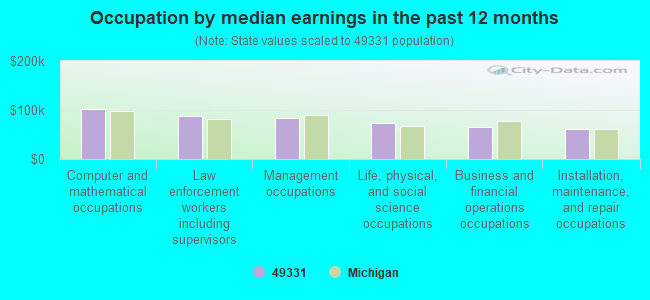
Occupation by median earnings in the past 12 months ($)
101,715Computer and mathematical occupations
88,640Law enforcement workers including supervisors
83,536Management occupations
74,229Life, physical, and social science occupations
65,516Business and financial operations occupations
61,673Installation, maintenance, and repair occupations
Companies with federal contracts located in this zip code:
ULTRA TWISTED PAINTBALL (665 HUNT ST in LOWELL, MI; small business)
$25,709 with Army for Training Aids. Signed on 2006-05-15. Completion date: 2006-05-25.
Top industries in this zip code by the number of employees in 2005:
Health Care and Social Assistance: Nursing Care Facilities (100-249 employees: 1 establishment)
Administrative and Support and Waste Management and Remediation Services: Temporary Help Services (100-249: 1)
Health Care and Social Assistance: Home Health Care Services (100-249: 1)
People in group quarters in 2010:
139 people in nursing facilities/skilled-nursing facilities
37 people in group homes intended for adults
14 people in other noninstitutional facilities
People in group quarters in 2000:
294 people in nursing homes
59 people in other noninstitutional group quarters
51 people in agriculture workers' dormitories on farms
18 people in religious group quarters
6 people in homes for the mentally retarded
6 people in other group homes
Fatal accident statistics in 2014:
Fatal accident count: 2
Vehicles involved in fatal accidents: 5
Fatal accidents caused by drunken drivers: 1
Fatalities: 2
Persons involved in fatal accidents: 10
Pedestrians involved in fatal accidents: 2
Fatal accident statistics in 2013:
Fatal accident count: 2
Vehicles involved in fatal accidents: 3
Fatal accidents caused by drunken drivers: 1
Fatalities: 2
Persons involved in fatal accidents: 3
Pedestrians involved in fatal accidents: 0
Home Mortgage Disclosure Act Aggregated Statistics For Year 2009 (Based on 2 full and 8 partial tracts)
A) FHA, FSA/RHS & VA Home Purchase Loans
B) Conventional Home Purchase Loans
C) Refinancings
D) Home Improvement Loans
F) Non-occupant Loans on < 5 Family Dwellings (A B C & D)
G) Loans On Manufactured Home Dwelling (A B C & D)
Number
Average Value
Number
Average Value
Number
Average Value
Number
Average Value
Number
Average Value
Number
Average Value
LOANS ORIGINATED
149
$132,001
103
$131,557
782
$148,992
24
$75,592
46
$110,112
11
$72,192
APPLICATIONS APPROVED, NOT ACCEPTED
8
$128,614
10
$121,359
61
$180,190
0
$0
1
$97,730
5
$59,062
APPLICATIONS DENIED
34
$91,533
24
$104,967
236
$184,755
29
$26,240
9
$111,969
6
$61,028
APPLICATIONS WITHDRAWN
24
$93,127
22
$135,194
173
$156,375
9
$66,834
3
$152,823
1
$31,760
FILES CLOSED FOR INCOMPLETENESS
6
$151,428
7
$135,301
31
$155,740
6
$127,733
0
$0
2
$14,045
Aggregated Statistics For Year 2008 (Based on 2 full and 8 partial tracts)
A) FHA, FSA/RHS & VA Home Purchase Loans
B) Conventional Home Purchase Loans
C) Refinancings
D) Home Improvement Loans
E) Loans on Dwellings For 5+ Families
F) Non-occupant Loans on < 5 Family Dwellings (A B C & D)
G) Loans On Manufactured Home Dwelling (A B C & D)
Number
Average Value
Number
Average Value
Number
Average Value
Number
Average Value
Number
Average Value
Number
Average Value
Number
Average Value
LOANS ORIGINATED
131
$129,446
192
$140,536
448
$143,646
73
$34,922
7
$660,574
29
$91,009
23
$53,019
APPLICATIONS APPROVED, NOT ACCEPTED
10
$114,546
14
$118,392
49
$135,257
11
$84,381
0
$0
6
$97,402
3
$62,077
APPLICATIONS DENIED
36
$119,961
63
$85,394
235
$142,719
35
$73,089
0
$0
18
$102,011
26
$47,347
APPLICATIONS WITHDRAWN
19
$113,152
18
$168,065
110
$135,949
4
$25,712
0
$0
2
$89,790
4
$106,770
FILES CLOSED FOR INCOMPLETENESS
2
$155,345
7
$148,601
41
$166,402
1
$18,460
0
$0
11
$135,995
0
$0
Aggregated Statistics For Year 2007 (Based on 2 full and 8 partial tracts)
A) FHA, FSA/RHS & VA Home Purchase Loans
B) Conventional Home Purchase Loans
C) Refinancings
D) Home Improvement Loans
F) Non-occupant Loans on < 5 Family Dwellings (A B C & D)
G) Loans On Manufactured Home Dwelling (A B C & D)
Number
Average Value
Number
Average Value
Number
Average Value
Number
Average Value
Number
Average Value
Number
Average Value
LOANS ORIGINATED
36
$126,492
310
$126,119
538
$146,386
101
$49,882
45
$113,387
45
$62,441
APPLICATIONS APPROVED, NOT ACCEPTED
4
$121,202
50
$73,643
128
$143,537
9
$62,920
14
$95,369
21
$28,553
APPLICATIONS DENIED
13
$134,696
104
$98,835
343
$133,249
59
$37,150
32
$104,937
36
$37,713
APPLICATIONS WITHDRAWN
0
$0
32
$114,562
142
$154,059
14
$90,688
9
$156,651
8
$49,818
FILES CLOSED FOR INCOMPLETENESS
0
$0
12
$130,940
52
$139,284
6
$32,052
2
$107,320
0
$0
Aggregated Statistics For Year 2006 (Based on 2 full and 8 partial tracts)
A) FHA, FSA/RHS & VA Home Purchase Loans
B) Conventional Home Purchase Loans
C) Refinancings
D) Home Improvement Loans
F) Non-occupant Loans on < 5 Family Dwellings (A B C & D)
G) Loans On Manufactured Home Dwelling (A B C & D)
Number
Average Value
Number
Average Value
Number
Average Value
Number
Average Value
Number
Average Value
Number
Average Value
LOANS ORIGINATED
30
$120,422
397
$133,830
674
$129,459
123
$40,467
63
$103,825
39
$69,186
APPLICATIONS APPROVED, NOT ACCEPTED
2
$174,435
52
$103,621
127
$138,190
14
$25,560
8
$116,492
10
$27,567
APPLICATIONS DENIED
10
$128,933
131
$101,454
394
$137,443
52
$52,629
23
$82,786
35
$58,536
APPLICATIONS WITHDRAWN
2
$133,845
45
$113,553
250
$143,993
23
$62,784
10
$98,442
7
$76,189
FILES CLOSED FOR INCOMPLETENESS
2
$98,065
8
$152,942
57
$153,662
7
$69,420
0
$0
1
$157,080
Aggregated Statistics For Year 2005 (Based on 2 full and 8 partial tracts)
A) FHA, FSA/RHS & VA Home Purchase Loans
B) Conventional Home Purchase Loans
C) Refinancings
D) Home Improvement Loans
F) Non-occupant Loans on < 5 Family Dwellings (A B C & D)
G) Loans On Manufactured Home Dwelling (A B C & D)
Number
Average Value
Number
Average Value
Number
Average Value
Number
Average Value
Number
Average Value
Number
Average Value
LOANS ORIGINATED
30
$127,882
467
$123,435
910
$138,893
125
$49,536
60
$105,657
35
$61,932
APPLICATIONS APPROVED, NOT ACCEPTED
0
$0
74
$119,639
165
$133,862
8
$47,391
14
$147,062
9
$58,541
APPLICATIONS DENIED
10
$118,106
123
$84,806
473
$140,322
58
$42,648
29
$77,489
60
$63,863
APPLICATIONS WITHDRAWN
2
$116,725
46
$103,101
313
$148,110
24
$106,482
12
$101,689
6
$76,390
FILES CLOSED FOR INCOMPLETENESS
6
$112,743
15
$114,635
76
$147,011
2
$52,235
1
$107,730
2
$149,025
Aggregated Statistics For Year 2004 (Based on 2 full and 8 partial tracts)
A) FHA, FSA/RHS & VA Home Purchase Loans
B) Conventional Home Purchase Loans
C) Refinancings
D) Home Improvement Loans
F) Non-occupant Loans on < 5 Family Dwellings (A B C & D)
G) Loans On Manufactured Home Dwelling (A B C & D)
Number
Average Value
Number
Average Value
Number
Average Value
Number
Average Value
Number
Average Value
Number
Average Value
LOANS ORIGINATED
39
$118,895
481
$136,626
935
$133,436
142
$52,667
44
$103,903
39
$56,731
APPLICATIONS APPROVED, NOT ACCEPTED
9
$107,182
54
$158,268
175
$125,510
14
$50,011
4
$103,122
20
$57,494
APPLICATIONS DENIED
3
$120,343
137
$97,116
409
$127,335
61
$43,610
13
$121,817
73
$46,242
APPLICATIONS WITHDRAWN
7
$100,276
51
$122,232
193
$138,617
27
$85,147
10
$122,503
7
$77,016
FILES CLOSED FOR INCOMPLETENESS
0
$0
24
$73,107
109
$135,181
4
$112,988
3
$129,893
10
$40,628
Aggregated Statistics For Year 2003 (Based on 2 full and 6 partial tracts)
A) FHA, FSA/RHS & VA Home Purchase Loans
B) Conventional Home Purchase Loans
C) Refinancings
D) Home Improvement Loans
F) Non-occupant Loans on < 5 Family Dwellings (A B C & D)
Number
Average Value
Number
Average Value
Number
Average Value
Number
Average Value
Number
Average Value
LOANS ORIGINATED
39
$120,873
426
$138,332
2,433
$129,663
129
$37,035
94
$108,839
APPLICATIONS APPROVED, NOT ACCEPTED
0
$0
45
$113,726
251
$129,273
7
$23,247
10
$66,024
APPLICATIONS DENIED
2
$102,690
95
$81,866
382
$122,991
43
$30,253
13
$68,729
APPLICATIONS WITHDRAWN
2
$111,520
56
$134,396
332
$122,168
9
$28,183
9
$44,293
FILES CLOSED FOR INCOMPLETENESS
0
$0
10
$116,597
70
$117,442
4
$30,138
1
$150,240
Aggregated Statistics For Year 2002 (Based on 4 partial tracts)
A) FHA, FSA/RHS & VA Home Purchase Loans
B) Conventional Home Purchase Loans
C) Refinancings
D) Home Improvement Loans
E) Loans on Dwellings For 5+ Families
F) Non-occupant Loans on < 5 Family Dwellings (A B C & D)
Number
Average Value
Number
Average Value
Number
Average Value
Number
Average Value
Number
Average Value
Number
Average Value
LOANS ORIGINATED
5
$153,550
94
$156,417
514
$134,286
35
$30,880
1
$361,170
12
$117,368
APPLICATIONS APPROVED, NOT ACCEPTED
1
$97,990
9
$153,517
53
$119,905
4
$23,678
0
$0
3
$77,603
APPLICATIONS DENIED
0
$0
8
$114,016
74
$135,063
11
$14,417
0
$0
2
$56,985
APPLICATIONS WITHDRAWN
0
$0
6
$145,718
59
$141,501
2
$30,320
0
$0
1
$275,820
FILES CLOSED FOR INCOMPLETENESS
0
$0
1
$85,880
21
$116,140
3
$48,707
0
$0
1
$80,260
Aggregated Statistics For Year 2001 (Based on 4 partial tracts)
A) FHA, FSA/RHS & VA Home Purchase Loans
B) Conventional Home Purchase Loans
C) Refinancings
D) Home Improvement Loans
F) Non-occupant Loans on < 5 Family Dwellings (A B C & D)
Number
Average Value
Number
Average Value
Number
Average Value
Number
Average Value
Number
Average Value
LOANS ORIGINATED
4
$106,168
79
$152,446
367
$125,420
47
$28,431
10
$108,049
APPLICATIONS APPROVED, NOT ACCEPTED
0
$0
4
$138,448
43
$128,137
10
$46,529
1
$154,580
APPLICATIONS DENIED
2
$87,885
14
$72,256
61
$97,114
10
$21,607
1
$24,080
APPLICATIONS WITHDRAWN
0
$0
7
$150,214
42
$119,471
3
$30,770
0
$0
FILES CLOSED FOR INCOMPLETENESS
2
$51,770
2
$210,280
14
$134,691
2
$24,080
0
$0
Aggregated Statistics For Year 2000 (Based on 4 partial tracts)
A) FHA, FSA/RHS & VA Home Purchase Loans
B) Conventional Home Purchase Loans
C) Refinancings
D) Home Improvement Loans
F) Non-occupant Loans on < 5 Family Dwellings (A B C & D)
Number
Average Value
Number
Average Value
Number
Average Value
Number
Average Value
Number
Average Value
LOANS ORIGINATED
4
$119,160
89
$132,898
119
$106,728
57
$21,404
8
$62,719
APPLICATIONS APPROVED, NOT ACCEPTED
0
$0
8
$152,038
15
$99,158
9
$38,314
0
$0
APPLICATIONS DENIED
1
$57,510
26
$97,085
34
$87,043
14
$32,806
2
$106,640
APPLICATIONS WITHDRAWN
0
$0
3
$83,163
15
$118,043
3
$83,213
0
$0
FILES CLOSED FOR INCOMPLETENESS
0
$0
2
$20,065
12
$102,972
0
$0
0
$0
Aggregated Statistics For Year 1999 (Based on 3 partial tracts)
A) FHA, FSA/RHS & VA Home Purchase Loans
B) Conventional Home Purchase Loans
C) Refinancings
D) Home Improvement Loans
F) Non-occupant Loans on < 5 Family Dwellings (A B C & D)
2002 - 2018 National Fire Incident Reporting System (NFIRS) incidents
According to the data from the years 2002 - 2018 the average number of fires per year is 50. The highest number of fire incidents - 83 took place in 2003, and the least - 27 in 2013. The data has a rising trend.
When looking into fire subcategories, the most incidents belonged to: Structure Fires (43.0%), and Outside Fires (36.1%).
Fire incident types reported to NFIRS in Zip Code 49331


 Nearest zip codes: 49301, 49302, 48815, 48881, 48809, 49546.


 According to the data from the years 2002 - 2018 the average number of fires per year is 50. The highest number of fire incidents - 83 took place in 2003, and the least - 27 in 2013. The data has a rising trend.
 When looking into fire subcategories, the most incidents belonged to: Structure Fires (43.0%), and Outside Fires (36.1%).