Races in Greater Carrollwood, Florida (FL) Detailed Stats
Ancestries, Foreign-born residents, place of birth

Recent posts about races in Greater Carrollwood, Florida on our local forum with over 2,400,000 registered users:
 | Safety of Temple Terrace (62 replies) |
| house with mature trees (78 replies) |
| Talk to me about Lutz...(considering relocating) (16 replies) |
| Careful of the FL alligators (46 replies) |
| Schools in Tampa, ratings? (8 replies) |
13.6% of Greater Carrollwood, FL residents are foreign-born (7.3% born in Latin America, 3.2% born in Asia, 2.4% born in Europe), which is 54.7% less than the foreign-born rate of 21.0% across the entire state of Florida.
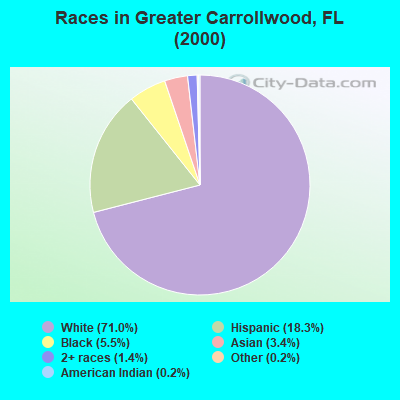
Race distribution in Greater Carrollwood

- 23,80871.0%White alone
- 6,13118.3%Hispanic
- 1,8345.5%Black alone
- 1,1333.4%Asian alone
- 4751.4%Two or more races
- 630.2%Other race alone
- 590.2%American Indian alone
- 160.05%Native Hawaiian and Other
Pacific Islander alone
2000
2022
-
- 10,458,50965.4%White alone
- 2,682,71516.8%Hispanic
- 2,264,26814.2%Black alone
- 261,6931.6%Asian alone
- 236,9541.5%Two or more races
- 42,3580.3%American Indian alone
- 28,9940.2%Other race alone
- 6,8870.04%Native Hawaiian and Other
Pacific Islander alone

-
- 11,309,40350.8%White alone
- 6,025,03927.1%Hispanic
- 3,241,01514.6%Black alone
- 861,6303.9%Two or more races
- 623,6922.8%Asian alone
- 152,0540.7%Other race alone
- 22,5040.1%American Indian alone
- 9,4860.04%Native Hawaiian and Other
Pacific Islander alone

Income and house value in Greater Carrollwood
- Median household income in 2022
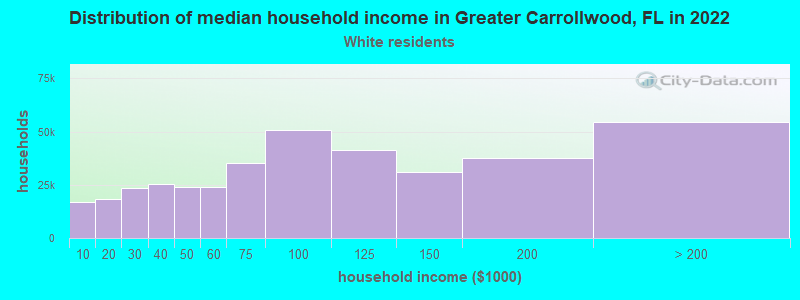
- $103,160White non-Hispanic householders
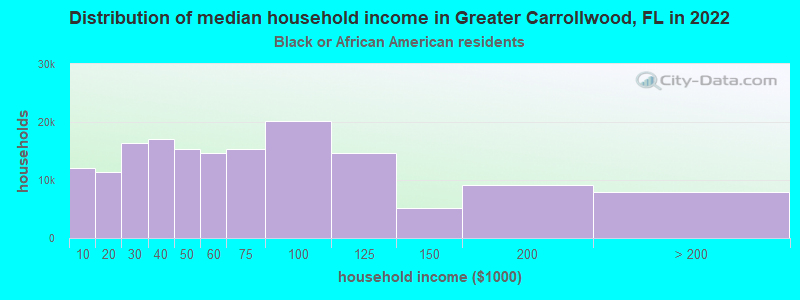
- $92,867Black householders
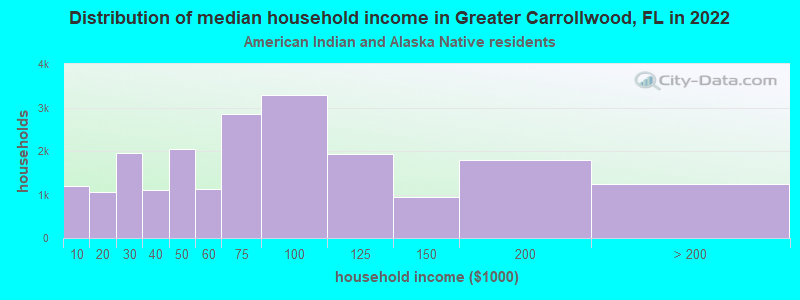
- $48,586American Indian and Alaska Native householders
- $107,234Asian householders
- $71,334Some other race householders
- $109,053Two or more races householders
- $79,378Hispanic or Latino race householders
- Median 2022 house value
- $520,374White Non-Hispanic householders
- $372,895Black or African American householders
- $379,689American Indian or Alaska Native householders
- $508,384Asian householders
- $346,116Some other race householders
- $360,505Two or more races householders
- $367,299Hispanic or Latino householders
Household income for White non-Hispanic householders
Household income for Black householders
Household income for American Indian and Alaska Native householders
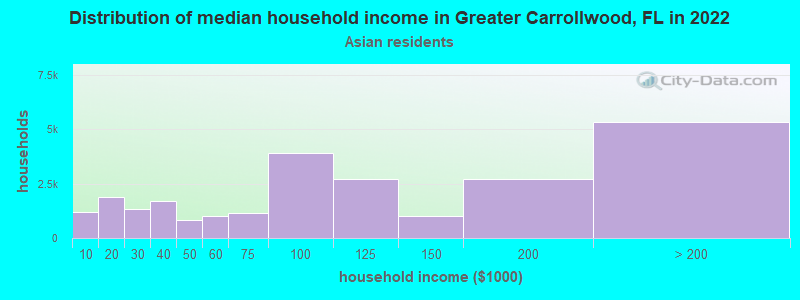
Household income for Asian householders
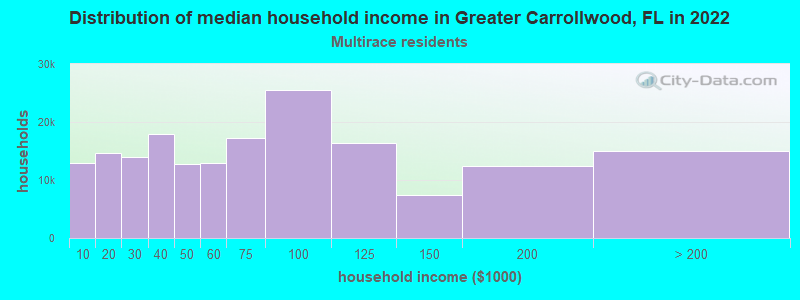
Household income for Two or more races householders
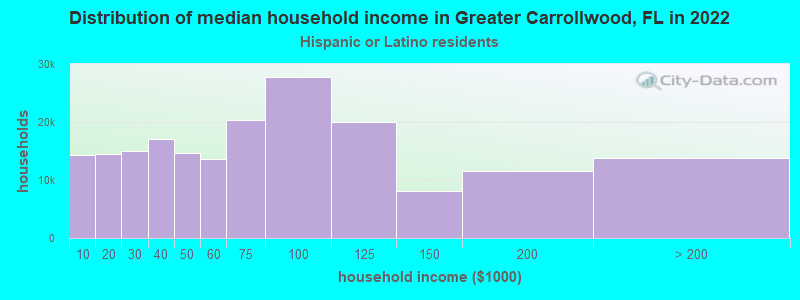
Household income for Hispanic or Latino race householders
Foreign-born residents in Greater Carrollwood
4,550 residents are foreign born (7.3% Latin America, 3.2% Asia, 2.4% Europe).
| This city: | 13.6% |
| Florida: | 16.7% |
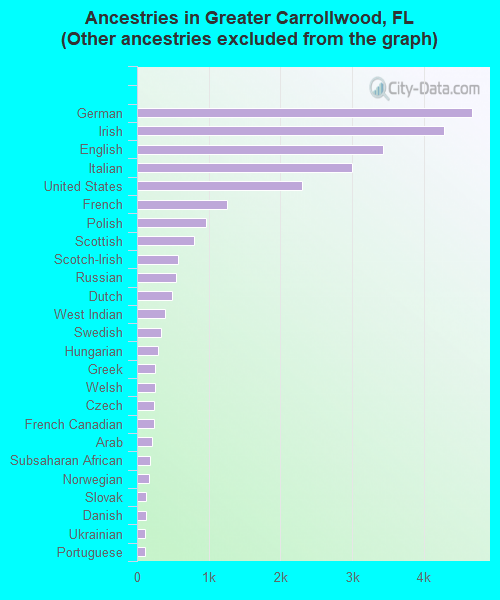
Ancestries in Greater Carrollwood

- 11,77131.7%Other
- 4,67512.6%German
- 4,28111.5%Irish
- 3,4329.2%English
- 2,9928.0%Italian
- 2,3066.2%United States
- 1,2523.4%French
- 9622.6%Polish
- 7982.1%Scottish
- 5651.5%Scotch-Irish
- 5431.5%Russian
- 4931.3%Dutch
- 3901.0%West Indian
- 3400.9%Swedish
- 2990.8%Hungarian
- 2560.7%Greek
- 2540.7%Welsh
- 2420.7%Czech
- 2310.6%French Canadian
- 2050.6%Arab
- 1850.5%Subsaharan African
- 1670.4%Norwegian
- 1240.3%Slovak
- 1230.3%Danish
- 1160.3%Ukrainian
- 1110.3%Portuguese
- 450.1%Lithuanian
- 250.07%Swiss
Zip codes: 33624.