Races in Kendale Lakes, Florida (FL) Detailed Stats
Data:
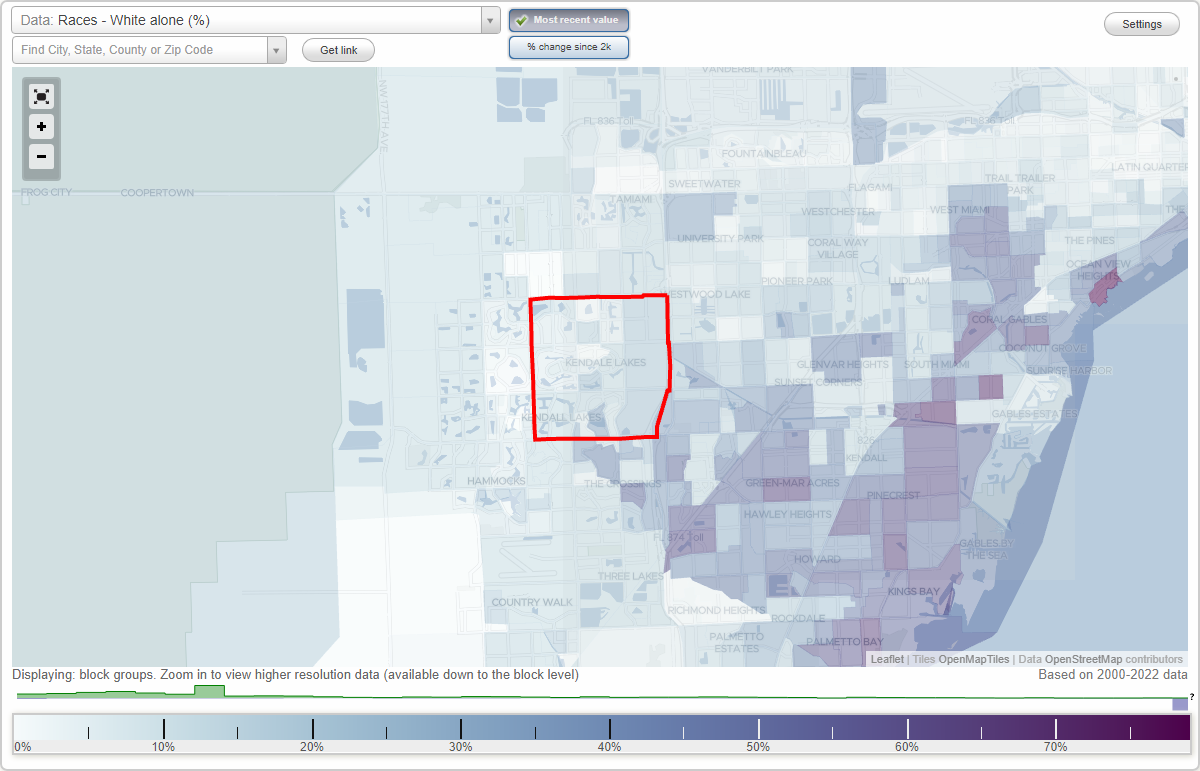
Races - White alone (%)
Races - White alone (% change since 2000)
Races - Black alone (%)
Races - Black alone (% change since 2000)
Races - American Indian alone (%)
Races - American Indian alone (% change since 2000)
Races - Asian alone (%)
Races - Asian alone (% change since 2000)
Races - Hispanic (%)
Races - Hispanic (% change since 2000)
Races - Native Hawaiian and Other Pacific Islander alone (%)
Races - Native Hawaiian and Other Pacific Islander alone (% change since 2000)
Races - Two or more races(%)
Races - Two or more races(% change since 2000)
Races - Other race alone (%)
Races - Other race alone (% change since 2000)
Racial diversity
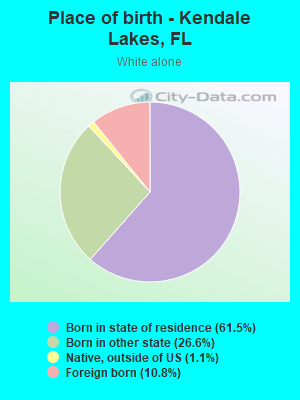
Place of birth - Born in state of residence (%)
Place of birth - Born in state of residence (%) - White
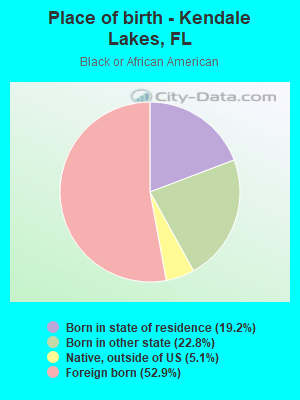
Place of birth - Born in state of residence (%) - Black or African American
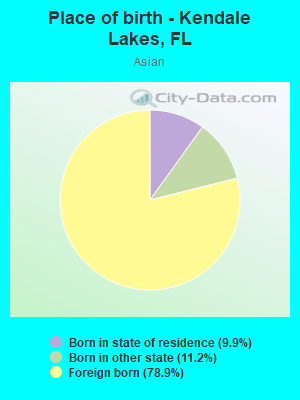
Place of birth - Born in state of residence (%) - Asian
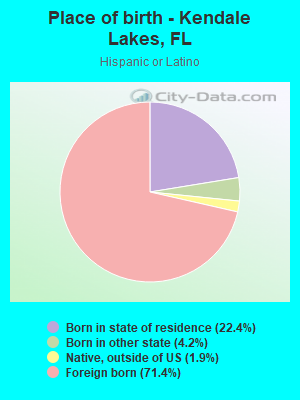
Place of birth - Born in state of residence (%) - Hispanic or Latino
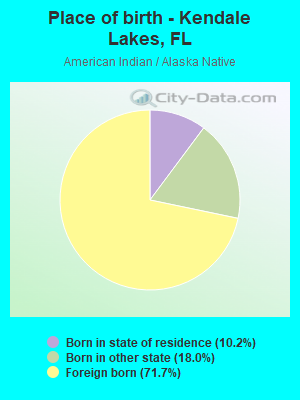
Place of birth - Born in state of residence (%) - American Indian and Alaska Native
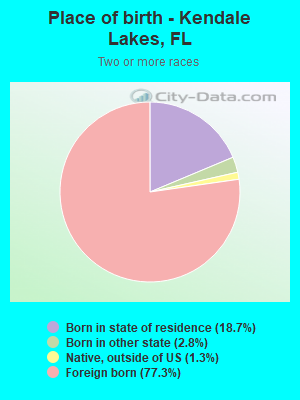
Place of birth - Born in state of residence (%) - Multirace
Place of birth - Born in state of residence (%) - Other Race
Place of birth - Born in other state (%)
Place of birth - Born in other state (%) - White
Place of birth - Born in other state (%) - Black or African American
Place of birth - Born in other state (%) - Asian
Place of birth - Born in other state (%) - Hispanic or Latino
Place of birth - Born in other state (%) - American Indian and Alaska Native
Place of birth - Born in other state (%) - Multirace
Place of birth - Born in other state (%) - Other Race
Place of birth - Native, outside of US (%)
Place of birth - Native, outside of US (%) - White
Place of birth - Native, outside of US (%) - Black or African American
Place of birth - Native, outside of US (%) - Asian
Place of birth - Native, outside of US (%) - Hispanic or Latino
Place of birth - Native, outside of US (%) - American Indian and Alaska Native
Place of birth - Native, outside of US (%) - Multirace
Place of birth - Native, outside of US (%) - Other Race
Place of birth - Foreign born (%)
Place of birth - Foreign born (%) - White
Place of birth - Foreign born (%) - Black or African American
Place of birth - Foreign born (%) - Asian
Place of birth - Foreign born (%) - Hispanic or Latino
Place of birth - Foreign born (%) - American Indian and Alaska Native
Place of birth - Foreign born (%) - Multirace
Place of birth - Foreign born (%) - Other Race
Residents speaking English at home (%)
Residents speaking English at home - Born in the United States (%)
Residents speaking English at home - Native, born elsewhere (%)
Residents speaking English at home - Foreign born (%)
Residents speaking Spanish at home (%)
Residents speaking Spanish at home - Born in the United States (%)
Residents speaking Spanish at home - Native, born elsewhere (%)
Residents speaking Spanish at home - Foreign born (%)
Residents speaking other language at home (%)
Residents speaking other language at home - Born in the United States (%)
Residents speaking other language at home - Native, born elsewhere (%)
Residents speaking other language at home - Foreign born (%)
Marital status - Never married (%)
Marital status - Now married (%)
Marital status - Separated (%)
Marital status - Widowed (%)
Marital status - Divorced (%)
Ancestries Reported - Arab (%)
Ancestries Reported - Czech (%)
Ancestries Reported - Danish (%)
Ancestries Reported - Dutch (%)
Ancestries Reported - English (%)
Ancestries Reported - French (%)
Ancestries Reported - French Canadian (%)
Ancestries Reported - German (%)
Ancestries Reported - Greek (%)
Ancestries Reported - Hungarian (%)
Ancestries Reported - Irish (%)
Ancestries Reported - Italian (%)
Ancestries Reported - Lithuanian (%)
Ancestries Reported - Norwegian (%)
Ancestries Reported - Polish (%)
Ancestries Reported - Portuguese (%)
Ancestries Reported - Russian (%)
Ancestries Reported - Scotch-Irish (%)
Ancestries Reported - Scottish (%)
Ancestries Reported - Slovak (%)
Ancestries Reported - Subsaharan African (%)
Ancestries Reported - Swedish (%)
Ancestries Reported - Swiss (%)
Ancestries Reported - Ukrainian (%)
Ancestries Reported - United States (%)
Ancestries Reported - Welsh (%)
Ancestries Reported - West Indian (%)
Ancestries Reported - Other (%)
Geographical mobility - Same house 1 year ago (%)
Geographical mobility - Same house 1 year ago (%) - White
Geographical mobility - Same house 1 year ago (%) - Black or African American
Geographical mobility - Same house 1 year ago (%) - Asian
Geographical mobility - Same house 1 year ago (%) - Hispanic or Latino
Geographical mobility - Same house 1 year ago (%) - American Indian and Alaska Native
Geographical mobility - Same house 1 year ago (%) - Multirace
Geographical mobility - Same house 1 year ago (%) - Other Race
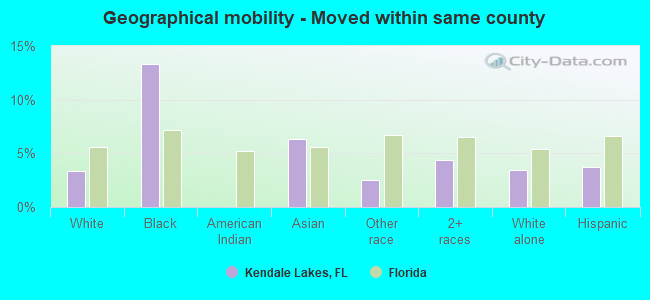
Geographical mobility - Moved within same county (%)
Geographical mobility - Moved within same county (%) - White
Geographical mobility - Moved within same county (%) - Black or African American
Geographical mobility - Moved within same county (%) - Asian
Geographical mobility - Moved within same county (%) - Hispanic or Latino
Geographical mobility - Moved within same county (%) - American Indian and Alaska Native
Geographical mobility - Moved within same county (%) - Multirace
Geographical mobility - Moved within same county (%) - Other Race
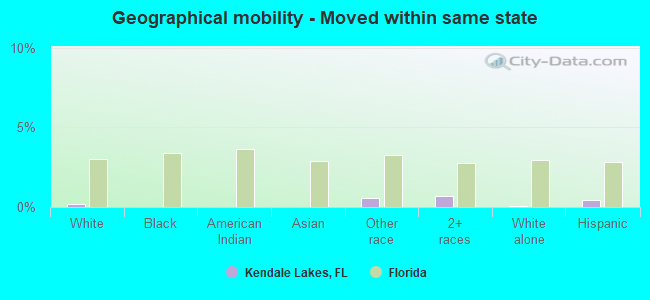
Geographical mobility - Moved from different county within same state (%)
Geographical mobility - Moved from different county within same state (%) - White
Geographical mobility - Moved from different county within same state (%) - Black or African American
Geographical mobility - Moved from different county within same state (%) - Asian
Geographical mobility - Moved from different county within same state (%) - Hispanic or Latino
Geographical mobility - Moved from different county within same state (%) - American Indian and Alaska Native
Geographical mobility - Moved from different county within same state (%) - Multirace
Geographical mobility - Moved from different county within same state (%) - Other Race
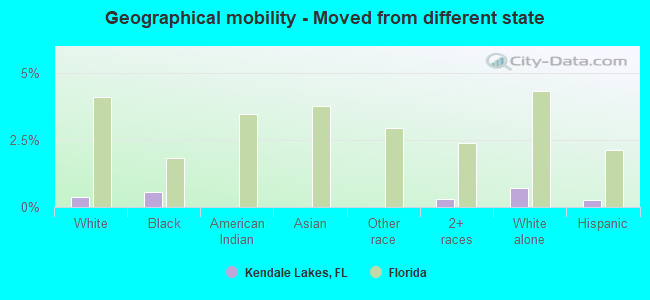
Geographical mobility - Moved from different state (%)
Geographical mobility - Moved from different state (%) - White
Geographical mobility - Moved from different state (%) - Black or African American
Geographical mobility - Moved from different state (%) - Asian
Geographical mobility - Moved from different state (%) - Hispanic or Latino
Geographical mobility - Moved from different state (%) - American Indian and Alaska Native
Geographical mobility - Moved from different state (%) - Multirace
Geographical mobility - Moved from different state (%) - Other Race
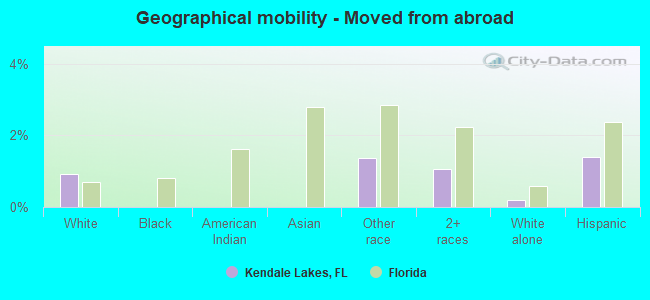
Geographical mobility - Moved from abroad (%)
Geographical mobility - Moved from abroad (%) - White
Geographical mobility - Moved from abroad (%) - Black or African American
Geographical mobility - Moved from abroad (%) - Asian
Geographical mobility - Moved from abroad (%) - Hispanic or Latino
Geographical mobility - Moved from abroad (%) - American Indian and Alaska Native
Geographical mobility - Moved from abroad (%) - Multirace
Geographical mobility - Moved from abroad (%) - Other Race
Place of birth for the foreign-born population - Ireland (%)
Place of birth for the foreign-born population - Denmark (%)
Place of birth for the foreign-born population - Norway (%)
Place of birth for the foreign-born population - Sweden (%)
Place of birth for the foreign-born population - United Kingdom (%)
Place of birth for the foreign-born population - England (%)
Place of birth for the foreign-born population - Scotland (%)
Place of birth for the foreign-born population - Other Northern Europe (%)
Place of birth for the foreign-born population - Austria (%)
Place of birth for the foreign-born population - Belgium (%)
Place of birth for the foreign-born population - France (%)
Place of birth for the foreign-born population - Germany (%)
Place of birth for the foreign-born population - Netherlands (%)
Place of birth for the foreign-born population - Switzerland (%)
Place of birth for the foreign-born population - Other Western Europe (%)
Place of birth for the foreign-born population - Greece (%)
Place of birth for the foreign-born population - Italy (%)
Place of birth for the foreign-born population - Portugal (%)
Place of birth for the foreign-born population - Spain (%)
Place of birth for the foreign-born population - Other Southern Europe (%)
Place of birth for the foreign-born population - Albania (%)
Place of birth for the foreign-born population - Belarus (%)
Place of birth for the foreign-born population - Bosnia and Herzegovina (%)
Place of birth for the foreign-born population - Bulgaria (%)
Place of birth for the foreign-born population - Croatia (%)
Place of birth for the foreign-born population - Czechoslovakia (%)
Place of birth for the foreign-born population - Hungary (%)
Place of birth for the foreign-born population - Latvia (%)
Place of birth for the foreign-born population - Lithuania (%)
Place of birth for the foreign-born population - North Macedonia (Macedonia) (%)
Place of birth for the foreign-born population - Moldova (%)
Place of birth for the foreign-born population - Poland (%)
Place of birth for the foreign-born population - Romania (%)
Place of birth for the foreign-born population - Russia (%)
Place of birth for the foreign-born population - Serbia (%)
Place of birth for the foreign-born population - Ukraine (%)
Place of birth for the foreign-born population - Other Eastern Europe (%)
Place of birth for the foreign-born population - China (%)
Place of birth for the foreign-born population - Hong Kong (%)
Place of birth for the foreign-born population - Taiwan (%)
Place of birth for the foreign-born population - Japan (%)
Place of birth for the foreign-born population - Korea (%)
Place of birth for the foreign-born population - Other Eastern Asia (%)
Place of birth for the foreign-born population - Afghanistan (%)
Place of birth for the foreign-born population - Bangladesh (%)
Place of birth for the foreign-born population - India (%)
Place of birth for the foreign-born population - Iran (%)
Place of birth for the foreign-born population - Kazakhstan (%)
Place of birth for the foreign-born population - Nepal (%)
Place of birth for the foreign-born population - Pakistan (%)
Place of birth for the foreign-born population - Sri Lanka (%)
Place of birth for the foreign-born population - Uzbekistan (%)
Place of birth for the foreign-born population - Other South Central Asia (%)
Place of birth for the foreign-born population - Burma (%)
Place of birth for the foreign-born population - Cambodia (%)
Place of birth for the foreign-born population - Indonesia (%)
Place of birth for the foreign-born population - Laos (%)
Place of birth for the foreign-born population - Malaysia (%)
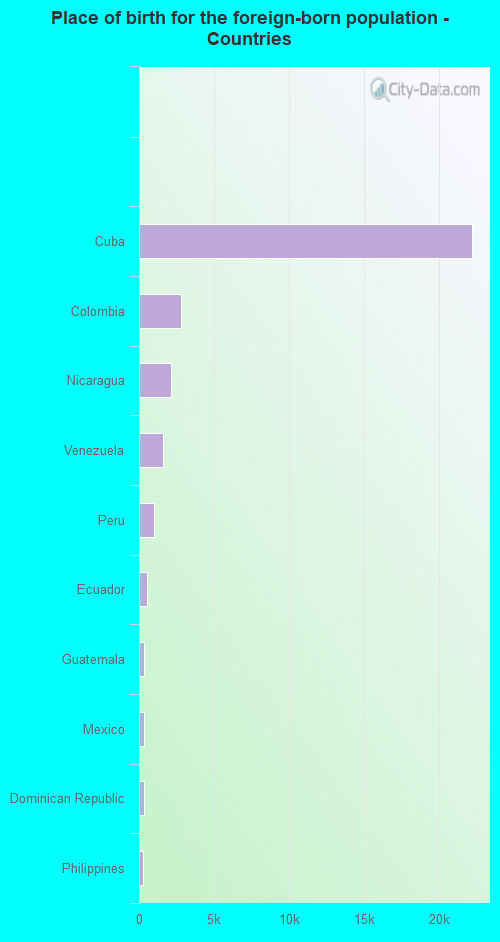
Place of birth for the foreign-born population - Philippines (%)
Place of birth for the foreign-born population - Singapore (%)
Place of birth for the foreign-born population - Thailand (%)
Place of birth for the foreign-born population - Vietnam (%)
Place of birth for the foreign-born population - Other South Eastern Asia (%)
Place of birth for the foreign-born population - Armenia (%)
Place of birth for the foreign-born population - Iraq (%)
Place of birth for the foreign-born population - Israel (%)
Place of birth for the foreign-born population - Jordan (%)
Place of birth for the foreign-born population - Kuwait (%)
Place of birth for the foreign-born population - Lebanon (%)
Place of birth for the foreign-born population - Saudi Arabia (%)
Place of birth for the foreign-born population - Syria (%)
Place of birth for the foreign-born population - Turkey (%)
Place of birth for the foreign-born population - Yemen (%)
Place of birth for the foreign-born population - Other Western Asia (%)
Place of birth for the foreign-born population - Eritrea (%)
Place of birth for the foreign-born population - Ethiopia (%)
Place of birth for the foreign-born population - Kenya (%)
Place of birth for the foreign-born population - Somalia (%)
Place of birth for the foreign-born population - Uganda (%)
Place of birth for the foreign-born population - Zimbabwe (%)
Place of birth for the foreign-born population - Other Eastern Africa (%)
Place of birth for the foreign-born population - Cameroon (%)
Place of birth for the foreign-born population - Congo (%)
Place of birth for the foreign-born population - Democratic Republic of Congo (Zaire) (%)
Place of birth for the foreign-born population - Other Middle Africa (%)
Place of birth for the foreign-born population - Egypt (%)
Place of birth for the foreign-born population - Morocco (%)
Place of birth for the foreign-born population - Sudan (%)
Place of birth for the foreign-born population - Other Northern Africa (%)
Place of birth for the foreign-born population - South Africa (%)
Place of birth for the foreign-born population - Other Southern Africa (%)
Place of birth for the foreign-born population - Cabo Verde (%)
Place of birth for the foreign-born population - Ghana (%)
Place of birth for the foreign-born population - Liberia (%)
Place of birth for the foreign-born population - Nigeria (%)
Place of birth for the foreign-born population - Senegal (%)
Place of birth for the foreign-born population - Sierra Leone (%)
Place of birth for the foreign-born population - Other Western Africa (%)
Place of birth for the foreign-born population - Australia (%)
Place of birth for the foreign-born population - New Zealand (%)
Place of birth for the foreign-born population - Fiji (%)
Place of birth for the foreign-born population - Micronesia (%)
Place of birth for the foreign-born population - Bahamas (%)
Place of birth for the foreign-born population - Barbados (%)
Place of birth for the foreign-born population - Cuba (%)
Place of birth for the foreign-born population - Dominica (%)
Place of birth for the foreign-born population - Dominican Republic (%)
Place of birth for the foreign-born population - Grenada (%)
Place of birth for the foreign-born population - Haiti (%)
Place of birth for the foreign-born population - Jamaica (%)
Place of birth for the foreign-born population - St. Vincent and the Grenadines (%)
Place of birth for the foreign-born population - Trinidad and Tobago (%)
Place of birth for the foreign-born population - West Indies (%)
Place of birth for the foreign-born population - Other Caribbean (%)
Place of birth for the foreign-born population - Belize (%)
Place of birth for the foreign-born population - Costa Rica (%)
Place of birth for the foreign-born population - El Salvador (%)
Place of birth for the foreign-born population - Guatemala (%)
Place of birth for the foreign-born population - Honduras (%)
Place of birth for the foreign-born population - Mexico (%)
Place of birth for the foreign-born population - Nicaragua (%)
Place of birth for the foreign-born population - Panama (%)
Place of birth for the foreign-born population - Other Central America (%)
Place of birth for the foreign-born population - Argentina (%)
Place of birth for the foreign-born population - Bolivia (%)
Place of birth for the foreign-born population - Brazil (%)
Place of birth for the foreign-born population - Chile (%)
Place of birth for the foreign-born population - Colombia (%)
Place of birth for the foreign-born population - Ecuador (%)
Place of birth for the foreign-born population - Guyana (%)
Place of birth for the foreign-born population - Peru (%)
Place of birth for the foreign-born population - Uruguay (%)
Place of birth for the foreign-born population - Venezuela (%)
Place of birth for the foreign-born population - Other South America (%)
Place of birth for the foreign-born population - Canada (%)
Place of birth for the foreign-born population - Other Northern America (%)
Place of birth for the foreign-born population - Other (%)
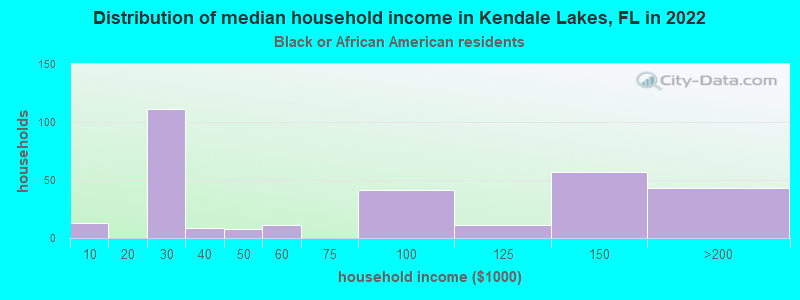
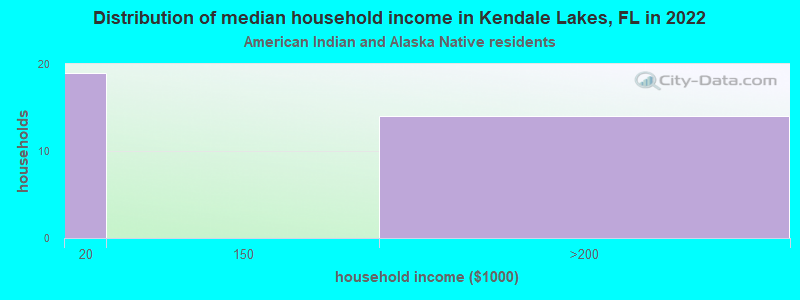
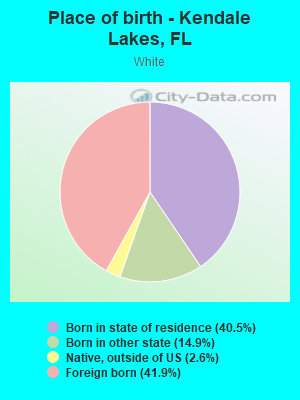
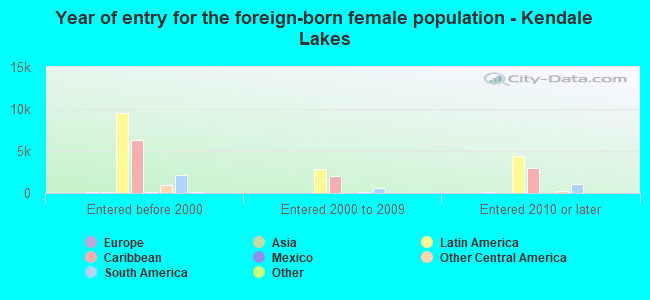
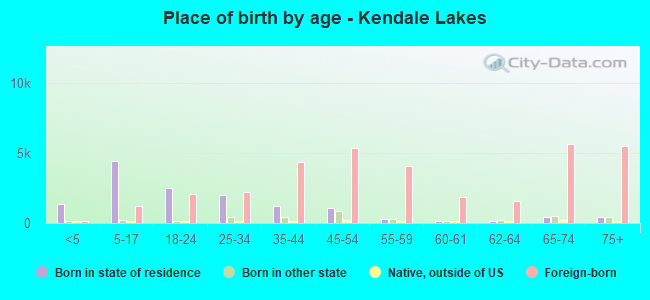
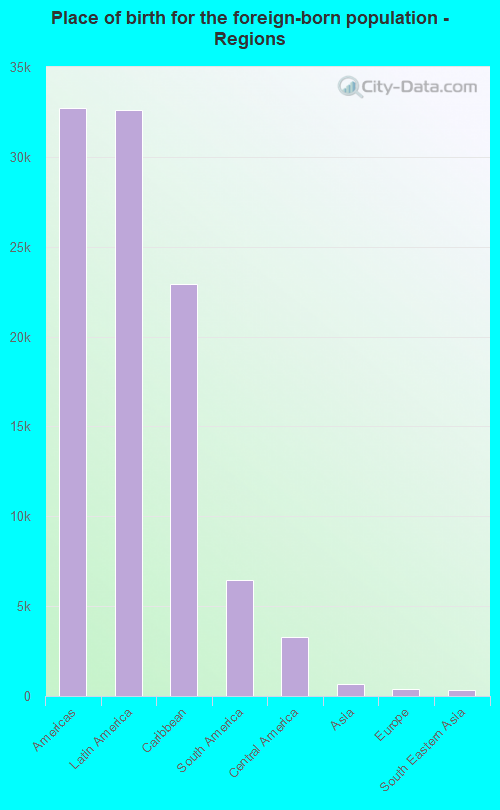
According to 2022 data, the most numerous races in Kendale Lakes, FL are White alone (5,762 residents), Hispanic (45,249 residents), and Black alone (516 residents). 13.9% of Kendale Lakes residents speak English at home. 64.6% of Kendale Lakes, FL residents are foreign-born (62.0% born in Latin America), which is 67.5% greater than the foreign-born rate of 21.0% across the entire state of Florida.
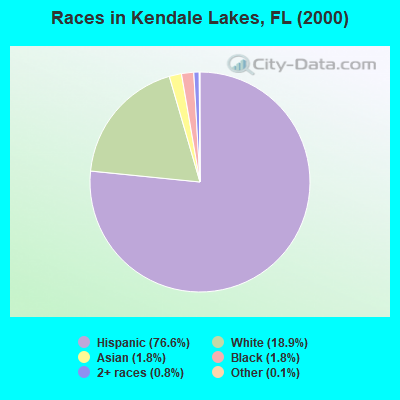
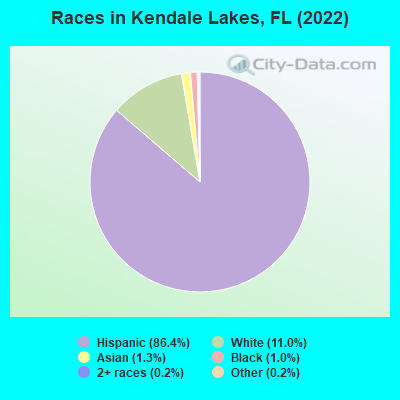
Race distribution in Kendale Lakes
2000 2022
10,458,509 65.4% White alone 2,682,715 16.8% Hispanic 2,264,268 14.2% Black alone 261,693 1.6% Asian alone 236,954 1.5% Two or more races 42,358 0.3% American Indian alone 28,994 0.2% Other race alone 6,887 0.04% Native Hawaiian and Other
11,309,403 50.8% White alone 6,025,039 27.1% Hispanic 3,241,015 14.6% Black alone 861,630 3.9% Two or more races 623,692 2.8% Asian alone 152,054 0.7% Other race alone 22,504 0.1% American Indian alone 9,486 0.04% Native Hawaiian and Other
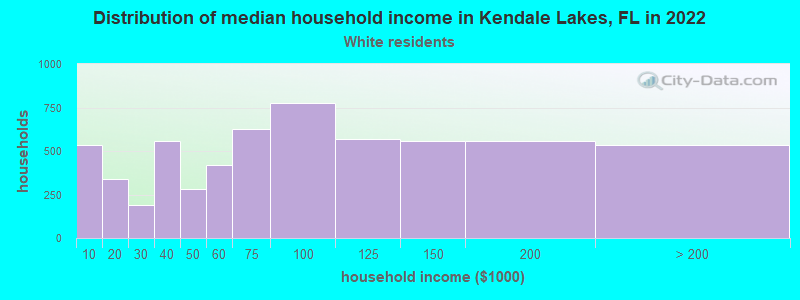
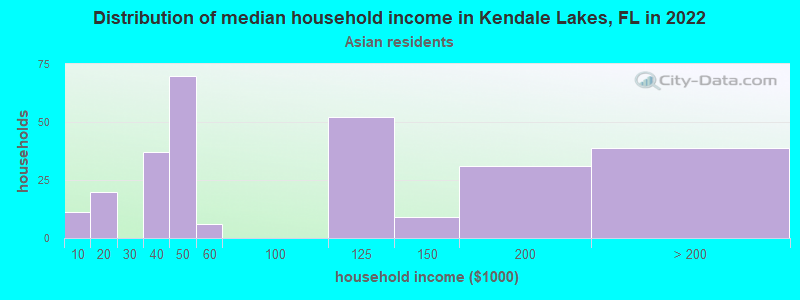
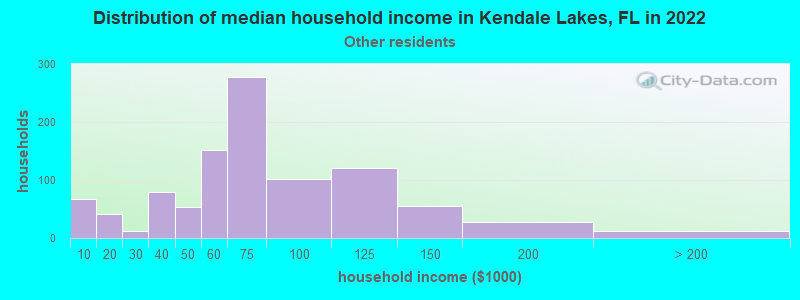
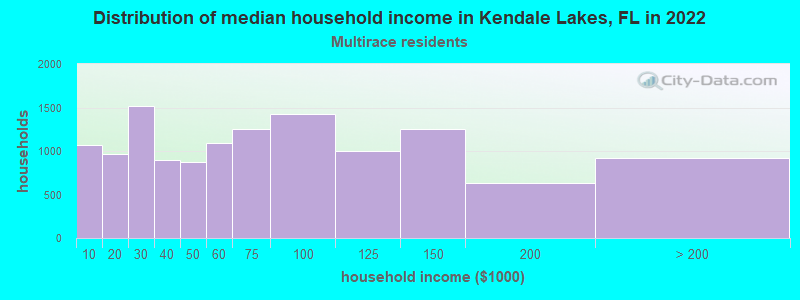
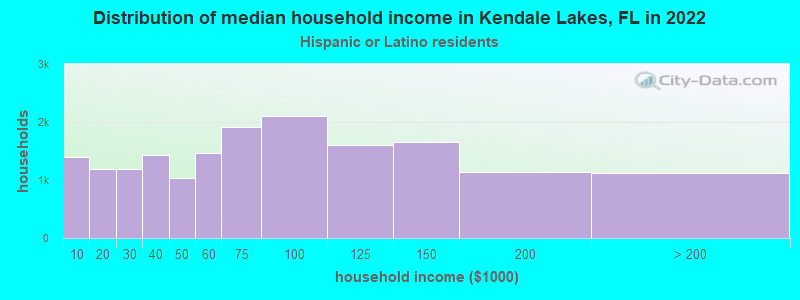
Income and house value in Kendale Lakes Median household income in 2022 $73,256 White non-Hispanic householders$66,725 Some other race householders$58,012 Two or more races householders$67,576 Hispanic or Latino race householdersMedian 2022 house value $516,089 White Non-Hispanic householders$374,195 Black or African American householders $462,169 Asian householders$460,953 Some other race householders$393,249 Two or more races householders$483,250 Hispanic or Latino householders
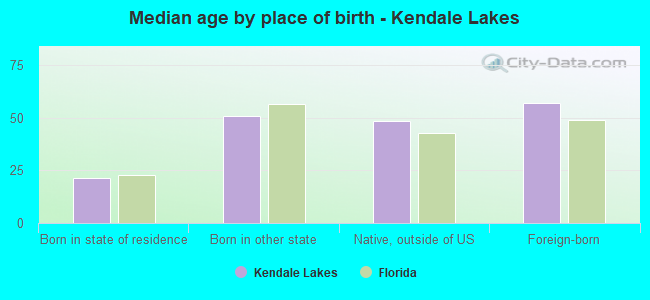
Median age by race in Kendale Lakes
42.2 Median age for White residents40.4 44.7 46.8 Median age for Black or African American residents28.2 47.4 64.7 Median age for American Indian / Alaska Native residents-543,352,600.6 -762,696,213.5 69.6 Median age for Asian residents76.5 66.2 -679,849,340.2 Median age for Native Hawaiian / Pacific Islander residents-858,307,848.3 -443,298,968.6 50.5 Median age for Other race residents51.0 50.0 53.6 Median age for Two or more races residents52.1 54.8 36.8 Median age for White alone residents30.2 47.6 50.1 Median age for Hispanic or Latino residents48.5 51.5
Owner/renter occupied households by race in Kendale Lakes
House owners and renters - White residents 4,372 71.6% Owner occupied1,735 28.4% Renter occupiedHouse owners and renters - Black or African American residents 220 79.6% Owner occupied56 20.4% Renter occupiedHouse owners and renters - American Indian / Alaska Native residents 35 100.0% Owner occupiedHouse owners and renters - Asian residents 264 96.3% Owner occupied10 3.7% Renter occupiedHouse owners and renters - Other race residents 577 59.9% Owner occupied386 40.1% Renter occupiedHouse owners and renters - Two or more races residents 8,860 68.1% Owner occupied4,148 31.9% Renter occupiedHouse owners and renters - White alone residents 1,569 81.7% Owner occupied352 18.3% Renter occupiedHouse owners and renters - Hispanic or Latino residents 11,529 67.0% Owner occupied5,669 33.0% Renter occupied
Language usage in Kendale Lakes
English speakers - Total 13.9% of residents of Kendale Lakes speak English at home.
83.7% of residents speak Spanish at home 22,042 51.8% Speak English very well20,479 48.2% Speak English less than very well2.3% of residents speak other language at home 862 74.9% Speak English very well289 25.1% Speak English less than very well
English speakers - Born in the United States 47.3% of residents of Kendale Lakes speak English at home.
47.4% of residents speak Spanish at home 1,454 85.5% Speak English very well246 14.5% Speak English less than very well4.7% of residents speak other language at home 169 100.0% Speak English very well
English speakers - Native, born elsewhere 20.2% of residents of Kendale Lakes speak English at home.
76.6% of residents speak Spanish at home 531 70.0% Speak English very well228 30.0% Speak English less than very well2.2% of residents speak other language at home 22 100.0% Speak English less than very well
English speakers - Foreign-born 4.3% of residents of Kendale Lakes speak English at home.
92.8% of residents speak Spanish at home 12,112 38.8% Speak English very well19,094 61.2% Speak English less than very well2.7% of residents speak other language at home 638 71.0% Speak English very well261 29.0% Speak English less than very well
White (Caucasian) - Speak only English Native:
47.5% (4,256)Foreign-born:
5.4% (360)
White (Caucasian) - Speak another language Native:
49.9% (4,469)Foreign-born:
93.0% (6,144)
Black or African American - Speak only English Native:
53.0% (186)Foreign-born:
38.3% (147)
Black or African American - Speak another language Native:
47.0% (165)Foreign-born:
62.7% (242)
Asian - Speak only English Native:
66.0% (100)Foreign-born:
12.6% (78)
Asian - Speak another language Native:
34.5% (52)Foreign-born:
88.6% (547)
Other race - Speak only English Native:
19.9% (100)Foreign-born:
7.0% (138)
Other race - Speak another language Native:
80.1% (401)Foreign-born:
92.9% (1,825)
Two or more races - Speak only English Native:
15.3% (1,044)Foreign-born:
3.6% (915)
Two or more races - Speak another language Native:
84.8% (5,795)Foreign-born:
96.3% (24,598)
White alone - Speak only English Native:
71.0% (3,295)Foreign-born:
24.6% (147)
White alone - Speak another language Native:
28.7% (1,329)Foreign-born:
75.0% (447)
Hispanic or Latino - Speak only English Native:
17.3% (2,086)Foreign-born:
3.4% (1,080)
Hispanic or Latino - Speak another language Native:
82.7% (9,977)Foreign-born:
96.6% (31,043)
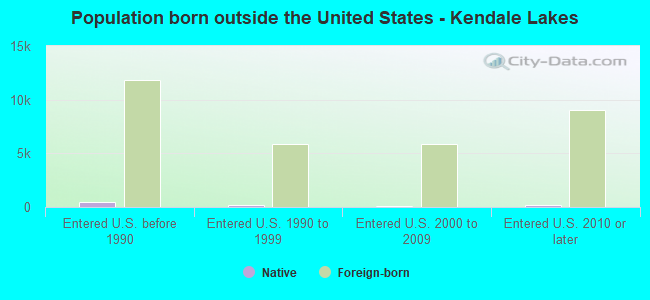
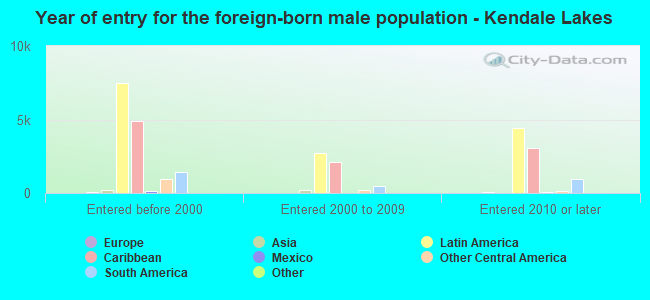
Foreign-born residents in Kendale Lakes 33,824 residents are foreign born (62.0% Latin America ).
This city:
64.6%Florida:
21.1%
Marital status for residents in Kendale Lakes Marital status - White (Caucasian) population 15 years and over
Males 36.5% Never married51.2% Now married1.9% Separated2.6% Widowed7.7% DivorcedFemales 26.3% Never married47.0% Now married3.6% Separated9.1% Widowed14.1% DivorcedWomen who gave birth in the past 12 months Now married:
79.5% (112)Unmarried:
20.5% (29)
Women who did not give birth in the past 12 months Now married:
43.7% (1,457)Unmarried:
56.3% (1,874)
Marital status - Black or African American population 15 years and over
Males 56.9% Never married29.7% Now married9.3% Separated3.7% Widowed0.4% DivorcedFemales 41.4% Never married23.6% Now married0.0% Separated13.7% Widowed21.3% DivorcedWomen who did not give birth in the past 12 months Now married:
28.4% (77)Unmarried:
71.6% (194)
Marital status - American Indian / Alaska Native population 15 years and over
Males 0.0% Never married100.0% Now married0.0% Separated0.0% Widowed0.0% DivorcedFemales 0.0% Never married100.0% Now married0.0% Separated0.0% Widowed0.0% DivorcedWomen who did not give birth in the past 12 months Now married:
100.0% (11)Unmarried:
0.0% (0)
Marital status - Asian population 15 years and over
Males 26.2% Never married71.5% Now married0.0% Separated2.1% Widowed0.2% DivorcedFemales 15.7% Never married40.0% Now married4.9% Separated36.3% Widowed3.1% DivorcedWomen who gave birth in the past 12 months Now married:
100.0% (10)Unmarried:
0.0% (0)
Women who did not give birth in the past 12 months Now married:
46.9% (47)Unmarried:
53.1% (53)
Marital status - Other race population 15 years and over
Males 25.6% Never married62.5% Now married6.3% Separated0.0% Widowed5.7% DivorcedFemales 28.7% Never married48.0% Now married0.0% Separated5.9% Widowed17.4% DivorcedWomen who did not give birth in the past 12 months Now married:
36.6% (202)Unmarried:
63.4% (350)
Marital status - Two or more races population 15 years and over
Males 30.4% Never married55.3% Now married3.0% Separated4.6% Widowed6.7% DivorcedFemales 20.2% Never married50.0% Now married5.9% Separated8.9% Widowed15.0% DivorcedWomen who gave birth in the past 12 months Now married:
43.6% (70)Unmarried:
56.4% (91)
Women who did not give birth in the past 12 months Now married:
49.0% (3,046)Unmarried:
51.0% (3,165)
Marital status - White alone, not Hispanic / Latino population 15 years and over
Males 52.8% Never married40.3% Now married1.5% Separated1.9% Widowed3.4% DivorcedFemales 27.3% Never married49.3% Now married0.4% Separated12.2% Widowed10.8% DivorcedWomen who gave birth in the past 12 months Now married:
44.8% (13)Unmarried:
55.2% (15)
Women who did not give birth in the past 12 months Now married:
50.0% (489)Unmarried:
50.0% (490)
Marital status - Hispanic or Latino population 15 years and over
Males 31.2% Never married55.0% Now married2.7% Separated3.5% Widowed7.7% DivorcedFemales 23.6% Never married48.1% Now married4.8% Separated8.5% Widowed15.0% DivorcedWomen who gave birth in the past 12 months Now married:
71.5% (230)Unmarried:
28.5% (91)
Women who did not give birth in the past 12 months Now married:
45.0% (4,145)Unmarried:
55.0% (5,067)
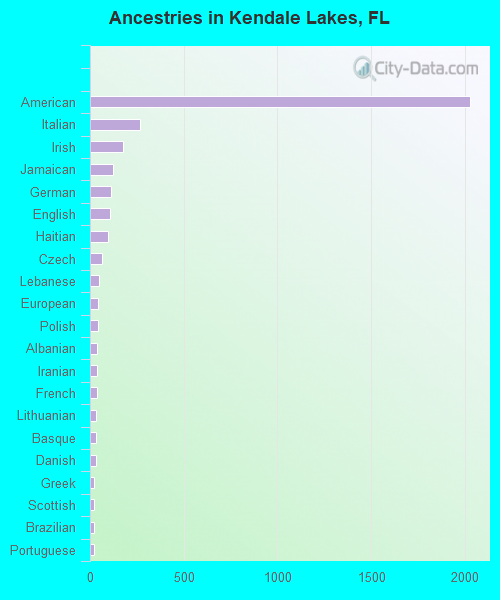
Ancestries in Kendale Lakes
2,027 5.2% American267 0.7% Italian176 0.4% Irish125 0.3% Jamaican113 0.3% German107 0.3% English98 0.2% Haitian65 0.2% Czech48 0.1% Lebanese44 0.1% European44 0.1% Polish40 0.1% Albanian39 0.10% Iranian38 0.10% French34 0.09% Lithuanian31 0.08% Basque30 0.08% Danish22 0.06% Greek21 0.05% Scottish19 0.05% Brazilian19 0.05% Portuguese18 0.05% Scandinavian16 0.04% Guyanese14 0.04% Eastern European13 0.03% Russian13 0.03% Slavic11 0.03% Scotch-Irish9 0.02% British7 0.02% Hungarian6 0.02% Norwegian5 0.01% Ukrainian4 0.01% Austrian4 0.01% African
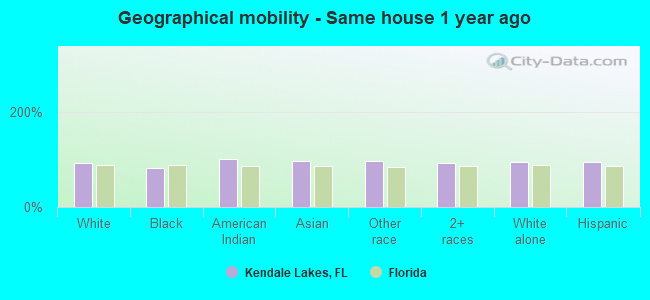
Geographical mobility in Kendale Lakes Same house 1 year ago 15,321 93.5% White (Caucasian)595 80.6% Black or African American73 100.0% American Indian / Alaska Native748 96.3% Asian2,453 95.8% Other race30,531 93.2% Two or more races5,415 94.4% White alone, not Hispanic / Latino42,346 94.0% Hispanic or LatinoMoved within same county 550 3.4% White / Caucasian98 13.3% Black or African American49 6.3% Asian64 2.5% Other race1,427 4.4% Two or more races195 3.4% White alone, not Hispanic / Latino1,675 3.7% Hispanic or LatinoMoved within same state 35 0.2% White / Caucasian15 0.6% Other race217 0.7% Two or more races2 0.0% White alone, not Hispanic / Latino197 0.4% Hispanic or LatinoMoved from different state 63 0.4% White / Caucasian4 0.6% Black or African American103 0.3% Two or more races40 0.7% White alone, not Hispanic / Latino119 0.3% Hispanic or LatinoMoved from abroad 150 0.9% White35 1.4% Other race350 1.1% Two or more races11 0.2% White alone, not Hispanic / Latino635 1.4% Hispanic or Latino
Children Nativity (place of birth) in Kendale Lakes
Children under 6 years - Living with two parents Both parents native 581 100.0% NativeBoth parents foreign-born 560 90.0% Native62 10.0% Foreign-bornOne native, one foreign-born parent 107 96.9% Native3 3.1% Foreign-bornChildren under 6 years - Living with one parent Native parent 105 97.8% Native2 2.2% Foreign-bornForeign-born parent 270 84.3% Native51 15.7% Foreign-bornChildren 6 to 17 years - Living with two parents Both parents native 792 100.0% NativeBoth parents foreign-born 1,099 67.8% Native521 32.2% Foreign-bornOne native, one foreign-born parent 793 92.6% Native63 7.4% Foreign-bornChildren 6 to 17 years - Living with one parent Foreign-born parent 1,706 60.3% Native1,126 39.7% Foreign-born
Grandparents responsible for own grandchildren in Kendale Lakes
Grandparents (30 to 59 years) White / Caucasian 16 14.8% Responsible for grandchildren94 85.2% Not responsible for grandchildrenTwo or more races 51 24.4% Responsible for grandchildren156 75.6% Not responsible for grandchildrenHispanic or Latino 55 19.4% Responsible for grandchildren227 80.6% Not responsible for grandchildrenGrandparents (60 years and over) White / Caucasian 27 7.2% Responsible for grandchildren356 92.8% Not responsible for grandchildrenTwo or more races 171 20.5% Responsible for grandchildren663 79.5% Not responsible for grandchildrenHispanic or Latino 167 14.8% Responsible for grandchildren965 85.2% Not responsible for grandchildren