Races in Lowell, Arkansas (AR) Detailed Stats
Ancestries, Foreign-born residents, place of birth
Settings
X


Recent posts about races in Lowell, Arkansas on our local forum with over 2,400,000 registered users:
 | Fayetteville vs. Springdale vs. Lowell vs. Rogers (17 replies) |
| Best place to live for young professional with new job in Lowell (Fayetteville?) (28 replies) |
| renovating or moving? (31 replies) |
| Bentonville/Rogers crime? Homeschooling? Family friendly? (35 replies) |
| NWA vs Tulsa, coming from Plano, Texas (41 replies) |
| Need some questions answered about NWA (18 replies) |
Latest news about races in Lowell, AR collected exclusively by city-data.com from local newspapers, TV, and radio stations
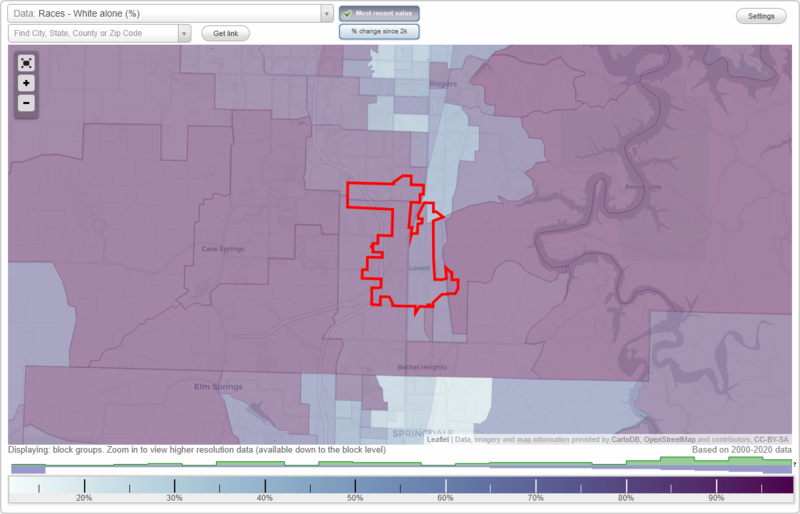
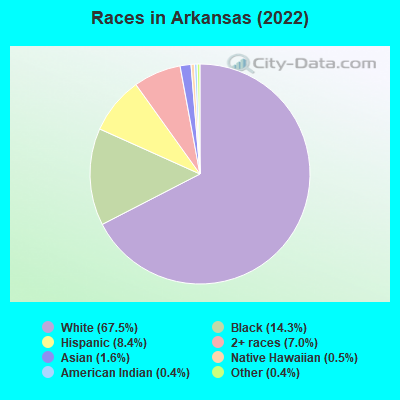
According to 2022 data, the most numerous races in Lowell, AR are White alone (6,265 residents), Black alone (40 residents), and Hispanic (2,753 residents). 81.5% of Lowell residents speak English at home. 15.6% of Lowell, AR residents are foreign-born (12.6% born in Latin America, 2.9% born in Asia), which is 74.3% greater than the foreign-born rate of 4.0% across the entire state of Arkansas.
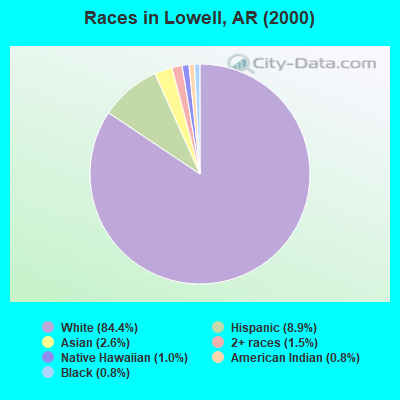
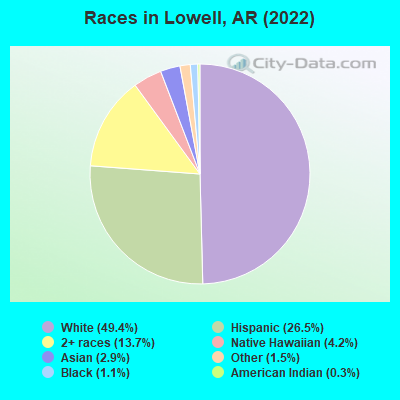
Race distribution in Lowell
2000
2022

- 4,23384.4%White alone
- 4488.9%Hispanic
- 1292.6%Asian alone
- 731.5%Two or more races
- 491.0%Native Hawaiian and Other
Pacific Islander alone - 390.8%Black alone
- 410.8%American Indian alone
- 10.02%Other race alone
-
- 6,26564.6%White alone
- 2,75328.4%Hispanic
- 4394.5%Two or more races
- 2953.0%Asian alone
- 800.8%American Indian alone
- 400.4%Black alone
2000
2022
-
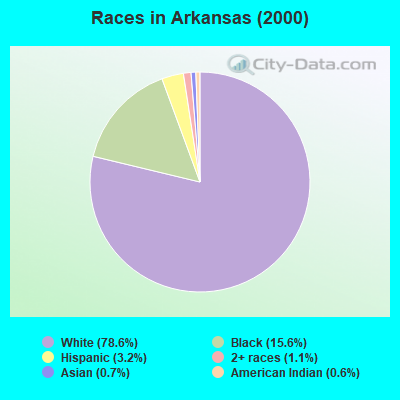
- 2,100,13578.6%White alone
- 416,61515.6%Black alone
- 86,8663.2%Hispanic
- 30,3641.1%Two or more races
- 19,8920.7%Asian alone
- 16,7020.6%American Indian alone
- 1,4940.06%Native Hawaiian and Other
Pacific Islander alone - 1,3320.05%Other race alone
-
- 2,054,92267.5%White alone
- 435,63714.3%Black alone
- 255,4168.4%Hispanic
- 213,6847.0%Two or more races
- 47,5921.6%Asian alone
- 14,1760.5%Native Hawaiian and Other
Pacific Islander alone - 12,6800.4%American Indian alone
- 11,5300.4%Other race alone
Income and house value in Lowell
- Median household income in 2022
- $86,258White non-Hispanic householders
- $44,220Black householders
- $111,529American Indian and Alaska Native householders
- $80,161Asian householders
- $90,334Native Hawaiian and other Pacific Islander householders
- $96,750Some other race householders
- $94,363Two or more races householders
- $86,796Hispanic or Latino race householders
- Median 2022 house value
- $243,823White Non-Hispanic householders
- $266,765American Indian or Alaska Native householders
- $210,211Asian householders
- $183,001Native Hawaiian and other Pacific Islander householders
- $221,948Some other race householders
- $220,881Hispanic or Latino householders
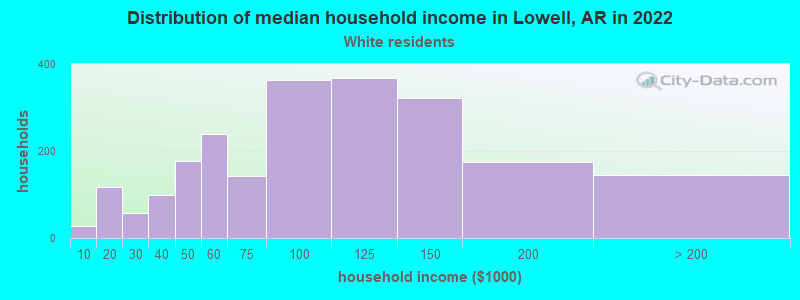
Household income for White non-Hispanic householders
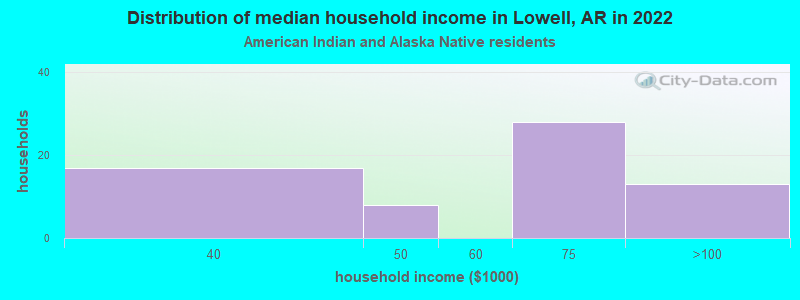
Household income for American Indian and Alaska Native householders
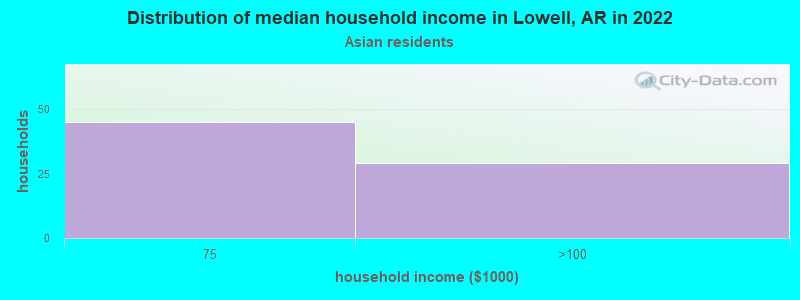
Household income for Asian householders
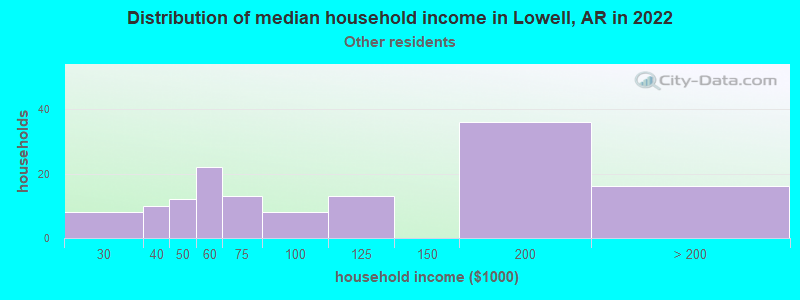
Household income for Some other race householders
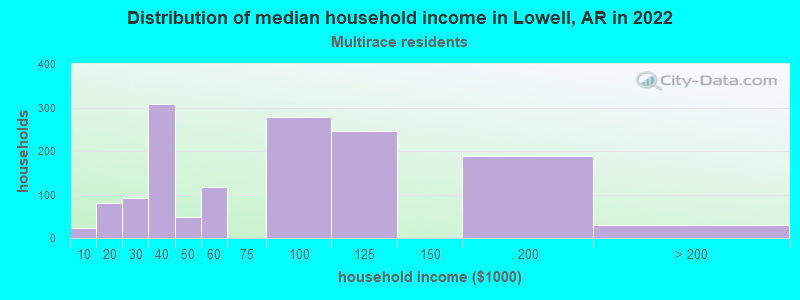
Household income for Two or more races householders
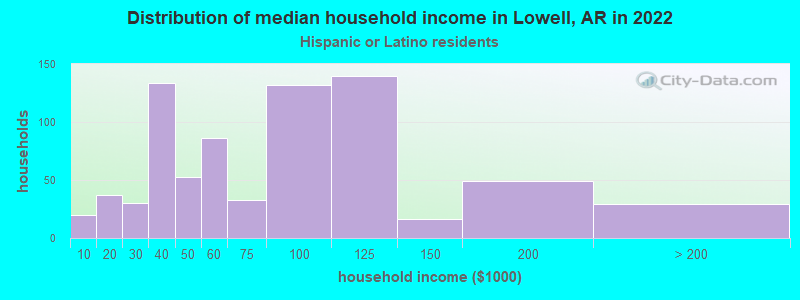
Household income for Hispanic or Latino race householders
Median age by race in Lowell
- 32.5Median age for White residents
- 32.4Males
- 32.8Females
- 38.9Median age for Black or African American residents
- 32.0Median age for American Indian / Alaska Native residents
- 27.9Males
- 35.0Females
- 39.3Median age for Asian residents
- 38.1Males
- 41.9Females
- 6.2Median age for Native Hawaiian / Pacific Islander residents
- 36.9Median age for Other race residents
- 36.1Males
- 34.7Females
- 32.9Median age for Two or more races residents
- 34.4Males
- 34.3Females
- 33.3Median age for White alone residents
- 33.2Males
- 33.6Females
- 26.6Median age for Hispanic or Latino residents
- 28.8Males
- 25.1Females
Owner/renter occupied households by race in Lowell
- House owners and renters - White residents
- 1,86364.5%Owner occupied
- 1,02635.5%Renter occupied
- House owners and renters - Black or African American residents
- 14100.0%Renter occupied
- House owners and renters - American Indian / Alaska Native residents
- 4380.6%Owner occupied
- 1019.4%Renter occupied
- House owners and renters - Asian residents
- 4744.8%Owner occupied
- 5855.2%Renter occupied
- House owners and renters - Other race residents
- 8789.5%Owner occupied
- 1010.5%Renter occupied
- House owners and renters - Two or more races residents
- 14432.0%Owner occupied
- 30568.0%Renter occupied
- House owners and renters - White alone residents
- 1,60665.7%Owner occupied
- 83934.3%Renter occupied
- House owners and renters - Hispanic or Latino residents
- 43364.5%Owner occupied
- 23835.5%Renter occupied
Language usage in Lowell
- English speakers - Total
- 81.5% of residents of Lowell speak English at home.
- 16.3% of residents speak Spanish at home
- 80758.0%Speak English very well
- 58542.0%Speak English less than very well
- 2.5% of residents speak other language at home
- 8540.5%Speak English very well
- 12559.5%Speak English less than very well
- English speakers - Born in the United States
- 92.8% of residents of Lowell speak English at home.
- 7.1% of residents speak Spanish at home
- 20098.0%Speak English very well
- 42.0%Speak English less than very well
- English speakers - Native, born elsewhere
- 46.8% of residents of Lowell speak English at home.
- 54.1% of residents speak Spanish at home
- 3558.3%Speak English very well
- 2541.7%Speak English less than very well
- 4.5% of residents speak other language at home
- 5100.0%Speak English very well
- English speakers - Foreign-born
- 38.3% of residents of Lowell speak English at home.
- 48.7% of residents speak Spanish at home
- 26936.5%Speak English very well
- 46863.5%Speak English less than very well
- 13.5% of residents speak other language at home
- 8139.5%Speak English very well
- 12460.5%Speak English less than very well
White (Caucasian) - Speak only English
| Native: | 91.3% (6,050) |
| Foreign-born: | 45.1% (357) |
White (Caucasian) - Speak another language
| Native: | 8.1% (538) |
| Foreign-born: | 56.4% (446) |
Black or African American - Speak only English
| Native: | 100.0% (14) |
| Foreign-born: | 73.9% (24) |
Asian - Speak only English
| Native: | 100.0% (31) |
| Foreign-born: | 4.1% (9) |
Other race - Speak another language
| Native: | 54.8% (104) |
| Foreign-born: | 98.5% (118) |
Two or more races - Speak only English
| Native: | 96.7% (293) |
| Foreign-born: | 100.0% (671) |
White alone - Speak only English
| Native: | 99.3% (5,760) |
| Foreign-born: | 42.1% (22) |
White alone - Speak another language
| Native: | 0.7% (40) |
| Foreign-born: | 64.5% (34) |
Hispanic or Latino - Speak only English
| Native: | 40.6% (506) |
| Foreign-born: | 37.8% (482) |
Hispanic or Latino - Speak another language
| Native: | 60.5% (753) |
| Foreign-born: | 63.5% (809) |
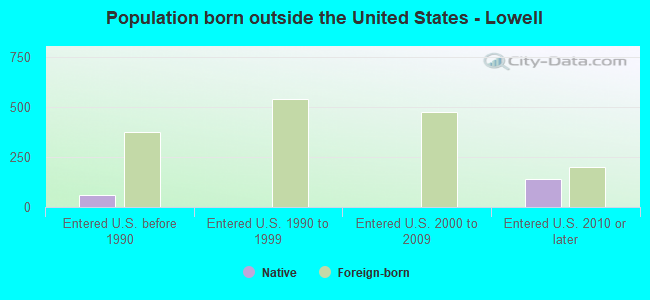
Foreign-born residents in Lowell
1,510 residents are foreign born (12.6% Latin America, 2.9% Asia).
| This city: | 15.6% |
| Arkansas: | 100.0% |

Marital status for residents in Lowell
Marital status - White (Caucasian) population 15 years and over
- Males
- 31.7%Never married
- 59.0%Now married
- 0.8%Separated
- 1.5%Widowed
- 7.0%Divorced
- Females
- 20.1%Never married
- 61.0%Now married
- 1.4%Separated
- 3.4%Widowed
- 14.0%Divorced
Women who gave birth in the past 12 months
| Now married: | 91.0% (111) |
| Unmarried: | 9.0% (11) |
Women who did not give birth in the past 12 months
| Now married: | 62.5% (1,335) |
| Unmarried: | 37.5% (802) |
Marital status - American Indian / Alaska Native population 15 years and over
- Males
- 0.0%Never married
- 100.0%Now married
- 0.0%Separated
- 0.0%Widowed
- 0.0%Divorced
- Females
- 0.0%Never married
- 24.1%Now married
- 0.0%Separated
- 0.0%Widowed
- 75.9%Divorced
Women who did not give birth in the past 12 months
| Now married: | 24.1% (10) |
| Unmarried: | 75.9% (32) |
Marital status - Asian population 15 years and over
- Males
- 17.0%Never married
- 83.0%Now married
- 0.0%Separated
- 0.0%Widowed
- 0.0%Divorced
- Females
- 17.3%Never married
- 82.7%Now married
- 0.0%Separated
- 0.0%Widowed
- 0.0%Divorced
Women who did not give birth in the past 12 months
| Now married: | 72.9% (61) |
| Unmarried: | 27.1% (22) |
Marital status - Other race population 15 years and over
- Males
- 15.4%Never married
- 61.5%Now married
- 0.0%Separated
- 0.0%Widowed
- 23.1%Divorced
- Females
- 14.1%Never married
- 67.4%Now married
- 14.1%Separated
- 0.0%Widowed
- 4.3%Divorced
Women who did not give birth in the past 12 months
| Now married: | 75.4% (55) |
| Unmarried: | 24.6% (18) |
Marital status - Two or more races population 15 years and over
- Males
- 0.0%Never married
- 90.7%Now married
- 0.0%Separated
- 9.3%Widowed
- 0.0%Divorced
- Females
- 45.8%Never married
- 54.2%Now married
- 0.0%Separated
- 0.0%Widowed
- 0.0%Divorced
Women who did not give birth in the past 12 months
| Now married: | 54.2% (76) |
| Unmarried: | 45.8% (64) |
Marital status - White alone, not Hispanic / Latino population 15 years and over
- Males
- 31.9%Never married
- 56.5%Now married
- 0.6%Separated
- 1.9%Widowed
- 9.1%Divorced
- Females
- 20.7%Never married
- 56.8%Now married
- 1.5%Separated
- 4.2%Widowed
- 16.8%Divorced
Women who gave birth in the past 12 months
| Now married: | 100.0% (87) |
| Unmarried: | 0.0% (0) |
Women who did not give birth in the past 12 months
| Now married: | 56.4% (938) |
| Unmarried: | 43.6% (726) |
Marital status - Hispanic or Latino population 15 years and over
- Males
- 28.0%Never married
- 66.7%Now married
- 1.2%Separated
- 1.1%Widowed
- 3.0%Divorced
- Females
- 17.2%Never married
- 77.3%Now married
- 2.9%Separated
- 0.0%Widowed
- 2.6%Divorced
Women who gave birth in the past 12 months
| Now married: | 69.4% (30) |
| Unmarried: | 30.6% (13) |
Women who did not give birth in the past 12 months
| Now married: | 81.9% (555) |
| Unmarried: | 18.1% (122) |
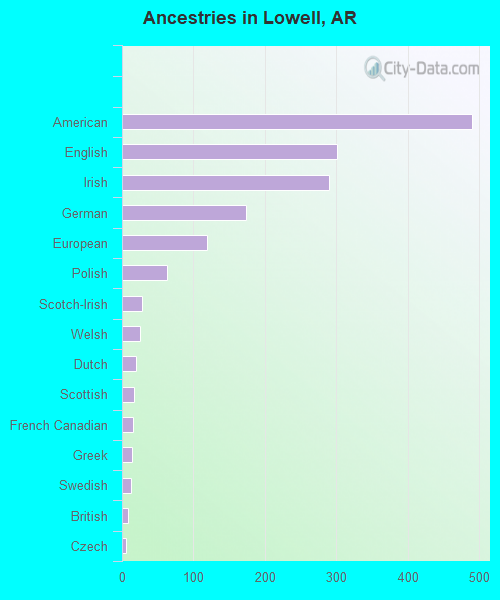
Ancestries in Lowell

- 3628.8%Irish
- 3267.9%American
- 2365.7%German
- 2205.4%English
- 942.3%European
- 771.9%Haitian
- 631.5%Italian
- 340.8%French
- 180.4%Scottish
- 170.4%Polish
- 150.4%Lebanese
- 150.4%Eastern European
- 140.3%Dutch
- 140.3%Scotch-Irish
- 130.3%British
- 110.3%Swedish
- 90.2%Greek
- 80.2%Russian
- 60.1%Danish
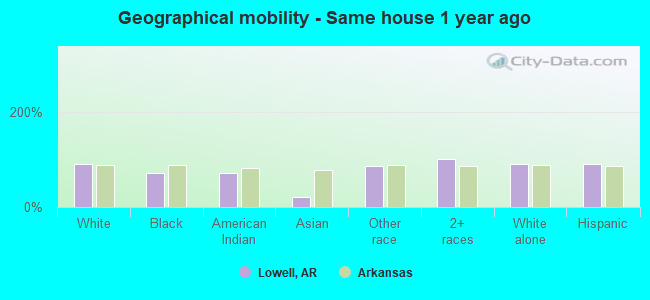
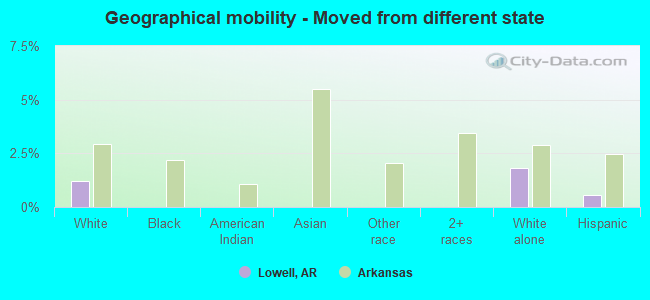
Geographical mobility in Lowell

- Same house 1 year ago
- 7,09591.3%White (Caucasian)
- 3071.4%Black or African American
- 5671.7%American Indian / Alaska Native
- 6421.6%Asian
- 25786.2%Other race
- 742100.0%Two or more races
- 5,35390.1%White alone, not Hispanic / Latino
- 2,29391.0%Hispanic or Latino
-
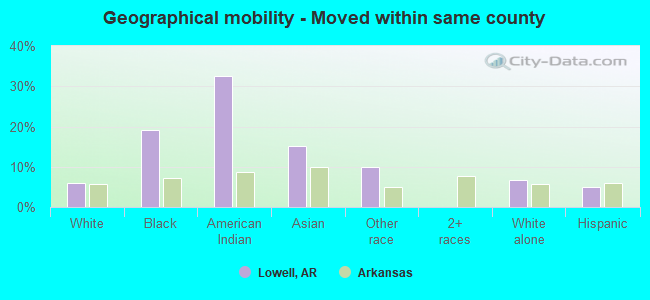
- Moved within same county
- 4666.0%White / Caucasian
- 819.0%Black or African American
- 2532.6%American Indian / Alaska Native
- 4515.2%Asian
- 3010.0%Other race
- 4066.8%White alone, not Hispanic / Latino
- 1265.0%Hispanic or Latino
-
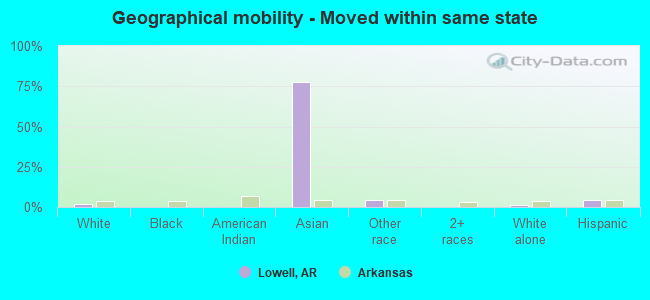
- Moved within same state
- 1592.0%White / Caucasian
- 23077.7%Asian
- 134.2%Other race
- 881.5%White alone, not Hispanic / Latino
- 1034.1%Hispanic or Latino
-
- Moved from different state
- 951.2%White / Caucasian
- 1081.8%White alone, not Hispanic / Latino
- 140.6%Hispanic or Latino
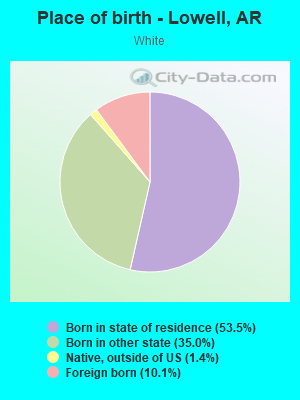
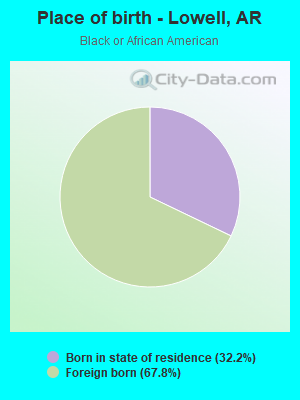
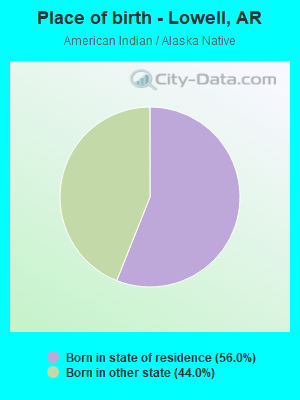
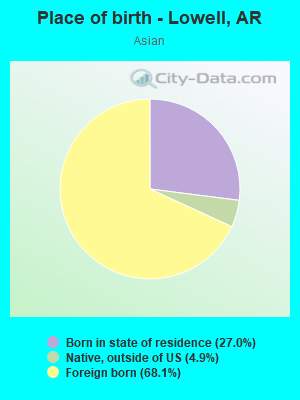
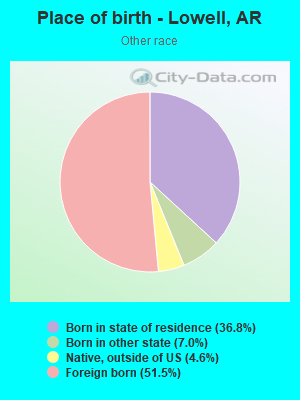
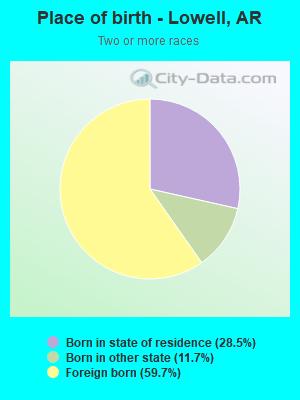
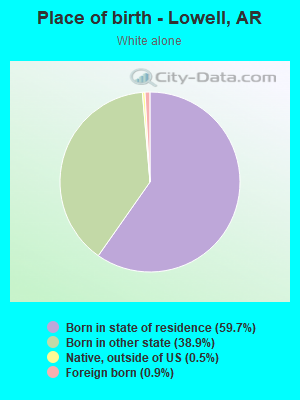
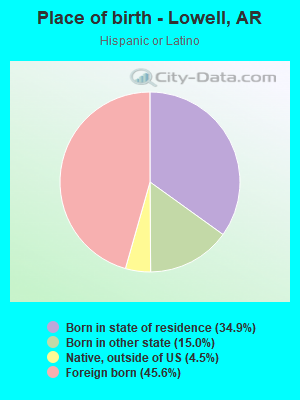
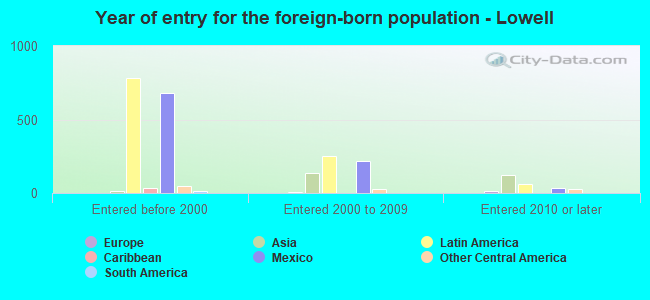
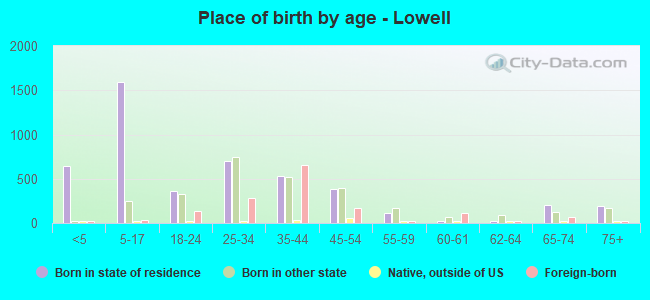
Children Nativity (place of birth) in Lowell
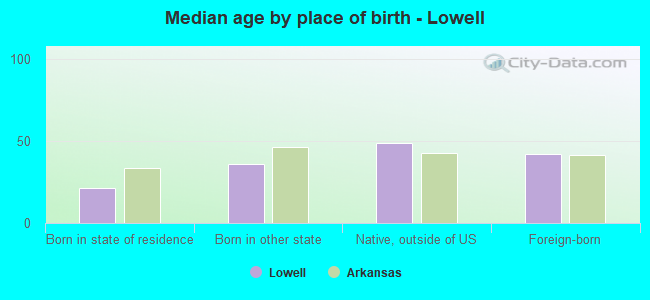
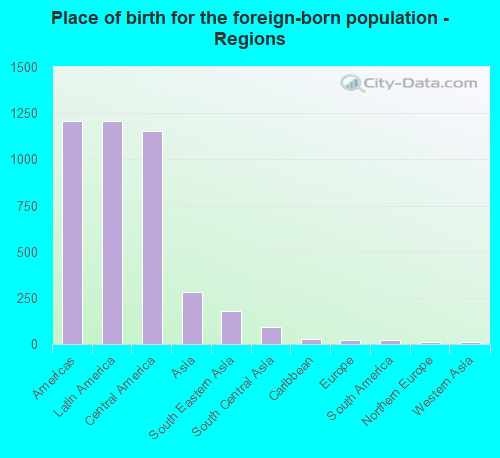
Place of birth for residents in Lowell
![Place of birth for the foreign-born population - Regions]()
- 1,205Americas
- 1,205Latin America
- 1,156Central America
- 281Asia
- 176South Eastern Asia
- 91South Central Asia
- 29Caribbean
- 23Europe
- 19South America
- 13Northern Europe
- 13Western Asia
- 10Eastern Europe
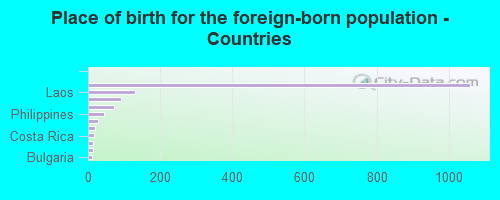
![Place of birth for the foreign-born population - Countries]()
- 1,059Mexico
- 131Laos
- 91India
- 71El Salvador
- 44Philippines
- 29Haiti
- 19Venezuela
- 17Costa Rica
- 13United Kingdom
- 13Iraq
- 10Bulgaria
- 7Guatemala
Grandparents responsible for own grandchildren in Lowell
Zip codes: 72745.