Races in Malvern, Arkansas (AR) Detailed Stats
Data:
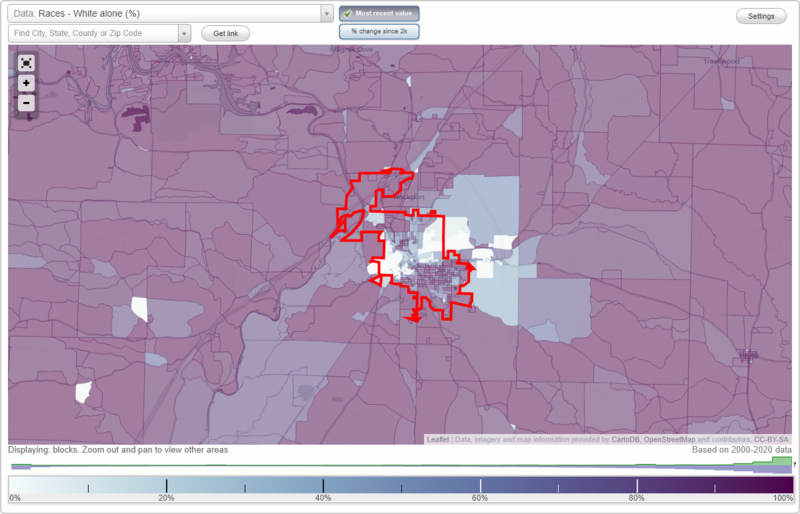
Races - White alone (%)
Races - White alone (% change since 2000)
Races - Black alone (%)
Races - Black alone (% change since 2000)
Races - American Indian alone (%)
Races - American Indian alone (% change since 2000)
Races - Asian alone (%)
Races - Asian alone (% change since 2000)
Races - Hispanic (%)
Races - Hispanic (% change since 2000)
Races - Native Hawaiian and Other Pacific Islander alone (%)
Races - Native Hawaiian and Other Pacific Islander alone (% change since 2000)
Races - Two or more races(%)
Races - Two or more races(% change since 2000)
Races - Other race alone (%)
Races - Other race alone (% change since 2000)
Racial diversity
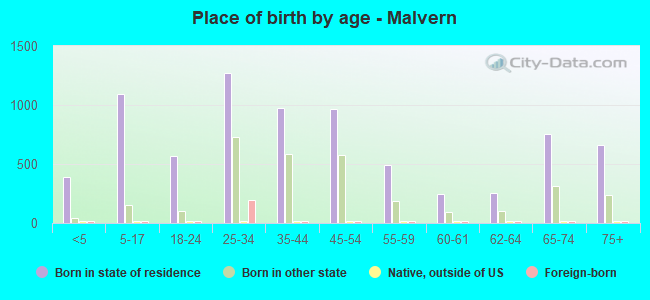
Place of birth - Born in state of residence (%)
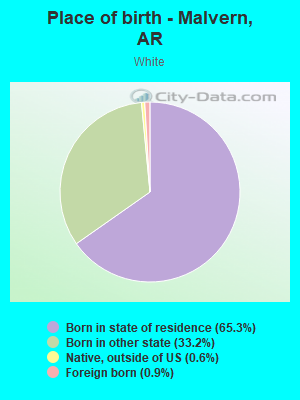
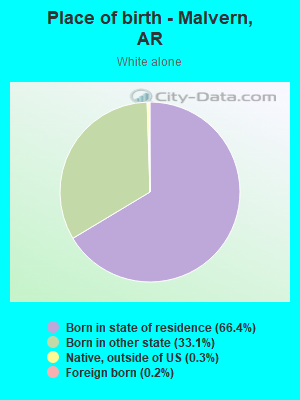
Place of birth - Born in state of residence (%) - White
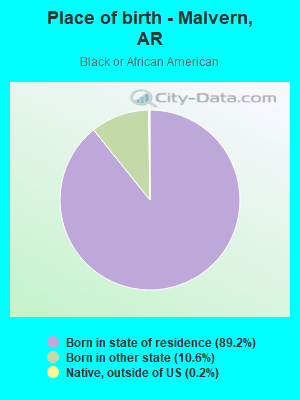
Place of birth - Born in state of residence (%) - Black or African American
Place of birth - Born in state of residence (%) - Asian
Place of birth - Born in state of residence (%) - Hispanic or Latino
Place of birth - Born in state of residence (%) - American Indian and Alaska Native
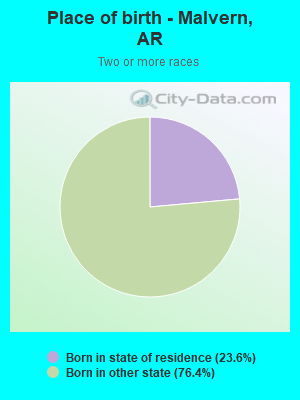
Place of birth - Born in state of residence (%) - Multirace
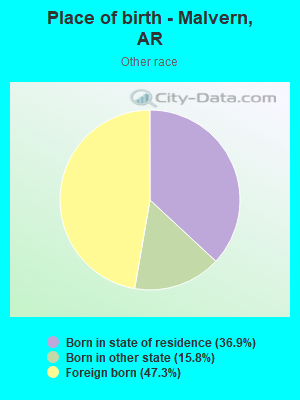
Place of birth - Born in state of residence (%) - Other Race
Place of birth - Born in other state (%)
Place of birth - Born in other state (%) - White
Place of birth - Born in other state (%) - Black or African American
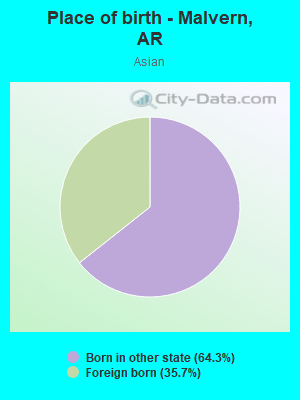
Place of birth - Born in other state (%) - Asian
Place of birth - Born in other state (%) - Hispanic or Latino
Place of birth - Born in other state (%) - American Indian and Alaska Native
Place of birth - Born in other state (%) - Multirace
Place of birth - Born in other state (%) - Other Race
Place of birth - Native, outside of US (%)
Place of birth - Native, outside of US (%) - White
Place of birth - Native, outside of US (%) - Black or African American
Place of birth - Native, outside of US (%) - Asian
Place of birth - Native, outside of US (%) - Hispanic or Latino
Place of birth - Native, outside of US (%) - American Indian and Alaska Native
Place of birth - Native, outside of US (%) - Multirace
Place of birth - Native, outside of US (%) - Other Race
Place of birth - Foreign born (%)
Place of birth - Foreign born (%) - White
Place of birth - Foreign born (%) - Black or African American
Place of birth - Foreign born (%) - Asian
Place of birth - Foreign born (%) - Hispanic or Latino
Place of birth - Foreign born (%) - American Indian and Alaska Native
Place of birth - Foreign born (%) - Multirace
Place of birth - Foreign born (%) - Other Race
Residents speaking English at home (%)
Residents speaking English at home - Born in the United States (%)
Residents speaking English at home - Native, born elsewhere (%)
Residents speaking English at home - Foreign born (%)
Residents speaking Spanish at home (%)
Residents speaking Spanish at home - Born in the United States (%)
Residents speaking Spanish at home - Native, born elsewhere (%)
Residents speaking Spanish at home - Foreign born (%)
Residents speaking other language at home (%)
Residents speaking other language at home - Born in the United States (%)
Residents speaking other language at home - Native, born elsewhere (%)
Residents speaking other language at home - Foreign born (%)
Marital status - Never married (%)
Marital status - Now married (%)
Marital status - Separated (%)
Marital status - Widowed (%)
Marital status - Divorced (%)
Ancestries Reported - Arab (%)
Ancestries Reported - Czech (%)
Ancestries Reported - Danish (%)
Ancestries Reported - Dutch (%)
Ancestries Reported - English (%)
Ancestries Reported - French (%)
Ancestries Reported - French Canadian (%)
Ancestries Reported - German (%)
Ancestries Reported - Greek (%)
Ancestries Reported - Hungarian (%)
Ancestries Reported - Irish (%)
Ancestries Reported - Italian (%)
Ancestries Reported - Lithuanian (%)
Ancestries Reported - Norwegian (%)
Ancestries Reported - Polish (%)
Ancestries Reported - Portuguese (%)
Ancestries Reported - Russian (%)
Ancestries Reported - Scotch-Irish (%)
Ancestries Reported - Scottish (%)
Ancestries Reported - Slovak (%)
Ancestries Reported - Subsaharan African (%)
Ancestries Reported - Swedish (%)
Ancestries Reported - Swiss (%)
Ancestries Reported - Ukrainian (%)
Ancestries Reported - United States (%)
Ancestries Reported - Welsh (%)
Ancestries Reported - West Indian (%)
Ancestries Reported - Other (%)
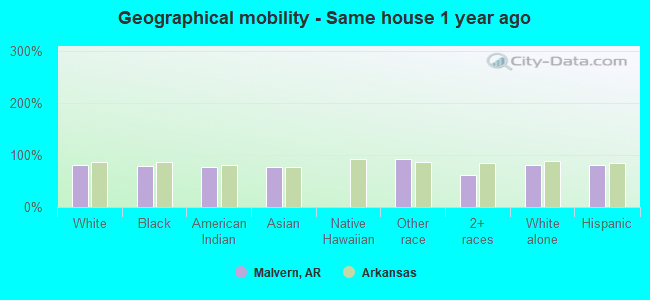
Geographical mobility - Same house 1 year ago (%)
Geographical mobility - Same house 1 year ago (%) - White
Geographical mobility - Same house 1 year ago (%) - Black or African American
Geographical mobility - Same house 1 year ago (%) - Asian
Geographical mobility - Same house 1 year ago (%) - Hispanic or Latino
Geographical mobility - Same house 1 year ago (%) - American Indian and Alaska Native
Geographical mobility - Same house 1 year ago (%) - Multirace
Geographical mobility - Same house 1 year ago (%) - Other Race
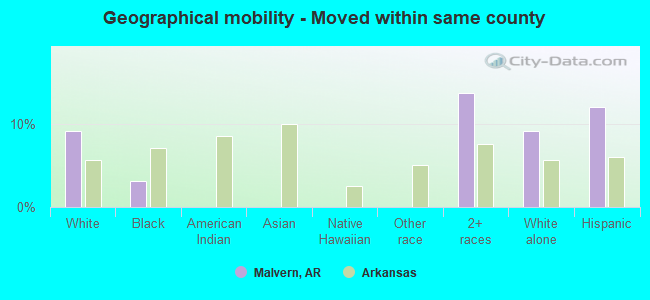
Geographical mobility - Moved within same county (%)
Geographical mobility - Moved within same county (%) - White
Geographical mobility - Moved within same county (%) - Black or African American
Geographical mobility - Moved within same county (%) - Asian
Geographical mobility - Moved within same county (%) - Hispanic or Latino
Geographical mobility - Moved within same county (%) - American Indian and Alaska Native
Geographical mobility - Moved within same county (%) - Multirace
Geographical mobility - Moved within same county (%) - Other Race
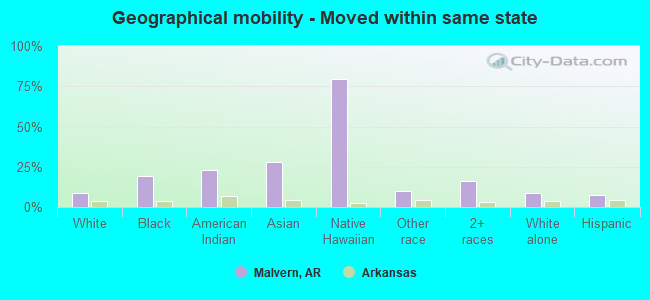
Geographical mobility - Moved from different county within same state (%)
Geographical mobility - Moved from different county within same state (%) - White
Geographical mobility - Moved from different county within same state (%) - Black or African American
Geographical mobility - Moved from different county within same state (%) - Asian
Geographical mobility - Moved from different county within same state (%) - Hispanic or Latino
Geographical mobility - Moved from different county within same state (%) - American Indian and Alaska Native
Geographical mobility - Moved from different county within same state (%) - Multirace
Geographical mobility - Moved from different county within same state (%) - Other Race
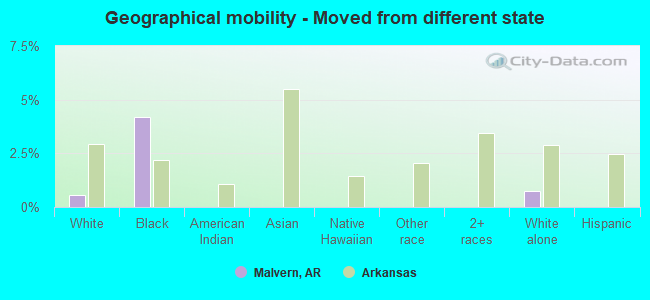
Geographical mobility - Moved from different state (%)
Geographical mobility - Moved from different state (%) - White
Geographical mobility - Moved from different state (%) - Black or African American
Geographical mobility - Moved from different state (%) - Asian
Geographical mobility - Moved from different state (%) - Hispanic or Latino
Geographical mobility - Moved from different state (%) - American Indian and Alaska Native
Geographical mobility - Moved from different state (%) - Multirace
Geographical mobility - Moved from different state (%) - Other Race
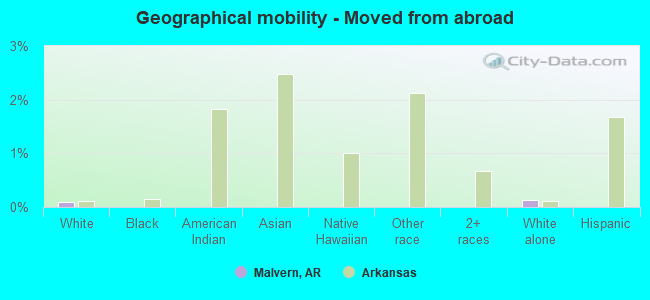
Geographical mobility - Moved from abroad (%)
Geographical mobility - Moved from abroad (%) - White
Geographical mobility - Moved from abroad (%) - Black or African American
Geographical mobility - Moved from abroad (%) - Asian
Geographical mobility - Moved from abroad (%) - Hispanic or Latino
Geographical mobility - Moved from abroad (%) - American Indian and Alaska Native
Geographical mobility - Moved from abroad (%) - Multirace
Geographical mobility - Moved from abroad (%) - Other Race
Place of birth for the foreign-born population - Ireland (%)
Place of birth for the foreign-born population - Denmark (%)
Place of birth for the foreign-born population - Norway (%)
Place of birth for the foreign-born population - Sweden (%)
Place of birth for the foreign-born population - United Kingdom (%)
Place of birth for the foreign-born population - England (%)
Place of birth for the foreign-born population - Scotland (%)
Place of birth for the foreign-born population - Other Northern Europe (%)
Place of birth for the foreign-born population - Austria (%)
Place of birth for the foreign-born population - Belgium (%)
Place of birth for the foreign-born population - France (%)
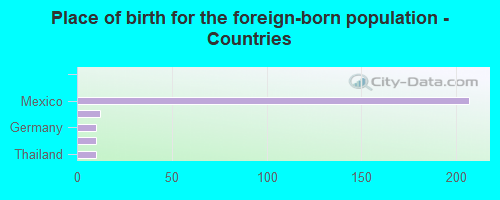
Place of birth for the foreign-born population - Germany (%)
Place of birth for the foreign-born population - Netherlands (%)
Place of birth for the foreign-born population - Switzerland (%)
Place of birth for the foreign-born population - Other Western Europe (%)
Place of birth for the foreign-born population - Greece (%)
Place of birth for the foreign-born population - Italy (%)
Place of birth for the foreign-born population - Portugal (%)
Place of birth for the foreign-born population - Spain (%)
Place of birth for the foreign-born population - Other Southern Europe (%)
Place of birth for the foreign-born population - Albania (%)
Place of birth for the foreign-born population - Belarus (%)
Place of birth for the foreign-born population - Bosnia and Herzegovina (%)
Place of birth for the foreign-born population - Bulgaria (%)
Place of birth for the foreign-born population - Croatia (%)
Place of birth for the foreign-born population - Czechoslovakia (%)
Place of birth for the foreign-born population - Hungary (%)
Place of birth for the foreign-born population - Latvia (%)
Place of birth for the foreign-born population - Lithuania (%)
Place of birth for the foreign-born population - North Macedonia (Macedonia) (%)
Place of birth for the foreign-born population - Moldova (%)
Place of birth for the foreign-born population - Poland (%)
Place of birth for the foreign-born population - Romania (%)
Place of birth for the foreign-born population - Russia (%)
Place of birth for the foreign-born population - Serbia (%)
Place of birth for the foreign-born population - Ukraine (%)
Place of birth for the foreign-born population - Other Eastern Europe (%)
Place of birth for the foreign-born population - China (%)
Place of birth for the foreign-born population - Hong Kong (%)
Place of birth for the foreign-born population - Taiwan (%)
Place of birth for the foreign-born population - Japan (%)
Place of birth for the foreign-born population - Korea (%)
Place of birth for the foreign-born population - Other Eastern Asia (%)
Place of birth for the foreign-born population - Afghanistan (%)
Place of birth for the foreign-born population - Bangladesh (%)
Place of birth for the foreign-born population - India (%)
Place of birth for the foreign-born population - Iran (%)
Place of birth for the foreign-born population - Kazakhstan (%)
Place of birth for the foreign-born population - Nepal (%)
Place of birth for the foreign-born population - Pakistan (%)
Place of birth for the foreign-born population - Sri Lanka (%)
Place of birth for the foreign-born population - Uzbekistan (%)
Place of birth for the foreign-born population - Other South Central Asia (%)
Place of birth for the foreign-born population - Burma (%)
Place of birth for the foreign-born population - Cambodia (%)
Place of birth for the foreign-born population - Indonesia (%)
Place of birth for the foreign-born population - Laos (%)
Place of birth for the foreign-born population - Malaysia (%)
Place of birth for the foreign-born population - Philippines (%)
Place of birth for the foreign-born population - Singapore (%)
Place of birth for the foreign-born population - Thailand (%)
Place of birth for the foreign-born population - Vietnam (%)
Place of birth for the foreign-born population - Other South Eastern Asia (%)
Place of birth for the foreign-born population - Armenia (%)
Place of birth for the foreign-born population - Iraq (%)
Place of birth for the foreign-born population - Israel (%)
Place of birth for the foreign-born population - Jordan (%)
Place of birth for the foreign-born population - Kuwait (%)
Place of birth for the foreign-born population - Lebanon (%)
Place of birth for the foreign-born population - Saudi Arabia (%)
Place of birth for the foreign-born population - Syria (%)
Place of birth for the foreign-born population - Turkey (%)
Place of birth for the foreign-born population - Yemen (%)
Place of birth for the foreign-born population - Other Western Asia (%)
Place of birth for the foreign-born population - Eritrea (%)
Place of birth for the foreign-born population - Ethiopia (%)
Place of birth for the foreign-born population - Kenya (%)
Place of birth for the foreign-born population - Somalia (%)
Place of birth for the foreign-born population - Uganda (%)
Place of birth for the foreign-born population - Zimbabwe (%)
Place of birth for the foreign-born population - Other Eastern Africa (%)
Place of birth for the foreign-born population - Cameroon (%)
Place of birth for the foreign-born population - Congo (%)
Place of birth for the foreign-born population - Democratic Republic of Congo (Zaire) (%)
Place of birth for the foreign-born population - Other Middle Africa (%)
Place of birth for the foreign-born population - Egypt (%)
Place of birth for the foreign-born population - Morocco (%)
Place of birth for the foreign-born population - Sudan (%)
Place of birth for the foreign-born population - Other Northern Africa (%)
Place of birth for the foreign-born population - South Africa (%)
Place of birth for the foreign-born population - Other Southern Africa (%)
Place of birth for the foreign-born population - Cabo Verde (%)
Place of birth for the foreign-born population - Ghana (%)
Place of birth for the foreign-born population - Liberia (%)
Place of birth for the foreign-born population - Nigeria (%)
Place of birth for the foreign-born population - Senegal (%)
Place of birth for the foreign-born population - Sierra Leone (%)
Place of birth for the foreign-born population - Other Western Africa (%)
Place of birth for the foreign-born population - Australia (%)
Place of birth for the foreign-born population - New Zealand (%)
Place of birth for the foreign-born population - Fiji (%)
Place of birth for the foreign-born population - Micronesia (%)
Place of birth for the foreign-born population - Bahamas (%)
Place of birth for the foreign-born population - Barbados (%)
Place of birth for the foreign-born population - Cuba (%)
Place of birth for the foreign-born population - Dominica (%)
Place of birth for the foreign-born population - Dominican Republic (%)
Place of birth for the foreign-born population - Grenada (%)
Place of birth for the foreign-born population - Haiti (%)
Place of birth for the foreign-born population - Jamaica (%)
Place of birth for the foreign-born population - St. Vincent and the Grenadines (%)
Place of birth for the foreign-born population - Trinidad and Tobago (%)
Place of birth for the foreign-born population - West Indies (%)
Place of birth for the foreign-born population - Other Caribbean (%)
Place of birth for the foreign-born population - Belize (%)
Place of birth for the foreign-born population - Costa Rica (%)
Place of birth for the foreign-born population - El Salvador (%)
Place of birth for the foreign-born population - Guatemala (%)
Place of birth for the foreign-born population - Honduras (%)
Place of birth for the foreign-born population - Mexico (%)
Place of birth for the foreign-born population - Nicaragua (%)
Place of birth for the foreign-born population - Panama (%)
Place of birth for the foreign-born population - Other Central America (%)
Place of birth for the foreign-born population - Argentina (%)
Place of birth for the foreign-born population - Bolivia (%)
Place of birth for the foreign-born population - Brazil (%)
Place of birth for the foreign-born population - Chile (%)
Place of birth for the foreign-born population - Colombia (%)
Place of birth for the foreign-born population - Ecuador (%)
Place of birth for the foreign-born population - Guyana (%)
Place of birth for the foreign-born population - Peru (%)
Place of birth for the foreign-born population - Uruguay (%)
Place of birth for the foreign-born population - Venezuela (%)
Place of birth for the foreign-born population - Other South America (%)
Place of birth for the foreign-born population - Canada (%)
Place of birth for the foreign-born population - Other Northern America (%)
Place of birth for the foreign-born population - Other (%)
Latest news about races in Malvern, AR collected exclusively by city-data.com from local newspapers, TV, and radio stations
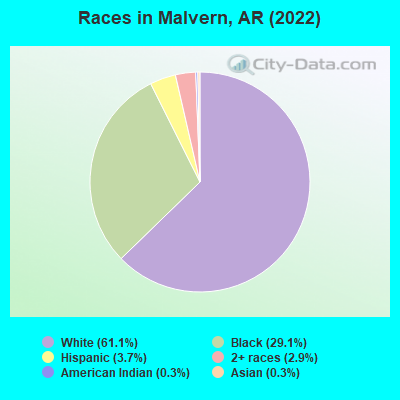
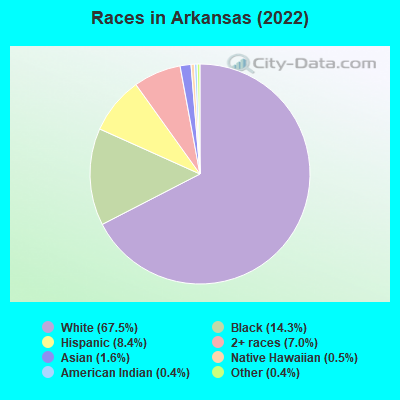
According to 2022 data, the most numerous races in Malvern, AR are White alone (6,673 residents), Black alone (3,078 residents), and Hispanic (524 residents). 96.2% of Malvern residents speak English at home. 2.3% of Malvern, AR residents are foreign-born (1.8% born in Latin America, 0.3% born in Asia), which is 76.2% less than the foreign-born rate of 4.0% across the entire state of Arkansas.
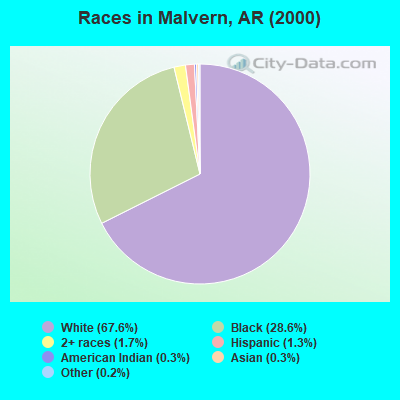
Race distribution in Malvern
2000 2022
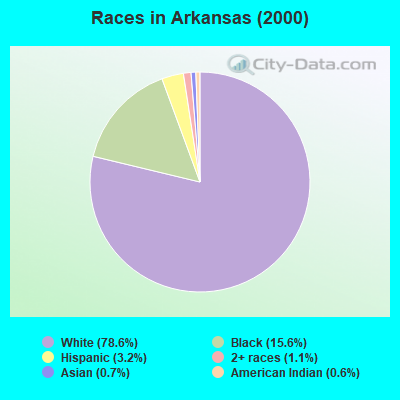
2,100,135 78.6% White alone 416,615 15.6% Black alone 86,866 3.2% Hispanic 30,364 1.1% Two or more races 19,892 0.7% Asian alone 16,702 0.6% American Indian alone 1,494 0.06% Native Hawaiian and Other 1,332 0.05% Other race alone
2,054,922 67.5% White alone 435,637 14.3% Black alone 255,416 8.4% Hispanic 213,684 7.0% Two or more races 47,592 1.6% Asian alone 14,176 0.5% Native Hawaiian and Other 12,680 0.4% American Indian alone 11,530 0.4% Other race alone
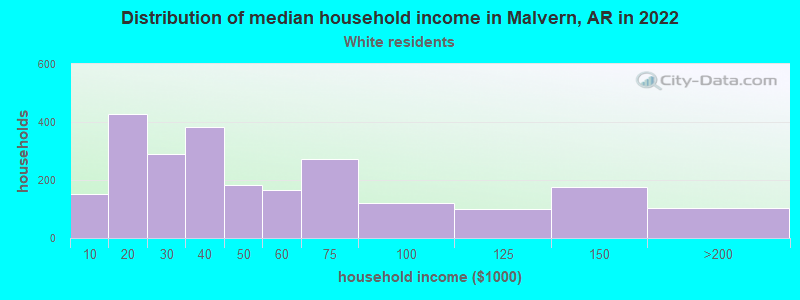
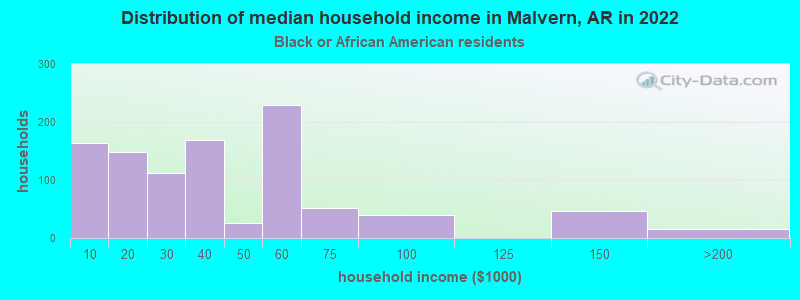
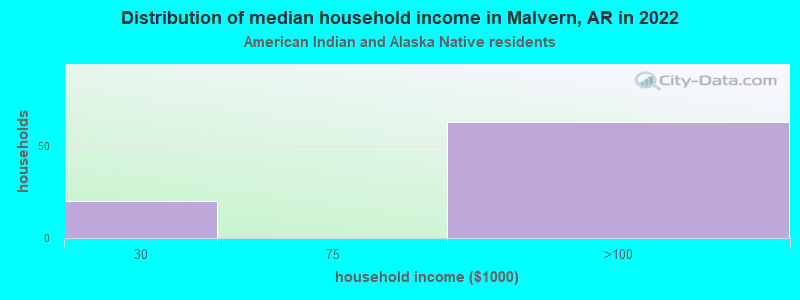
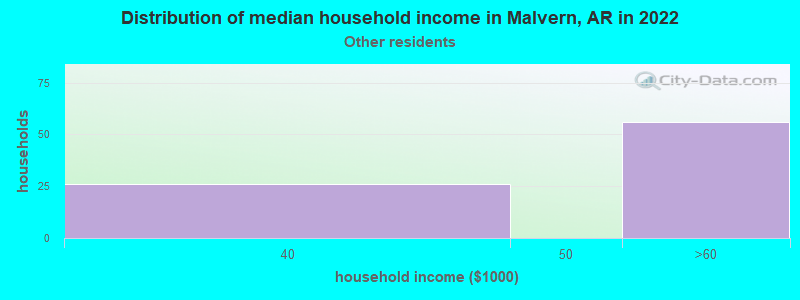
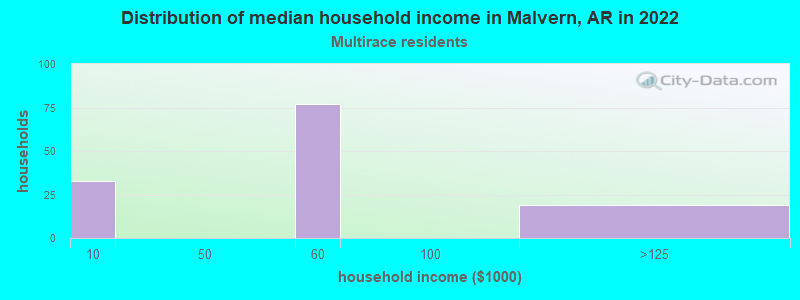
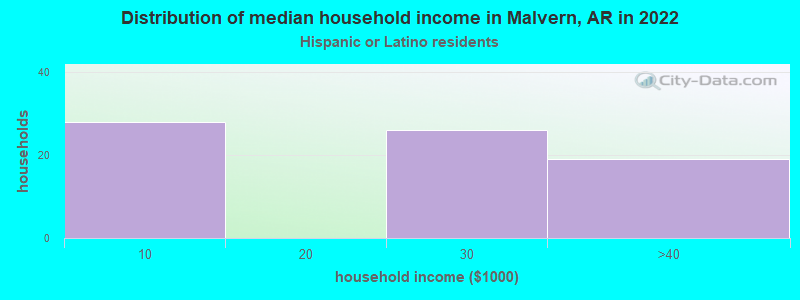
Income and house value in Malvern Median household income in 2022 $41,621 White non-Hispanic householders$37,399 Black householders$16,322 American Indian and Alaska Native householders$175,038 Asian householders$52,894 Some other race householders$39,039 Two or more races householders$47,331 Hispanic or Latino race householdersMedian 2022 house value $142,186 White Non-Hispanic householders$107,506 Black or African American householders$26,673 American Indian or Alaska Native householders$126,713 Two or more races householders
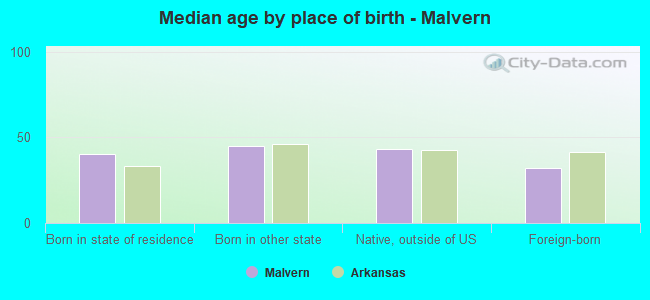
Median age by race in Malvern
44.5 Median age for White residents41.9 49.9 38.5 Median age for Black or African American residents36.4 39.2 83.2 Median age for American Indian / Alaska Native residents36.7 Median age for Asian residents32.5 Median age for Other race residents34.0 Median age for Two or more races residents33.9 35.1 45.2 Median age for White alone residents41.4 50.3 31.1 Median age for Hispanic or Latino residents31.5 30.9
Owner/renter occupied households by race in Malvern
House owners and renters - White residents 1,760 69.0% Owner occupied792 31.0% Renter occupiedHouse owners and renters - Black or African American residents 429 42.5% Owner occupied580 57.5% Renter occupiedHouse owners and renters - American Indian / Alaska Native residents 37 100.0% Owner occupiedHouse owners and renters - Other race residents 78 100.0% Renter occupiedHouse owners and renters - Two or more races residents 44 12.1% Owner occupied319 87.9% Renter occupiedHouse owners and renters - White alone residents 1,736 68.3% Owner occupied806 31.7% Renter occupiedHouse owners and renters - Hispanic or Latino residents 38 30.7% Owner occupied86 69.3% Renter occupied
Language usage in Malvern
English speakers - Total 96.2% of residents of Malvern speak English at home.
2.9% of residents speak Spanish at home 209 67.6% Speak English very well100 32.4% Speak English less than very well0.8% of residents speak other language at home 68 81.9% Speak English very well15 18.1% Speak English less than very well
English speakers - Born in the United States 96.6% of residents of Malvern speak English at home.
1.4% of residents speak Spanish at home 43 100.0% Speak English very well1.9% of residents speak other language at home 57 100.0% Speak English very well
English speakers - Native, born elsewhere 56.9% of residents of Malvern speak English at home.
33.3% of residents speak Spanish at home 17 100.0% Speak English very well7.8% of residents speak other language at home 4 100.0% Speak English very well
English speakers - Foreign-born 35.9% of residents of Malvern speak English at home.
65.7% of residents speak Spanish at home 83 50.3% Speak English very well82 49.7% Speak English less than very well
White (Caucasian) - Speak only English Native:
98.7% (6,537)Foreign-born:
13.5% (8)
White (Caucasian) - Speak another language Native:
1.4% (92)Foreign-born:
84.0% (52)
Other race - Speak only English Native:
68.1% (57)Foreign-born:
56.6% (68)
Other race - Speak another language Native:
40.1% (34)Foreign-born:
63.4% (76)
White alone - Speak only English Native:
99.3% (6,494)Foreign-born:
100.0% (8)
Hispanic or Latino - Speak only English Native:
60.9% (151)Foreign-born:
24.4% (54)
Hispanic or Latino - Speak another language Native:
40.5% (100)Foreign-born:
77.3% (172)
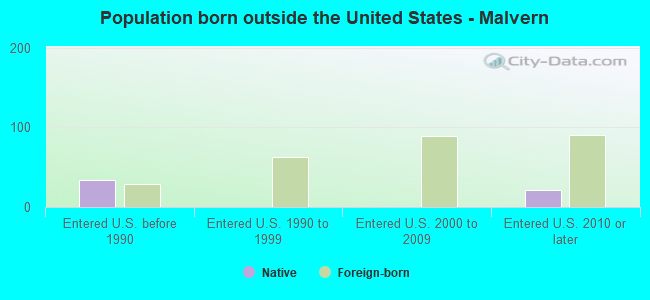
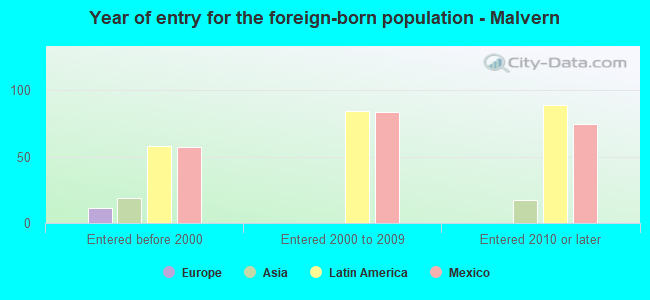
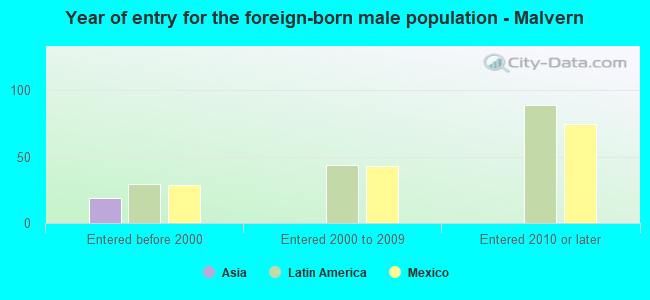
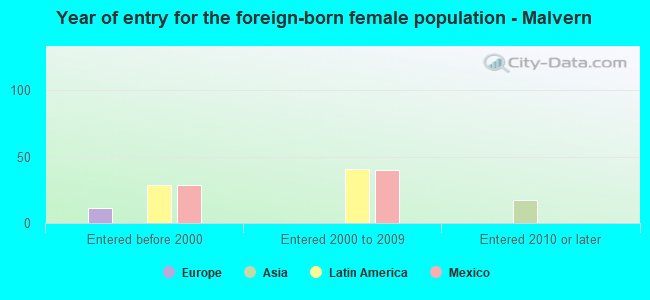
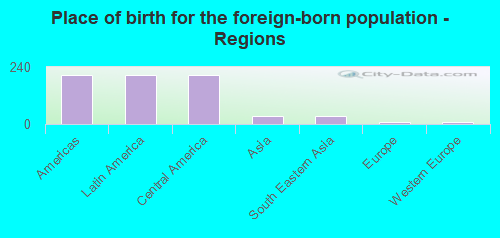
Foreign-born residents in Malvern 251 residents are foreign born (1.8% Latin America , 0.3% Asia ).
This city:
2.3%Arkansas:
100.0%
Marital status for residents in Malvern Marital status - White (Caucasian) population 15 years and over
Males 26.8% Never married40.6% Now married2.5% Separated4.3% Widowed25.7% DivorcedFemales 14.6% Never married49.4% Now married2.3% Separated15.8% Widowed17.9% DivorcedWomen who gave birth in the past 12 months Now married:
100.0% (56)Unmarried:
0.0% (0)
Women who did not give birth in the past 12 months Now married:
59.3% (632)Unmarried:
40.7% (433)
Marital status - Black or African American population 15 years and over
Males 45.7% Never married31.9% Now married3.6% Separated5.0% Widowed13.8% DivorcedFemales 41.0% Never married26.9% Now married7.2% Separated4.6% Widowed20.3% DivorcedWomen who gave birth in the past 12 months Now married:
60.0% (15)Unmarried:
40.0% (10)
Women who did not give birth in the past 12 months Now married:
25.9% (139)Unmarried:
74.1% (399)
Marital status - American Indian / Alaska Native population 15 years and over
Males 0.0% Never married78.7% Now married0.0% Separated0.0% Widowed21.3% DivorcedFemales 0.0% Never married100.0% Now married0.0% Separated0.0% Widowed0.0% DivorcedMarital status - Asian population 15 years and over
Males 25.6% Never married25.6% Now married23.1% Separated0.0% Widowed25.6% DivorcedFemales 73.9% Never married26.1% Now married0.0% Separated0.0% Widowed0.0% DivorcedWomen who did not give birth in the past 12 months Now married:
26.1% (12)Unmarried:
73.9% (34)
Marital status - Other race population 15 years and over
Males 7.8% Never married82.5% Now married0.0% Separated0.0% Widowed9.7% DivorcedFemales 0.0% Never married100.0% Now married0.0% Separated0.0% Widowed0.0% DivorcedWomen who gave birth in the past 12 months Now married:
100.0% (45)Unmarried:
0.0% (0)
Marital status - Two or more races population 15 years and over
Males 49.1% Never married50.9% Now married0.0% Separated0.0% Widowed0.0% DivorcedFemales 12.1% Never married60.6% Now married0.0% Separated11.4% Widowed15.9% DivorcedWomen who did not give birth in the past 12 months Now married:
100.0% (233)Unmarried:
0.0% (0)
Marital status - White alone, not Hispanic / Latino population 15 years and over
Males 27.0% Never married40.8% Now married2.6% Separated4.4% Widowed25.2% DivorcedFemales 14.8% Never married48.8% Now married2.3% Separated16.0% Widowed18.1% DivorcedWomen who gave birth in the past 12 months Now married:
100.0% (56)Unmarried:
0.0% (0)
Women who did not give birth in the past 12 months Now married:
58.2% (611)Unmarried:
41.8% (439)
Marital status - Hispanic or Latino population 15 years and over
Males 16.3% Never married58.6% Now married0.0% Separated0.0% Widowed25.1% DivorcedFemales 0.0% Never married100.0% Now married0.0% Separated0.0% Widowed0.0% DivorcedWomen who gave birth in the past 12 months Now married:
100.0% (48)Unmarried:
0.0% (0)
Women who did not give birth in the past 12 months Now married:
100.0% (35)Unmarried:
0.0% (0)
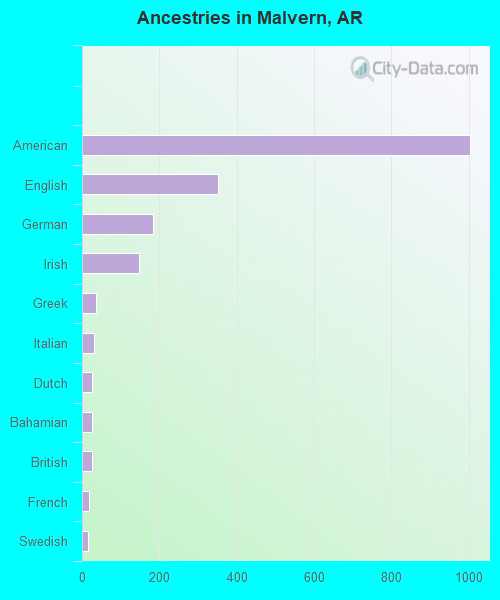
Ancestries in Malvern
731 12.7% American474 8.2% Irish299 5.2% English164 2.9% German63 1.1% European45 0.8% Northern European40 0.7% French39 0.7% Swedish28 0.5% Scotch-Irish24 0.4% Haitian19 0.3% British19 0.3% African6 0.1% Dutch
Children Nativity (place of birth) in Malvern
Children under 6 years - Living with two parents Both parents native 210 100.0% NativeBoth parents foreign-born 63 100.0% NativeChildren under 6 years - Living with one parent Native parent 248 100.0% Native
Children 6 to 17 years - Living with two parents Both parents native 470 100.0% NativeBoth parents foreign-born 62 100.0% NativeChildren 6 to 17 years - Living with one parent Native parent 443 100.0% Native
Grandparents responsible for own grandchildren in Malvern
Grandparents (30 to 59 years) White / Caucasian 17 29.7% Responsible for grandchildren39 70.3% Not responsible for grandchildrenBlack or African American 11 100.0% Responsible for grandchildrenWhite alone, not Hispanic / Latino 17 28.4% Responsible for grandchildren42 71.6% Not responsible for grandchildrenGrandparents (60 years and over) White / Caucasian 12 28.9% Responsible for grandchildren29 71.1% Not responsible for grandchildrenBlack or African American 27 68.2% Responsible for grandchildren13 31.8% Not responsible for grandchildrenWhite alone, not Hispanic / Latino 12 28.8% Responsible for grandchildren29 71.2% Not responsible for grandchildren