Races in Merrimac, Massachusetts (MA) Detailed Stats
Ancestries, Foreign-born residents, place of birth

Recent posts about races in Merrimac, Massachusetts on our local forum with over 2,400,000 registered users:
 | Jury Duty - Lawrence Superior Courthouse (13 replies) |
| towns that offer the most jobs per dollar of house (58 replies) |
| Boston Racial Stigma- is it "cool" to hate on Boston? (632 replies) |
| Am I crazy for excluding MA homes in my home search because they don't have air conditioning? (80 replies) |
| How on earth can we get into Boston? (107 replies) |
| Bike Routes in Boston + Trip Tips (43 replies) |
Latest news about races in Merrimac, MA collected exclusively by city-data.com from local newspapers, TV, and radio stations
1.8% of Merrimac, MA residents are foreign-born , which is 904.4% less than the foreign-born rate of 18.0% across the entire state of Massachusetts.
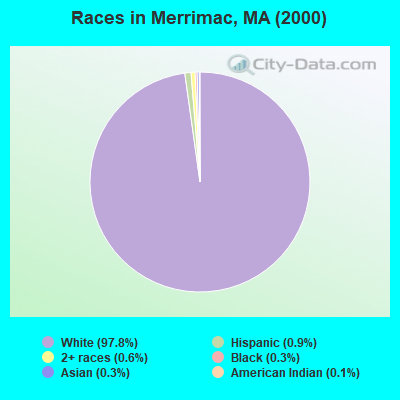
Race distribution in Merrimac

- 6,00297.8%White alone
- 550.9%Hispanic
- 360.6%Two or more races
- 170.3%Asian alone
- 190.3%Black alone
- 70.1%American Indian alone
- 20.03%Other race alone
2000
2022
-
- 5,198,35981.9%White alone
- 428,7296.8%Hispanic
- 318,3295.0%Black alone
- 236,7863.7%Asian alone
- 110,3381.7%Two or more races
- 43,5860.7%Other race alone
- 11,2640.2%American Indian alone
- 1,7060.03%Native Hawaiian and Other
Pacific Islander alone

-
- 4,676,62767.0%White alone
- 911,03813.0%Hispanic
- 501,4637.2%Asian alone
- 459,7406.6%Black alone
- 341,8894.9%Two or more races
- 84,4031.2%Other race alone
- 5,8380.08%American Indian alone
- 9760.01%Native Hawaiian and Other
Pacific Islander alone

Income and house value in Merrimac
- Median household income in 2022
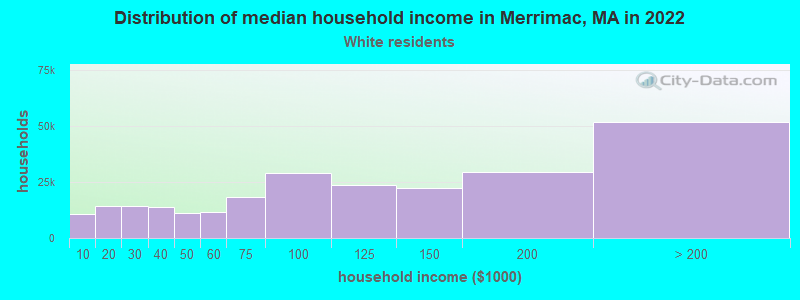
- $110,708White non-Hispanic householders
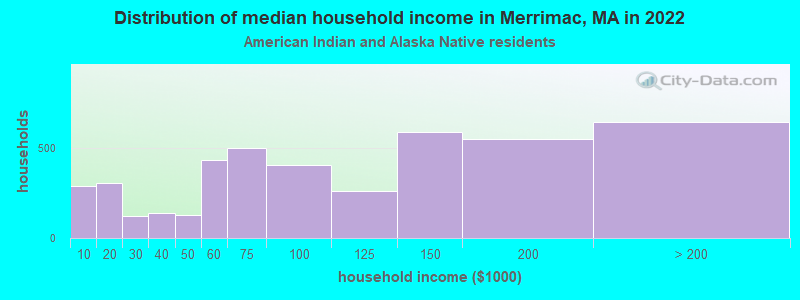
- $92,297American Indian and Alaska Native householders
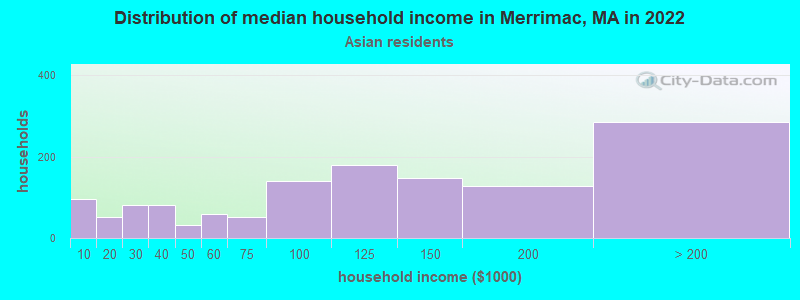
- $16,548Asian householders
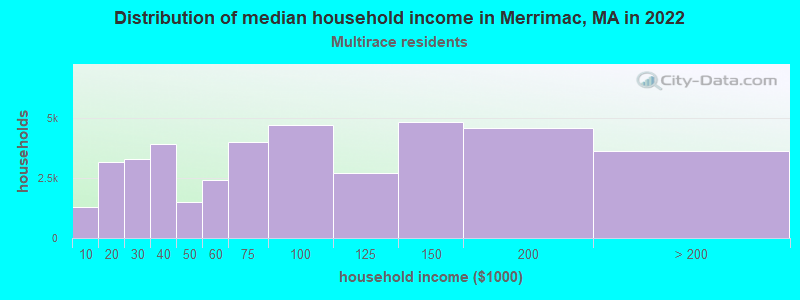
- $118,999Two or more races householders
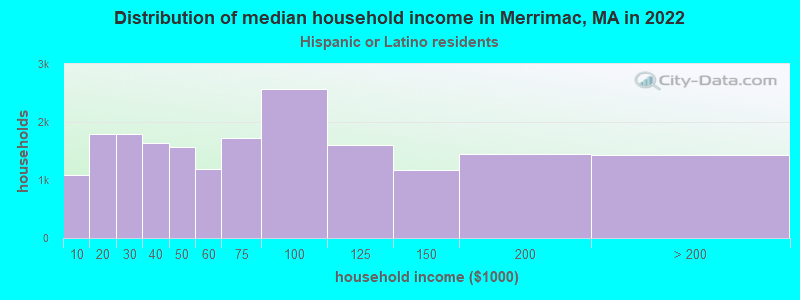
- $20,025Hispanic or Latino race householders
- Median 2022 house value
- $632,757White Non-Hispanic householders
- $982,978American Indian or Alaska Native householders
- $526,595Two or more races householders
Household income for White non-Hispanic householders
Household income for American Indian and Alaska Native householders
Household income for Asian householders
Household income for Two or more races householders
Household income for Hispanic or Latino race householders
Foreign-born residents in Merrimac
110 residents are foreign born
| This city: | 1.8% |
| Massachusetts: | 12.2% |
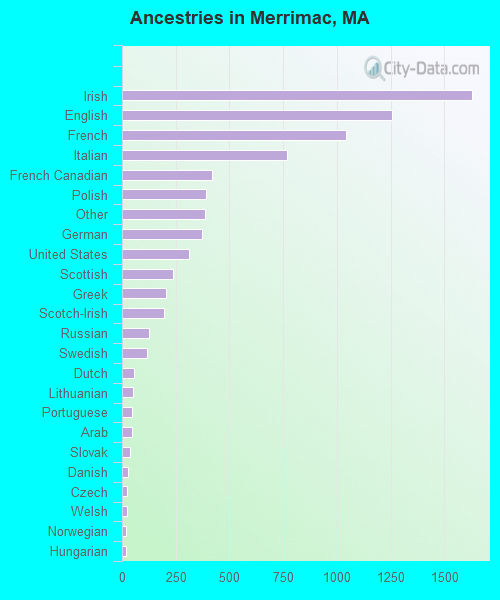
Ancestries in Merrimac

- 1,62620.9%Irish
- 1,25616.1%English
- 1,04413.4%French
- 7669.8%Italian
- 4175.3%French Canadian
- 3915.0%Polish
- 3854.9%Other
- 3704.7%German
- 3104.0%United States
- 2353.0%Scottish
- 2072.7%Greek
- 1972.5%Scotch-Irish
- 1251.6%Russian
- 1151.5%Swedish
- 570.7%Dutch
- 500.6%Lithuanian
- 470.6%Portuguese
- 450.6%Arab
- 350.4%Slovak
- 260.3%Danish
- 240.3%Czech
- 220.3%Welsh
- 190.2%Norwegian
- 180.2%Hungarian
- 90.1%Subsaharan African
Zip codes: 01860.