Races in Monterey Park, California (CA) Detailed Stats
Data:
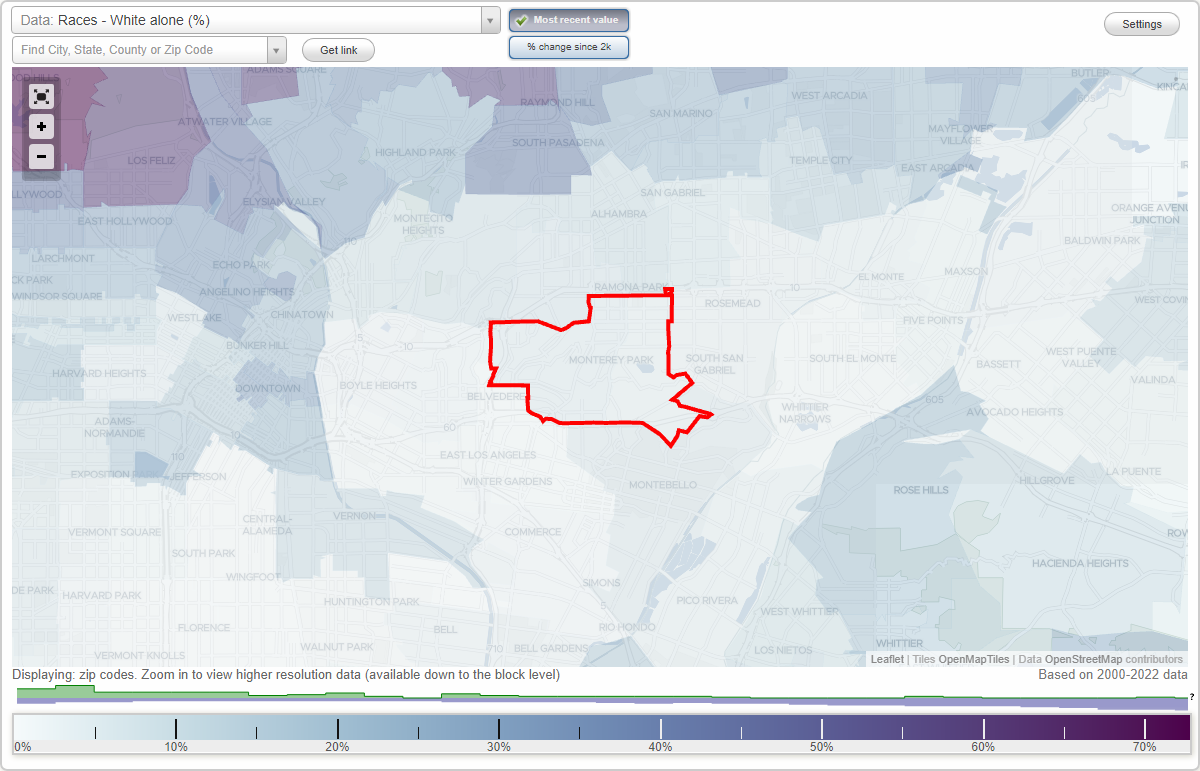
Races - White alone (%)
Races - White alone (% change since 2000)
Races - Black alone (%)
Races - Black alone (% change since 2000)
Races - American Indian alone (%)
Races - American Indian alone (% change since 2000)
Races - Asian alone (%)
Races - Asian alone (% change since 2000)
Races - Hispanic (%)
Races - Hispanic (% change since 2000)
Races - Native Hawaiian and Other Pacific Islander alone (%)
Races - Native Hawaiian and Other Pacific Islander alone (% change since 2000)
Races - Two or more races(%)
Races - Two or more races(% change since 2000)
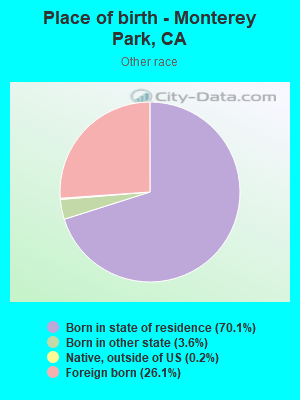
Races - Other race alone (%)
Races - Other race alone (% change since 2000)
Racial diversity
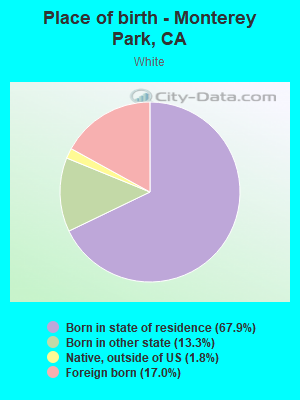
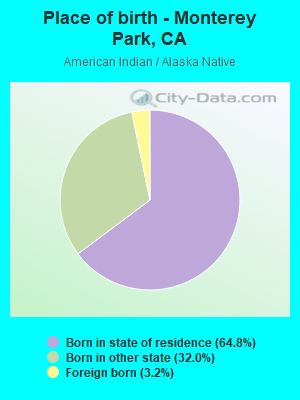
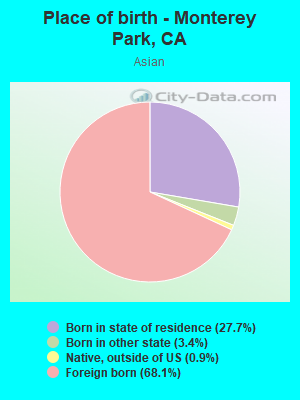
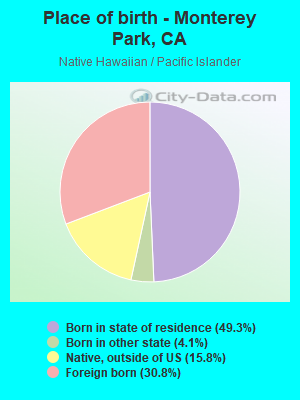
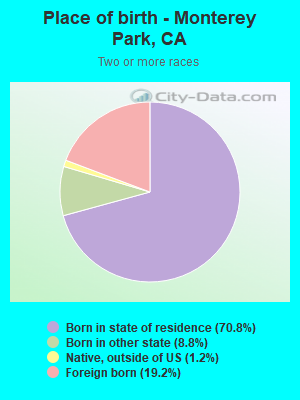
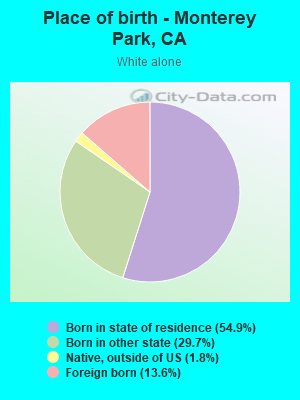
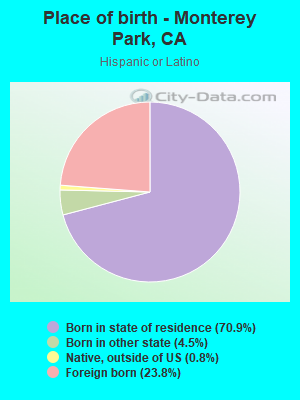
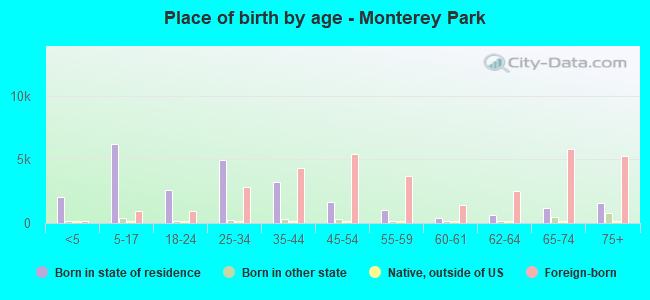
Place of birth - Born in state of residence (%)
Place of birth - Born in state of residence (%) - White
Place of birth - Born in state of residence (%) - Black or African American
Place of birth - Born in state of residence (%) - Asian
Place of birth - Born in state of residence (%) - Hispanic or Latino
Place of birth - Born in state of residence (%) - American Indian and Alaska Native
Place of birth - Born in state of residence (%) - Multirace
Place of birth - Born in state of residence (%) - Other Race
Place of birth - Born in other state (%)
Place of birth - Born in other state (%) - White
Place of birth - Born in other state (%) - Black or African American
Place of birth - Born in other state (%) - Asian
Place of birth - Born in other state (%) - Hispanic or Latino
Place of birth - Born in other state (%) - American Indian and Alaska Native
Place of birth - Born in other state (%) - Multirace
Place of birth - Born in other state (%) - Other Race
Place of birth - Native, outside of US (%)
Place of birth - Native, outside of US (%) - White
Place of birth - Native, outside of US (%) - Black or African American
Place of birth - Native, outside of US (%) - Asian
Place of birth - Native, outside of US (%) - Hispanic or Latino
Place of birth - Native, outside of US (%) - American Indian and Alaska Native
Place of birth - Native, outside of US (%) - Multirace
Place of birth - Native, outside of US (%) - Other Race
Place of birth - Foreign born (%)
Place of birth - Foreign born (%) - White
Place of birth - Foreign born (%) - Black or African American
Place of birth - Foreign born (%) - Asian
Place of birth - Foreign born (%) - Hispanic or Latino
Place of birth - Foreign born (%) - American Indian and Alaska Native
Place of birth - Foreign born (%) - Multirace
Place of birth - Foreign born (%) - Other Race
Residents speaking English at home (%)
Residents speaking English at home - Born in the United States (%)
Residents speaking English at home - Native, born elsewhere (%)
Residents speaking English at home - Foreign born (%)
Residents speaking Spanish at home (%)
Residents speaking Spanish at home - Born in the United States (%)
Residents speaking Spanish at home - Native, born elsewhere (%)
Residents speaking Spanish at home - Foreign born (%)
Residents speaking other language at home (%)
Residents speaking other language at home - Born in the United States (%)
Residents speaking other language at home - Native, born elsewhere (%)
Residents speaking other language at home - Foreign born (%)
Marital status - Never married (%)
Marital status - Now married (%)
Marital status - Separated (%)
Marital status - Widowed (%)
Marital status - Divorced (%)
Ancestries Reported - Arab (%)
Ancestries Reported - Czech (%)
Ancestries Reported - Danish (%)
Ancestries Reported - Dutch (%)
Ancestries Reported - English (%)
Ancestries Reported - French (%)
Ancestries Reported - French Canadian (%)
Ancestries Reported - German (%)
Ancestries Reported - Greek (%)
Ancestries Reported - Hungarian (%)
Ancestries Reported - Irish (%)
Ancestries Reported - Italian (%)
Ancestries Reported - Lithuanian (%)
Ancestries Reported - Norwegian (%)
Ancestries Reported - Polish (%)
Ancestries Reported - Portuguese (%)
Ancestries Reported - Russian (%)
Ancestries Reported - Scotch-Irish (%)
Ancestries Reported - Scottish (%)
Ancestries Reported - Slovak (%)
Ancestries Reported - Subsaharan African (%)
Ancestries Reported - Swedish (%)
Ancestries Reported - Swiss (%)
Ancestries Reported - Ukrainian (%)
Ancestries Reported - United States (%)
Ancestries Reported - Welsh (%)
Ancestries Reported - West Indian (%)
Ancestries Reported - Other (%)
Geographical mobility - Same house 1 year ago (%)
Geographical mobility - Same house 1 year ago (%) - White
Geographical mobility - Same house 1 year ago (%) - Black or African American
Geographical mobility - Same house 1 year ago (%) - Asian
Geographical mobility - Same house 1 year ago (%) - Hispanic or Latino
Geographical mobility - Same house 1 year ago (%) - American Indian and Alaska Native
Geographical mobility - Same house 1 year ago (%) - Multirace
Geographical mobility - Same house 1 year ago (%) - Other Race
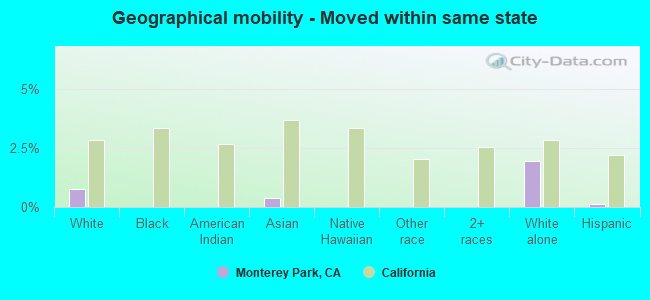
Geographical mobility - Moved within same county (%)
Geographical mobility - Moved within same county (%) - White
Geographical mobility - Moved within same county (%) - Black or African American
Geographical mobility - Moved within same county (%) - Asian
Geographical mobility - Moved within same county (%) - Hispanic or Latino
Geographical mobility - Moved within same county (%) - American Indian and Alaska Native
Geographical mobility - Moved within same county (%) - Multirace
Geographical mobility - Moved within same county (%) - Other Race
Geographical mobility - Moved from different county within same state (%)
Geographical mobility - Moved from different county within same state (%) - White
Geographical mobility - Moved from different county within same state (%) - Black or African American
Geographical mobility - Moved from different county within same state (%) - Asian
Geographical mobility - Moved from different county within same state (%) - Hispanic or Latino
Geographical mobility - Moved from different county within same state (%) - American Indian and Alaska Native
Geographical mobility - Moved from different county within same state (%) - Multirace
Geographical mobility - Moved from different county within same state (%) - Other Race
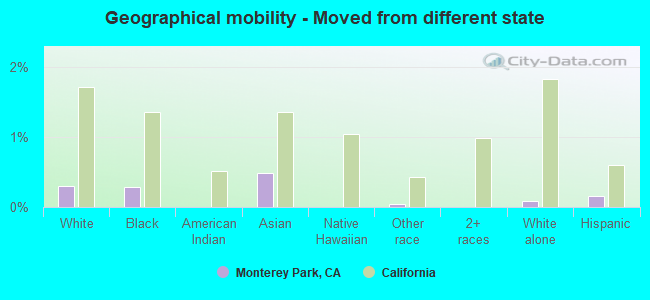
Geographical mobility - Moved from different state (%)
Geographical mobility - Moved from different state (%) - White
Geographical mobility - Moved from different state (%) - Black or African American
Geographical mobility - Moved from different state (%) - Asian
Geographical mobility - Moved from different state (%) - Hispanic or Latino
Geographical mobility - Moved from different state (%) - American Indian and Alaska Native
Geographical mobility - Moved from different state (%) - Multirace
Geographical mobility - Moved from different state (%) - Other Race
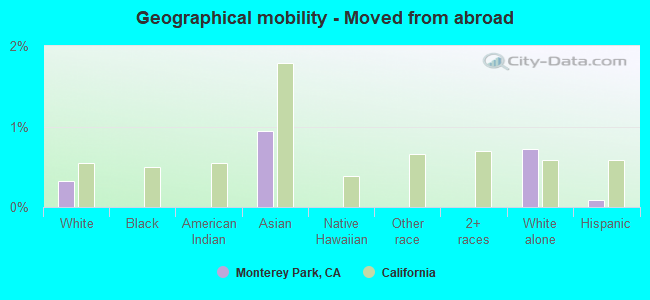
Geographical mobility - Moved from abroad (%)
Geographical mobility - Moved from abroad (%) - White
Geographical mobility - Moved from abroad (%) - Black or African American
Geographical mobility - Moved from abroad (%) - Asian
Geographical mobility - Moved from abroad (%) - Hispanic or Latino
Geographical mobility - Moved from abroad (%) - American Indian and Alaska Native
Geographical mobility - Moved from abroad (%) - Multirace
Geographical mobility - Moved from abroad (%) - Other Race
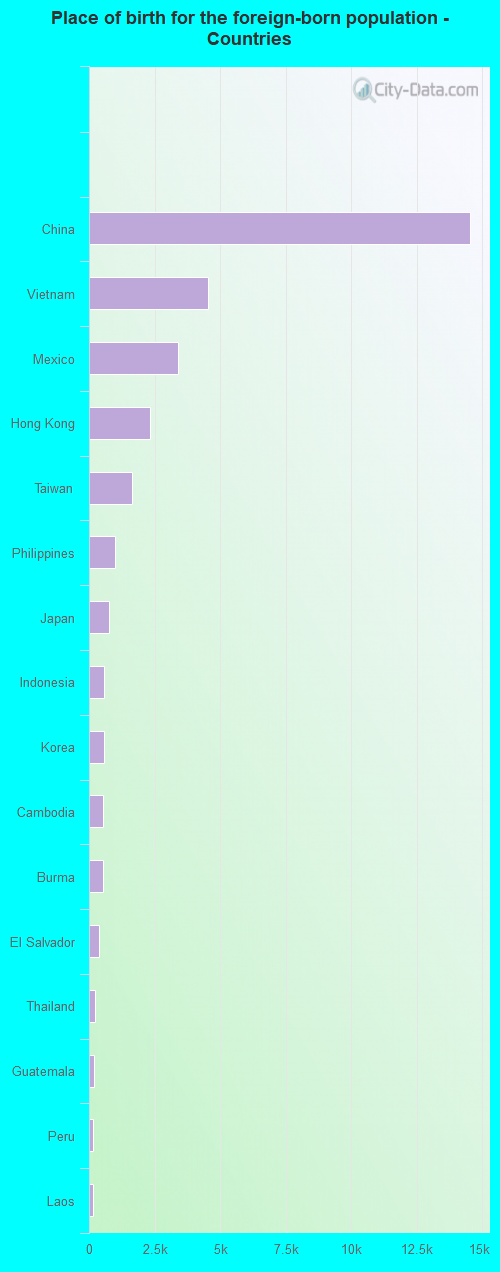
Place of birth for the foreign-born population - Ireland (%)
Place of birth for the foreign-born population - Denmark (%)
Place of birth for the foreign-born population - Norway (%)
Place of birth for the foreign-born population - Sweden (%)
Place of birth for the foreign-born population - United Kingdom (%)
Place of birth for the foreign-born population - England (%)
Place of birth for the foreign-born population - Scotland (%)
Place of birth for the foreign-born population - Other Northern Europe (%)
Place of birth for the foreign-born population - Austria (%)
Place of birth for the foreign-born population - Belgium (%)
Place of birth for the foreign-born population - France (%)
Place of birth for the foreign-born population - Germany (%)
Place of birth for the foreign-born population - Netherlands (%)
Place of birth for the foreign-born population - Switzerland (%)
Place of birth for the foreign-born population - Other Western Europe (%)
Place of birth for the foreign-born population - Greece (%)
Place of birth for the foreign-born population - Italy (%)
Place of birth for the foreign-born population - Portugal (%)
Place of birth for the foreign-born population - Spain (%)
Place of birth for the foreign-born population - Other Southern Europe (%)
Place of birth for the foreign-born population - Albania (%)
Place of birth for the foreign-born population - Belarus (%)
Place of birth for the foreign-born population - Bosnia and Herzegovina (%)
Place of birth for the foreign-born population - Bulgaria (%)
Place of birth for the foreign-born population - Croatia (%)
Place of birth for the foreign-born population - Czechoslovakia (%)
Place of birth for the foreign-born population - Hungary (%)
Place of birth for the foreign-born population - Latvia (%)
Place of birth for the foreign-born population - Lithuania (%)
Place of birth for the foreign-born population - North Macedonia (Macedonia) (%)
Place of birth for the foreign-born population - Moldova (%)
Place of birth for the foreign-born population - Poland (%)
Place of birth for the foreign-born population - Romania (%)
Place of birth for the foreign-born population - Russia (%)
Place of birth for the foreign-born population - Serbia (%)
Place of birth for the foreign-born population - Ukraine (%)
Place of birth for the foreign-born population - Other Eastern Europe (%)
Place of birth for the foreign-born population - China (%)
Place of birth for the foreign-born population - Hong Kong (%)
Place of birth for the foreign-born population - Taiwan (%)
Place of birth for the foreign-born population - Japan (%)
Place of birth for the foreign-born population - Korea (%)
Place of birth for the foreign-born population - Other Eastern Asia (%)
Place of birth for the foreign-born population - Afghanistan (%)
Place of birth for the foreign-born population - Bangladesh (%)
Place of birth for the foreign-born population - India (%)
Place of birth for the foreign-born population - Iran (%)
Place of birth for the foreign-born population - Kazakhstan (%)
Place of birth for the foreign-born population - Nepal (%)
Place of birth for the foreign-born population - Pakistan (%)
Place of birth for the foreign-born population - Sri Lanka (%)
Place of birth for the foreign-born population - Uzbekistan (%)
Place of birth for the foreign-born population - Other South Central Asia (%)
Place of birth for the foreign-born population - Burma (%)
Place of birth for the foreign-born population - Cambodia (%)
Place of birth for the foreign-born population - Indonesia (%)
Place of birth for the foreign-born population - Laos (%)
Place of birth for the foreign-born population - Malaysia (%)
Place of birth for the foreign-born population - Philippines (%)
Place of birth for the foreign-born population - Singapore (%)
Place of birth for the foreign-born population - Thailand (%)
Place of birth for the foreign-born population - Vietnam (%)
Place of birth for the foreign-born population - Other South Eastern Asia (%)
Place of birth for the foreign-born population - Armenia (%)
Place of birth for the foreign-born population - Iraq (%)
Place of birth for the foreign-born population - Israel (%)
Place of birth for the foreign-born population - Jordan (%)
Place of birth for the foreign-born population - Kuwait (%)
Place of birth for the foreign-born population - Lebanon (%)
Place of birth for the foreign-born population - Saudi Arabia (%)
Place of birth for the foreign-born population - Syria (%)
Place of birth for the foreign-born population - Turkey (%)
Place of birth for the foreign-born population - Yemen (%)
Place of birth for the foreign-born population - Other Western Asia (%)
Place of birth for the foreign-born population - Eritrea (%)
Place of birth for the foreign-born population - Ethiopia (%)
Place of birth for the foreign-born population - Kenya (%)
Place of birth for the foreign-born population - Somalia (%)
Place of birth for the foreign-born population - Uganda (%)
Place of birth for the foreign-born population - Zimbabwe (%)
Place of birth for the foreign-born population - Other Eastern Africa (%)
Place of birth for the foreign-born population - Cameroon (%)
Place of birth for the foreign-born population - Congo (%)
Place of birth for the foreign-born population - Democratic Republic of Congo (Zaire) (%)
Place of birth for the foreign-born population - Other Middle Africa (%)
Place of birth for the foreign-born population - Egypt (%)
Place of birth for the foreign-born population - Morocco (%)
Place of birth for the foreign-born population - Sudan (%)
Place of birth for the foreign-born population - Other Northern Africa (%)
Place of birth for the foreign-born population - South Africa (%)
Place of birth for the foreign-born population - Other Southern Africa (%)
Place of birth for the foreign-born population - Cabo Verde (%)
Place of birth for the foreign-born population - Ghana (%)
Place of birth for the foreign-born population - Liberia (%)
Place of birth for the foreign-born population - Nigeria (%)
Place of birth for the foreign-born population - Senegal (%)
Place of birth for the foreign-born population - Sierra Leone (%)
Place of birth for the foreign-born population - Other Western Africa (%)
Place of birth for the foreign-born population - Australia (%)
Place of birth for the foreign-born population - New Zealand (%)
Place of birth for the foreign-born population - Fiji (%)
Place of birth for the foreign-born population - Micronesia (%)
Place of birth for the foreign-born population - Bahamas (%)
Place of birth for the foreign-born population - Barbados (%)
Place of birth for the foreign-born population - Cuba (%)
Place of birth for the foreign-born population - Dominica (%)
Place of birth for the foreign-born population - Dominican Republic (%)
Place of birth for the foreign-born population - Grenada (%)
Place of birth for the foreign-born population - Haiti (%)
Place of birth for the foreign-born population - Jamaica (%)
Place of birth for the foreign-born population - St. Vincent and the Grenadines (%)
Place of birth for the foreign-born population - Trinidad and Tobago (%)
Place of birth for the foreign-born population - West Indies (%)
Place of birth for the foreign-born population - Other Caribbean (%)
Place of birth for the foreign-born population - Belize (%)
Place of birth for the foreign-born population - Costa Rica (%)
Place of birth for the foreign-born population - El Salvador (%)
Place of birth for the foreign-born population - Guatemala (%)
Place of birth for the foreign-born population - Honduras (%)
Place of birth for the foreign-born population - Mexico (%)
Place of birth for the foreign-born population - Nicaragua (%)
Place of birth for the foreign-born population - Panama (%)
Place of birth for the foreign-born population - Other Central America (%)
Place of birth for the foreign-born population - Argentina (%)
Place of birth for the foreign-born population - Bolivia (%)
Place of birth for the foreign-born population - Brazil (%)
Place of birth for the foreign-born population - Chile (%)
Place of birth for the foreign-born population - Colombia (%)
Place of birth for the foreign-born population - Ecuador (%)
Place of birth for the foreign-born population - Guyana (%)
Place of birth for the foreign-born population - Peru (%)
Place of birth for the foreign-born population - Uruguay (%)
Place of birth for the foreign-born population - Venezuela (%)
Place of birth for the foreign-born population - Other South America (%)
Place of birth for the foreign-born population - Canada (%)
Place of birth for the foreign-born population - Other Northern America (%)
Place of birth for the foreign-born population - Other (%)
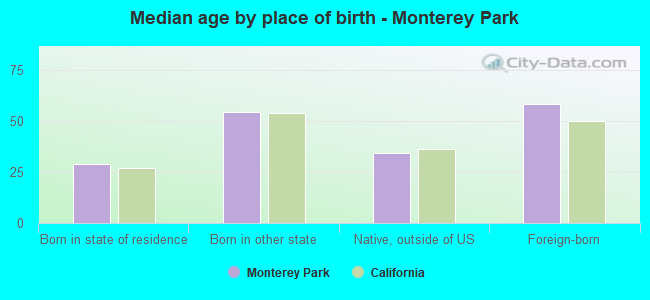
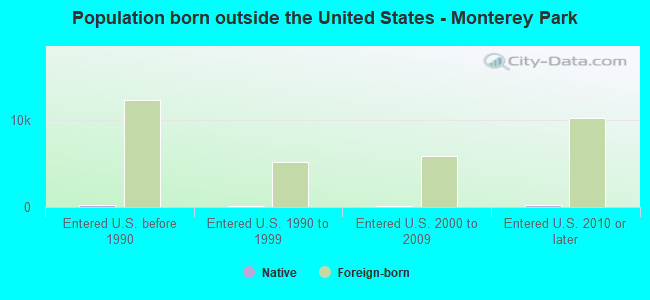
According to 2022 data, the most numerous races in Monterey Park, CA are Hispanic (17,557 residents), White alone (2,181 residents), and Asian alone (41,271 residents). 25.1% of Monterey Park residents speak English at home. 54.5% of Monterey Park, CA residents are foreign-born (45.6% born in Asia, 7.3% born in Latin America), which is 52.3% greater than the foreign-born rate of 26.0% across the entire state of California.
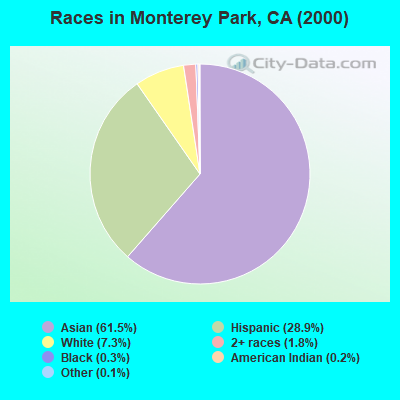
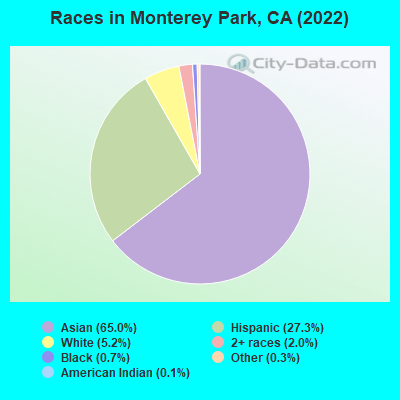
Race distribution in Monterey Park
2000 2022
15,816,790 46.7% White alone 10,966,556 32.4% Hispanic 3,648,860 10.8% Asian alone 2,181,926 6.4% Black alone 903,115 2.7% Two or more races 178,984 0.5% American Indian alone 103,736 0.3% Native Hawaiian and Other 71,681 0.2% Other race alone
15,732,184 40.3% Hispanic 13,160,426 33.7% White alone 5,957,867 15.3% Asian alone 2,025,218 5.2% Black alone 1,663,222 4.3% Two or more races 251,618 0.6% Other race alone 135,777 0.3% Native Hawaiian and Other 103,030 0.3% American Indian alone
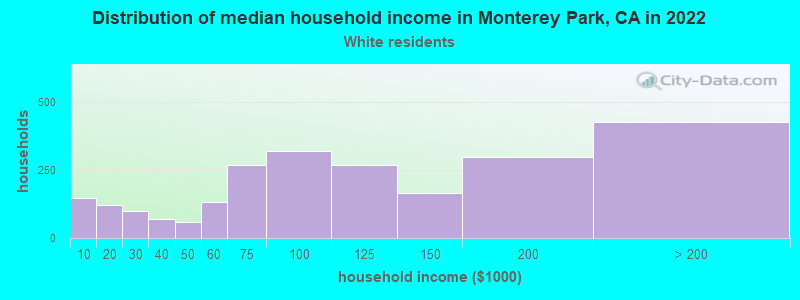
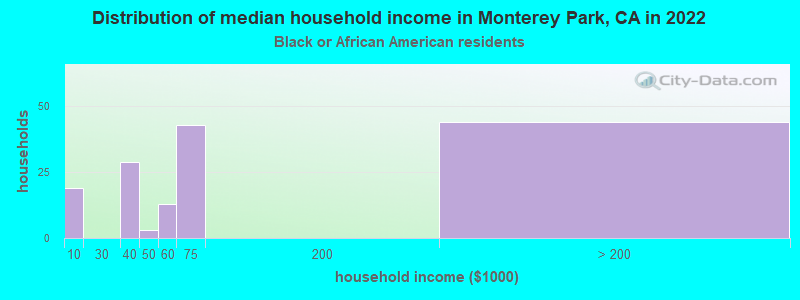
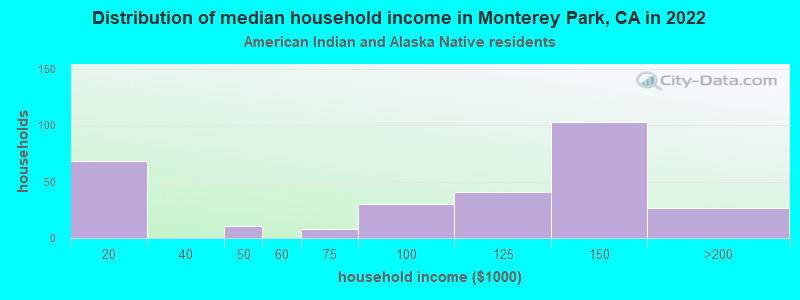
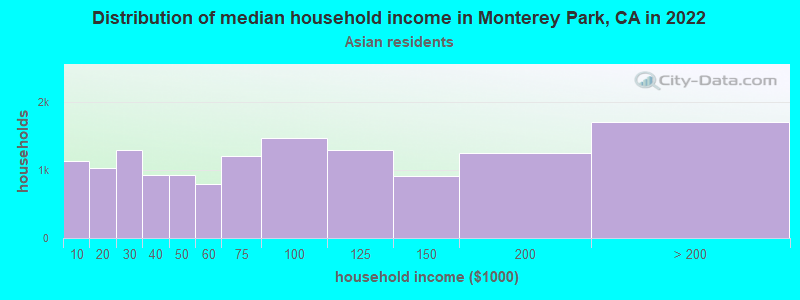
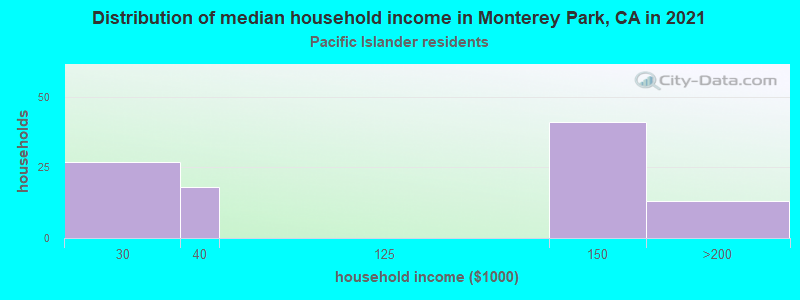
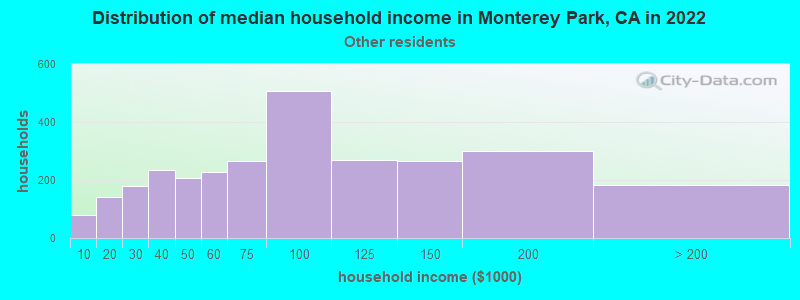
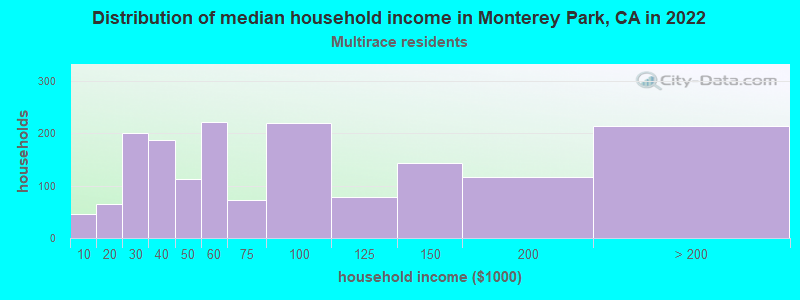
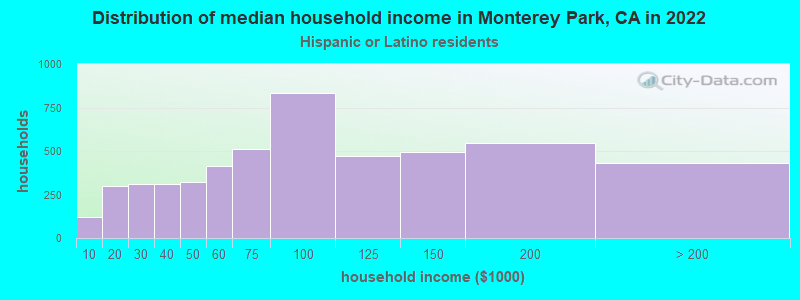
Income and house value in Monterey Park Median household income in 2022 $104,016 White non-Hispanic householders$64,227 Black householders$167,912 American Indian and Alaska Native householders$82,298 Asian householders$109,396 Native Hawaiian and other Pacific Islander householders$83,064 Some other race householders$57,933 Two or more races householders$80,185 Hispanic or Latino race householdersMedian 2022 house value $774,568 White Non-Hispanic householders$776,008 American Indian or Alaska Native householders $786,446 Asian householders$989,806 Native Hawaiian and other Pacific Islander householders$758,731 Some other race householders$770,249 Two or more races householders$762,690 Hispanic or Latino householders
Median age by race in Monterey Park
49.0 Median age for White residents47.5 51.7 33.2 Median age for Black or African American residents26.1 38.7 56.4 Median age for American Indian / Alaska Native residents70.8 56.4 50.3 Median age for Asian residents48.5 51.6 51.0 Median age for Native Hawaiian / Pacific Islander residents56.9 43.7 34.1 Median age for Other race residents32.9 37.0 32.0 Median age for Two or more races residents34.6 30.2 59.1 Median age for White alone residents57.0 61.8 37.2 Median age for Hispanic or Latino residents34.4 39.1
Owner/renter occupied households by race in Monterey Park
House owners and renters - White residents 1,681 62.5% Owner occupied1,010 37.5% Renter occupiedHouse owners and renters - Black or African American residents 5 3.3% Owner occupied147 96.7% Renter occupiedHouse owners and renters - American Indian / Alaska Native residents 128 40.7% Owner occupied187 59.3% Renter occupiedHouse owners and renters - Asian residents 8,657 57.9% Owner occupied6,288 42.1% Renter occupiedHouse owners and renters - Native Hawaiian / Pacific Islander residents 61 49.7% Owner occupied62 50.3% Renter occupiedHouse owners and renters - Other race residents 712 24.2% Owner occupied2,236 75.8% Renter occupiedHouse owners and renters - Two or more races residents 538 62.2% Owner occupied326 37.8% Renter occupiedHouse owners and renters - White alone residents 740 72.4% Owner occupied281 27.6% Renter occupiedHouse owners and renters - Hispanic or Latino residents 1,966 38.2% Owner occupied3,173 61.8% Renter occupied
Language usage in Monterey Park
English speakers - Total 25.1% of residents of Monterey Park speak English at home.
19.1% of residents speak Spanish at home 8,830 79.4% Speak English very well2,285 20.6% Speak English less than very well55.9% of residents speak other language at home 12,009 36.8% Speak English very well20,594 63.2% Speak English less than very well
English speakers - Born in the United States 61.9% of residents of Monterey Park speak English at home.
18.2% of residents speak Spanish at home 470 90.2% Speak English very well51 9.8% Speak English less than very well21.4% of residents speak other language at home 459 75.1% Speak English very well152 24.9% Speak English less than very well
English speakers - Native, born elsewhere 43.9% of residents of Monterey Park speak English at home.
5.7% of residents speak Spanish at home 29 87.9% Speak English very well4 12.1% Speak English less than very well48.6% of residents speak other language at home 152 54.1% Speak English very well129 45.9% Speak English less than very well
English speakers - Foreign-born 6.1% of residents of Monterey Park speak English at home.
12.5% of residents speak Spanish at home 2,335 58.2% Speak English very well1,680 41.8% Speak English less than very well82.0% of residents speak other language at home 6,989 26.6% Speak English very well19,277 73.4% Speak English less than very well
White (Caucasian) - Speak only English Native:
65.0% (3,605)Foreign-born:
20.1% (233)
White (Caucasian) - Speak another language Native:
29.5% (1,635)Foreign-born:
80.3% (931)
Black or African American - Speak another language Native:
78.6% (262)Foreign-born:
100.0% (60)
American Indian / Alaska Native - Speak another language Native:
20.4% (89)Foreign-born:
99.6% (13)
Asian - Speak only English Native:
47.6% (5,714)Foreign-born:
5.7% (1,590)
Asian - Speak another language Native:
51.7% (6,204)Foreign-born:
93.7% (26,113)
Native Hawaiian / Pacific Islander - Speak only English Native:
89.3% (141)Foreign-born:
16.4% (17)
Native Hawaiian / Pacific Islander - Speak another language Native:
16.2% (26)Foreign-born:
83.8% (87)
Other race - Speak only English Native:
40.8% (3,263)Foreign-born:
2.2% (64)
Other race - Speak another language Native:
60.7% (4,851)Foreign-born:
96.9% (2,818)
Two or more races - Speak only English Native:
64.7% (1,425)Foreign-born:
13.9% (84)
Two or more races - Speak another language Native:
34.0% (749)Foreign-born:
81.8% (491)
White alone - Speak only English Native:
85.7% (1,598)Foreign-born:
31.4% (91)
White alone - Speak another language Native:
14.7% (275)Foreign-born:
68.2% (198)
Hispanic or Latino - Speak only English Native:
46.1% (6,008)Foreign-born:
7.4% (304)
Hispanic or Latino - Speak another language Native:
54.4% (7,085)Foreign-born:
93.0% (3,827)
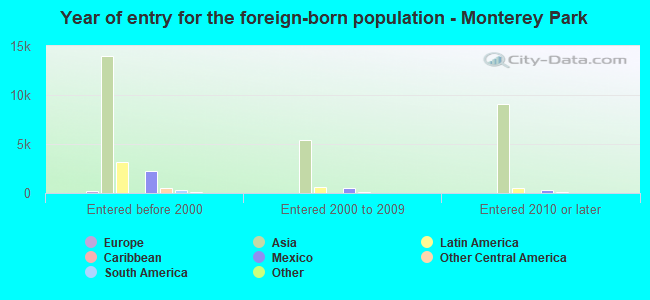
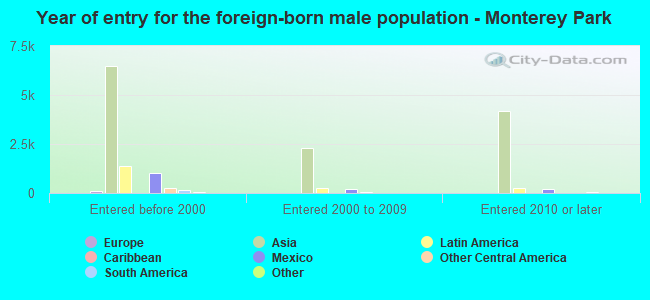
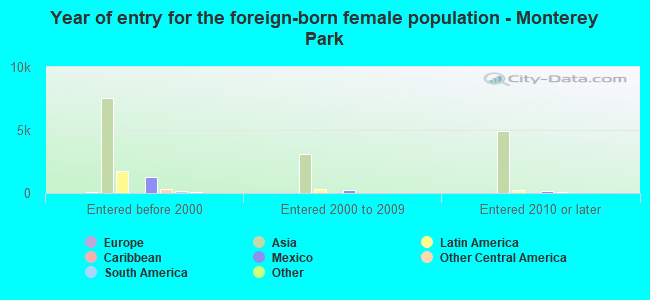
Foreign-born residents in Monterey Park 32,841 residents are foreign born (45.6% Asia , 7.3% Latin America ).
This city:
54.5%California:
100.0%
Marital status for residents in Monterey Park Marital status - White (Caucasian) population 15 years and over
Males 33.9% Never married51.1% Now married2.5% Separated4.7% Widowed7.8% DivorcedFemales 32.3% Never married39.1% Now married1.6% Separated13.6% Widowed13.4% DivorcedWomen who gave birth in the past 12 months Now married:
62.5% (39)Unmarried:
37.5% (23)
Women who did not give birth in the past 12 months Now married:
39.9% (507)Unmarried:
60.1% (765)
Marital status - Black or African American population 15 years and over
Males 68.9% Never married31.1% Now married0.0% Separated0.0% Widowed0.0% DivorcedFemales 51.1% Never married20.5% Now married6.1% Separated19.4% Widowed2.9% DivorcedWomen who did not give birth in the past 12 months Now married:
27.1% (48)Unmarried:
72.9% (129)
Marital status - American Indian / Alaska Native population 15 years and over
Males 37.3% Never married53.7% Now married0.0% Separated9.0% Widowed0.0% DivorcedFemales 32.7% Never married16.3% Now married0.0% Separated0.0% Widowed51.0% DivorcedWomen who gave birth in the past 12 months Now married:
100.0% (36)Unmarried:
0.0% (0)
Women who did not give birth in the past 12 months Now married:
0.0% (0)Unmarried:
100.0% (125)
Marital status - Asian population 15 years and over
Males 32.9% Never married58.6% Now married1.3% Separated3.2% Widowed4.0% DivorcedFemales 24.7% Never married54.4% Now married1.2% Separated11.6% Widowed8.1% DivorcedWomen who gave birth in the past 12 months Now married:
93.5% (256)Unmarried:
6.5% (18)
Women who did not give birth in the past 12 months Now married:
49.7% (4,200)Unmarried:
50.3% (4,248)
Marital status - Native Hawaiian / Pacific Islander population 15 years and over
Males 44.3% Never married36.4% Now married0.0% Separated13.6% Widowed5.7% DivorcedFemales 67.4% Never married32.6% Now married0.0% Separated0.0% Widowed0.0% DivorcedWomen who did not give birth in the past 12 months Now married:
36.2% (20)Unmarried:
63.8% (36)
Marital status - Other race population 15 years and over
Males 55.4% Never married35.9% Now married0.9% Separated1.2% Widowed6.6% DivorcedFemales 44.5% Never married34.3% Now married2.2% Separated8.5% Widowed10.5% DivorcedWomen who gave birth in the past 12 months Now married:
76.1% (55)Unmarried:
23.9% (17)
Women who did not give birth in the past 12 months Now married:
32.4% (901)Unmarried:
67.6% (1,880)
Marital status - Two or more races population 15 years and over
Males 52.1% Never married37.4% Now married0.0% Separated2.2% Widowed8.3% DivorcedFemales 59.6% Never married30.8% Now married0.0% Separated3.5% Widowed6.0% DivorcedWomen who did not give birth in the past 12 months Now married:
25.4% (200)Unmarried:
74.6% (588)
Marital status - White alone, not Hispanic / Latino population 15 years and over
Males 31.0% Never married53.4% Now married0.0% Separated8.3% Widowed7.3% DivorcedFemales 32.6% Never married32.8% Now married2.1% Separated17.1% Widowed15.5% DivorcedWomen who gave birth in the past 12 months Now married:
79.2% (17)Unmarried:
20.8% (5)
Women who did not give birth in the past 12 months Now married:
33.2% (106)Unmarried:
66.8% (213)
Marital status - Hispanic or Latino population 15 years and over
Males 48.9% Never married40.4% Now married1.8% Separated2.0% Widowed6.9% DivorcedFemales 40.0% Never married37.1% Now married1.7% Separated10.1% Widowed11.1% DivorcedWomen who gave birth in the past 12 months Now married:
64.2% (88)Unmarried:
35.8% (49)
Women who did not give birth in the past 12 months Now married:
35.5% (1,467)Unmarried:
64.5% (2,670)
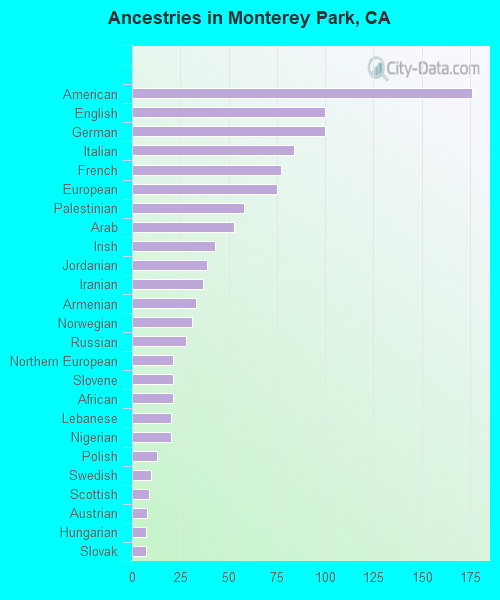
Ancestries in Monterey Park
240 0.6% American129 0.3% Italian86 0.2% German79 0.2% Lebanese63 0.2% Dutch60 0.1% Jordanian42 0.1% Hungarian39 0.09% European38 0.09% Irish37 0.09% English31 0.07% Polish31 0.07% Armenian26 0.06% Portuguese25 0.06% Northern European24 0.06% Norwegian21 0.05% Czech20 0.05% Russian16 0.04% Ukrainian15 0.04% Nigerian10 0.02% Eastern European10 0.02% Guyanese10 0.02% Palestinian10 0.02% Egyptian9 0.02% Syrian9 0.02% Moroccan7 0.02% Belgian7 0.02% African6 0.01% Danish6 0.01% Austrian5 0.01% French3 0.01% British3 0.01% Swedish
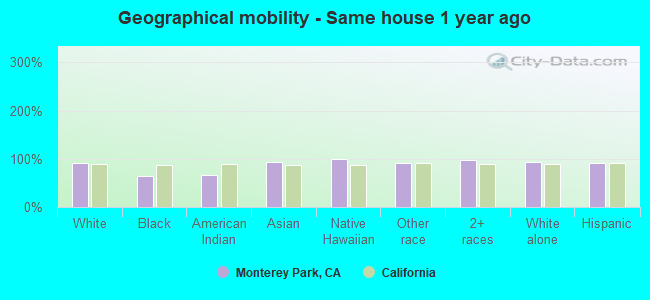
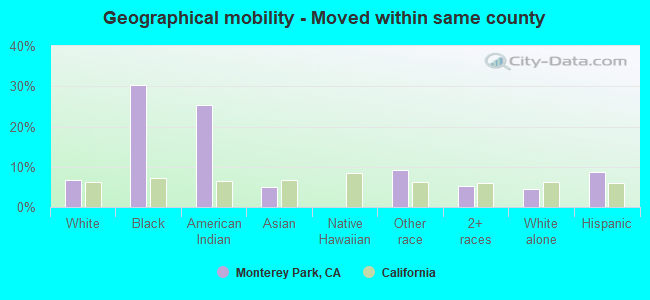
Geographical mobility in Monterey Park Same house 1 year ago 6,371 91.9% White (Caucasian)259 64.9% Black or African American323 67.2% American Indian / Alaska Native38,685 93.8% Asian289 100.0% Native Hawaiian / Pacific Islander10,120 90.6% Other race2,749 98.1% Two or more races2,069 93.1% White alone, not Hispanic / Latino15,853 90.5% Hispanic or LatinoMoved within same county 464 6.7% White / Caucasian121 30.3% Black or African American122 25.4% American Indian / Alaska Native2,060 5.0% Asian1,013 9.1% Other race145 5.2% Two or more races102 4.6% White alone, not Hispanic / Latino1,523 8.7% Hispanic or LatinoMoved within same state 52 0.8% White / Caucasian157 0.4% Asian1 0.0% Other race43 1.9% White alone, not Hispanic / Latino25 0.1% Hispanic or LatinoMoved from different state 21 0.3% White / Caucasian1 0.3% Black or African American201 0.5% Asian5 0.0% Other race2 0.1% White alone, not Hispanic / Latino28 0.2% Hispanic or LatinoMoved from abroad 23 0.3% White389 0.9% Asian16 0.7% White alone, not Hispanic / Latino14 0.1% Hispanic or Latino
Children Nativity (place of birth) in Monterey Park
Children under 6 years - Living with two parents Both parents native 634 99.9% Native0 0.1% Foreign-bornBoth parents foreign-born 796 95.6% Native36 4.4% Foreign-bornOne native, one foreign-born parent 440 100.0% NativeChildren under 6 years - Living with one parent Native parent 345 99.7% Native1 0.3% Foreign-bornForeign-born parent 237 84.2% Native45 15.8% Foreign-bornChildren 6 to 17 years - Living with two parents Both parents native 1,048 99.4% Native7 0.6% Foreign-bornBoth parents foreign-born 1,951 74.7% Native661 25.3% Foreign-bornOne native, one foreign-born parent 1,125 98.5% Native17 1.5% Foreign-bornChildren 6 to 17 years - Living with one parent Native parent 674 100.0% NativeForeign-born parent 1,244 53.8% Native1,070 46.2% Foreign-born
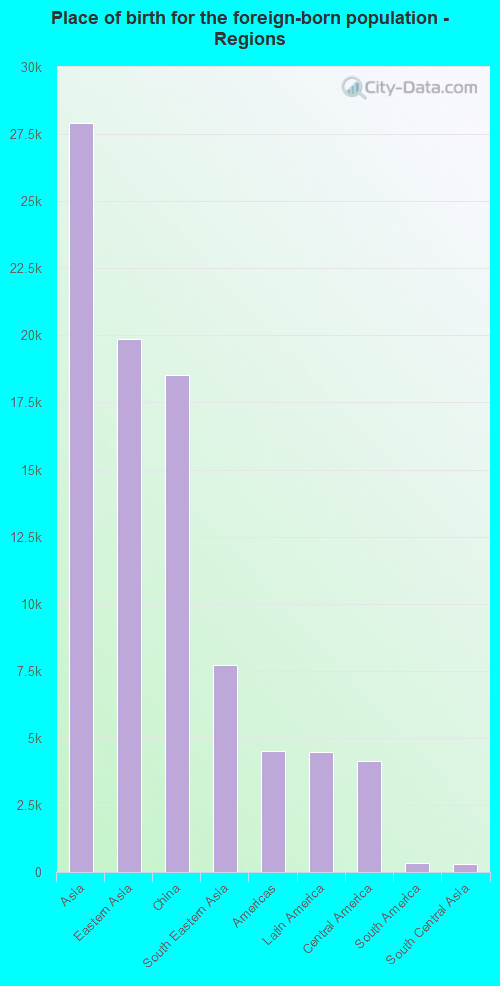
Place of birth for residents in Monterey Park 27,931 Asia19,850 Eastern Asia18,505 China7,701 South Eastern Asia4,508 Americas4,478 Latin America4,128 Central America327 South America304 South Central Asia253 Europe112 Western Europe93 Oceania74 Western Asia63 Southern Europe57 Eastern Europe54 Africa29 Northern America25 Northern Africa23 Caribbean19 Northern Europe18 Southern Africa15 Australia and New Zealand Subregion10 Western Africa1 Middle Africa14,537 China4,528 Vietnam3,406 Mexico2,325 Hong Kong1,641 Taiwan1,002 Philippines775 Japan581 Indonesia569 Korea533 Cambodia525 Burma385 El Salvador228 Thailand202 Guatemala154 Peru152 Laos120 Malaysia102 India98 Ecuador73 Sri Lanka68 Germany67 Nepal54 Nicaragua54 Italy43 Honduras37 Bangladesh29 Canada27 Hungary27 Singapore26 Jordan23 Cuba20 Pakistan20 Chile20 Netherlands19 France18 South Africa18 Panama17 Costa Rica16 Lebanon16 Egypt16 Ukraine15 Australia14 Argentina13 Guyana11 Poland10 Kuwait10 Nigeria9 Morocco9 Spain9 England8 Saudi Arabia7 Israel7 Turkey5 Bolivia5 Norway4 Belgium4 United Kingdom3 Czechoslovakia3 Iran1 Cameroon1 Scotland
Grandparents responsible for own grandchildren in Monterey Park
Grandparents (30 to 59 years) White / Caucasian 20 31.3% Responsible for grandchildren44 68.7% Not responsible for grandchildrenAsian 6 4.5% Responsible for grandchildren133 95.5% Not responsible for grandchildrenOther race 20 16.6% Responsible for grandchildren103 83.4% Not responsible for grandchildrenTwo or more races 17 100.0% Not responsible for grandchildrenHispanic or Latino 49 22.4% Responsible for grandchildren168 77.6% Not responsible for grandchildrenGrandparents (60 years and over) White / Caucasian 101 100.0% Not responsible for grandchildrenAsian 98 9.6% Responsible for grandchildren917 90.4% Not responsible for grandchildrenOther race 415 100.0% Not responsible for grandchildrenHispanic or Latino 464 100.0% Not responsible for grandchildren