Races in Woonsocket, Rhode Island (RI) Detailed Stats
Data:
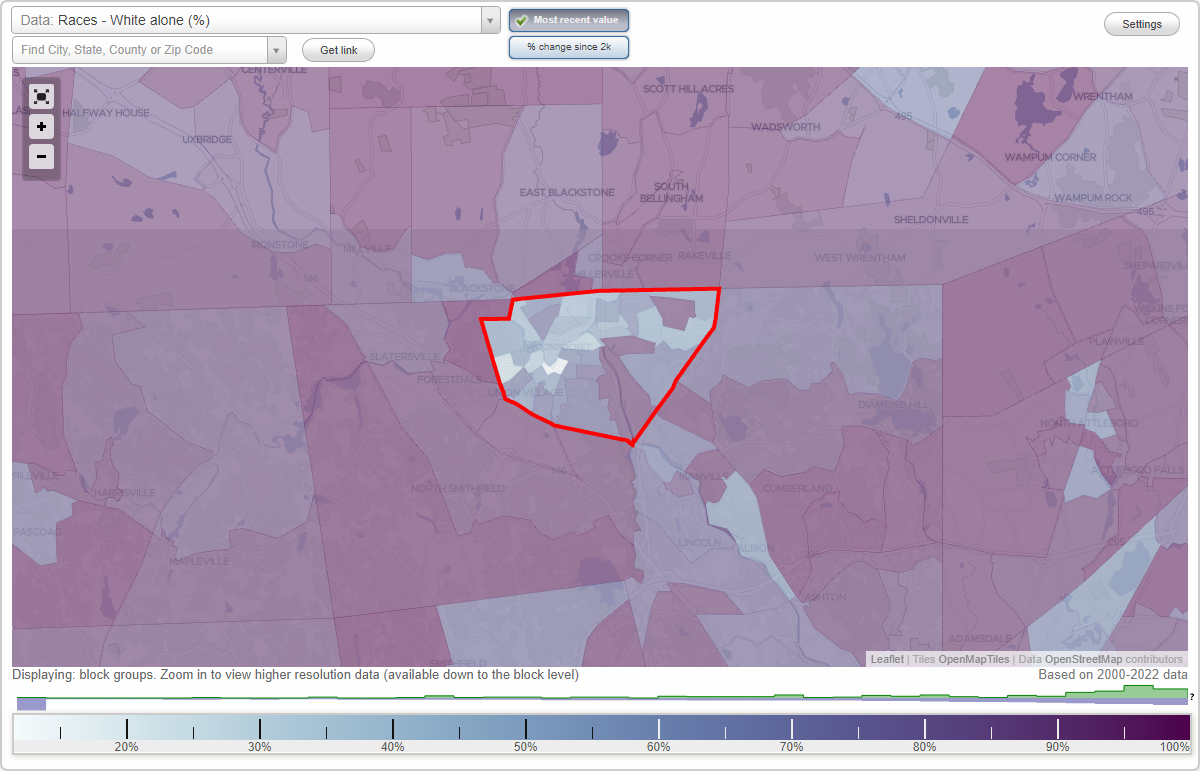
Races - White alone (%)
Races - White alone (% change since 2000)
Races - Black alone (%)
Races - Black alone (% change since 2000)
Races - American Indian alone (%)
Races - American Indian alone (% change since 2000)
Races - Asian alone (%)
Races - Asian alone (% change since 2000)
Races - Hispanic (%)
Races - Hispanic (% change since 2000)
Races - Native Hawaiian and Other Pacific Islander alone (%)
Races - Native Hawaiian and Other Pacific Islander alone (% change since 2000)
Races - Two or more races(%)
Races - Two or more races(% change since 2000)
Races - Other race alone (%)
Races - Other race alone (% change since 2000)
Racial diversity
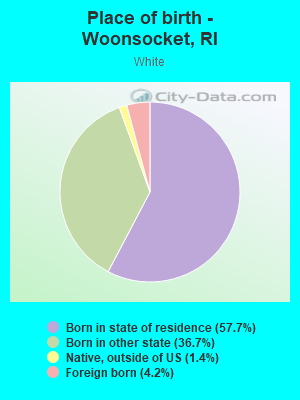
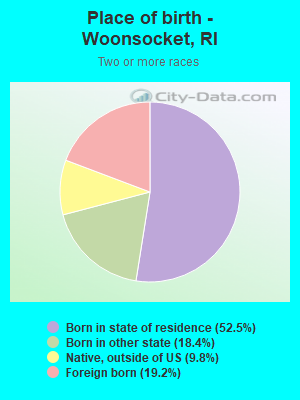
Place of birth - Born in state of residence (%)
Place of birth - Born in state of residence (%) - White
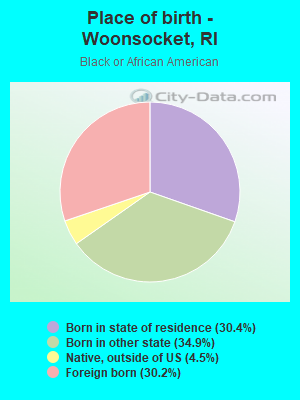
Place of birth - Born in state of residence (%) - Black or African American
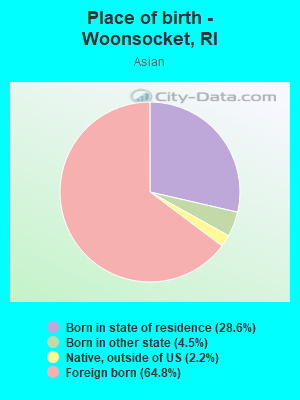
Place of birth - Born in state of residence (%) - Asian
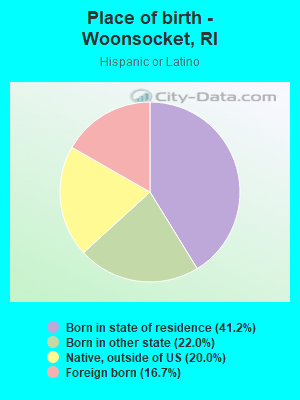
Place of birth - Born in state of residence (%) - Hispanic or Latino
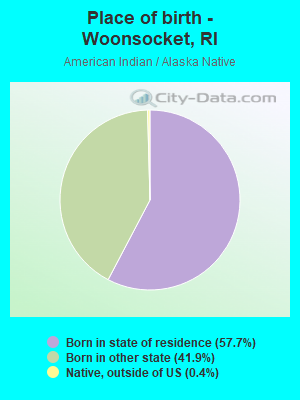
Place of birth - Born in state of residence (%) - American Indian and Alaska Native
Place of birth - Born in state of residence (%) - Multirace
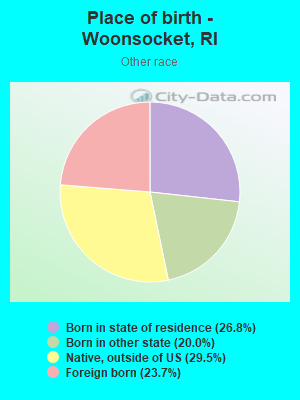
Place of birth - Born in state of residence (%) - Other Race
Place of birth - Born in other state (%)
Place of birth - Born in other state (%) - White
Place of birth - Born in other state (%) - Black or African American
Place of birth - Born in other state (%) - Asian
Place of birth - Born in other state (%) - Hispanic or Latino
Place of birth - Born in other state (%) - American Indian and Alaska Native
Place of birth - Born in other state (%) - Multirace
Place of birth - Born in other state (%) - Other Race
Place of birth - Native, outside of US (%)
Place of birth - Native, outside of US (%) - White
Place of birth - Native, outside of US (%) - Black or African American
Place of birth - Native, outside of US (%) - Asian
Place of birth - Native, outside of US (%) - Hispanic or Latino
Place of birth - Native, outside of US (%) - American Indian and Alaska Native
Place of birth - Native, outside of US (%) - Multirace
Place of birth - Native, outside of US (%) - Other Race
Place of birth - Foreign born (%)
Place of birth - Foreign born (%) - White
Place of birth - Foreign born (%) - Black or African American
Place of birth - Foreign born (%) - Asian
Place of birth - Foreign born (%) - Hispanic or Latino
Place of birth - Foreign born (%) - American Indian and Alaska Native
Place of birth - Foreign born (%) - Multirace
Place of birth - Foreign born (%) - Other Race
Residents speaking English at home (%)
Residents speaking English at home - Born in the United States (%)
Residents speaking English at home - Native, born elsewhere (%)
Residents speaking English at home - Foreign born (%)
Residents speaking Spanish at home (%)
Residents speaking Spanish at home - Born in the United States (%)
Residents speaking Spanish at home - Native, born elsewhere (%)
Residents speaking Spanish at home - Foreign born (%)
Residents speaking other language at home (%)
Residents speaking other language at home - Born in the United States (%)
Residents speaking other language at home - Native, born elsewhere (%)
Residents speaking other language at home - Foreign born (%)
Marital status - Never married (%)
Marital status - Now married (%)
Marital status - Separated (%)
Marital status - Widowed (%)
Marital status - Divorced (%)
Ancestries Reported - Arab (%)
Ancestries Reported - Czech (%)
Ancestries Reported - Danish (%)
Ancestries Reported - Dutch (%)
Ancestries Reported - English (%)
Ancestries Reported - French (%)
Ancestries Reported - French Canadian (%)
Ancestries Reported - German (%)
Ancestries Reported - Greek (%)
Ancestries Reported - Hungarian (%)
Ancestries Reported - Irish (%)
Ancestries Reported - Italian (%)
Ancestries Reported - Lithuanian (%)
Ancestries Reported - Norwegian (%)
Ancestries Reported - Polish (%)
Ancestries Reported - Portuguese (%)
Ancestries Reported - Russian (%)
Ancestries Reported - Scotch-Irish (%)
Ancestries Reported - Scottish (%)
Ancestries Reported - Slovak (%)
Ancestries Reported - Subsaharan African (%)
Ancestries Reported - Swedish (%)
Ancestries Reported - Swiss (%)
Ancestries Reported - Ukrainian (%)
Ancestries Reported - United States (%)
Ancestries Reported - Welsh (%)
Ancestries Reported - West Indian (%)
Ancestries Reported - Other (%)
Geographical mobility - Same house 1 year ago (%)
Geographical mobility - Same house 1 year ago (%) - White
Geographical mobility - Same house 1 year ago (%) - Black or African American
Geographical mobility - Same house 1 year ago (%) - Asian
Geographical mobility - Same house 1 year ago (%) - Hispanic or Latino
Geographical mobility - Same house 1 year ago (%) - American Indian and Alaska Native
Geographical mobility - Same house 1 year ago (%) - Multirace
Geographical mobility - Same house 1 year ago (%) - Other Race
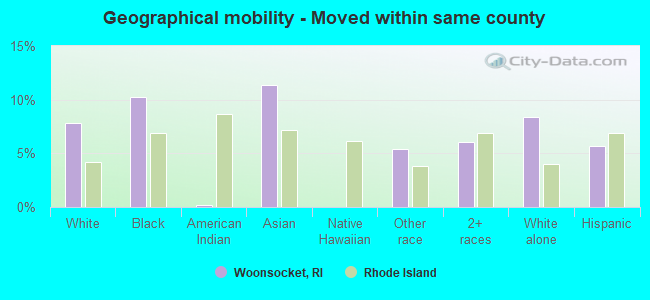
Geographical mobility - Moved within same county (%)
Geographical mobility - Moved within same county (%) - White
Geographical mobility - Moved within same county (%) - Black or African American
Geographical mobility - Moved within same county (%) - Asian
Geographical mobility - Moved within same county (%) - Hispanic or Latino
Geographical mobility - Moved within same county (%) - American Indian and Alaska Native
Geographical mobility - Moved within same county (%) - Multirace
Geographical mobility - Moved within same county (%) - Other Race
Geographical mobility - Moved from different county within same state (%)
Geographical mobility - Moved from different county within same state (%) - White
Geographical mobility - Moved from different county within same state (%) - Black or African American
Geographical mobility - Moved from different county within same state (%) - Asian
Geographical mobility - Moved from different county within same state (%) - Hispanic or Latino
Geographical mobility - Moved from different county within same state (%) - American Indian and Alaska Native
Geographical mobility - Moved from different county within same state (%) - Multirace
Geographical mobility - Moved from different county within same state (%) - Other Race
Geographical mobility - Moved from different state (%)
Geographical mobility - Moved from different state (%) - White
Geographical mobility - Moved from different state (%) - Black or African American
Geographical mobility - Moved from different state (%) - Asian
Geographical mobility - Moved from different state (%) - Hispanic or Latino
Geographical mobility - Moved from different state (%) - American Indian and Alaska Native
Geographical mobility - Moved from different state (%) - Multirace
Geographical mobility - Moved from different state (%) - Other Race
Geographical mobility - Moved from abroad (%)
Geographical mobility - Moved from abroad (%) - White
Geographical mobility - Moved from abroad (%) - Black or African American
Geographical mobility - Moved from abroad (%) - Asian
Geographical mobility - Moved from abroad (%) - Hispanic or Latino
Geographical mobility - Moved from abroad (%) - American Indian and Alaska Native
Geographical mobility - Moved from abroad (%) - Multirace
Geographical mobility - Moved from abroad (%) - Other Race
Place of birth for the foreign-born population - Ireland (%)
Place of birth for the foreign-born population - Denmark (%)
Place of birth for the foreign-born population - Norway (%)
Place of birth for the foreign-born population - Sweden (%)
Place of birth for the foreign-born population - United Kingdom (%)
Place of birth for the foreign-born population - England (%)
Place of birth for the foreign-born population - Scotland (%)
Place of birth for the foreign-born population - Other Northern Europe (%)
Place of birth for the foreign-born population - Austria (%)
Place of birth for the foreign-born population - Belgium (%)
Place of birth for the foreign-born population - France (%)
Place of birth for the foreign-born population - Germany (%)
Place of birth for the foreign-born population - Netherlands (%)
Place of birth for the foreign-born population - Switzerland (%)
Place of birth for the foreign-born population - Other Western Europe (%)
Place of birth for the foreign-born population - Greece (%)
Place of birth for the foreign-born population - Italy (%)
Place of birth for the foreign-born population - Portugal (%)
Place of birth for the foreign-born population - Spain (%)
Place of birth for the foreign-born population - Other Southern Europe (%)
Place of birth for the foreign-born population - Albania (%)
Place of birth for the foreign-born population - Belarus (%)
Place of birth for the foreign-born population - Bosnia and Herzegovina (%)
Place of birth for the foreign-born population - Bulgaria (%)
Place of birth for the foreign-born population - Croatia (%)
Place of birth for the foreign-born population - Czechoslovakia (%)
Place of birth for the foreign-born population - Hungary (%)
Place of birth for the foreign-born population - Latvia (%)
Place of birth for the foreign-born population - Lithuania (%)
Place of birth for the foreign-born population - North Macedonia (Macedonia) (%)
Place of birth for the foreign-born population - Moldova (%)
Place of birth for the foreign-born population - Poland (%)
Place of birth for the foreign-born population - Romania (%)
Place of birth for the foreign-born population - Russia (%)
Place of birth for the foreign-born population - Serbia (%)
Place of birth for the foreign-born population - Ukraine (%)
Place of birth for the foreign-born population - Other Eastern Europe (%)
Place of birth for the foreign-born population - China (%)
Place of birth for the foreign-born population - Hong Kong (%)
Place of birth for the foreign-born population - Taiwan (%)
Place of birth for the foreign-born population - Japan (%)
Place of birth for the foreign-born population - Korea (%)
Place of birth for the foreign-born population - Other Eastern Asia (%)
Place of birth for the foreign-born population - Afghanistan (%)
Place of birth for the foreign-born population - Bangladesh (%)
Place of birth for the foreign-born population - India (%)
Place of birth for the foreign-born population - Iran (%)
Place of birth for the foreign-born population - Kazakhstan (%)
Place of birth for the foreign-born population - Nepal (%)
Place of birth for the foreign-born population - Pakistan (%)
Place of birth for the foreign-born population - Sri Lanka (%)
Place of birth for the foreign-born population - Uzbekistan (%)
Place of birth for the foreign-born population - Other South Central Asia (%)
Place of birth for the foreign-born population - Burma (%)
Place of birth for the foreign-born population - Cambodia (%)
Place of birth for the foreign-born population - Indonesia (%)
Place of birth for the foreign-born population - Laos (%)
Place of birth for the foreign-born population - Malaysia (%)
Place of birth for the foreign-born population - Philippines (%)
Place of birth for the foreign-born population - Singapore (%)
Place of birth for the foreign-born population - Thailand (%)
Place of birth for the foreign-born population - Vietnam (%)
Place of birth for the foreign-born population - Other South Eastern Asia (%)
Place of birth for the foreign-born population - Armenia (%)
Place of birth for the foreign-born population - Iraq (%)
Place of birth for the foreign-born population - Israel (%)
Place of birth for the foreign-born population - Jordan (%)
Place of birth for the foreign-born population - Kuwait (%)
Place of birth for the foreign-born population - Lebanon (%)
Place of birth for the foreign-born population - Saudi Arabia (%)
Place of birth for the foreign-born population - Syria (%)
Place of birth for the foreign-born population - Turkey (%)
Place of birth for the foreign-born population - Yemen (%)
Place of birth for the foreign-born population - Other Western Asia (%)
Place of birth for the foreign-born population - Eritrea (%)
Place of birth for the foreign-born population - Ethiopia (%)
Place of birth for the foreign-born population - Kenya (%)
Place of birth for the foreign-born population - Somalia (%)
Place of birth for the foreign-born population - Uganda (%)
Place of birth for the foreign-born population - Zimbabwe (%)
Place of birth for the foreign-born population - Other Eastern Africa (%)
Place of birth for the foreign-born population - Cameroon (%)
Place of birth for the foreign-born population - Congo (%)
Place of birth for the foreign-born population - Democratic Republic of Congo (Zaire) (%)
Place of birth for the foreign-born population - Other Middle Africa (%)
Place of birth for the foreign-born population - Egypt (%)
Place of birth for the foreign-born population - Morocco (%)
Place of birth for the foreign-born population - Sudan (%)
Place of birth for the foreign-born population - Other Northern Africa (%)
Place of birth for the foreign-born population - South Africa (%)
Place of birth for the foreign-born population - Other Southern Africa (%)
Place of birth for the foreign-born population - Cabo Verde (%)
Place of birth for the foreign-born population - Ghana (%)
Place of birth for the foreign-born population - Liberia (%)
Place of birth for the foreign-born population - Nigeria (%)
Place of birth for the foreign-born population - Senegal (%)
Place of birth for the foreign-born population - Sierra Leone (%)
Place of birth for the foreign-born population - Other Western Africa (%)
Place of birth for the foreign-born population - Australia (%)
Place of birth for the foreign-born population - New Zealand (%)
Place of birth for the foreign-born population - Fiji (%)
Place of birth for the foreign-born population - Micronesia (%)
Place of birth for the foreign-born population - Bahamas (%)
Place of birth for the foreign-born population - Barbados (%)
Place of birth for the foreign-born population - Cuba (%)
Place of birth for the foreign-born population - Dominica (%)
Place of birth for the foreign-born population - Dominican Republic (%)
Place of birth for the foreign-born population - Grenada (%)
Place of birth for the foreign-born population - Haiti (%)
Place of birth for the foreign-born population - Jamaica (%)
Place of birth for the foreign-born population - St. Vincent and the Grenadines (%)
Place of birth for the foreign-born population - Trinidad and Tobago (%)
Place of birth for the foreign-born population - West Indies (%)
Place of birth for the foreign-born population - Other Caribbean (%)
Place of birth for the foreign-born population - Belize (%)
Place of birth for the foreign-born population - Costa Rica (%)
Place of birth for the foreign-born population - El Salvador (%)
Place of birth for the foreign-born population - Guatemala (%)
Place of birth for the foreign-born population - Honduras (%)
Place of birth for the foreign-born population - Mexico (%)
Place of birth for the foreign-born population - Nicaragua (%)
Place of birth for the foreign-born population - Panama (%)
Place of birth for the foreign-born population - Other Central America (%)
Place of birth for the foreign-born population - Argentina (%)
Place of birth for the foreign-born population - Bolivia (%)
Place of birth for the foreign-born population - Brazil (%)
Place of birth for the foreign-born population - Chile (%)
Place of birth for the foreign-born population - Colombia (%)
Place of birth for the foreign-born population - Ecuador (%)
Place of birth for the foreign-born population - Guyana (%)
Place of birth for the foreign-born population - Peru (%)
Place of birth for the foreign-born population - Uruguay (%)
Place of birth for the foreign-born population - Venezuela (%)
Place of birth for the foreign-born population - Other South America (%)
Place of birth for the foreign-born population - Canada (%)
Place of birth for the foreign-born population - Other Northern America (%)
Place of birth for the foreign-born population - Other (%)
Latest news about races in Woonsocket, RI collected exclusively by city-data.com from local newspapers, TV, and radio stations
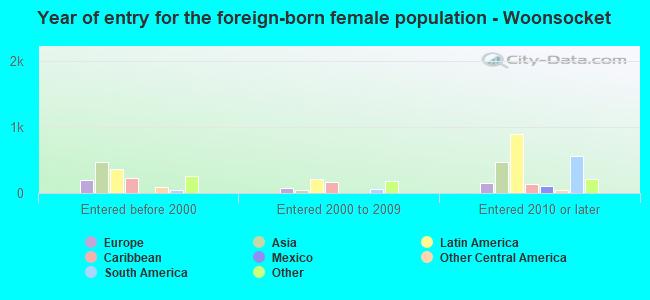
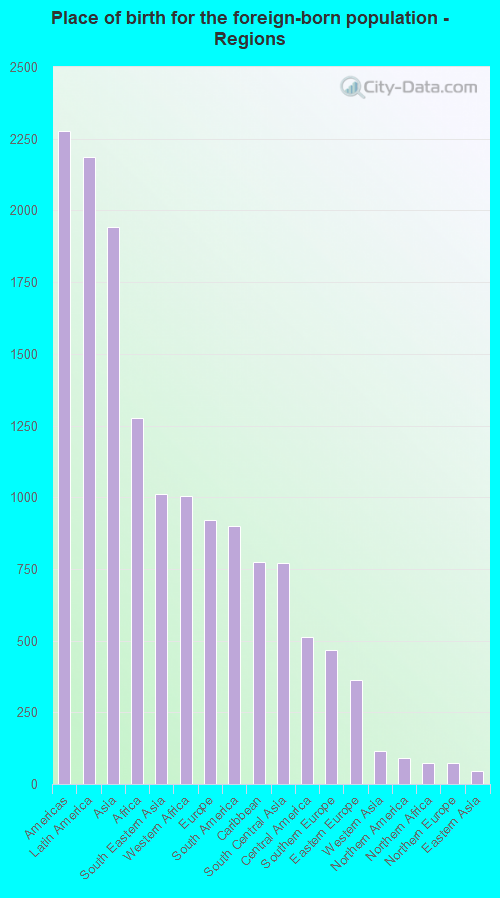
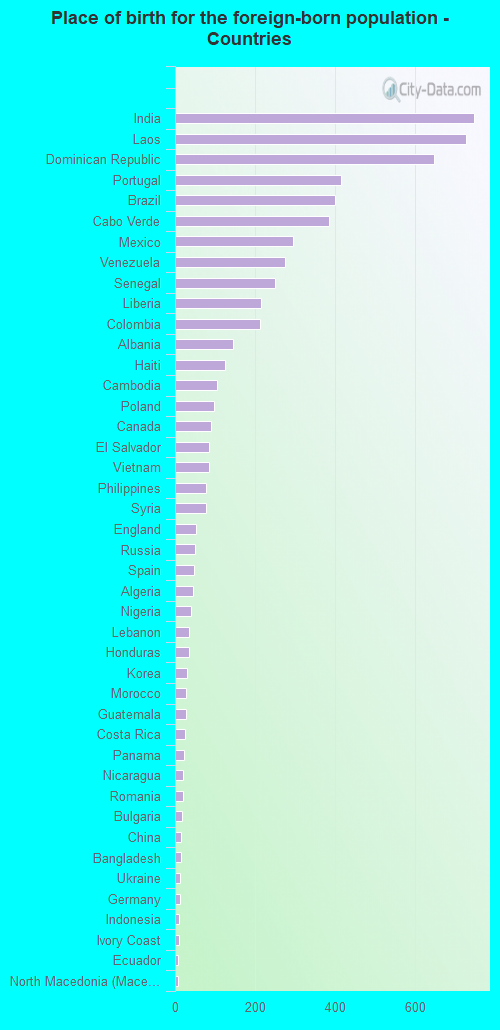
According to 2022 data, the most numerous races in Woonsocket, RI are White alone (23,647 residents), Hispanic (10,789 residents), and Two or more races (3,511 residents). 69.3% of Woonsocket residents speak English at home. 14.9% of Woonsocket, RI residents are foreign-born (5.0% born in Latin America, 4.4% born in Asia, 2.9% born in Africa, 2.1% born in Europe), which is 6.2% greater than the foreign-born rate of 14.0% across the entire state of Rhode Island.
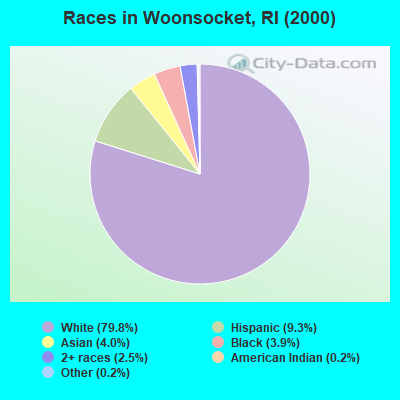
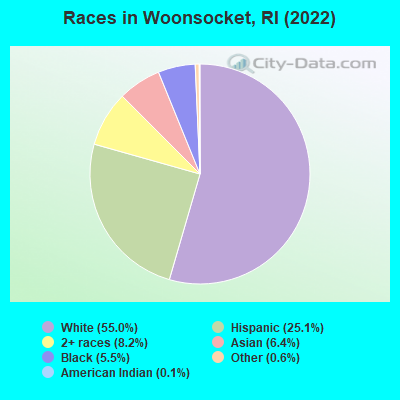
Race distribution in Woonsocket
2000 2022
34,503 79.8% White alone 4,030 9.3% Hispanic 1,733 4.0% Asian alone 1,692 3.9% Black alone 1,068 2.5% Two or more races 89 0.2% Other race alone 98 0.2% American Indian alone 11 0.03% Native Hawaiian and Other
23,647 55.0% White alone 10,789 25.1% Hispanic 3,511 8.2% Two or more races 2,747 6.4% Asian alone 2,373 5.5% Black alone 259 0.6% Other race alone 50 0.1% American Indian alone
2000 2022
858,433 81.9% White alone 90,820 8.7% Hispanic 41,922 4.0% Black alone 23,416 2.2% Asian alone 20,816 2.0% Two or more races 8,411 0.8% Other race alone 4,181 0.4% American Indian alone 320 0.03% Native Hawaiian and Other
745,825 68.2% White alone 191,979 17.6% Hispanic 56,738 5.2% Two or more races 51,326 4.7% Black alone 37,234 3.4% Asian alone 9,514 0.9% Other race alone 978 0.09% American Indian alone 140 0.01% Native Hawaiian and Other
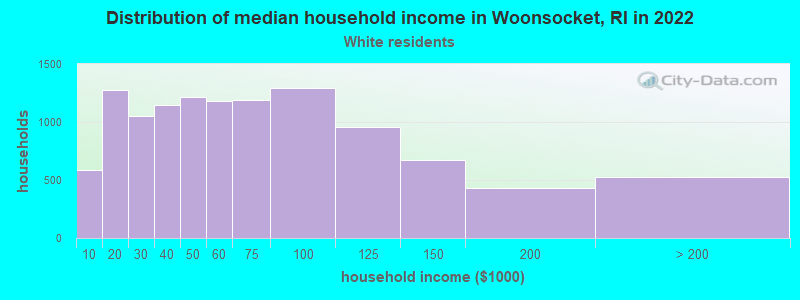
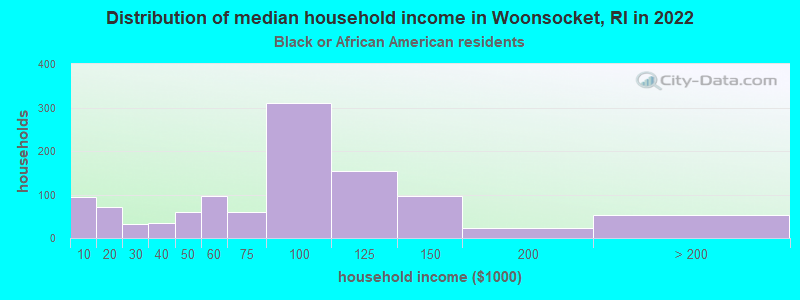
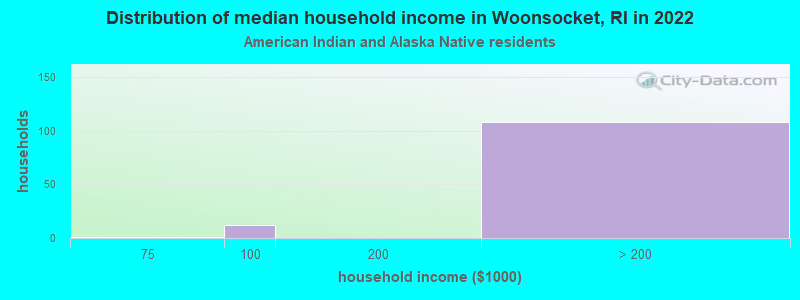
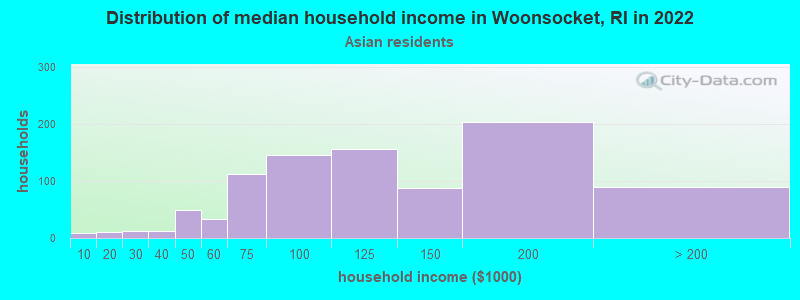
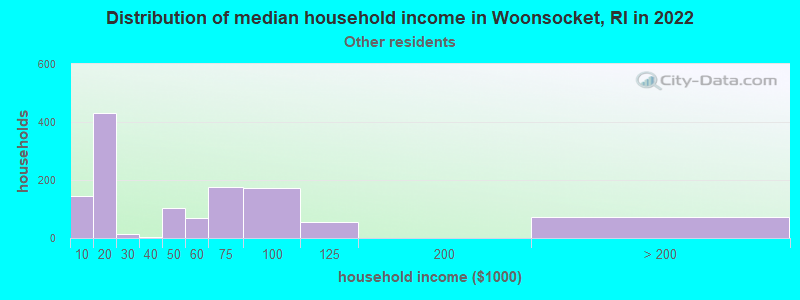
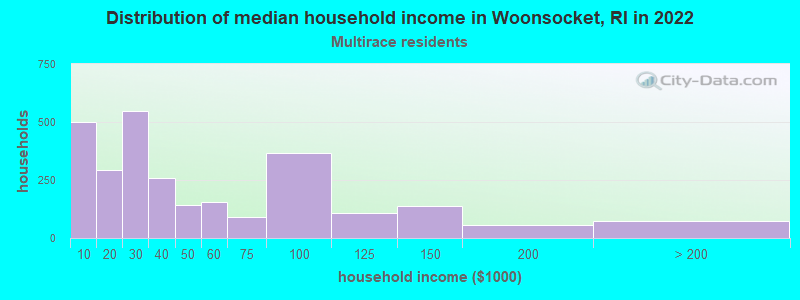
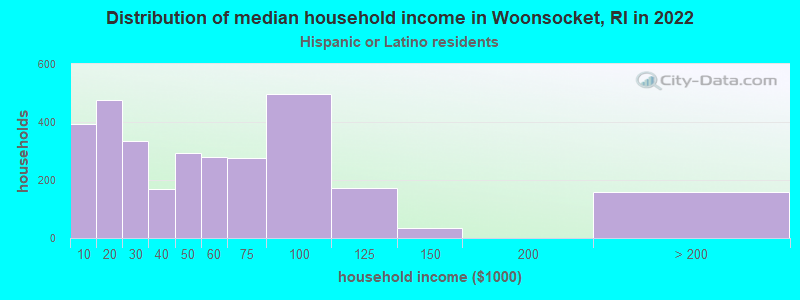
Income and house value in Woonsocket Median household income in 2022 $51,504 White non-Hispanic householders$85,479 Black householdersover $200,000 American Indian and Alaska Native householders$105,372 Asian householders$56,958 Some other race householders$34,158 Two or more races householders$48,797 Hispanic or Latino race householdersMedian 2022 house value $276,934 White Non-Hispanic householders$301,775 Black or African American householders $269,064 Asian householders$316,285 Some other race householders$283,821 Two or more races householders$281,361 Hispanic or Latino householders
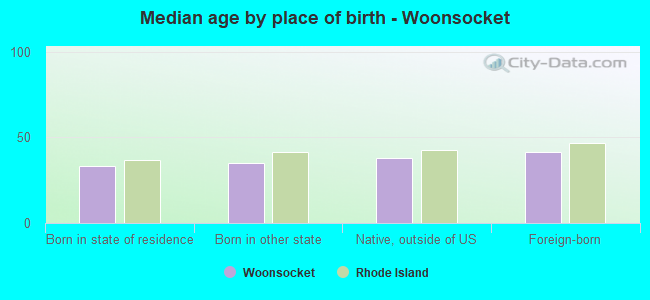
Median age by race in Woonsocket
45.0 Median age for White residents41.4 47.4 33.3 Median age for Black or African American residents33.1 36.1 16.4 Median age for American Indian / Alaska Native residents40.4 4.2 36.4 Median age for Asian residents35.9 35.8 -713,991,768.8 Median age for Native Hawaiian / Pacific Islander residents-668,724,279.2 -670,599,802.7 28.9 Median age for Other race residents25.9 37.1 25.1 Median age for Two or more races residents27.5 23.5 47.1 Median age for White alone residents44.2 48.7 25.4 Median age for Hispanic or Latino residents24.7 25.9
Owner/renter occupied households by race in Woonsocket
House owners and renters - White residents 5,189 44.5% Owner occupied6,470 55.5% Renter occupiedHouse owners and renters - Black or African American residents 349 34.1% Owner occupied676 65.9% Renter occupiedHouse owners and renters - American Indian / Alaska Native residents 158 95.3% Owner occupied8 4.7% Renter occupiedHouse owners and renters - Asian residents 383 38.9% Owner occupied601 61.1% Renter occupiedHouse owners and renters - Other race residents 262 21.8% Owner occupied938 78.2% Renter occupiedHouse owners and renters - Two or more races residents 313 10.9% Owner occupied2,565 89.1% Renter occupiedHouse owners and renters - White alone residents 5,248 44.4% Owner occupied6,560 55.6% Renter occupiedHouse owners and renters - Hispanic or Latino residents 490 15.5% Owner occupied2,664 84.5% Renter occupied
Language usage in Woonsocket
English speakers - Total 69.3% of residents of Woonsocket speak English at home.
15.6% of residents speak Spanish at home 3,550 57.7% Speak English very well2,607 42.3% Speak English less than very well14.9% of residents speak other language at home 3,889 66.2% Speak English very well1,987 33.8% Speak English less than very well
English speakers - Born in the United States 85.4% of residents of Woonsocket speak English at home.
12.0% of residents speak Spanish at home 1,166 80.0% Speak English very well291 20.0% Speak English less than very well2.7% of residents speak other language at home 313 94.0% Speak English very well20 6.0% Speak English less than very well
English speakers - Native, born elsewhere 11.8% of residents of Woonsocket speak English at home.
82.4% of residents speak Spanish at home 1,062 52.5% Speak English very well959 47.5% Speak English less than very well
English speakers - Foreign-born 11.3% of residents of Woonsocket speak English at home.
26.2% of residents speak Spanish at home 503 30.4% Speak English very well1,154 69.6% Speak English less than very well60.1% of residents speak other language at home 1,978 52.1% Speak English very well1,816 47.9% Speak English less than very well
White (Caucasian) - Speak only English Native:
93.3% (20,803)Foreign-born:
11.8% (116)
White (Caucasian) - Speak another language Native:
6.6% (1,475)Foreign-born:
88.9% (875)
Black or African American - Speak only English Native:
82.8% (1,554)Foreign-born:
37.9% (349)
Black or African American - Speak another language Native:
17.2% (323)Foreign-born:
60.3% (556)
Asian - Speak only English Native:
61.7% (550)Foreign-born:
4.0% (71)
Asian - Speak another language Native:
39.6% (353)Foreign-born:
98.8% (1,775)
Other race - Speak only English Native:
36.0% (881)Foreign-born:
13.3% (116)
Other race - Speak another language Native:
64.3% (1,574)Foreign-born:
88.7% (773)
Two or more races - Speak only English Native:
52.2% (3,149)Foreign-born:
6.3% (113)
Two or more races - Speak another language Native:
48.3% (2,912)Foreign-born:
93.0% (1,655)
White alone - Speak only English Native:
93.4% (20,160)Foreign-born:
13.7% (128)
White alone - Speak another language Native:
6.4% (1,391)Foreign-born:
88.0% (824)
Hispanic or Latino - Speak only English Native:
40.0% (2,891)Foreign-born:
7.2% (130)
Hispanic or Latino - Speak another language Native:
60.8% (4,392)Foreign-born:
92.9% (1,678)
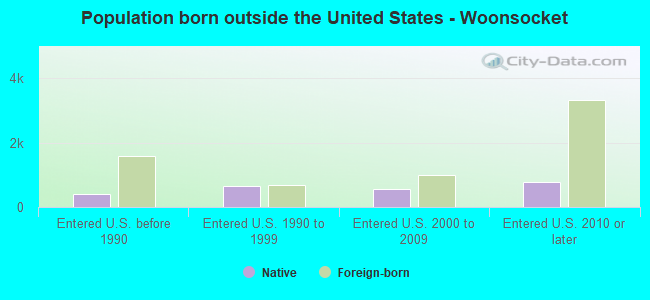
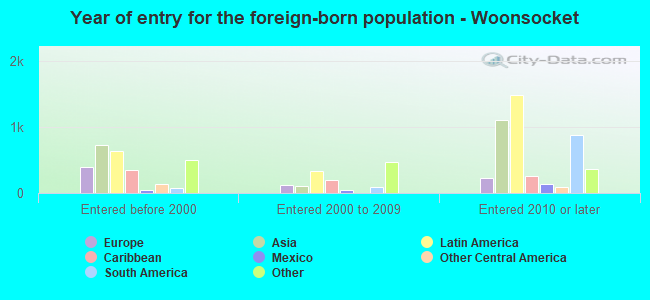
Foreign-born residents in Woonsocket 6,417 residents are foreign born (5.0% Latin America , 4.4% Asia , 2.9% Africa , 2.1% Europe ).
This city:
14.9%Rhode Island:
14.4%
Marital status for residents in Woonsocket Marital status - White (Caucasian) population 15 years and over
Males 38.0% Never married42.6% Now married1.3% Separated2.9% Widowed15.2% DivorcedFemales 31.2% Never married37.5% Now married3.0% Separated11.5% Widowed16.9% DivorcedWomen who gave birth in the past 12 months Now married:
55.0% (162)Unmarried:
45.0% (132)
Women who did not give birth in the past 12 months Now married:
35.7% (1,779)Unmarried:
64.3% (3,204)
Marital status - Black or African American population 15 years and over
Males 54.8% Never married37.1% Now married0.0% Separated3.0% Widowed5.1% DivorcedFemales 43.5% Never married38.2% Now married2.8% Separated5.2% Widowed10.4% DivorcedWomen who gave birth in the past 12 months Now married:
14.1% (9)Unmarried:
85.9% (55)
Women who did not give birth in the past 12 months Now married:
41.6% (296)Unmarried:
58.4% (416)
Marital status - American Indian / Alaska Native population 15 years and over
Males 86.3% Never married13.7% Now married0.0% Separated0.0% Widowed0.0% DivorcedFemales 29.2% Never married6.6% Now married64.2% Separated0.0% Widowed0.0% DivorcedWomen who gave birth in the past 12 months Now married:
100.0% (104)Unmarried:
0.0% (0)
Women who did not give birth in the past 12 months Now married:
3.0% (1)Unmarried:
97.0% (38)
Marital status - Asian population 15 years and over
Males 38.1% Never married52.4% Now married3.0% Separated0.0% Widowed6.6% DivorcedFemales 16.2% Never married57.0% Now married6.8% Separated18.3% Widowed1.8% DivorcedWomen who gave birth in the past 12 months Now married:
100.0% (17)Unmarried:
0.0% (0)
Women who did not give birth in the past 12 months Now married:
72.9% (528)Unmarried:
27.1% (196)
Marital status - Other race population 15 years and over
Males 63.0% Never married31.7% Now married0.0% Separated0.0% Widowed5.3% DivorcedFemales 46.7% Never married9.7% Now married13.9% Separated12.9% Widowed16.7% DivorcedWomen who gave birth in the past 12 months Now married:
51.2% (24)Unmarried:
48.8% (23)
Women who did not give birth in the past 12 months Now married:
27.8% (308)Unmarried:
72.2% (801)
Marital status - Two or more races population 15 years and over
Males 57.7% Never married26.2% Now married2.1% Separated4.2% Widowed9.9% DivorcedFemales 56.9% Never married16.6% Now married5.3% Separated1.2% Widowed19.9% DivorcedWomen who gave birth in the past 12 months Now married:
48.3% (20)Unmarried:
51.7% (21)
Women who did not give birth in the past 12 months Now married:
16.7% (419)Unmarried:
83.3% (2,095)
Marital status - White alone, not Hispanic / Latino population 15 years and over
Males 37.3% Never married42.7% Now married1.2% Separated3.0% Widowed15.8% DivorcedFemales 29.2% Never married38.6% Now married2.4% Separated12.3% Widowed17.5% DivorcedWomen who gave birth in the past 12 months Now married:
47.3% (129)Unmarried:
52.7% (144)
Women who did not give birth in the past 12 months Now married:
36.6% (1,713)Unmarried:
63.4% (2,964)
Marital status - Hispanic or Latino population 15 years and over
Males 61.1% Never married31.0% Now married1.1% Separated2.4% Widowed4.5% DivorcedFemales 51.0% Never married15.8% Now married12.8% Separated5.6% Widowed14.7% DivorcedWomen who gave birth in the past 12 months Now married:
72.7% (173)Unmarried:
27.3% (65)
Women who did not give birth in the past 12 months Now married:
24.1% (682)Unmarried:
75.9% (2,149)
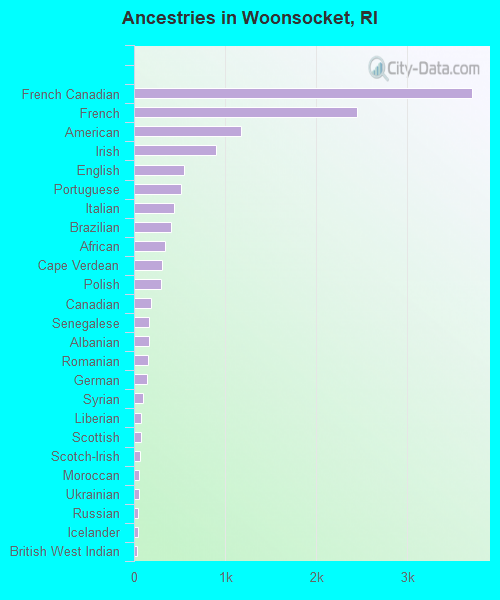
Ancestries in Woonsocket
3,711 16.3% French Canadian2,453 10.7% French1,171 5.1% American897 3.9% Irish548 2.4% English515 2.3% Portuguese441 1.9% Italian410 1.8% Brazilian335 1.5% African304 1.3% Cape Verdean295 1.3% Polish191 0.8% Canadian162 0.7% Senegalese162 0.7% Albanian157 0.7% Romanian148 0.6% German103 0.5% Syrian77 0.3% Liberian76 0.3% Scottish69 0.3% Scotch-Irish59 0.3% Moroccan56 0.2% Ukrainian43 0.2% Russian42 0.2% Icelander36 0.2% British West Indian32 0.1% Nigerian30 0.1% Haitian28 0.1% European28 0.1% Swedish19 0.08% Armenian19 0.08% Belgian13 0.06% Scandinavian11 0.05% British7 0.03% Basque7 0.03% Eastern European7 0.03% Lithuanian6 0.03% Dutch4 0.02% South African4 0.02% Welsh3 0.01% Greek
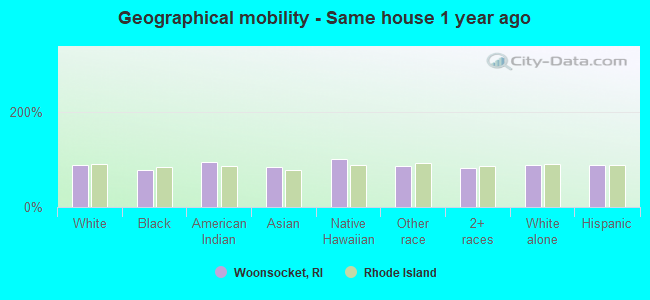
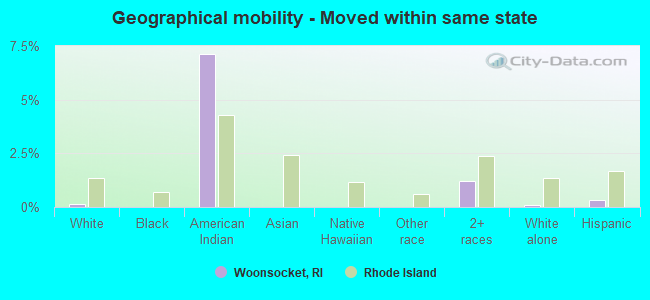
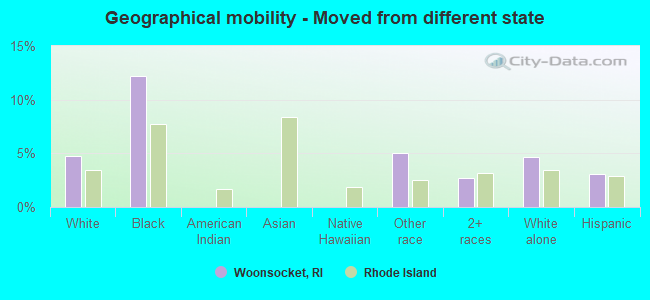
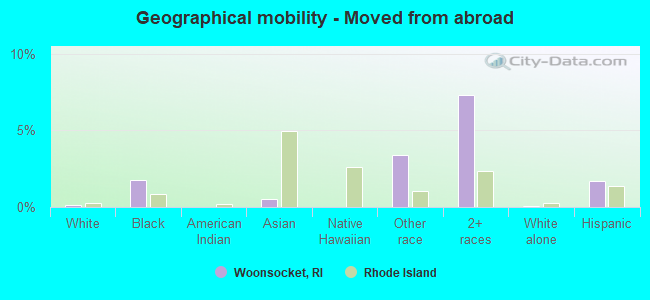
Geographical mobility in Woonsocket Same house 1 year ago 21,133 87.2% White (Caucasian)2,260 77.6% Black or African American455 94.1% American Indian / Alaska Native2,273 82.7% Asian45 100.0% Native Hawaiian / Pacific Islander2,993 85.7% Other race7,648 82.3% Two or more races20,373 86.9% White alone, not Hispanic / Latino9,317 89.0% Hispanic or LatinoMoved within same county 1,885 7.8% White / Caucasian298 10.2% Black or African American1 0.2% American Indian / Alaska Native312 11.4% Asian188 5.4% Other race562 6.0% Two or more races1,976 8.4% White alone, not Hispanic / Latino590 5.6% Hispanic or LatinoMoved within same state 34 0.1% White / Caucasian34 7.1% American Indian / Alaska Native114 1.2% Two or more races23 0.1% White alone, not Hispanic / Latino36 0.3% Hispanic or LatinoMoved from different state 1,146 4.7% White / Caucasian355 12.2% Black or African American176 5.0% Other race249 2.7% Two or more races1,099 4.7% White alone, not Hispanic / Latino319 3.0% Hispanic or LatinoMoved from abroad 35 0.1% White51 1.8% Black or African American14 0.5% Asian118 3.4% Other race679 7.3% Two or more races15 0.1% White alone, not Hispanic / Latino177 1.7% Hispanic or Latino
Children Nativity (place of birth) in Woonsocket
Children under 6 years - Living with two parents Both parents native 844 99.9% Native1 0.1% Foreign-bornBoth parents foreign-born 130 91.0% Native13 9.0% Foreign-bornOne native, one foreign-born parent 128 100.0% NativeChildren under 6 years - Living with one parent Native parent 2,335 100.0% NativeForeign-born parent 323 95.1% Native17 4.9% Foreign-bornChildren 6 to 17 years - Living with two parents Both parents native 1,801 99.9% Native2 0.1% Foreign-bornBoth parents foreign-born 348 45.2% Native423 54.8% Foreign-bornOne native, one foreign-born parent 214 100.0% NativeChildren 6 to 17 years - Living with one parent Native parent 2,373 100.0% NativeForeign-born parent 591 55.6% Native471 44.4% Foreign-born
Grandparents responsible for own grandchildren in Woonsocket
Grandparents (30 to 59 years) White / Caucasian 10 5.3% Responsible for grandchildren174 94.7% Not responsible for grandchildrenBlack or African American 10 25.4% Responsible for grandchildren28 74.6% Not responsible for grandchildrenAsian 53 100.0% Not responsible for grandchildrenOther race 57 100.0% Responsible for grandchildrenTwo or more races 23 100.0% Not responsible for grandchildrenWhite alone, not Hispanic / Latino 15 7.4% Responsible for grandchildren192 92.6% Not responsible for grandchildrenHispanic or Latino 47 70.7% Responsible for grandchildren20 29.3% Not responsible for grandchildrenGrandparents (60 years and over) White / Caucasian 26 25.4% Responsible for grandchildren76 74.6% Not responsible for grandchildrenBlack or African American 30 35.6% Responsible for grandchildren54 64.4% Not responsible for grandchildrenAsian 151 100.0% Not responsible for grandchildrenOther race 30 100.0% Not responsible for grandchildrenWhite alone, not Hispanic / Latino 22 26.9% Responsible for grandchildren60 73.1% Not responsible for grandchildrenHispanic or Latino 15 15.3% Responsible for grandchildren84 84.7% Not responsible for grandchildren