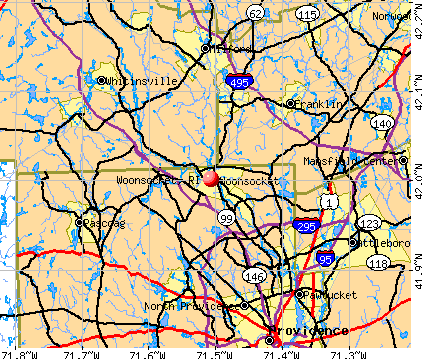
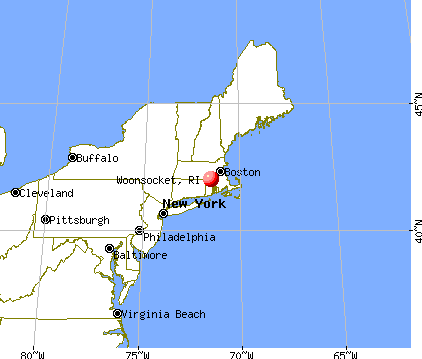
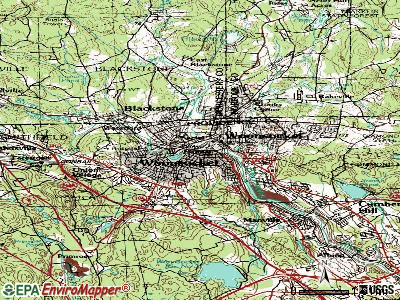
Woonsocket, Rhode Island
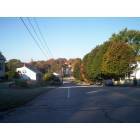
Woonsocket: This was taken walking down Lefrancois Blvd in October of 2006
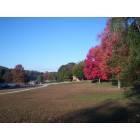
Woonsocket: This was taken in the front of Woonsocket High School looking towards Cass Park in October 2006
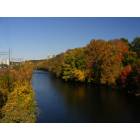
Woonsocket: Blackstone River as seen from the Hamlet Ave Bridge in Woonsocket
- add
your
Submit your own pictures of this city and show them to the world
- OSM Map
- General Map
- Google Map
- MSN Map
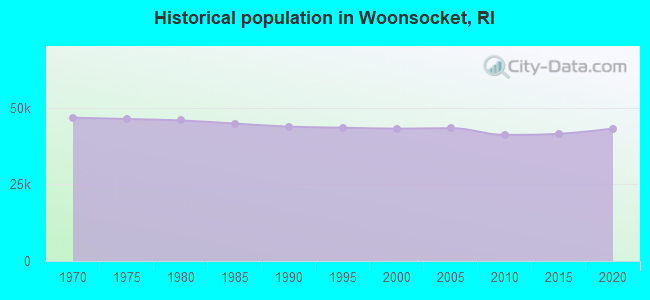
Population change since 2000: -0.7%
 |
| Males: 20,986 | |
| Females: 21,956 |
| Median resident age: | 35.5 years |
| Rhode Island median age: | 40.7 years |
Zip codes: 02895.
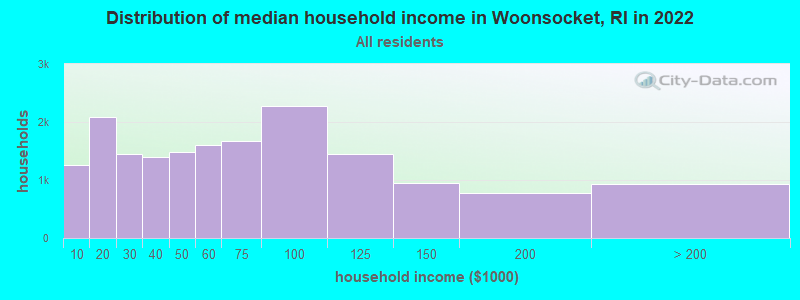
| Woonsocket: | $56,432 |
| RI: | $81,854 |
Estimated per capita income in 2022: $30,168 (it was $16,223 in 2000)
Woonsocket city income, earnings, and wages data
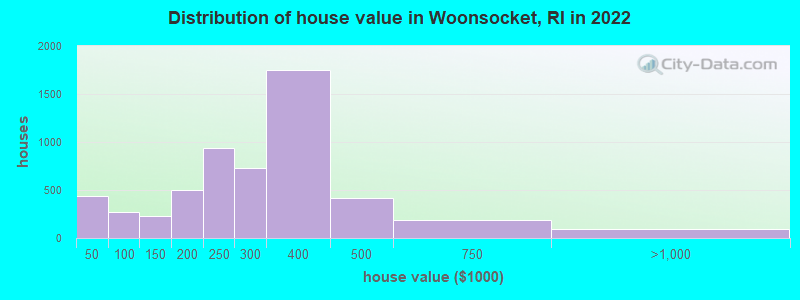
Estimated median house or condo value in 2022: $279,886 (it was $113,800 in 2000)
| Woonsocket: | $279,886 |
| RI: | $383,900 |
Mean prices in 2022: all housing units: $273,225; detached houses: $291,880; townhouses or other attached units: $189,048; in 2-unit structures: $253,080; in 3-to-4-unit structures: $262,105; in 5-or-more-unit structures: $130,107; mobile homes: $75,474
Median gross rent in 2022: $1,144.
(15.4% for White Non-Hispanic residents, 16.8% for Black residents, 31.1% for Hispanic or Latino residents, 72.2% for American Indian residents, 100.0% for Native Hawaiian and other Pacific Islander residents, 32.3% for other race residents, 28.5% for two or more races residents)
Detailed information about poverty and poor residents in Woonsocket, RI


Compare current foreclosures near Woonsocket, RI:
| Photo | Address | Area | Beds / Baths | Price | Details |
|---|---|---|---|---|---|

|
#1
Grove St
Woonsocket, RI 02895
|
2,534 sq. feet
|
3 baths 6 beds |
show details | |

|
#2
Bertenshaw Rd
Woonsocket, RI 02895
|
1,512 sq. feet
|
2 baths 4 beds |
show details | |

|
#3
Smithfield Rd
Woonsocket, RI 02895
|
2,878 sq. feet
|
3 baths 6 beds |
show details | |

|
#4
Mendon Rd
Woonsocket, RI 02895
|
2,450 sq. feet
|
2 baths 6 beds |
show details | |

|
#5
Nursery Ave
Woonsocket, RI 02895
|
1,152 sq. feet
|
1 baths 3 beds |
show details | |

|
#6
Vose St # 2
Woonsocket, RI 02895
|
2,576 sq. feet
|
2 baths 5 beds |
show details | |

|
#7
Mendon Rd
Woonsocket, RI 02895
|
2,357 sq. feet
|
3 baths 3 beds |
show details | |

|
#8
Carnation St
Woonsocket, RI 02895
|
1,143 sq. feet
|
1 baths 3 beds |
show details | |

|
#9
Rhode Island Ave
Woonsocket, RI 02895
|
2,080 sq. feet
|
2 baths 6 beds |
show details | |

|
#10
Logee St
Woonsocket, RI 02895
|
1,270 sq. feet
|
1 baths 4 beds |
show details |
| Photo | Address | Area | Beds / Baths | Price | Details |
|---|---|---|---|---|---|

|
#11
Jeffers St
Woonsocket, RI 02895
|
1,794 sq. feet
|
2 baths 5 beds |
show details | |

|
#12
Dawn Blvd
Woonsocket, RI 02895
|
1,164 sq. feet
|
1 baths 3 beds |
show details | |

|
#13
Grove St
Woonsocket, RI 02895
|
1,156 sq. feet
|
1 baths 3 beds |
show details | |

|
#14
Rathbun St Apt 2
Woonsocket, RI 02895
|
780 sq. feet
|
1 baths 2 beds |
show details | |

|
#15
Chestnut St
Woonsocket, RI 02895
|
- sq. feet
|
- baths - beds |
show details | |

|
#16
Grand St # 3
Woonsocket, RI 02895
|
- sq. feet
|
- baths - beds |
show details | |

|
#17
Pleasant St
Woonsocket, RI 02895
|
- sq. feet
|
- baths - beds |
show details | |

|
#18
Summit St Apt 3
Woonsocket, RI 02895
|
- sq. feet
|
- baths - beds |
show details | |

|
#19
John A Cummings Way Ste 2
Woonsocket, RI 02895
|
- sq. feet
|
- baths - beds |
show details | |

|
#20
Hebron Ave
Attleboro, MA 02703
|
2,939 sq. feet
|
4 baths 6 beds |
$559,900
|
show details |
| Photo | Address | Area | Beds / Baths | Price | Details |
|---|---|---|---|---|---|

|
#21
Round Lake Dr
Pascoag, RI 02859
|
976 sq. feet
|
2 baths 2 beds |
$179,900
|
show details |

|
#22
Loomis St
North Attleboro, MA 02760
|
2,294 sq. feet
|
2 baths 4 beds |
$700,000
|
show details |

|
#23
Whittier Ave
Providence, RI 02909
|
3 sq. feet
|
3 baths 6 beds |
$109,900
|
show details |

|
#24
Mount Pleasant Rd
Harrisville, RI 02830
|
1,232 sq. feet
|
1 baths 3 beds |
$449,900
|
show details |

|
#25
Cook Rd
Cumberland, RI 02864
|
2,050 sq. feet
|
2 baths 4 beds |
$749,500
|
show details |

|
#26
N Main St
Pascoag, RI 02859
|
- sq. feet
|
- baths - beds |
$100,000
|
show details |

|
#27
1/2 Putnam Hill Road
Sutton, MA 01590
|
1,415 sq. feet
|
1 baths 3 beds |
show details | |

|
#28
Marion Avenue
Providence, RI 02905
|
1,252 sq. feet
|
1 baths 3 beds |
show details | |

|
#29
Laurelwood Dr # No
Hopedale, MA 01747
|
1,440 sq. feet
|
1 baths 2 beds |
show details | |

|
#30
Depot St
North Attleboro, MA 02760
|
- sq. feet
|
2 baths 3 beds |
show details |
| Photo | Address | Area | Beds / Baths | Price | Details |
|---|---|---|---|---|---|

|
#31
Follett St
East Providence, RI 02914
|
1,584 sq. feet
|
2 baths 4 beds |
show details | |

|
#32
Glendale Ave
Uxbridge, MA 01569
|
1,302 sq. feet
|
2 baths 4 beds |
show details | |

|
#33
Blanding Ave
East Providence, RI 02914
|
1,165 sq. feet
|
1 baths 3 beds |
show details | |

|
#34
Atwood Ave
Johnston, RI 02919
|
1,792 sq. feet
|
1 baths 4 beds |
show details | |

|
#35
Atwood Ave
Johnston, RI 02919
|
1,792 sq. feet
|
2 baths 4 beds |
show details | |

|
#36
Cynthia Dr Apt 13
North Providence, RI 02911
|
768 sq. feet
|
1 baths 2 beds |
show details | |

|
#37
Thacher St
Attleboro, MA 02703
|
1,040 sq. feet
|
1 baths 3 beds |
show details | |

|
#38
What Cheer Ave
Providence, RI 02909
|
2,280 sq. feet
|
2 baths 3 beds |
show details | |

|
#39
Sidney Rd
Milford, MA 01757
|
1,184 sq. feet
|
1 baths 4 beds |
show details | |

|
#40
Putnam Pike
Greenville, RI 02828
|
1,114 sq. feet
|
1 baths 2 beds |
show details |
| Photo | Address | Area | Beds / Baths | Price | Details |
|---|---|---|---|---|---|

|
#41
Branch Ave
Providence, RI 02904
|
2,921 sq. feet
|
4 baths 6 beds |
show details | |

|
#42
Valley Green Court
Providence, RI 02904
|
1,440 sq. feet
|
3 baths 2 beds |
show details | |

|
#43
Mount Hope St
North Attleboro, MA 02760
|
3,554 sq. feet
|
2 baths 4 beds |
show details | |

|
#44
Mill St
Foxboro, MA 02035
|
1,584 sq. feet
|
2 baths 3 beds |
show details | |

|
#45
Tyndall Ave
Providence, RI 02908
|
1,523 sq. feet
|
1 baths 4 beds |
show details | |

|
#46
Mallard Dr
Medway, MA 02053
|
2,024 sq. feet
|
2 baths 5 beds |
show details | |

|
#47
Snake Hill Rd
North Scituate, RI 02857
|
864 sq. feet
|
2 baths 2 beds |
show details | |

|
#48
Cedar St
Ashland, MA 01721
|
2,756 sq. feet
|
3 baths 4 beds |
show details | |

|
#49
Woburn St
Cranston, RI 02910
|
1,212 sq. feet
|
1 baths 4 beds |
show details | |

|
Check over 1 million property listings on Foreclosure.com!
|
browse all offers | |||


- 23,64755.0%White alone
- 10,78925.1%Hispanic
- 3,5118.2%Two or more races
- 2,7476.4%Asian alone
- 2,3735.5%Black alone
- 2590.6%Other race alone
- 500.1%American Indian alone
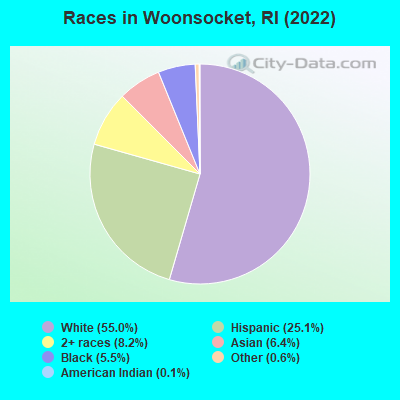
Races in Woonsocket detailed stats: ancestries, foreign born residents, place of birth
According to our research of Rhode Island and other state lists, there were 123 registered sex offenders living in Woonsocket, Rhode Island as of April 27, 2024.
The ratio of all residents to sex offenders in Woonsocket is 337 to 1.
Type |
2009 |
2010 |
2011 |
2012 |
2013 |
2014 |
2015 |
2016 |
2017 |
2018 |
2019 |
2020 |
2021 |
2022 |
|---|---|---|---|---|---|---|---|---|---|---|---|---|---|---|
| Murders (per 100,000) | 2 (4.6) | 1 (2.4) | 0 (0.0) | 0 (0.0) | 1 (2.4) | 0 (0.0) | 1 (2.4) | 1 (2.4) | 0 (0.0) | 1 (2.4) | 2 (4.8) | 4 (9.6) | 1 (2.3) | 0 (0.0) |
| Rapes (per 100,000) | 29 (66.9) | 29 (70.4) | 22 (53.5) | 23 (55.9) | 41 (99.9) | 27 (65.6) | 39 (94.5) | 39 (94.0) | 39 (93.9) | 46 (110.3) | 36 (86.3) | 45 (107.9) | 39 (90.5) | 24 (55.9) |
| Robberies (per 100,000) | 31 (71.5) | 48 (116.5) | 53 (128.8) | 59 (143.4) | 48 (116.9) | 48 (116.7) | 43 (104.2) | 41 (98.8) | 55 (132.4) | 43 (103.1) | 41 (98.3) | 24 (57.6) | 25 (58.0) | 26 (60.6) |
| Assaults (per 100,000) | 91 (209.8) | 99 (240.4) | 99 (240.7) | 138 (335.4) | 150 (365.3) | 144 (350.0) | 146 (353.8) | 131 (315.6) | 127 (305.7) | 158 (378.8) | 162 (388.4) | 136 (326.2) | 167 (387.7) | 143 (333.1) |
| Burglaries (per 100,000) | 350 (807.1) | 346 (840.1) | 415 (1,009) | 346 (840.9) | 361 (879.3) | 370 (899.4) | 314 (761.0) | 296 (713.1) | 262 (630.7) | 256 (613.8) | 197 (472.3) | 156 (374.2) | 120 (278.6) | 128 (298.2) |
| Thefts (per 100,000) | 911 (2,101) | 745 (1,809) | 834 (2,027) | 840 (2,041) | 778 (1,895) | 660 (1,604) | 536 (1,299) | 606 (1,460) | 608 (1,464) | 574 (1,376) | 584 (1,400) | 500 (1,199) | 541 (1,256) | 518 (1,207) |
| Auto thefts (per 100,000) | 111 (256.0) | 90 (218.5) | 82 (199.3) | 73 (177.4) | 87 (211.9) | 87 (211.5) | 64 (155.1) | 70 (168.6) | 78 (187.8) | 73 (175.0) | 88 (211.0) | 100 (239.8) | 90 (209.0) | 121 (281.9) |
| Arson (per 100,000) | 21 (48.4) | 9 (21.9) | 16 (38.9) | 20 (48.6) | 15 (36.5) | 22 (53.5) | 24 (58.2) | 7 (16.9) | 12 (28.9) | 15 (36.0) | 15 (36.0) | 11 (26.4) | 9 (20.9) | 9 (21.0) |
| City-Data.com crime index | 287.1 | 292.9 | 297.2 | 309.5 | 347.2 | 301.6 | 300.1 | 294.5 | 293.7 | 311.7 | 291.8 | 281.4 | 258.5 | 221.2 |
The City-Data.com crime index weighs serious crimes and violent crimes more heavily. Higher means more crime, U.S. average is 246.1. It adjusts for the number of visitors and daily workers commuting into cities.
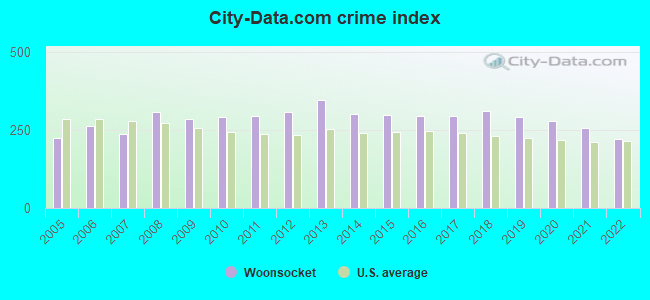
Crime rate in Woonsocket detailed stats: murders, rapes, robberies, assaults, burglaries, thefts, arson
Full-time law enforcement employees in 2021, including police officers: 115 (96 officers - 92 male; 4 female).
| Officers per 1,000 residents here: | 2.23 |
| Rhode Island average: | 2.27 |
 Recent articles from our blog. Our writers, many of them Ph.D. graduates or candidates, create easy-to-read articles on a wide variety of topics.

 | Be careful in the Woonsocket area... (43 replies) |
| Pawtucket: Artsy and Affordable (148 replies) |
| Providence General Crime Thread (All Posts Go Here) (2858 replies) |
| What is it like living in Woonsocket, RI? (94 replies) |
| Largest drug bust in Rhode Island history (41 replies) |
| Boston (more than ever) Drives RI's housing market - Up (239 replies) |
Latest news from Woonsocket, RI collected exclusively by city-data.com from local newspapers, TV, and radio stations
Ancestries: French Canadian (17.6%), French (10.7%), American (5.2%), Irish (3.7%), Portuguese (2.2%), English (2.0%).
Current Local Time: EST time zone
Incorporated in 1867
Elevation: 162 feet
Land area: 7.71 square miles.
Population density: 5,572 people per square mile (average).
6,417 residents are foreign born (5.0% Latin America, 4.4% Asia, 2.9% Africa, 2.1% Europe).
| This city: | 14.9% |
| Rhode Island: | 14.4% |
Median real estate property taxes paid for housing units with mortgages in 2022: $3,967 (1.4%)
Median real estate property taxes paid for housing units with no mortgage in 2022: $3,941 (1.5%)
Nearest city with pop. 50,000+: Pawtucket, RI  (11.0 miles , pop. 72,958).
Nearest city with pop. 200,000+: Boston, MA (30.8 miles , pop. 589,141).
Nearest city with pop. 1,000,000+: Bronx, NY (146.4 miles , pop. 1,332,650).
Nearest cities:
), ), ), ), Latitude: 42.00 N, Longitude: 71.51 W
Daytime population change due to commuting: -2,569 (-6.0%)
Workers who live and work in this city: 5,400 (28.2%)
Area code: 401

Woonsocket, Rhode Island accommodation & food services, waste management - Economy and Business Data
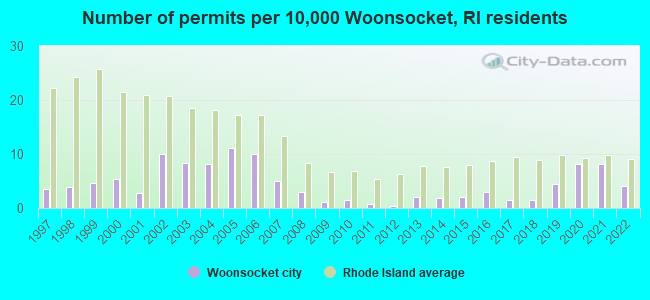
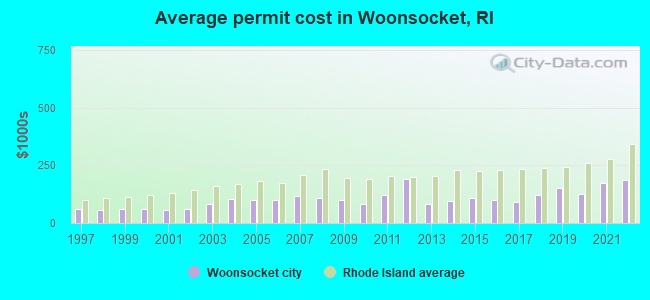
Single-family new house construction building permits:
- 2022: 18 buildings, average cost: $184,700
- 2021: 35 buildings, average cost: $171,900
- 2020: 35 buildings, average cost: $127,900
- 2019: 19 buildings, average cost: $149,900
- 2018: 6 buildings, average cost: $120,800
- 2017: 6 buildings, average cost: $93,300
- 2016: 13 buildings, average cost: $101,000
- 2015: 9 buildings, average cost: $109,400
- 2014: 8 buildings, average cost: $95,500
- 2013: 9 buildings, average cost: $80,900
- 2012: 2 buildings, average cost: $190,300
- 2011: 3 buildings, average cost: $123,000
- 2010: 6 buildings, average cost: $81,600
- 2009: 5 buildings, average cost: $100,000
- 2008: 13 buildings, average cost: $107,100
- 2007: 22 buildings, average cost: $116,600
- 2006: 43 buildings, average cost: $100,500
- 2005: 48 buildings, average cost: $97,900
- 2004: 35 buildings, average cost: $104,900
- 2003: 36 buildings, average cost: $84,200
- 2002: 43 buildings, average cost: $60,100
- 2001: 12 buildings, average cost: $56,100
- 2000: 23 buildings, average cost: $58,700
- 1999: 20 buildings, average cost: $62,600
- 1998: 17 buildings, average cost: $54,600
- 1997: 15 buildings, average cost: $60,500
| Here: | 4.9% |
| Rhode Island: | 3.3% |
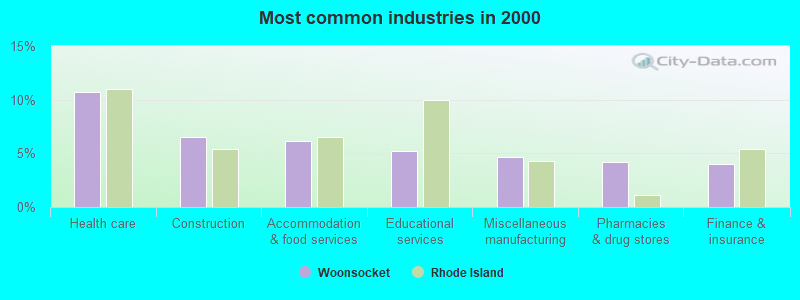
- Health care (10.7%)
- Construction (6.5%)
- Accommodation & food services (6.2%)
- Educational services (5.2%)
- Miscellaneous manufacturing (4.7%)
- Pharmacies & drug stores (4.2%)
- Finance & insurance (4.0%)
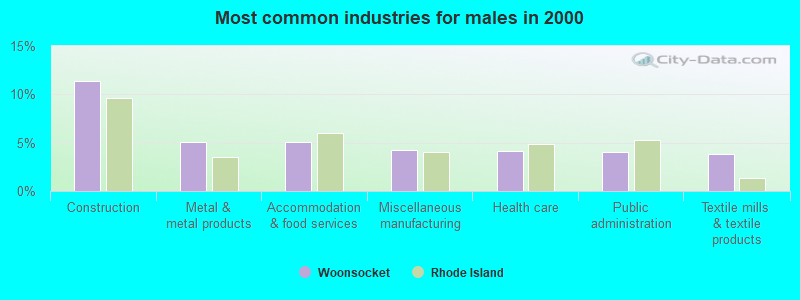
- Construction (11.4%)
- Metal & metal products (5.1%)
- Accommodation & food services (5.0%)
- Miscellaneous manufacturing (4.3%)
- Health care (4.2%)
- Public administration (4.1%)
- Textile mills & textile products (3.9%)
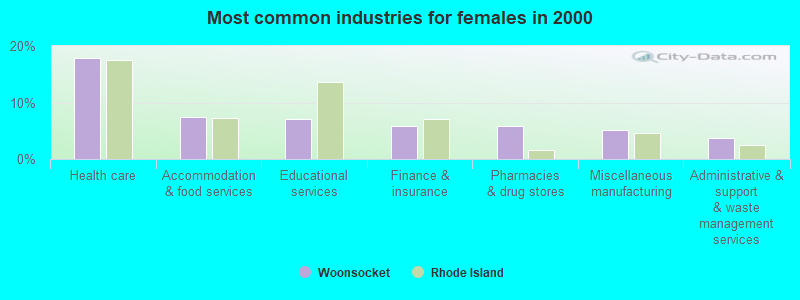
- Health care (18.0%)
- Accommodation & food services (7.4%)
- Educational services (7.2%)
- Finance & insurance (5.9%)
- Pharmacies & drug stores (5.9%)
- Miscellaneous manufacturing (5.1%)
- Administrative & support & waste management services (3.7%)
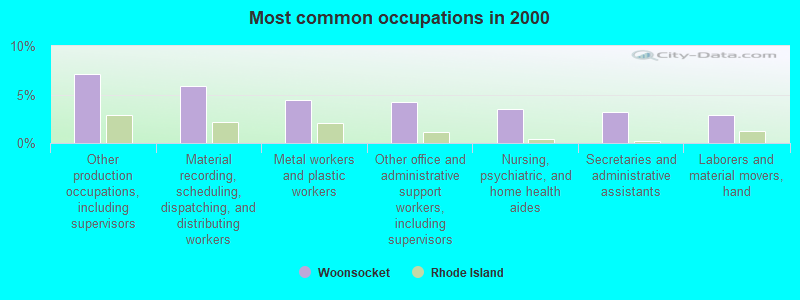
- Other production occupations, including supervisors (7.2%)
- Material recording, scheduling, dispatching, and distributing workers (5.9%)
- Metal workers and plastic workers (4.4%)
- Other office and administrative support workers, including supervisors (4.2%)
- Nursing, psychiatric, and home health aides (3.5%)
- Secretaries and administrative assistants (3.2%)
- Laborers and material movers, hand (2.9%)
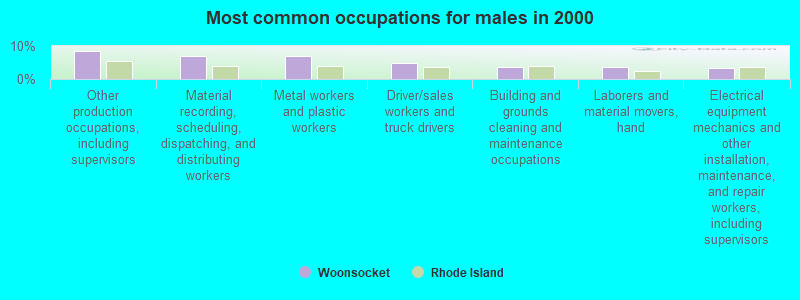
- Other production occupations, including supervisors (8.5%)
- Material recording, scheduling, dispatching, and distributing workers (7.0%)
- Metal workers and plastic workers (6.9%)
- Driver/sales workers and truck drivers (4.7%)
- Building and grounds cleaning and maintenance occupations (3.6%)
- Laborers and material movers, hand (3.6%)
- Electrical equipment mechanics and other installation, maintenance, and repair workers, including supervisors (3.4%)
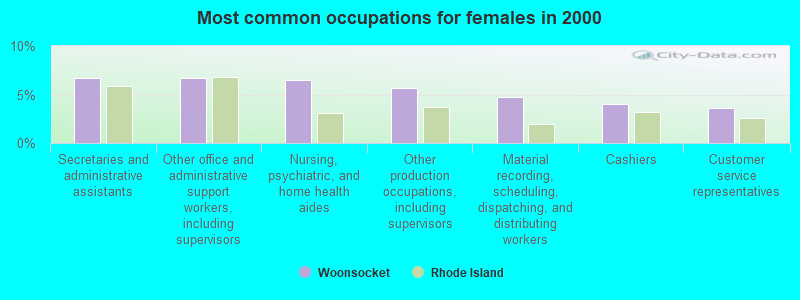
- Secretaries and administrative assistants (6.7%)
- Other office and administrative support workers, including supervisors (6.7%)
- Nursing, psychiatric, and home health aides (6.5%)
- Other production occupations, including supervisors (5.7%)
- Material recording, scheduling, dispatching, and distributing workers (4.7%)
- Cashiers (4.0%)
- Customer service representatives (3.6%)
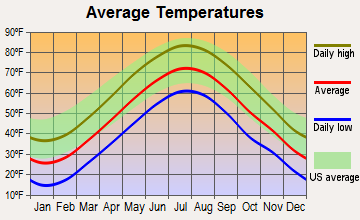
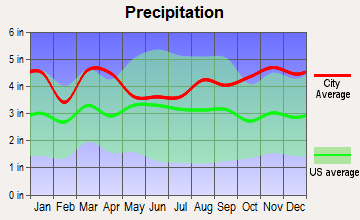
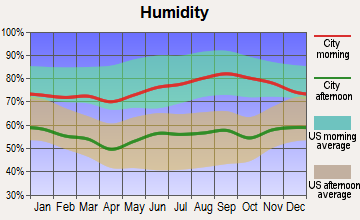
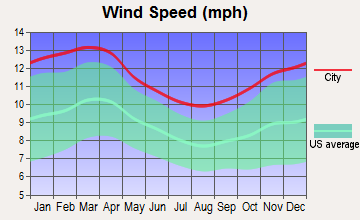
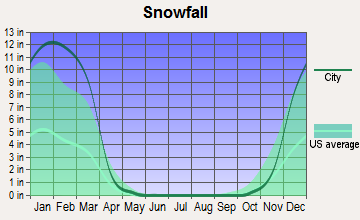
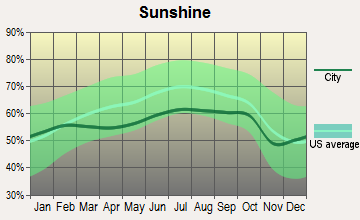
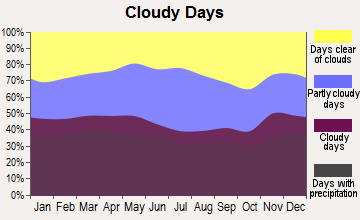
Average climate in Woonsocket, Rhode Island
Based on data reported by over 4,000 weather stations
|
|

(lower is better)
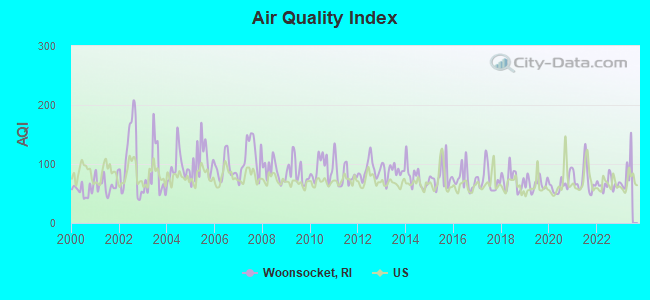
Air Quality Index (AQI) level in 2022 was 66.0. This is about average.
| City: | 66.0 |
| U.S.: | 72.6 |
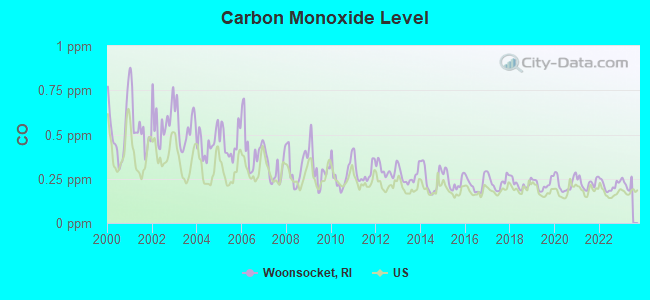
Carbon Monoxide (CO) [ppm] level in 2022 was 0.212. This is about average. Closest monitor was 10.6 miles away from the city center.
| City: | 0.212 |
| U.S.: | 0.251 |
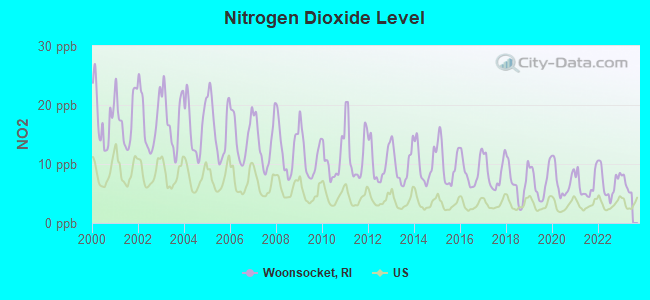
Nitrogen Dioxide (NO2) [ppb] level in 2022 was 6.77. This is worse than average. Closest monitor was 0.3 miles away from the city center.
| City: | 6.77 |
| U.S.: | 5.11 |
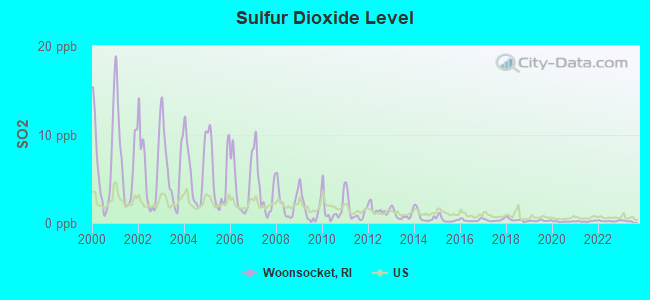
Sulfur Dioxide (SO2) [ppb] level in 2022 was 0.227. This is significantly better than average. Closest monitor was 0.3 miles away from the city center.
| City: | 0.227 |
| U.S.: | 1.515 |
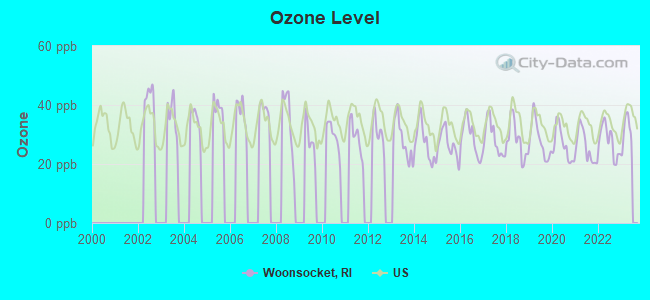
Ozone [ppb] level in 2022 was 27.8. This is about average. Closest monitor was 8.9 miles away from the city center.
| City: | 27.8 |
| U.S.: | 33.3 |
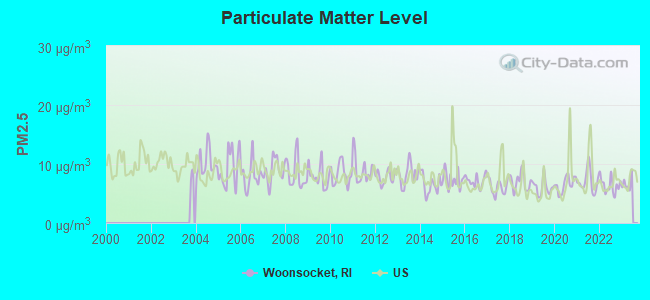
Particulate Matter (PM2.5) [µg/m3] level in 2022 was 6.37. This is better than average. Closest monitor was 10.5 miles away from the city center.
| City: | 6.37 |
| U.S.: | 8.11 |
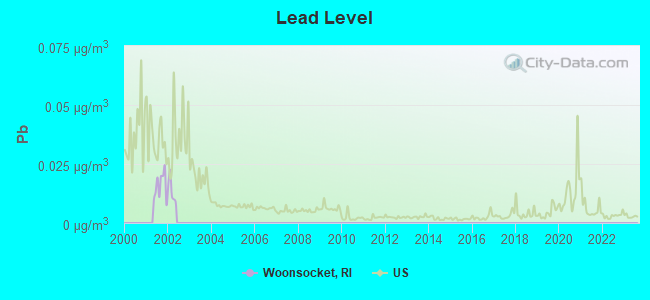
Lead (Pb) [µg/m3] level in 2001 was 0.0156. This is significantly worse than average. Closest monitor was 11.0 miles away from the city center.
| City: | 0.0156 |
| U.S.: | 0.0093 |
Tornado activity:
Woonsocket-area historical tornado activity is slightly above Rhode Island state average. It is 38% smaller than the overall U.S. average.
On 6/9/1953, a category F4 (max. wind speeds 207-260 mph) tornado 20.6 miles away from the Woonsocket city center killed 90 people and injured 1228 people and caused between $50,000,000 and $500,000,000 in damages.
On 6/9/1953, a category F3 (max. wind speeds 158-206 mph) tornado 16.1 miles away from the city center injured 17 people and caused between $500,000 and $5,000,000 in damages.
Earthquake activity:
Woonsocket-area historical earthquake activity is significantly above Rhode Island state average. It is 73% smaller than the overall U.S. average.On 10/7/1983 at 10:18:46, a magnitude 5.3 (5.1 MB, 5.3 LG, 5.1 ML, Class: Moderate, Intensity: VI - VII) earthquake occurred 196.9 miles away from the city center
On 4/20/2002 at 10:50:47, a magnitude 5.3 (5.3 ML, Depth: 3.0 mi) earthquake occurred 205.7 miles away from Woonsocket center
On 4/20/2002 at 10:50:47, a magnitude 5.2 (5.2 MB, 4.2 MS, 5.2 MW, 5.0 MW) earthquake occurred 204.8 miles away from Woonsocket center
On 1/19/1982 at 00:14:42, a magnitude 4.7 (4.5 MB, 4.7 MD, 4.5 LG, Class: Light, Intensity: IV - V) earthquake occurred 103.7 miles away from the city center
On 10/16/2012 at 23:12:25, a magnitude 4.7 (4.7 ML, Depth: 10.0 mi) earthquake occurred 118.5 miles away from the city center
On 8/22/1992 at 12:20:32, a magnitude 4.8 (4.8 MB, 3.8 MS, 4.7 LG, Depth: 6.2 mi) earthquake occurred 209.8 miles away from Woonsocket center
Magnitude types: regional Lg-wave magnitude (LG), body-wave magnitude (MB), duration magnitude (MD), local magnitude (ML), surface-wave magnitude (MS), moment magnitude (MW)
Natural disasters:
The number of natural disasters in Providence County (17) is near the US average (15).Major Disasters (Presidential) Declared: 7
Emergencies Declared: 10
Causes of natural disasters: Hurricanes: 5, Snowstorms: 4, Blizzards: 3, Floods: 2, Storms: 2, Winter Storms: 2, Snow: 1, Snowfall: 1, Tropical Storm: 1, Water Main Break: 1, Wind: 1, Other: 1 (Note: some incidents may be assigned to more than one category).
Main business address for: CVS CORP (RETAIL-DRUG STORES AND PROPRIETARY STORES).
Hospitals and medical centers in Woonsocket:
- JOHN FOGARTY MEMORIAL HOSPITAL (provides emergency services, EDDIE DOWLING HIGHWAY)
- LANDMARK MEDICAL CENTER, INC (Voluntary non-profit - Private, provides emergency services, 115 CASS AVE)
- BALLOU HOME FOR THE AGED (60 MENDON ROAD)
- EVERGREENS NURSING HOME (116 GREENE ST)
- FRIENDLY HOME INC, THE (303 RHODES AVENUE)
- MT ST FRANCIS HEALTH CENTER (4 ST. JOSEPH STREET)
- OAKLAND GROVE HEALTH CARE CENTER (560 CUMBERLAND HILL ROAD)
- TRINITY HEALTH AND REHABILITATION CENTER (4 ST JOSEPH STREET)
- WOONSOCKET HEALTH CENTRE (262 POPLAR STREET)
- DIALYSIS CENTER OF WOONSOCKET (2100 DIAMOND HILL ROAD)
Heliports located in Woonsocket:
Amtrak stations near Woonsocket:
- 14 miles: PROVIDENCE (100 GASPEE ST.) . Services: ticket office, fully wheelchair accessible, enclosed waiting area, public restrooms, public payphones, snack bar, ATM, paid short-term parking, paid long-term parking, call for car rental service, taxi stand, public transit connection.
- 20 miles: FRAMINGHAM (443 WAVERLY ST.) . Services: public payphones, snack bar, paid short-term parking, taxi stand, public transit connection.
Colleges/universities with over 2000 students nearest to Woonsocket:
- Bryant University (about 6 miles; Smithfield, RI; Full-time enrollment: 3,440)
- Rhode Island College (about 12 miles; Providence, RI; FT enrollment: 7,189)
- Providence College (about 12 miles; Providence, RI; FT enrollment: 4,312)
- Brown University (about 14 miles; Providence, RI; FT enrollment: 8,458)
- Rhode Island School of Design (about 14 miles; Providence, RI; FT enrollment: 2,714)
- Johnson & Wales University-Providence (about 14 miles; Providence, RI; FT enrollment: 10,898)
- Community College of Rhode Island (about 21 miles; Warwick, RI; FT enrollment: 10,500)
Public high schools in Woonsocket:
- WOONSOCKET HIGH SCHOOL (Students: 1,895, Location: 777 CASS AVENUE, Grades: 9-12)
- BEACON CHARTER SCHOOL (Location: 320 MAIN STREET, Grades: 9-12, Charter school)
Private high schools in Woonsocket:
Public elementary/middle schools in Woonsocket:
- WOONSOCKET MIDDLE SCHOOL (Students: 1,334, Location: 60 FLORENCE DR, Grades: 6-8)
- GLOBE PARK SCHOOL (Students: 452, Location: 192 AVENUE A, Grades: PK-5)
- HARRIS SCHOOL (Students: 446, Location: 60 HIGH SCHOOL STREET, Grades: KG-5)
- GOVERNOR ARAM J. POTHIER SCHOO (Students: 420, Location: 420 ROBINSON STREET, Grades: PK-2)
- BERNON HEIGHTS SCHOOL (Students: 386, Location: 657 LOGEE STREET, Grades: KG-5)
- CITIZENS MEMORIAL SCHOOL (Students: 367, Location: 250 WINTHROP STREET, Grades: 2-5)
- LEO A. SAVOIE SCHOOL (Students: 354, Location: 990 MENDON ROAD, Grades: KG-5)
- KEVIN K. COLEMAN SCHOOL (Students: 281, Location: 96 SECOND AVENUE, Grades: KG-5)
Private elementary/middle schools in Woonsocket:
Points of interest:
Notable locations in Woonsocket: Hanora Mills (A), Museum of Work and Culture (B), Woonsocket Fire Department Station 6 (C), Woonsocket Fire Department Station 4 (D), Woonsocket Fire Department Station 3 (E), Woonsocket Fire Department Station 1 (F), Woonsocket YMCA (G), Woonsocket Police Department (H), Woonsocket Fire Department Station 2 (I), Woonsocket District Courthouse (J), Park Square Childrens Center (K), Fairmount Branch Library (L), Action Based Enterprises (M), Woonsocket Harris Public Library (N), Woonsocket City Hall (O), Saint Francis Orphanage (P). Display/hide their locations on the map
Shopping Centers: The Pavilion Shopping Center (1), Walnut Hill Plaza Shopping Center (2), Mill River Square Shopping Center (3), Bibliotheque Mallet (4). Display/hide their locations on the map
Main business address in Woonsocket: CVS CORP (A). Display/hide its location on the map
Churches in Woonsocket include: Saint James Episcopal Church (A), Apostolic Pentecostal Church (B), Saint Charles Borromeo Church Complex (C), Saint Anns Church Complex (D), Saint Andrews Episcopal Church (E), First Baptist Church (F), Jesus Marie Convent (G), First Universalist Church (H), Berean Baptist Church (I). Display/hide their locations on the map
Cemetery: Oak Hill Cemetery (1). Display/hide its location on the map
Lakes and reservoirs: Social Pond (A), Harris Pond (B), Darling Pond (C), Sylvestre Pond (D), Harris Pond (E). Display/hide their locations on the map
Streams, rivers, and creeks: Mill River (A), Cherry Brook (B), Crookfall Brook (C). Display/hide their locations on the map
Parks in Woonsocket include: South Main Street Historic District (1), Cold Spring Park (2), Veterans Memorial Park (3), World War II Memorial (4), Barry Field (5), Cato Hill Historic District (6), Cass Park (7), Island Place Historic District (8), Globe Park (9). Display/hide their locations on the map
Beach: State Park Beach (A). Display/hide its location on the map
Tourist attractions: Museum of Work & Culture (42 South Main Street), Cooperating Libraries Automated Network (Cultural Attractions- Events- & Facilities; 2168 Diamond Hill Road), Castle Gardens Cafe (339 Arnold St).
Hotel: Holiday Inn Express Hotel & Suites (194 Fortin Drive).
Court: Woonsocket City - Connecting All Depts- City Hall- Municipal Court (169 Main Street).
Birthplace of: Allen Doyle - Professional golfer, Alysha Castonguay - Cheerleader, Brian Boucher - NHL player (Phoenix Coyotes, born: Jan 2, 1977), Bryan Berard - NHL player (Columbus Blue Jackets, born: Mar 5, 1977), Duke Robillard - Blues musician, J. Howard McGrath - Politician, Kylie Duarte - Pair skater, Marcel Desaulniers - Food writer, Norm Abram - Carpenter, Rocco Baldelli - 2005 Major League Baseball player (Tampa Bay Devil Rays, born: Sep 25, 1981).
Drinking water stations with addresses in Woonsocket and their reported violations in the past:
THE HOMESTEAD GROUP (Address: SUITE 200 , Population served: 200, Groundwater):Past monitoring violations:WOON CONGREGATION OF JEHOVAHS WITNESSES (Population served: 175, Groundwater):
- 3 routine major monitoring violations
- One regular monitoring violation
Past health violations:SAYLES HILL ROD & GUN CLUB (Population served: 130, Groundwater):Past monitoring violations:
- MCL, Monthly (TCR) - Between JUL-2013 and SEP-2013, Contaminant: Coliform. Follow-up actions: St Formal NOV issued (AUG-05-2013), St Violation/Reminder Notice (AUG-05-2013), St Public Notif requested (AUG-05-2013), St Public Notif received (AUG-14-2013), St Compliance achieved (AUG-27-2013)
- Monitoring, Repeat Major (TCR) - In AUG-2013, Contaminant: Coliform (TCR). Follow-up actions: St Public Notif received (AUG-14-2013), St Public Notif requested (AUG-21-2013), St Violation/Reminder Notice (AUG-21-2013), St Formal NOV issued (AUG-21-2013), St Compliance achieved (AUG-27-2013)
Past monitoring violations:BRONCO CROSSING, LLC (Population served: 115, Groundwater):
- One routine major monitoring violation
Past health violations:CVS PHARMACY 05049 - PLEASANT VALLEY (Address: Licensing Dept. Mail Code 1160 , Serves NY, Population served: 65, Groundwater):Past monitoring violations:
- MCL, Monthly (TCR) - Between APR-2006 and JUN-2006, Contaminant: Coliform. Follow-up actions: St Violation/Reminder Notice (MAY-01-2006), St Boil Water Order (MAY-01-2006), St Formal NOV issued (MAY-01-2006), St Public Notif requested (MAY-01-2006), St Compliance achieved (MAY-12-2006), St Public Notif received (MAY-12-2006)
- Follow-up Or Routine LCR Tap M/R - In JAN-01-2006, Contaminant: Lead and Copper Rule. Follow-up actions: St Formal NOV issued (JUN-28-2006), St Public Notif requested (JUN-28-2006), St Violation/Reminder Notice (JUN-28-2006), St Public Notif received (JUL-20-2007), St Compliance achieved (JUL-20-2007)
- One routine major monitoring violation
Past monitoring violations:NEIGHBORHOOD VARIETY (Population served: 50, Groundwater):
- 162 regular monitoring violations
Past monitoring violations:
- One routine major monitoring violation
Drinking water stations with addresses in Woonsocket that have no violations reported:
- WOONSOCKET WATER DEPARTMENT (Population served: 46,000, Primary Water Source Type: Surface water)
| This city: | 2.4 people |
| Rhode Island: | 2.4 people |
| This city: | 58.7% |
| Whole state: | 62.8% |
| This city: | 10.3% |
| Whole state: | 7.6% |
Likely homosexual households (counted as self-reported same-sex unmarried-partner households)
- Lesbian couples: 0.5% of all households
- Gay men: 0.4% of all households
People in group quarters in Woonsocket in 2010:
- 568 people in nursing facilities/skilled-nursing facilities
- 80 people in other noninstitutional facilities
- 78 people in emergency and transitional shelters (with sleeping facilities) for people experiencing homelessness
- 52 people in group homes intended for adults
- 24 people in residential treatment centers for adults
People in group quarters in Woonsocket in 2000:
- 742 people in nursing homes
- 238 people in other noninstitutional group quarters
- 34 people in religious group quarters
- 23 people in homes or halfway houses for drug/alcohol abuse
- 18 people in homes for the mentally retarded
- 12 people in other group homes
- 8 people in homes for the mentally ill
Banks with branches in Woonsocket (2011 data):
- RBS Citizens, National Association: Walnut Hill Branch at 1675 Diamond Hill Road, branch established on 1973/02/01; Woonsocket Branch at 191 Social Street, branch established on 1992/06/27. Info updated 2007/09/19: Bank assets: $106,940.6 mil, Deposits: $75,690.2 mil, headquarters in Providence, RI, positive income, 1135 total offices, Holding Company: Uk Financial Investments Limited
- Bank of America, National Association: Diamond Hill Branch at 2020 Diamond Hill Road, branch established on 1972/08/16; Cummings Way Branch at 25 Cummings Way, branch established on 1967/06/27. Info updated 2009/11/18: Bank assets: $1,451,969.3 mil, Deposits: $1,077,176.8 mil, headquarters in Charlotte, NC, positive income, 5782 total offices, Holding Company: Bank Of America Corporation
- Milford Federal Savings and Loan Association: Woonsocket Branch at 1950 Diamond Hill Road, branch established on 1994/06/01. Info updated 2011/07/21: Bank assets: $343.1 mil, Deposits: $301.3 mil, headquarters in Milford, MA, positive income, Mortgage Lending Specialization, 4 total offices
- Admirals Bank: Diamond Hill Branch at 1500 Diamond Hill Road, branch established on 2003/09/03. Info updated 2011/07/21: Bank assets: $518.7 mil, Deposits: $462.0 mil, headquarters in Cranston, RI, positive income, Commercial Lending Specialization, 12 total offices
- Sovereign Bank, National Association: Social Street Branch at 411 Social Street, branch established on 1867/01/01. Info updated 2012/01/31: Bank assets: $78,146.9 mil, Deposits: $48,042.9 mil, headquarters in Wilmington, DE, positive income, Commercial Lending Specialization, 718 total offices, Holding Company: Banco Santander, S.A.
- Bank Rhode Island: Woonsocket Branch at 177-1193 Cumberland Hill Road, branch established on 1998/01/06. Info updated 2006/09/28: Bank assets: $1,581.1 mil, Deposits: $1,131.1 mil, headquarters in Providence, RI, positive income, Commercial Lending Specialization, 17 total offices, Holding Company: Bancorp Rhode Island, Inc.
For population 15 years and over in Woonsocket:
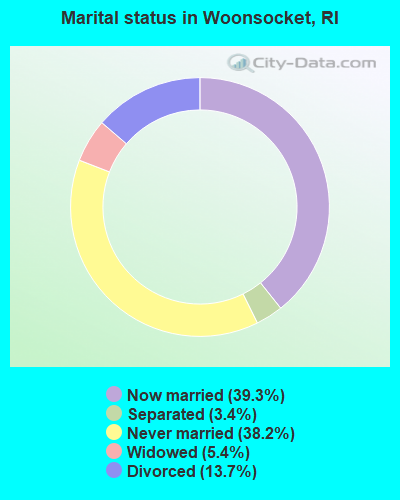
- Never married: 38.2%
- Now married: 39.3%
- Separated: 3.4%
- Widowed: 5.4%
- Divorced: 13.7%
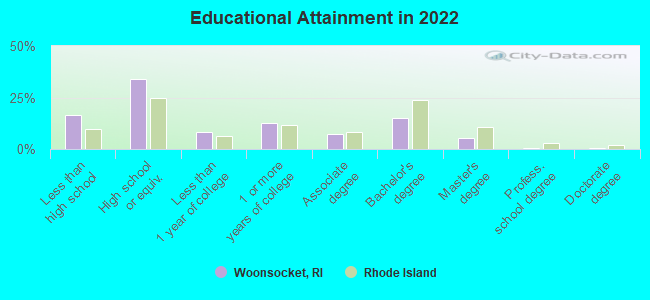
For population 25 years and over in Woonsocket:
- High school or higher: 82.8%
- Bachelor's degree or higher: 18.9%
- Graduate or professional degree: 5.8%
- Unemployed: 6.4%
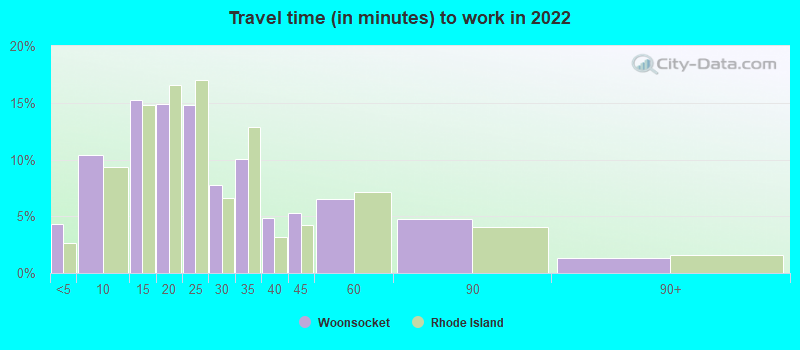
- Mean travel time to work (commute): 25.2 minutes
| Here: | 13.0 |
| Rhode Island average: | 12.8 |
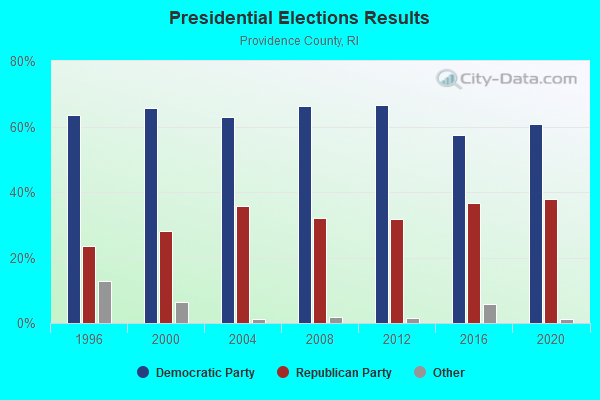
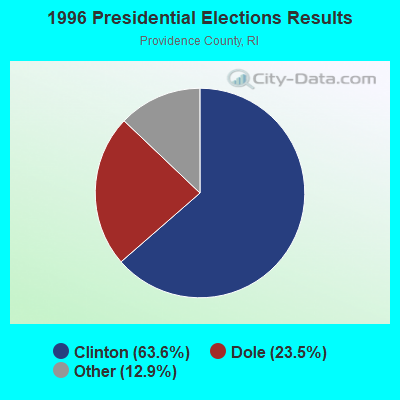
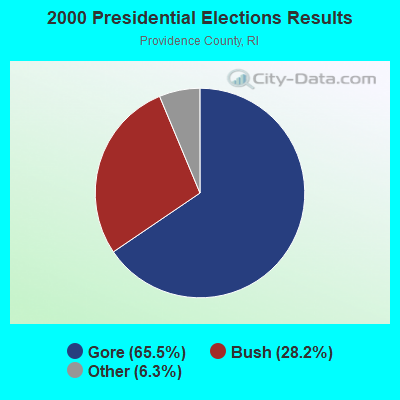
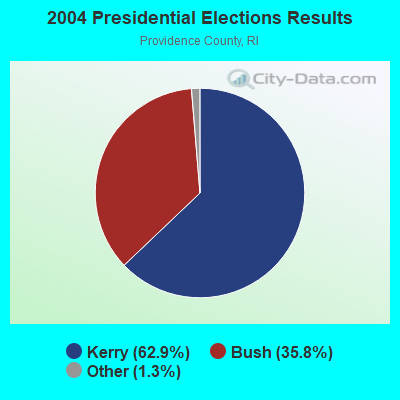
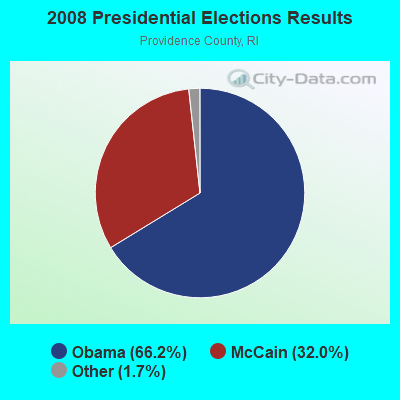
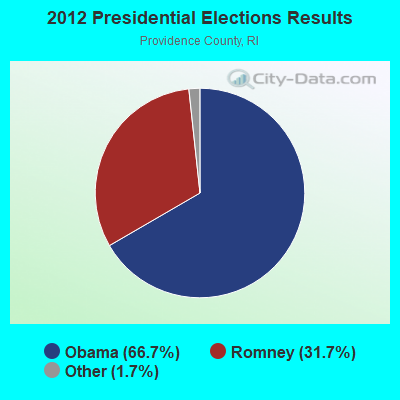
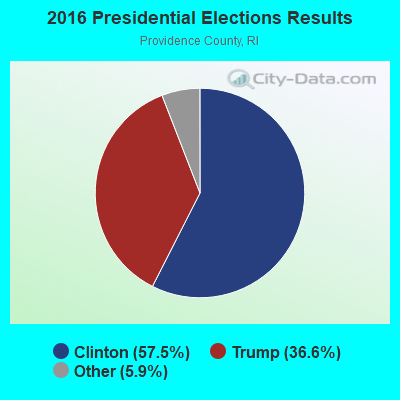
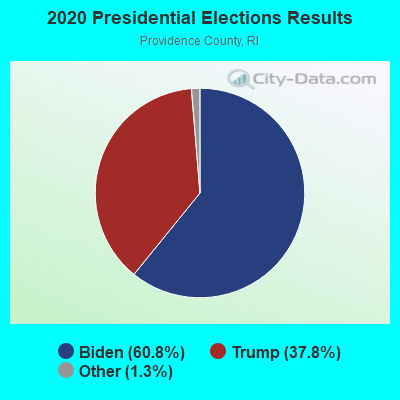
Graphs represent county-level data. Detailed 2008 Election Results
Religion statistics for Woonsocket, RI (based on Providence County data)
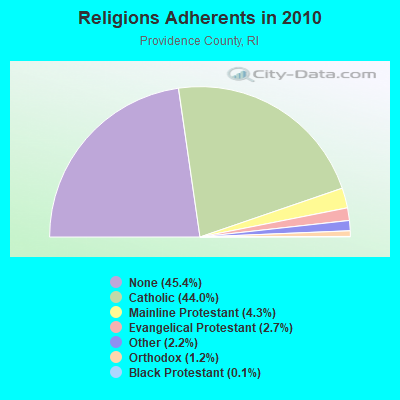
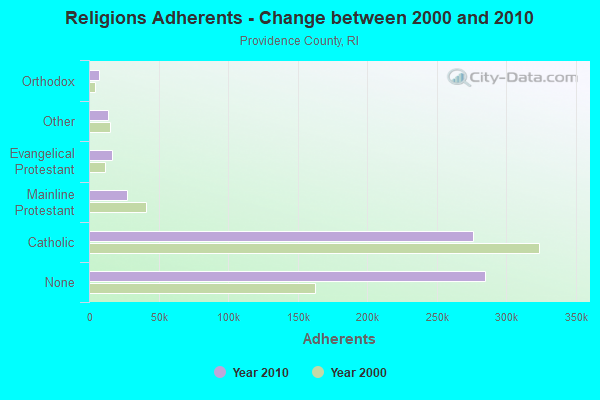
| Religion | Adherents | Congregations |
|---|---|---|
| Catholic | 276,011 | 98 |
| Mainline Protestant | 27,143 | 111 |
| Evangelical Protestant | 16,895 | 134 |
| Other | 13,896 | 48 |
| Orthodox | 7,325 | 10 |
| Black Protestant | 712 | 9 |
| None | 284,685 | - |
Food Environment Statistics:
| Providence County: | 2.06 / 10,000 pop. |
| Rhode Island: | 1.92 / 10,000 pop. |
| This county: | 0.02 / 10,000 pop. |
| Rhode Island: | 0.05 / 10,000 pop. |
| This county: | 1.50 / 10,000 pop. |
| State: | 1.42 / 10,000 pop. |
| Providence County: | 2.10 / 10,000 pop. |
| State: | 2.24 / 10,000 pop. |
| Providence County: | 7.96 / 10,000 pop. |
| Rhode Island: | 9.75 / 10,000 pop. |
| Providence County: | 8.1% |
| State: | 7.9% |
| This county: | 24.0% |
| Rhode Island: | 22.6% |
| Providence County: | 16.9% |
| State: | 16.3% |
Health and Nutrition:
| Woonsocket: | 48.6% |
| State: | 49.4% |
| Woonsocket: | 45.0% |
| State: | 46.7% |
| This city: | 28.6 |
| State: | 28.6 |
| Here: | 21.7% |
| State: | 21.3% |
| Woonsocket: | 11.8% |
| Rhode Island: | 10.8% |
| Woonsocket: | 6.8 |
| Rhode Island: | 6.8 |
| Woonsocket: | 33.1% |
| State: | 33.8% |
| Woonsocket: | 55.0% |
| Rhode Island: | 56.0% |
| This city: | 78.1% |
| Rhode Island: | 78.5% |
More about Health and Nutrition of Woonsocket, RI Residents
| Local government employment and payroll (March 2022) | |||||
| Function | Full-time employees | Monthly full-time payroll | Average yearly full-time wage | Part-time employees | Monthly part-time payroll |
|---|---|---|---|---|---|
| Elementary and Secondary - Instruction | 650 | $3,604,750 | $66,549 | 68 | $124,739 |
| Elementary and Secondary - Other Total | 124 | $996,825 | $96,467 | 65 | $41,801 |
| Firefighters | 112 | $613,979 | $65,783 | 0 | $0 |
| Police Protection - Officers | 97 | $616,964 | $76,325 | 0 | $0 |
| Streets and Highways | 37 | $164,192 | $53,251 | 1 | $664 |
| Water Supply | 20 | $94,105 | $56,463 | 0 | $0 |
| Police - Other | 20 | $84,048 | $50,429 | 3 | $4,577 |
| Financial Administration | 19 | $94,304 | $59,560 | 4 | $6,057 |
| Other and Unallocable | 16 | $67,250 | $50,438 | 3 | $3,772 |
| Local Libraries | 12 | $48,460 | $48,460 | 5 | $2,910 |
| Other Government Administration | 5 | $25,137 | $60,329 | 1 | $531 |
| Judicial and Legal | 4 | $22,373 | $67,119 | 3 | $1,240 |
| Housing and Community Development (Local) | 3 | $15,265 | $61,060 | 1 | $598 |
| Solid Waste Management | 3 | $13,680 | $54,720 | 0 | $0 |
| Welfare | 1 | $6,235 | $74,820 | 0 | $0 |
| Fire - Other | 1 | $4,105 | $49,260 | 0 | $0 |
| Parks and Recreation | 0 | $0 | 3 | $1,382 | |
| Totals for Government | 1,124 | $6,471,672 | $69,093 | 157 | $188,270 |
Woonsocket government finances - Expenditure in 2021 (per resident):
- Construction - Water Utilities: $11,236,000 ($261.66)
Regular Highways: $356,000 ($8.29)
Elementary and Secondary Education: $109,000 ($2.54)
Parks and Recreation: $58,000 ($1.35)
- Current Operations - Elementary and Secondary Education: $106,052,000 ($2469.66)
General - Other: $14,128,000 ($329.00)
Solid Waste Management: $10,652,000 ($248.06)
Police Protection: $9,936,000 ($231.38)
Local Fire Protection: $9,432,000 ($219.65)
Water Utilities: $6,403,000 ($149.11)
Sewerage: $4,508,000 ($104.98)
Regular Highways: $3,248,000 ($75.64)
Central Staff Services: $1,344,000 ($31.30)
Financial Administration: $1,166,000 ($27.15)
Libraries: $1,101,000 ($25.64)
Judicial and Legal Services: $426,000 ($9.92)
Public Welfare - Other: $338,000 ($7.87)
General Public Buildings: $269,000 ($6.26)
Parks and Recreation: $209,000 ($4.87)
Health - Other: $17,000 ($0.40)
- General - Interest on Debt: $7,641,000 ($177.94)
- Intergovernmental to Local - Other - Elementary and Secondary Education: $2,013,000 ($46.88)
- Intergovernmental to State - Elementary and Secondary Education: $7,000 ($0.16)
- Other Capital Outlay - Elementary and Secondary Education: $3,783,000 ($88.10)
Sewerage: $424,000 ($9.87)
Regular Highways: $380,000 ($8.85)
Water Utilities: $364,000 ($8.48)
Local Fire Protection: $324,000 ($7.55)
General Public Building: $214,000 ($4.98)
Police Protection: $211,000 ($4.91)
Solid Waste Management: $143,000 ($3.33)
Central Staff Services: $18,000 ($0.42)
Financial Administration: $16,000 ($0.37)
Libraries: $15,000 ($0.35)
General - Other: $4,000 ($0.09)
- Total Salaries and Wages: $51,172,000 ($1191.65)
- Water Utilities - Interest on Debt: $658,000 ($15.32)
Woonsocket government finances - Revenue in 2021 (per resident):
- Charges - Solid Waste Management: $9,399,000 ($218.88)
Sewerage: $8,428,000 ($196.26)
Other: $2,554,000 ($59.48)
Elementary and Secondary Education School Lunch: $1,746,000 ($40.66)
Elementary and Secondary Education - Other: $221,000 ($5.15)
- Federal Intergovernmental - Housing and Community Development: $937,000 ($21.82)
Other: $358,000 ($8.34)
Health and Hospitals: $65,000 ($1.51)
Education: $51,000 ($1.19)
- Local Intergovernmental - Education: $1,746,000 ($40.66)
- Miscellaneous - General Revenue - Other: $3,637,000 ($84.70)
Donations From Private Sources: $509,000 ($11.85)
Rents: $236,000 ($5.50)
Interest Earnings: $44,000 ($1.02)
- Revenue - Water Utilities: $9,297,000 ($216.50)
- State Intergovernmental - Education: $89,224,000 ($2077.78)
General Local Government Support: $3,840,000 ($89.42)
Other: $767,000 ($17.86)
Housing and Community Development: $540,000 ($12.58)
Health and Hospitals: $28,000 ($0.65)
- Tax - Property: $55,508,000 ($1292.63)
Occupation and Business License - Other: $1,568,000 ($36.51)
Other Selective Sales: $1,109,000 ($25.83)
Woonsocket government finances - Debt in 2021 (per resident):
- Long Term Debt - Beginning Outstanding - Unspecified Public Purpose: $122,674,000 ($2856.74)
Outstanding Unspecified Public Purpose: $115,009,000 ($2678.24)
Retired Unspecified Public Purpose: $7,665,000 ($178.50)
Woonsocket government finances - Cash and Securities in 2021 (per resident):
- Bond Funds - Cash and Securities: $1,146,000 ($26.69)
- Other Funds - Cash and Securities: $80,482,000 ($1874.20)
5.01% of this county's 2021 resident taxpayers lived in other counties in 2020 ($66,379 average adjusted gross income)
| Here: | 5.01% |
| Rhode Island average: | 5.99% |
0.03% of residents moved from foreign countries ($121 average AGI)
Providence County: 0.03% Rhode Island average: 0.03%
Top counties from which taxpayers relocated into this county between 2020 and 2021:
| from Kent County, RI | |
| from Bristol County, MA | |
| from Suffolk County, MA |
5.35% of this county's 2020 resident taxpayers moved to other counties in 2021 ($68,172 average adjusted gross income)
| Here: | 5.35% |
| Rhode Island average: | 5.97% |
0.01% of residents moved to foreign countries ($59 average AGI)
Providence County: 0.01% Rhode Island average: 0.02%
Top counties to which taxpayers relocated from this county between 2020 and 2021:
| to Kent County, RI | |
| to Bristol County, MA | |
| to Washington County, RI |
| Businesses in Woonsocket, RI | ||||
| Name | Count | Name | Count | |
|---|---|---|---|---|
| Applebee's | 1 | McDonald's | 1 | |
| AutoZone | 2 | Nike | 1 | |
| Burger King | 1 | Papa John's Pizza | 1 | |
| Burlington Coat Factory | 1 | Payless | 1 | |
| CVS | 2 | Pizza Hut | 1 | |
| Chevrolet | 1 | RadioShack | 1 | |
| ColorTyme | 1 | Rite Aid | 1 | |
| Domino's Pizza | 1 | Sears | 2 | |
| Dunkin Donuts | 5 | Shaw's | 1 | |
| Fashion Bug | 1 | Staples | 1 | |
| FedEx | 4 | Subway | 1 | |
| GNC | 2 | T-Mobile | 1 | |
| GameStop | 1 | Taco Bell | 1 | |
| H&R Block | 2 | True Value | 1 | |
| Holiday Inn | 1 | U-Haul | 2 | |
| KFC | 1 | UPS | 3 | |
| Lane Furniture | 2 | Walgreens | 1 | |
| Little Caesars Pizza | 1 | Walmart | 1 | |
| Lowe's | 1 | Wendy's | 1 | |
| MasterBrand Cabinets | 3 | YMCA | 1 | |
Strongest AM radio stations in Woonsocket:
- WALE (990 AM; 50 kW; GREENVILLE, RI; Owner: NORTH AMERICAN BROADCASTING CO., INC.)
- WNRI (1380 AM; 2 kW; WOONSOCKET, RI; Owner: ANASTOS MEDIA GROUP, INC.)
- WOON (1240 AM; 1 kW; WOONSOCKET, RI; Owner: O-N RADIO, INC.)
- WEEI (850 AM; 50 kW; BOSTON, MA; Owner: ENTERCOM BOSTON LICENSE, LLC)
- WKOX (1200 AM; 50 kW; FRAMINGHAM, MA; Owner: CAPSTAR TX LIMITED PARTNERSHIP)
- WDDZ (550 AM; 5 kW; PAWTUCKET, RI; Owner: ABC, INC.)
- WBIX (1060 AM; 40 kW; NATICK, MA; Owner: LANGER BROADCASTING CORPORATION)
- WAMG (890 AM; 25 kW; DEDHAM, MA; Owner: MEGA COMMUNICATIONS OF DEDHAM LICENSEE, LLC)
- WCRN (830 AM; 50 kW; WORCESTER, MA; Owner: CARTER BROADCASTING CORPORATION)
- WRNI (1290 AM; 10 kW; PROVIDENCE, RI; Owner: WRNI FOUNDATION)
- WRKO (680 AM; 50 kW; BOSTON, MA; Owner: ENTERCOM BOSTON LICENSE, LLC)
- WARL (1320 AM; 5 kW; ATTLEBORO, MA; Owner: THE ADD RADIO GROUP, INC.)
- WWZN (1510 AM; 50 kW; BOSTON, MA; Owner: ROSE CITY RADIO CORPORATION)
Strongest FM radio stations in Woonsocket:
- WWKX (106.3 FM; WOONSOCKET, RI; Owner: AAA ENTERTAINMENT LICENSING LLC)
- WWBB (101.5 FM; PROVIDENCE, RI; Owner: CLEAR CHANNEL BROADCASTING LICENSES, INC.)
- WSNE-FM (93.3 FM; TAUNTON, MA; Owner: CAPSTAR TX LIMITED PARTNERSHIP)
- WPRO-FM (92.3 FM; PROVIDENCE, RI; Owner: CITADEL BROADCASTING COMPANY)
- WBMX (98.5 FM; BOSTON, MA; Owner: INFINITY RADIO OPERATIONS INC.)
- WJMN (94.5 FM; BOSTON, MA; Owner: AMFM RADIO LICENSES, L.L.C.)
- WBOS (92.9 FM; BROOKLINE, MA; Owner: GREATER BOSTON RADIO, INC.)
- WWLI (105.1 FM; PROVIDENCE, RI; Owner: CITADEL BROADCASTING COMPANY)
- WCRB (102.5 FM; WALTHAM, MA; Owner: CHARLES RIVER BROADCASTING WCRB LICE)
- WTKK (96.9 FM; BOSTON, MA; Owner: GREATER BOSTON RADIO, INC.)
- WROR-FM (105.7 FM; FRAMINGHAM, MA; Owner: GREATER BOSTON RADIO, INC.)
- WBRU (95.5 FM; PROVIDENCE, RI; Owner: BROWN BROADCASTING SERVICE, INC.)
- WGBH (89.7 FM; BOSTON, MA; Owner: WGBH EDUCATIONAL FOUNDATION)
- WHJY (94.1 FM; PROVIDENCE, RI; Owner: CAPSTAR TX LIMITED PARTNERSHIP)
- WBUR-FM (90.9 FM; BOSTON, MA; Owner: TRUSTEES OF BOSTON UNIVERSITY)
- WAAF (107.3 FM; WORCESTER, MA; Owner: ENTERCOM BOSTON LICENSE, LLC)
- WJMF (88.7 FM; SMITHFIELD, RI; Owner: BRYANT COLLEGE OF BUSINESS ADMIN.)
- WGAO (88.3 FM; FRANKLIN, MA; Owner: DEAN COLLEGE)
- WODS (103.3 FM; BOSTON, MA; Owner: INFINITY BROADCASTING OPERATIONS, INC.)
- WXKS-FM (107.9 FM; MEDFORD, MA; Owner: AMFM RADIO LICENSES, L.L.C.)
TV broadcast stations around Woonsocket:
- WNAC-TV (Channel 64; PROVIDENCE, RI; Owner: WNAC, LLC)
- WPRI-TV (Channel 12; PROVIDENCE, RI; Owner: TVL BROADCASTING OF RHODE ISLAND, LLC)
- WJAR (Channel 10; PROVIDENCE, RI; Owner: OUTLET BROADCASTING, INC.)
- WCVB-TV (Channel 5; BOSTON, MA; Owner: WCVB HEARST-ARGYLE TV, INC.)
- WLNE-TV (Channel 6; NEW BEDFORD, MA; Owner: FREEDOM BROADCASTING OF SOUTHERN NEW ENGLAND, INC.)
- WGBH-TV (Channel 2; BOSTON, MA; Owner: WGBH EDUCATIONAL FOUNDATION)
- WSBE-TV (Channel 36; PROVIDENCE, RI; Owner: RHODE ISLAND PUBLIC TELECOM. AUTHORITY)
- WUNI (Channel 27; WORCESTER, MA; Owner: ENTRAVISION HOLDINGS, LLC)
- WMFP (Channel 62; LAWRENCE, MA; Owner: WSAH LICENSE, INC.)
- WHDH-TV (Channel 7; BOSTON, MA; Owner: WHDH-TV)
- WSBK-TV (Channel 38; BOSTON, MA; Owner: VIACOM INC.)
- WBZ-TV (Channel 4; BOSTON, MA; Owner: VIACOM INC.)
- WGBX-TV (Channel 44; BOSTON, MA; Owner: WGBH EDUCATIONAL FOUNDATION)
- WPXQ (Channel 69; BLOCK ISLAND, RI; Owner: OCEAN STATE TELEVISION, L.L.C.)
- WLVI-TV (Channel 56; CAMBRIDGE, MA; Owner: WLVI, INC.)
- WUTF (Channel 66; MARLBOROUGH, MA; Owner: TELEFUTURA BOSTON LLC)
- WFXT (Channel 25; BOSTON, MA; Owner: FOX TELEVISION STATIONS INC.)
- WWDP (Channel 46; NORWELL, MA; Owner: NORWELL TELEVISION, LLC)
- WRIW-LP (Channel 50; PROVIDENCE, RI; Owner: ZGS PROVIDENCE, INC.)
- W40BO (Channel 40; BOSTON, MA; Owner: PAXSON COMMUNICATIONS LPTV, INC.)
- WBPX (Channel 68; BOSTON, MA; Owner: PAXSON BOSTON-68 LICENSE, INC.)
- WYDN (Channel 48; WORCESTER, MA; Owner: EDUCATIONAL PUBLIC TV CORPORATION)
- WTMU-LP (Channel 32; BOSTON, MA; Owner: ZGS BOSTON, INC.)
- WCEA-LP (Channel 58; BOSTON, MA; Owner: CHANNEL 19 TV CORPORATION)
- WLWC (Channel 28; NEW BEDFORD, MA; Owner: C-28 FCC LICENSEE SUBSIDIARY, LLC)
- National Bridge Inventory (NBI) Statistics
- 22Number of bridges
- 262ft / 79.6mTotal length
- $72,193,000Total costs
- 151,913Total average daily traffic
- 5,428Total average daily truck traffic
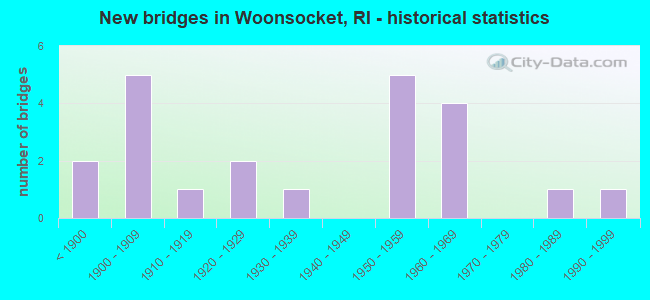
- New bridges - historical statistics
- 2Before 1900
- 51900-1909
- 11910-1919
- 21920-1929
- 11930-1939
- 51950-1959
- 41960-1969
- 11980-1989
- 11990-1999
FCC Registered Private Land Mobile Towers: 1 (See the full list of FCC Registered Private Land Mobile Towers in Woonsocket, RI)
FCC Registered Broadcast Land Mobile Towers: 23 (See the full list of FCC Registered Broadcast Land Mobile Towers)
FCC Registered Microwave Towers: 8 (See the full list of FCC Registered Microwave Towers in this town)
FCC Registered Paging Towers: 4 (See the full list of FCC Registered Paging Towers)
FCC Registered Amateur Radio Licenses: 105 (See the full list of FCC Registered Amateur Radio Licenses in Woonsocket)
FAA Registered Aircraft: 8 (See the full list of FAA Registered Aircraft in Woonsocket)
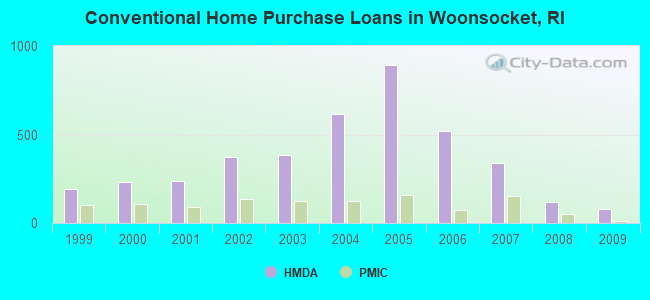
| Home Mortgage Disclosure Act Aggregated Statistics For Year 2009 (Based on 13 full tracts) | ||||||||||||||
| A) FHA, FSA/RHS & VA Home Purchase Loans | B) Conventional Home Purchase Loans | C) Refinancings | D) Home Improvement Loans | E) Loans on Dwellings For 5+ Families | F) Non-occupant Loans on < 5 Family Dwellings (A B C & D) | G) Loans On Manufactured Home Dwelling (A B C & D) | ||||||||
|---|---|---|---|---|---|---|---|---|---|---|---|---|---|---|
| Number | Average Value | Number | Average Value | Number | Average Value | Number | Average Value | Number | Average Value | Number | Average Value | Number | Average Value | |
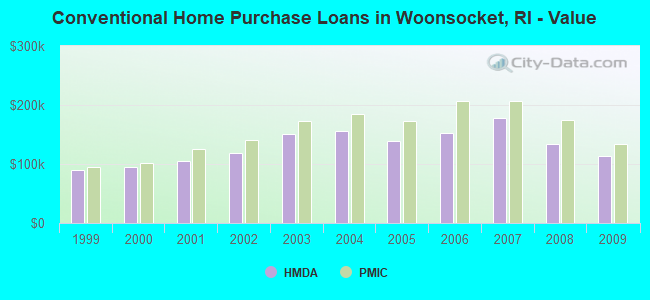
| LOANS ORIGINATED | 155 | $150,626 | 80 | $113,588 | 402 | $162,687 | 24 | $51,750 | 16 | $431,938 | 39 | $99,897 | 0 | $0 |
| APPLICATIONS APPROVED, NOT ACCEPTED | 14 | $131,143 | 12 | $106,000 | 31 | $154,484 | 4 | $21,250 | 0 | $0 | 7 | $81,143 | 0 | $0 |
| APPLICATIONS DENIED | 50 | $154,480 | 23 | $97,870 | 204 | $176,353 | 23 | $45,565 | 5 | $220,200 | 22 | $127,682 | 0 | $0 |
| APPLICATIONS WITHDRAWN | 18 | $148,278 | 19 | $115,526 | 94 | $176,766 | 4 | $70,750 | 1 | $68,000 | 9 | $127,111 | 0 | $0 |
| FILES CLOSED FOR INCOMPLETENESS | 5 | $148,400 | 10 | $107,700 | 44 | $171,114 | 3 | $91,333 | 1 | $70,000 | 5 | $81,400 | 1 | $60,000 |
Detailed mortgage data for all 13 tracts in Woonsocket, RI
| Private Mortgage Insurance Companies Aggregated Statistics For Year 2009 (Based on 9 full tracts) | ||||||
| A) Conventional Home Purchase Loans | B) Refinancings | C) Non-occupant Loans on < 5 Family Dwellings (A & B) | ||||
|---|---|---|---|---|---|---|
| Number | Average Value | Number | Average Value | Number | Average Value | |
| LOANS ORIGINATED | 12 | $133,500 | 8 | $240,250 | 1 | $168,000 |
| APPLICATIONS APPROVED, NOT ACCEPTED | 5 | $147,600 | 5 | $222,000 | 0 | $0 |
| APPLICATIONS DENIED | 4 | $157,000 | 1 | $222,000 | 0 | $0 |
| APPLICATIONS WITHDRAWN | 1 | $155,000 | 1 | $232,000 | 0 | $0 |
| FILES CLOSED FOR INCOMPLETENESS | 1 | $181,000 | 0 | $0 | 0 | $0 |
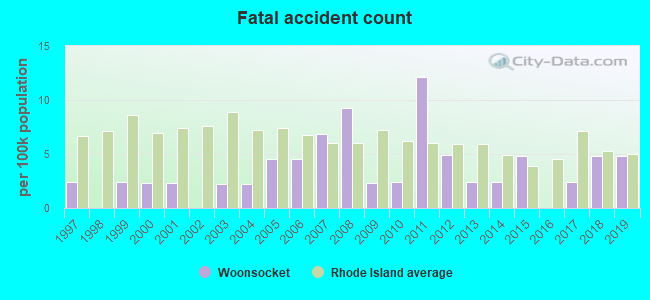
2008 - 2018 National Fire Incident Reporting System (NFIRS) incidents
- Fire incident types reported to NFIRS in Woonsocket, RI
- 90163.9%Structure Fires
- 33824.0%Outside Fires
- 1077.6%Mobile Property/Vehicle Fires
- 644.5%Other
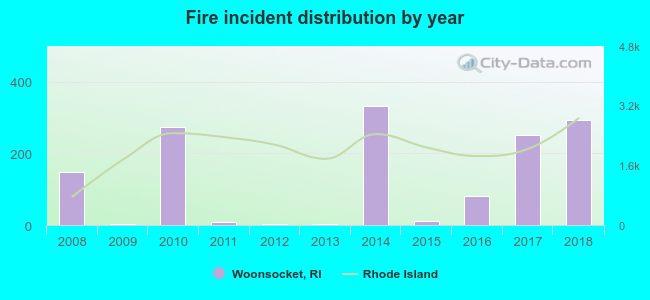 According to the data from the years 2008 - 2018 the average number of fires per year is 128. The highest number of reported fire incidents - 333 took place in 2014, and the least - 2 in 2009. The data has a growing trend.
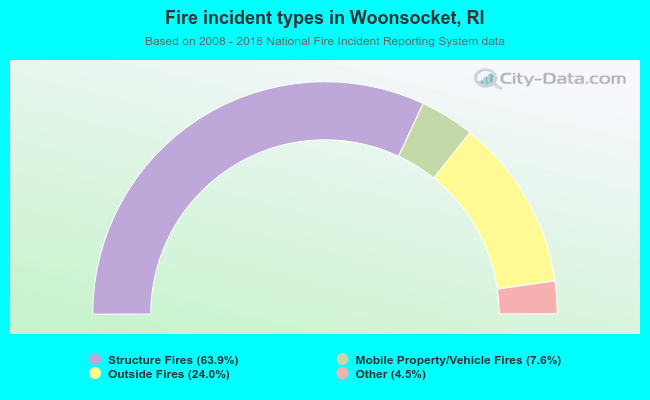 When looking into fire subcategories, the most incidents belonged to: Structure Fires (63.9%), and Outside Fires (24.0%).
Fire-safe hotels and motels in Woonsocket, Rhode Island:
- Woonsocket Motor Inn, 333 Clinton St, Woonsocket, Rhode Island 02895 , Phone: (401) 762-1224, Fax: (401) 785-5521
- Holiday Inn Express - Providence/Woonsocket, 194 Fortin Dr, Woonsocket, Rhode Island 02895 , Phone: (401) 769-5000, Fax: (401) 356-0880
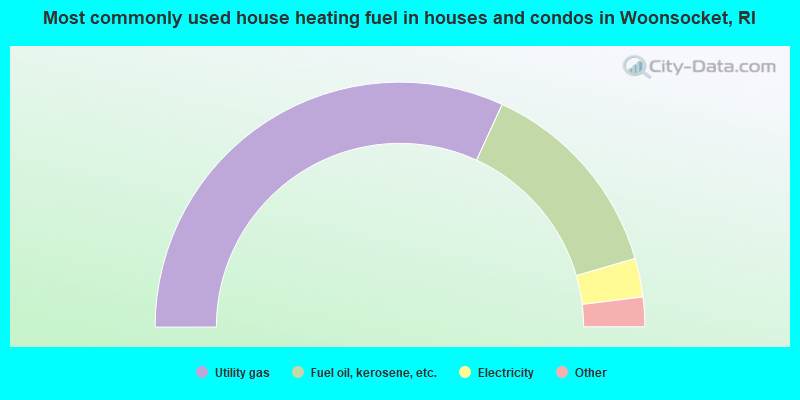
- 63.7%Utility gas
- 27.3%Fuel oil, kerosene, etc.
- 5.1%Electricity
- 2.6%Bottled, tank, or LP gas
- 1.0%Other fuel
- 0.3%Wood
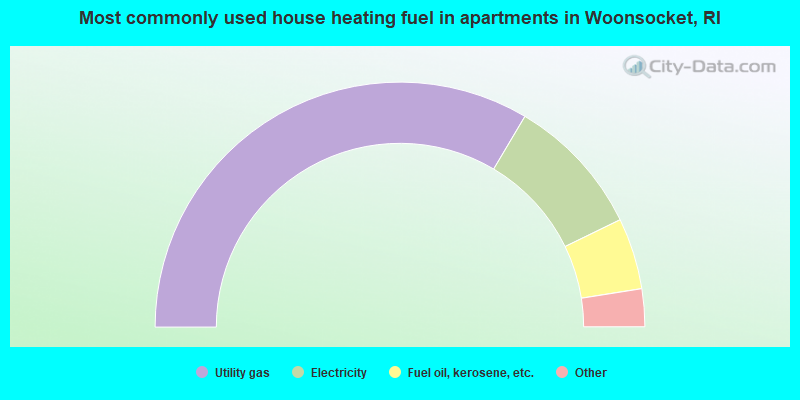
- 67.0%Utility gas
- 18.5%Electricity
- 9.4%Fuel oil, kerosene, etc.
- 3.7%Bottled, tank, or LP gas
- 0.7%No fuel used
- 0.5%Other fuel
- 0.1%Solar energy
Woonsocket compared to Rhode Island state average:
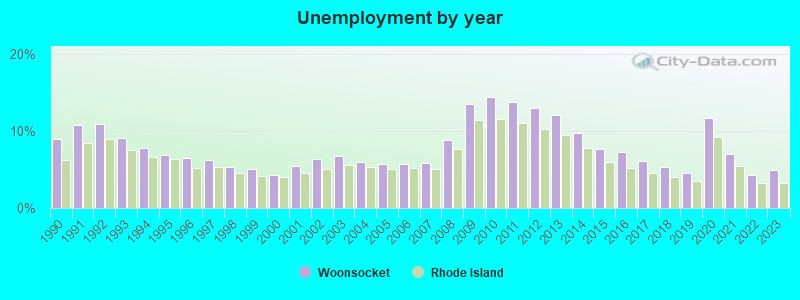
- Unemployed percentage below state average.
- Median age below state average.
- Renting percentage above state average.
- Length of stay since moving in above state average.
Woonsocket on our top lists:
- #36 on the list of "Top 101 cities with the biggest local government total salary and wages expenses per resident (population 10,000+)"
- #76 on the list of "Top 101 cities with the most residents born in Laos (population 500+)"
- #92 on the list of "Top 101 cities with the most residents born in Other Western Africa (population 500+)"
- #32 (02895) on the list of "Top 101 zip codes with the largest percentage of French Canadian first ancestries (pop 5,000+)"
- #58 (02895) on the list of "Top 101 zip codes with the largest percentage of French first ancestries (pop 5,000+)"
- #17 on the list of "Top 101 counties with highest percentage of residents voting for Obama (Democrat) in the 2012 Presidential Election"
- #18 on the list of "Top 101 counties with the lowest percentage of residents that keep firearms around their homes"
- #20 on the list of "Top 101 counties with the most Catholic congregations"
- #38 on the list of "Top 101 counties with the most Orthodox adherents"
- #46 on the list of "Top 101 counties with the most Catholic adherents"

|
|
Total of 118 patent applications in 2008-2024.